1. Summary
Traffic sign detection and classification is one of the big challenges in Autonomous Driving and Advanced Driver Assistance Systems (ADAS). Current approaches are based on Machine Learning, in particular Deep Neural Networks, and therefore require large, diverse and curated data sets on which the prediction models can be trained. Although in recent years the number of such data sets has been growing steadily, many aspects of the wide variety of traffic sign classes and design variations are not yet sufficiently covered. This, in particular, includes country-specific phenomena, such as traffic sign classes that exist only in one single country, or subtle differences in the pictogram design that may have a considerable impact on automated recognition systems [
1].
In this paper, we present a new data set, the
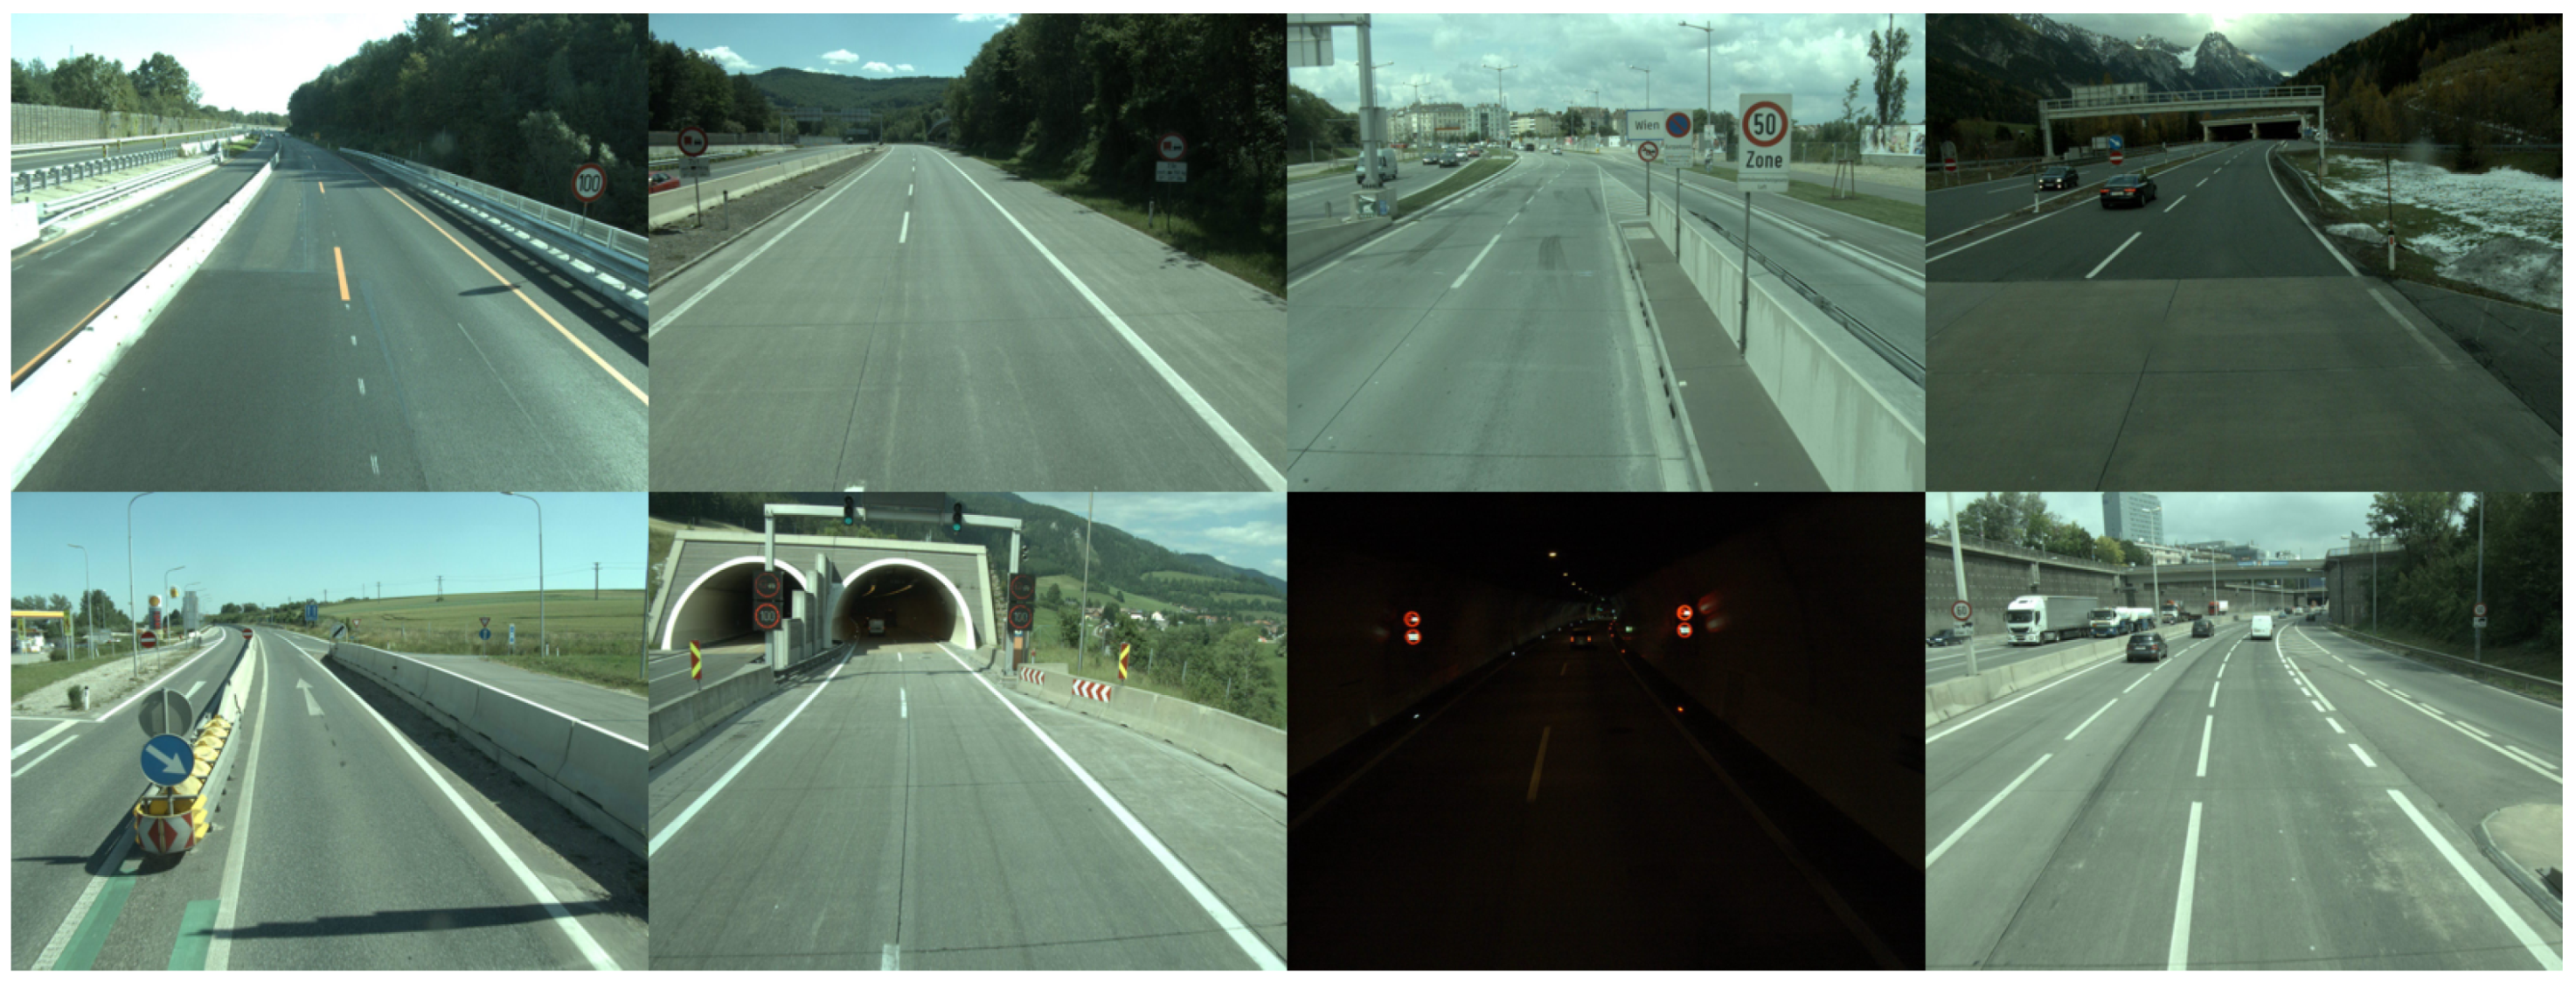
Austrian Highway Traffic Sign Data Set (ATSD), composed of annotated images of traffic scenes of Austrian highways, as well as labeled traffic-sign patches. It is the first Austrian data set of this kind, and as such fills some gaps in the current landscape of traffic sign/scene data sets as outlined above. For instance, in contrast to most other data sets it contains many images acquired in tunnels, where traffic signs are typically displayed on LED panels. It furthermore includes Austrian specialties, such as the ‘IG-L’ additional panel, which marks speed limits that are activated and deactivated depending on the current air quality. Although all traffic scenes stem from highways, they are still pretty diverse thanks to the fact that almost all highway segments (and traffic signs therein) in Austria are covered. Examples can be found in
Figure 1.
Every traffic sign in ATSD was annotated manually, to avoid all kinds of automation bias. Annotations do not only capture the position of signs within scene images and the classes they belong to, but also metadata such as the type of the signs (plate/LED/…), whether they are damaged, whether they are located in tunnels, and many more. Whenever several signs are semantically associated (such as additional panels and the corresponding ‘main’ signs they refer to), each of them was annotated separately and assigned a group-ID for making the association explicit.
The ultimate goal of ATSD is to stimulate research in traffic sign recognition. To that end, we evaluated state-of-the-art detectors and classifiers on the data set and report their performance in the paper, setting a baseline for future experiments. Moreover, about 20% of the data are completely held back in an internal test set, thereby allowing us to rigorously and independently assess the quality of traffic sign recognition systems developed on (the published part of) ATSD or other data bases. We report baseline model performance on the internal test set as reference marks, but remark that these results are not reproducible. A similar strategy of holding back data is pursued in related data sets, too [
2]. To facilitate working with ATSD it adheres to the FAIR data principles [
3]: every version of the data set has its own persistent Digital Object Identifier (DOI) that links to a landing page where the corresponding version of the data set can be downloaded. Furthermore, Python code for loading, preparing and augmenting the data is provided in a GitHub repository (
https://github.com/risc-mi/atsd; accessed on 4 December 2022), and so are the baseline detection and classification models.
Systems based on artificial intelligence, such as ADAS, are only accepted by the general public if they are trustworthy. This entails the need for transparency in the data sets these systems are based on. ATSD was created in close cooperation with experts in ethics, to ensure a concise and thorough documentation of all aspects of the data set. This not only concerns the decision which traffic sign classes to include or exclude, and for what reasons, but also the disclosure of weaknesses and limitations inherent to the data.
The main contributions of this paper and the underlying data set can be summarized as follows:
First-ever publicly available data set of annotated traffic scene images from Austrian highways;
Diverse scenery and traffic signs, including tunnels, temporary signs at construction sites, etc.;
Large number of additional panels, which add extra complexity to detection and classification tasks;
Rich meta information about each annotation;
Evaluations of state-of-the-art detection and classification models to set strong baselines for future developments.
2. Data Description
ATSD consists of two parts: (i) ATSD-Scenes, containing 7454 traffic scene images, and (ii) ATSD-Signs, containing 20,683 traffic sign image patches extracted from ATSD-Scenes. All images are saved in the widespread JPEG format. In addition, metadata are contained in tables stored as CSV files. Therefore, all data can easily be opened without the need for special software.
2.1. Annotations
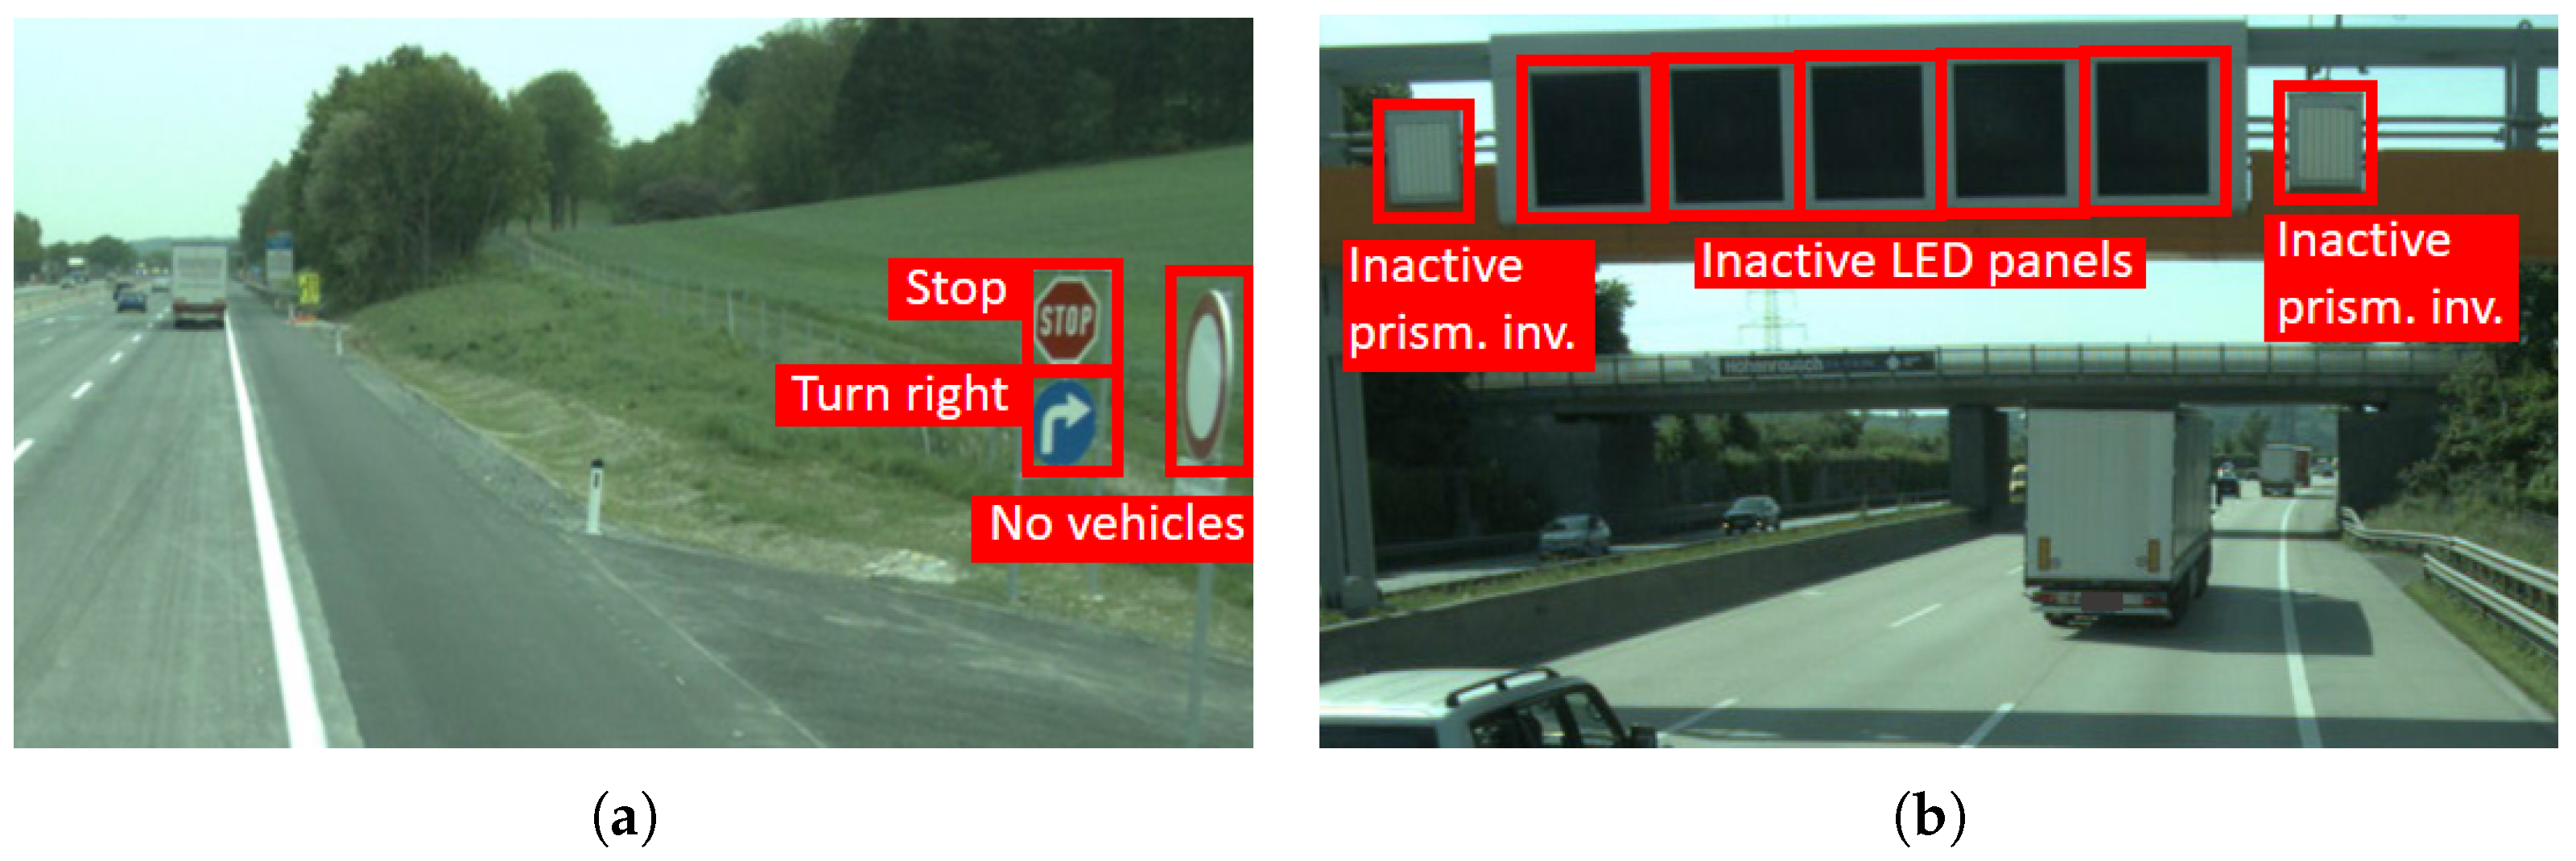
Each traffic scene image in ATSD is annotated with the exact location and size, class and further metadata of all traffic signs visible in it, regardless of their applicability to the main (highway) road. This is the reason why the data set contains traffic sign classes such as ‘Stop’ that can normally not be found on highways (
Figure 2a). Furthermore, included are inactive LED panels and prismatic inverters, although they do not constitute any ‘traffic sign’ in the usual sense (
Figure 2b). Direction signs and road-specific signs (displaying street names/numbers, for instance) are excluded.
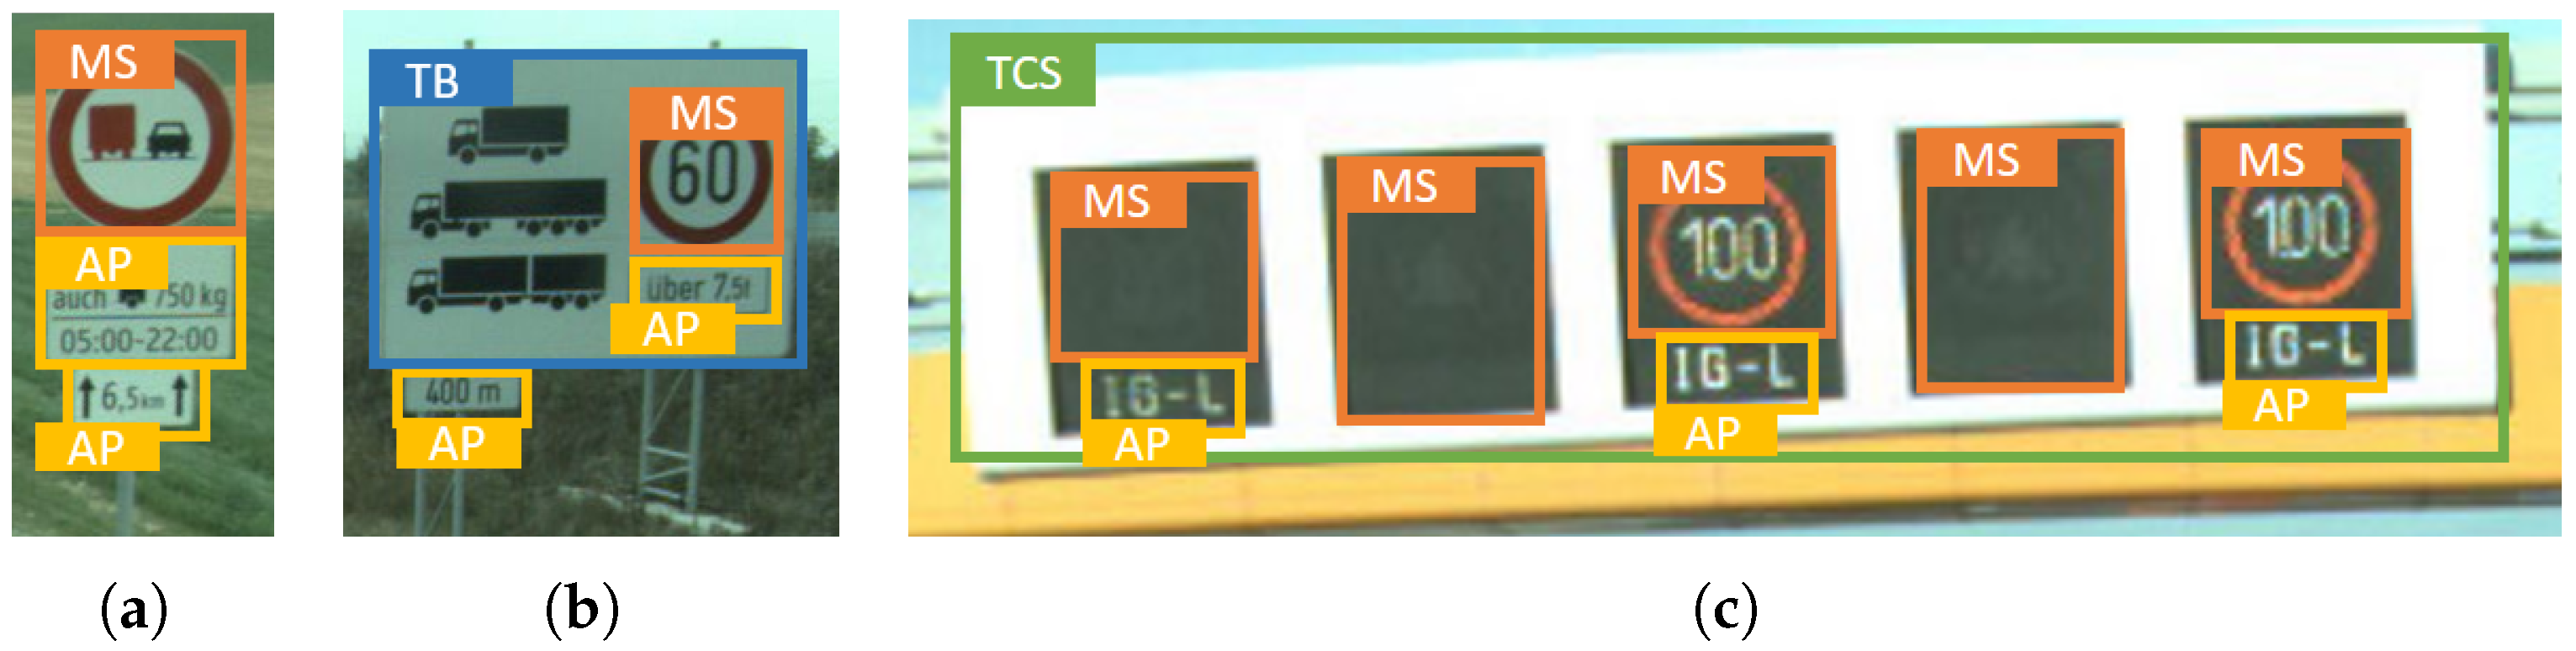
In general, there are four main sorts of traffic signs:
main traffic signs (MS),
additional panels (or
additional information) (AP),
traffic boards (TB) and
traffic control systems (TCS); see
Figure 3 for an overview and clarification of the terminology. The generic notion
traffic sign (TS) is used as an umbrella term that applies to each of these sorts. Traffic boards and traffic control systems contain other traffic signs (usually main traffic signs and additional information) as sub-elements, whereas additional panels are typically mounted below the traffic sign they refer to. All four sorts are annotated, with information about which groups of traffic signs semantically belong together (e.g., a main traffic sign and an additional panel, or a traffic board and its sub-elements).
Every annotation has a vast amount of metadata attached to it. This includes the position of the TS in the image by means of a tight
bounding box (as can be seen on in
Figure 2 and
Figure 3, for instance), the aforementioned grouping information, and of course the
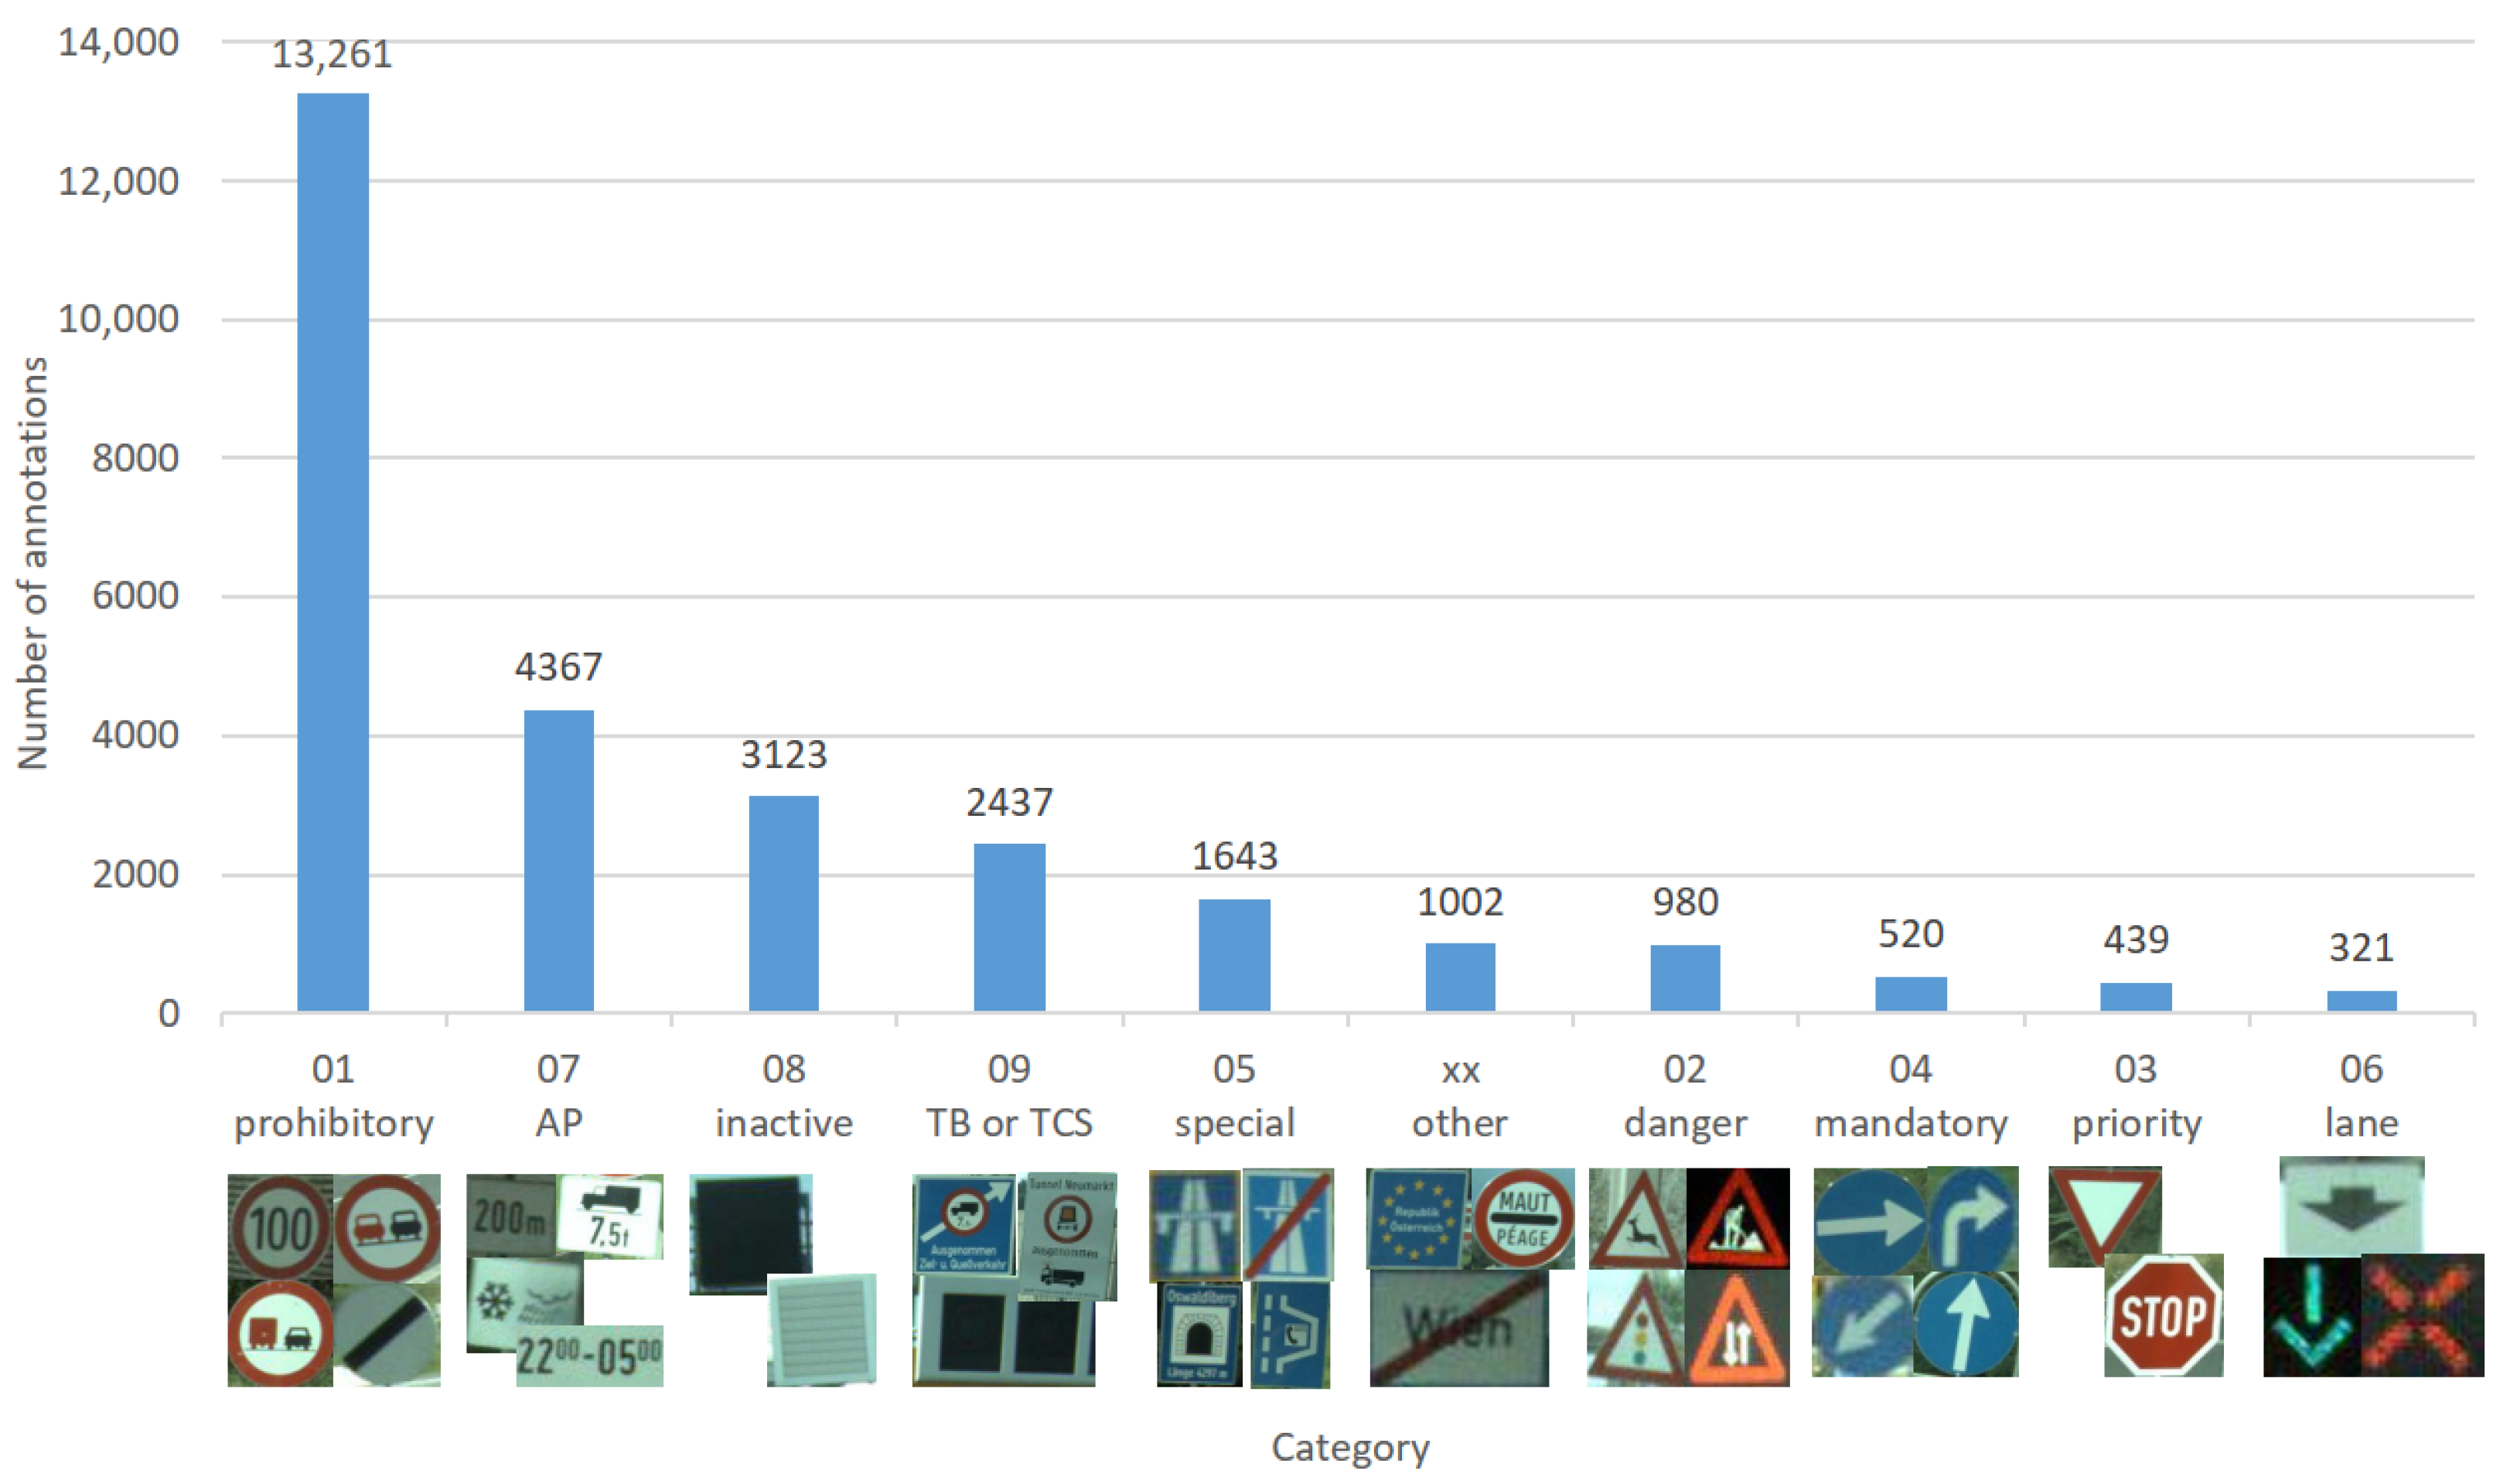
category and
class of the traffic sign (e.g., ‘Stop’ or ‘Speed limit: 100 km/h’;
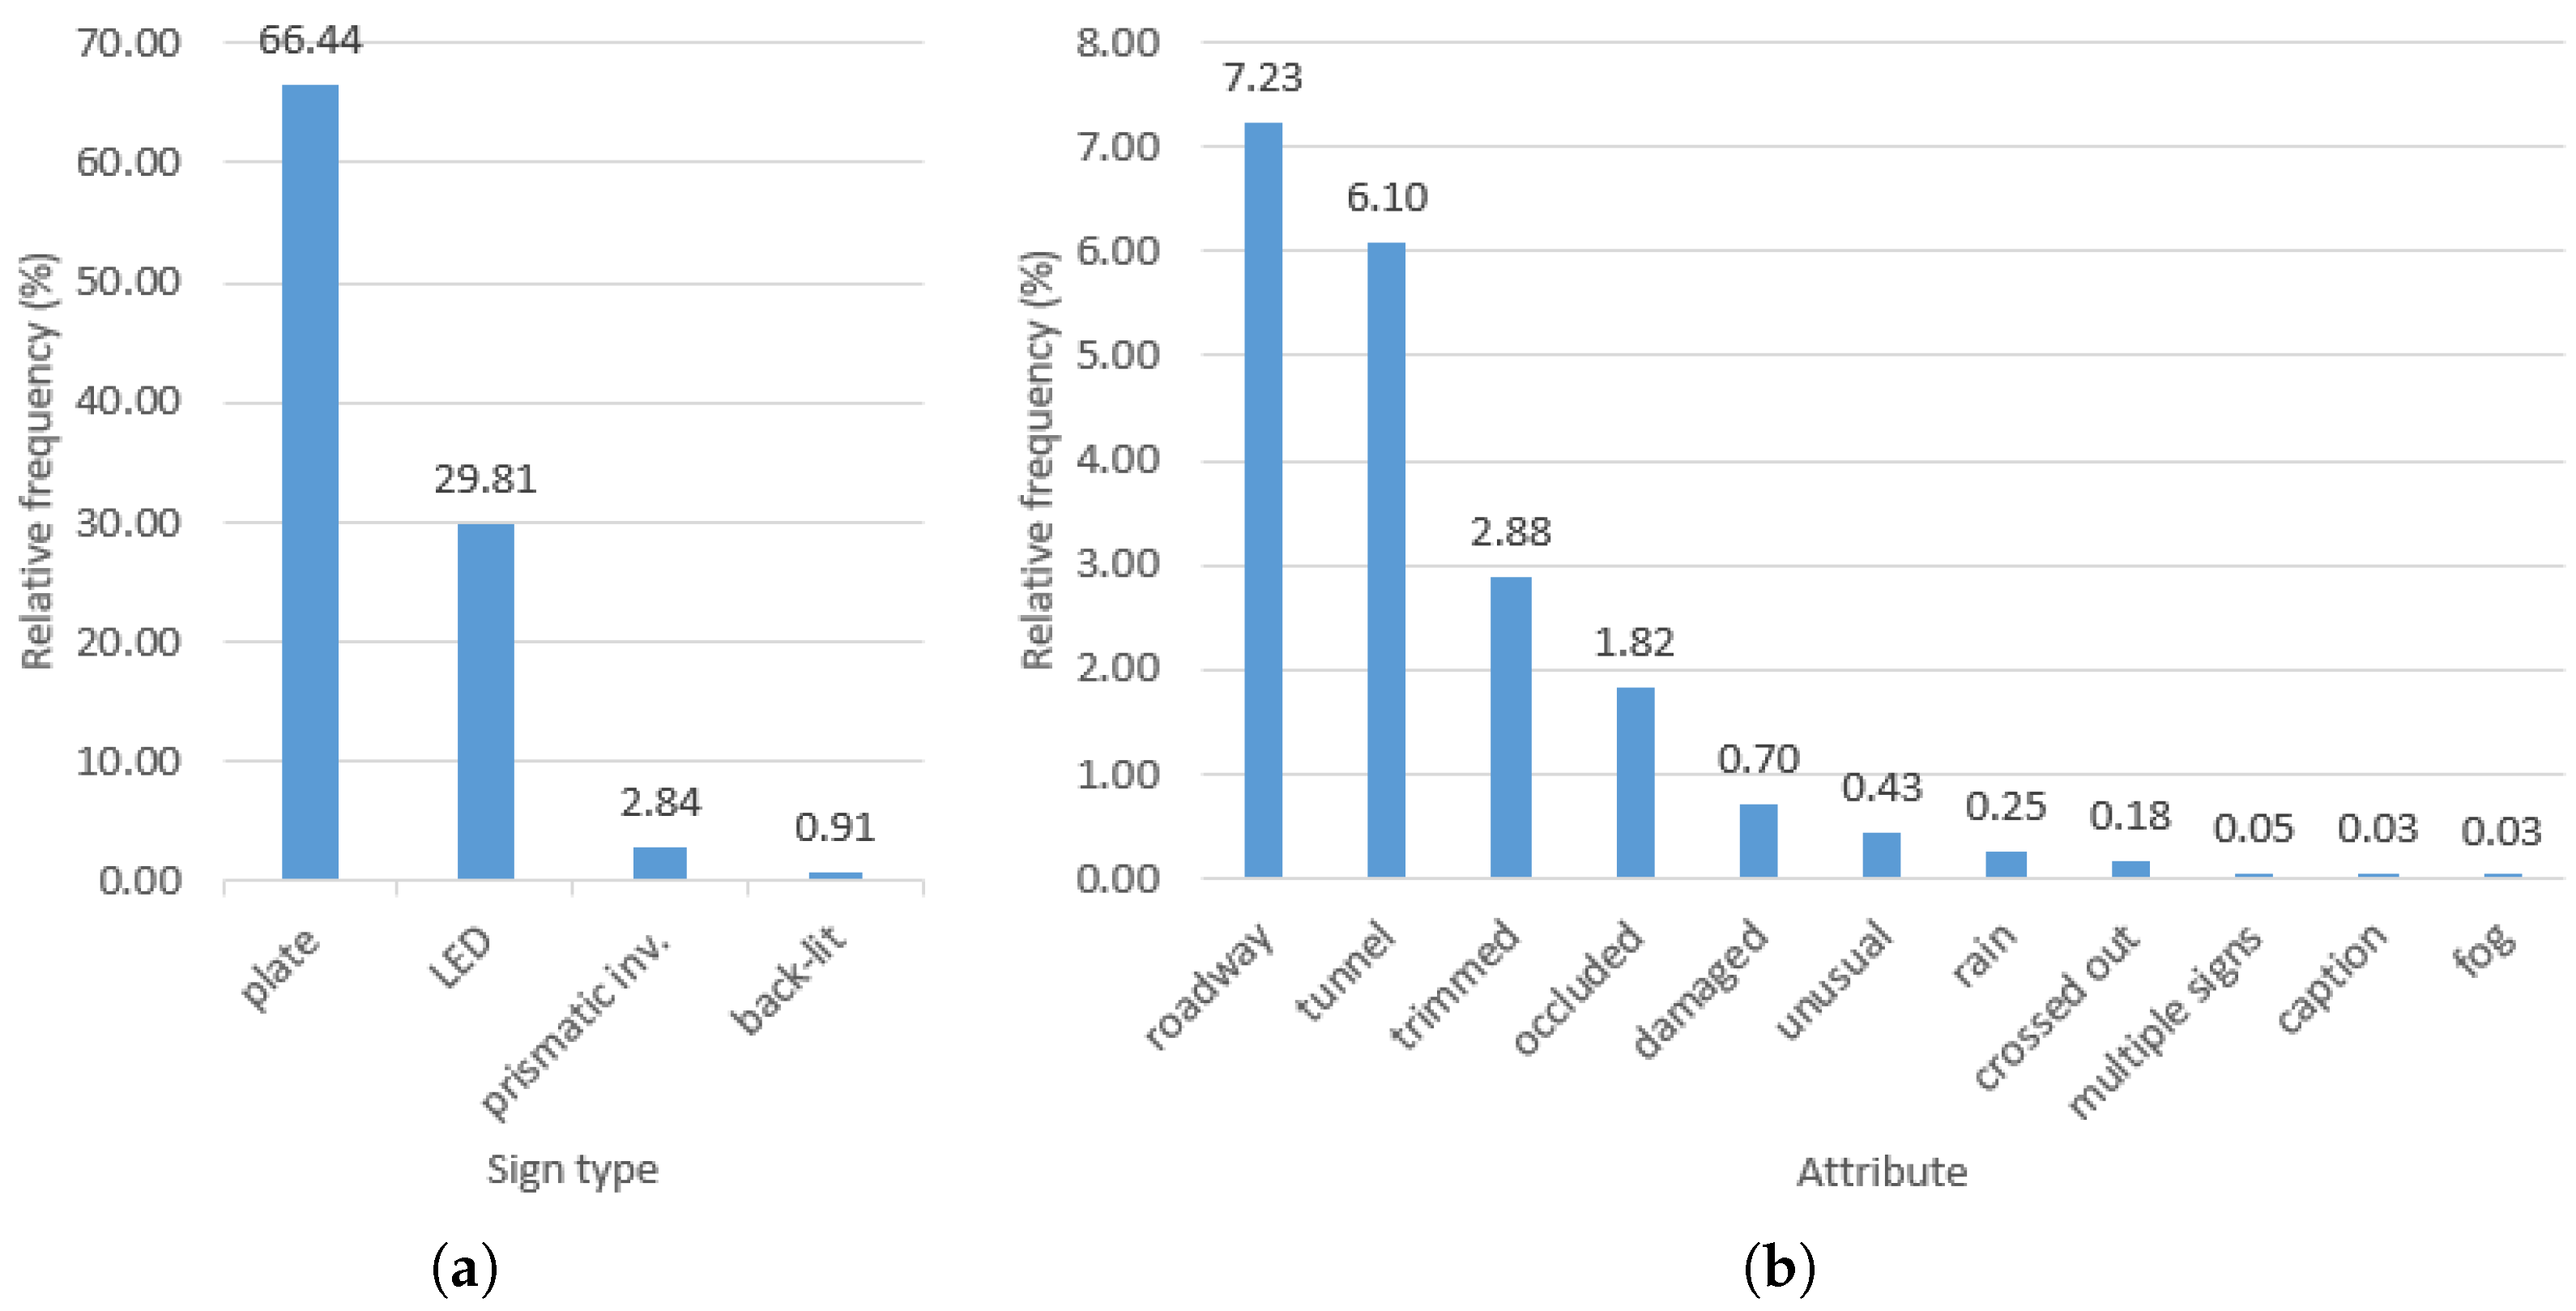
Figure 4). APs and TBs/TCSs have their own categories, so they can easily be distinguished from MSs. Annotations of MSs and APs furthermore contain information about the
type (material) of the sign (plate, LED panel, prismatic inverter, back-lit;
Figure 5a), and whether any one of eleven binary attributes is set (
Figure 6 and
Figure 5b).
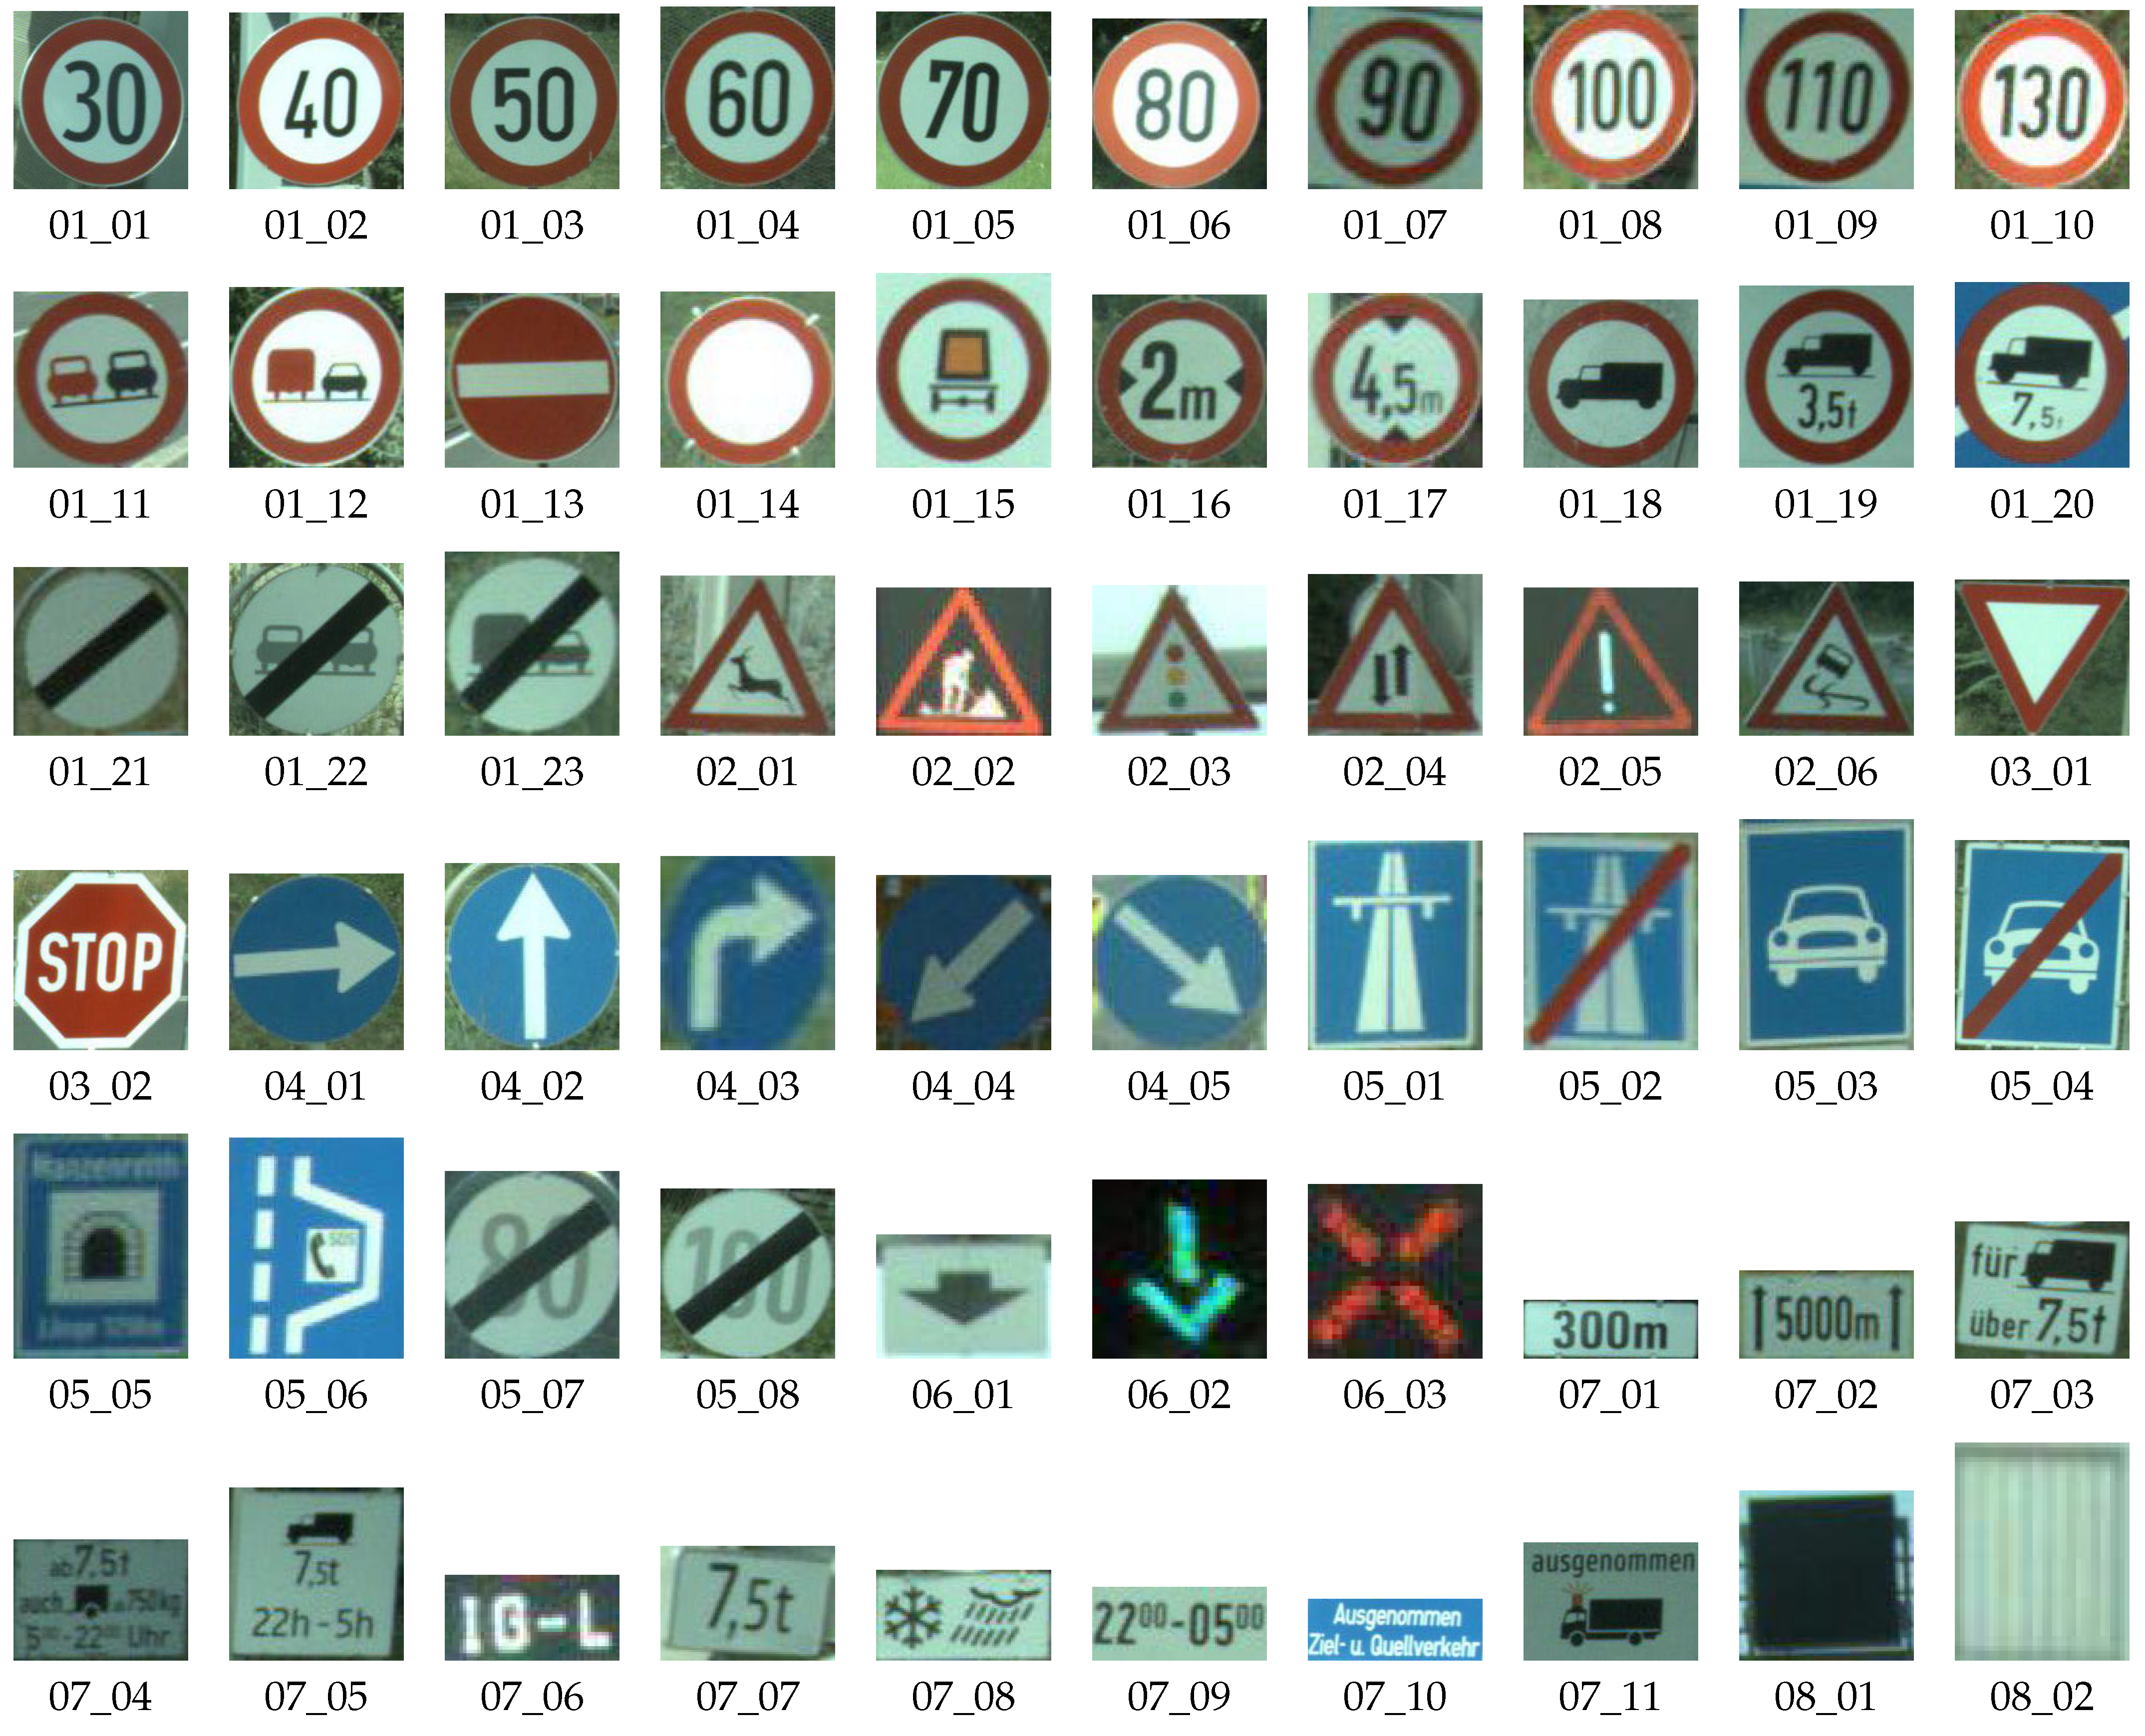
Every TS category is further subdivided into individual classes. In total, there are 108 distinct TS classes, including ‘other’, ‘not recognizable’ and TBs/TCSs. Excluding these ‘improper’ classes leaves 91 proper traffic sign classes. Some of them are very uniform, e.g., all ‘Speed limit: 100 km/h’ look more or less the same (disregarding perspective and lighting). Others, in particular some APs, exhibit a large intra-class variability.
2.2. Train, Test and Internal Sets
ATSD is split into a training, test and internal sets, the first two of which are publicly available. The split respects the geographic proximity of traffic scene images by putting all images of the same highway segment into the same subset. This avoids data leakage from the test into the training set, since otherwise images showing roughly the same scene (but from slightly different viewpoints or angles) could end up in different sets.
The splits were carefully created manually based on the following considerations: (i) the training set should encompass roughly of all data, the test set about , and the internal set about ; (ii) the relative frequency of the TS classes should be similar across the three sets; and (iii) the relative frequency of certain attributes, most notably ‘tunnel’, should also be similar. Due to the construction of the splits based on highway segments rather than individual images not all goals could be achieved equally well. In particular, this means that some classes may be under- or over-represented in one of the sets, and that some variants of a class (sign type, design, etc.) may only appear in one set (typically because they can only be found in one particular highway segment). The latter point is crucial, since it implies that detection and classification systems either cannot be trained on some TS variants, or cannot be tested on them. One concrete example is the ‘Speed limit: 40 km/h’ class, all LED-versions of which appear in the test set only. Without going into details, analogous issues are present in the internal set as well, but fortunately there are not too many of them.
2.3. ATSD-Scenes
ATSD-Scenes consists of 7454 traffic scene images together with the corresponding TS annotations as described in
Section 2.1. Every image is a high-resolution RGB image with
pixels, as depicted in
Figure 1. The training set contains 4068 images, the test set contains 1443 images and the internal set contains 1943 images.
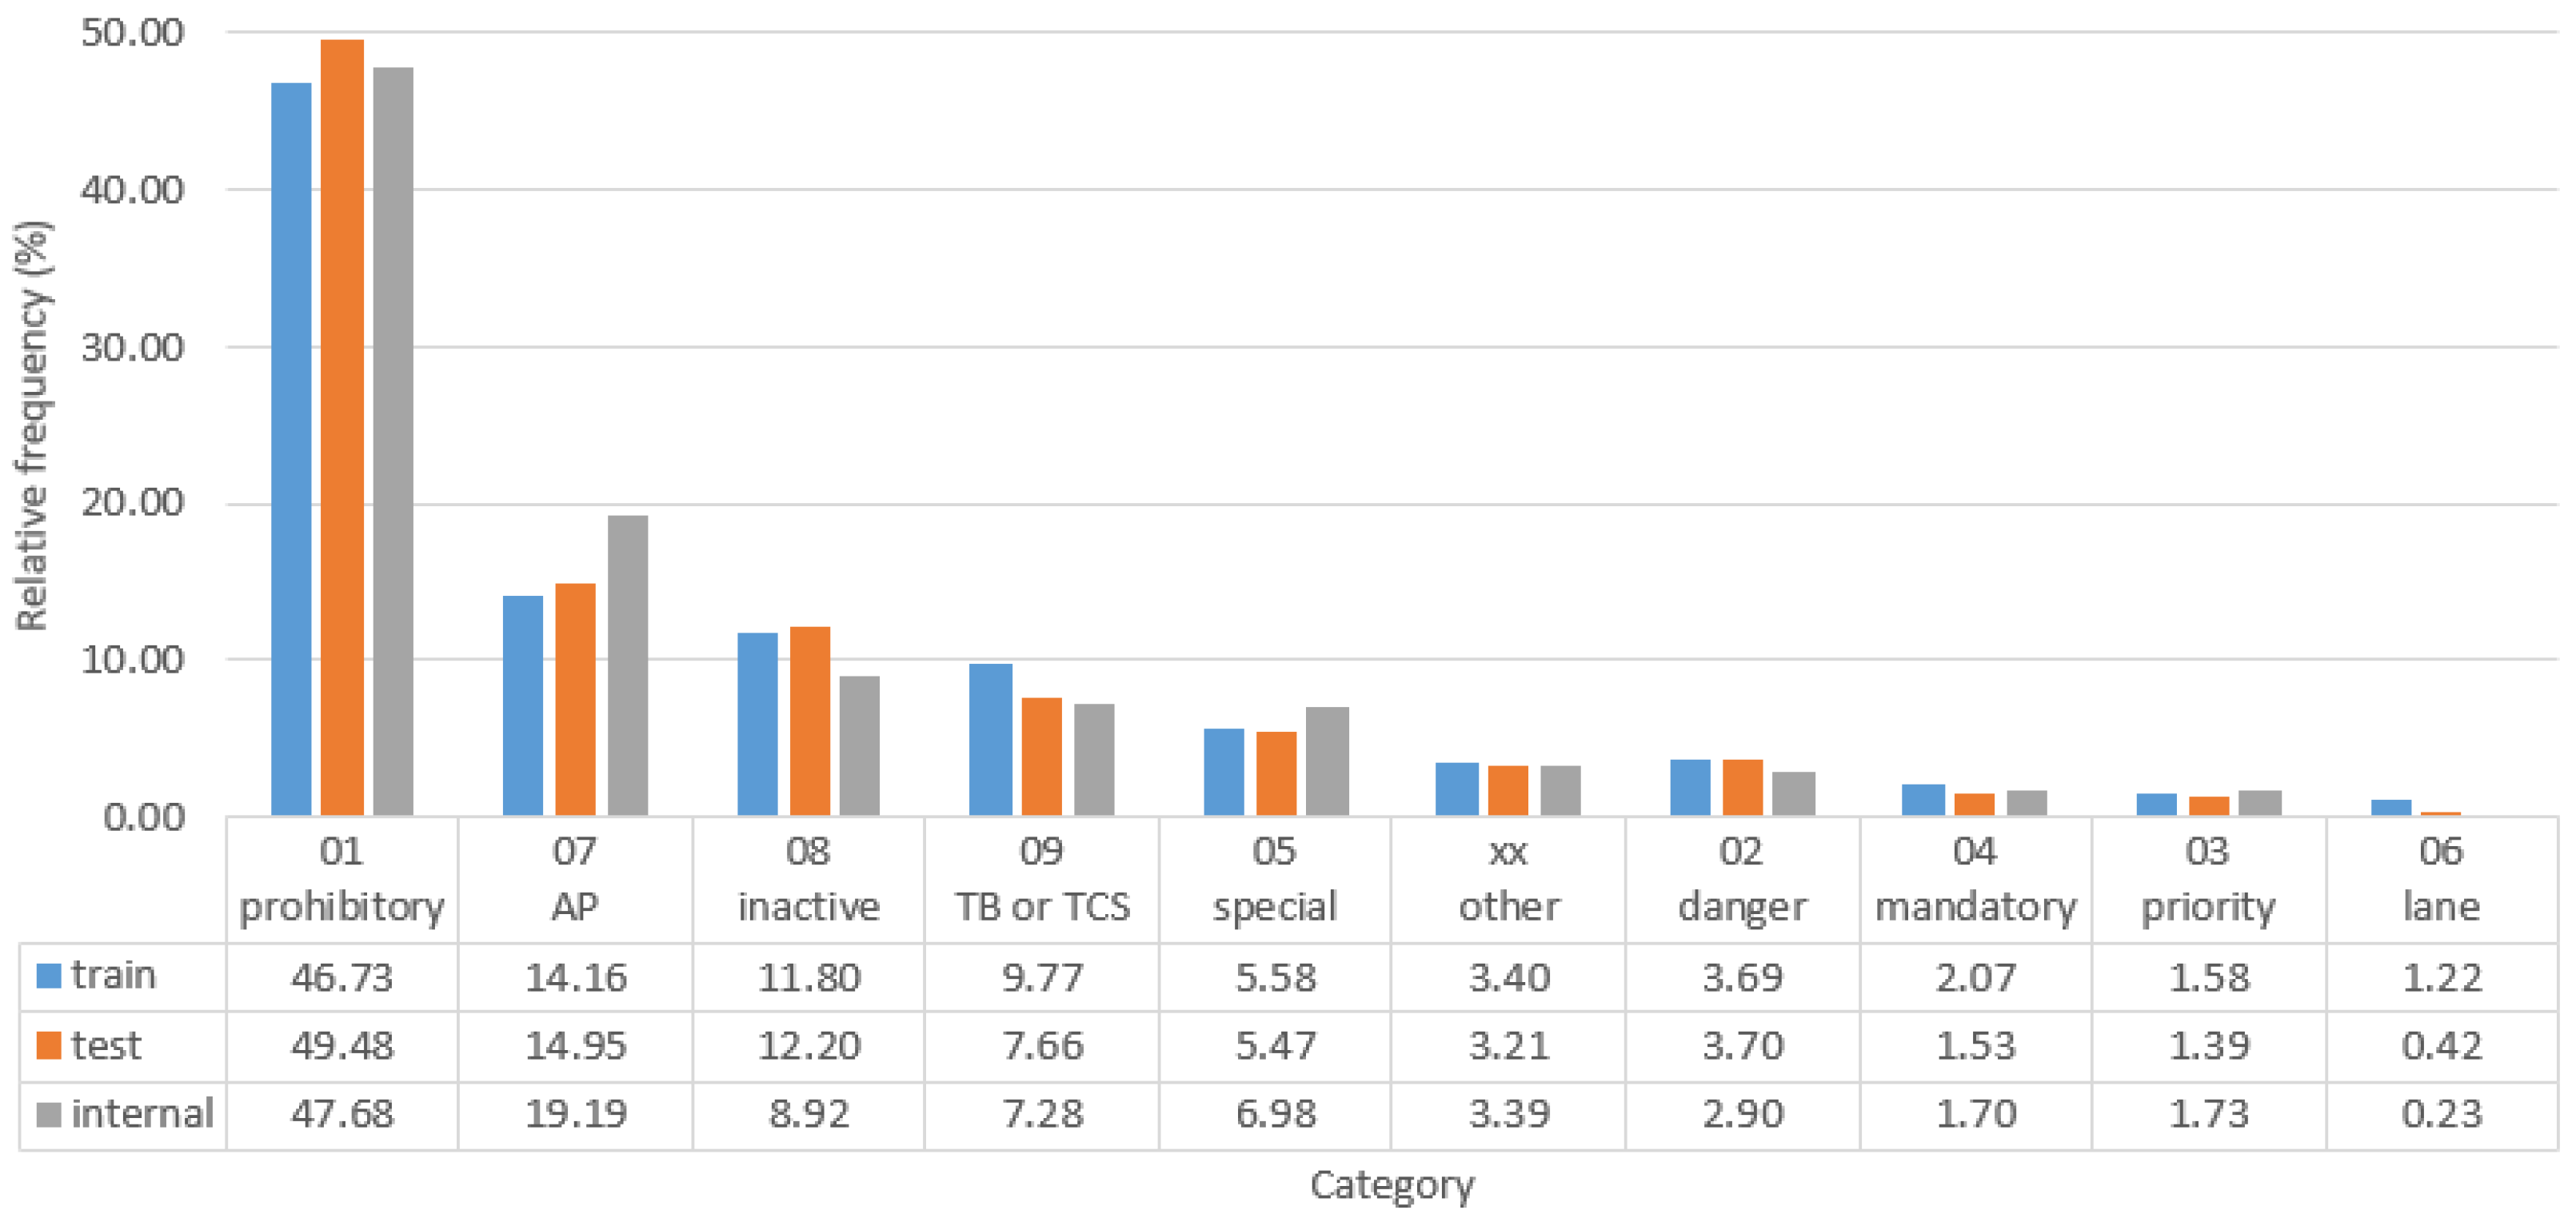
Table 2 summarizes the three sets. As can be seen, there are only a few images without any TS annotations.
Figure 7 depicts the relative frequency of each TS category in the three sets. It can be seen that all categories are distributed more or less evenly across the sets, with minor deviations only in categories 07, 08, 09, 05 and 06.
2.4. ATSD-Signs
ATSD-Signs consists of 20,683 traffic sign images extracted from the 7454 traffic scene images in ATSD-Scenes and 101 extra scene images not included in ATSD-Scenes. Of the 91 proper TS classes (excluding ‘other’, ‘not recognizable’, TBs and TCSs) only the 60 most frequent and most important ones were selected for inclusion in the data set, which explains the considerable drop from 27,521 annotations to only 20,683 images. Furthermore, only those TS not marked as ‘crossed out’, ‘unusual’, ‘multiple signs’ or ‘caption’ were considered, which reduced the number of images slightly further by 89 instances. Every traffic sign image is contained in the same set as the scene image it was extracted from, leading to 11,056 images in the training set, 4310 in the test set and 5317 in the internal set (
Table 3).
A traffic sign class is included if at least 35 instances appear in the combined training and test set (52 classes), or if it is deemed particularly important (8 further classes). There is no deeper reason behind the value ‘35’ of the threshold, except that it ensures that sufficiently many instances appear in the training-, test- and internal sets. More concretely, the minimum number of instances per class is seven in the training set, three in the test set and two in the internal set. Every class has a unique identifier consisting of the two-character category string (see
Figure 4) and another two-character class string, separated by an underscore.
Figure 8 shows one example of every class. As can be seen, inactivate LED panels and prismatic inverters are included as well, although they strictly speaking do not constitute any ‘real’ traffic sign classes.
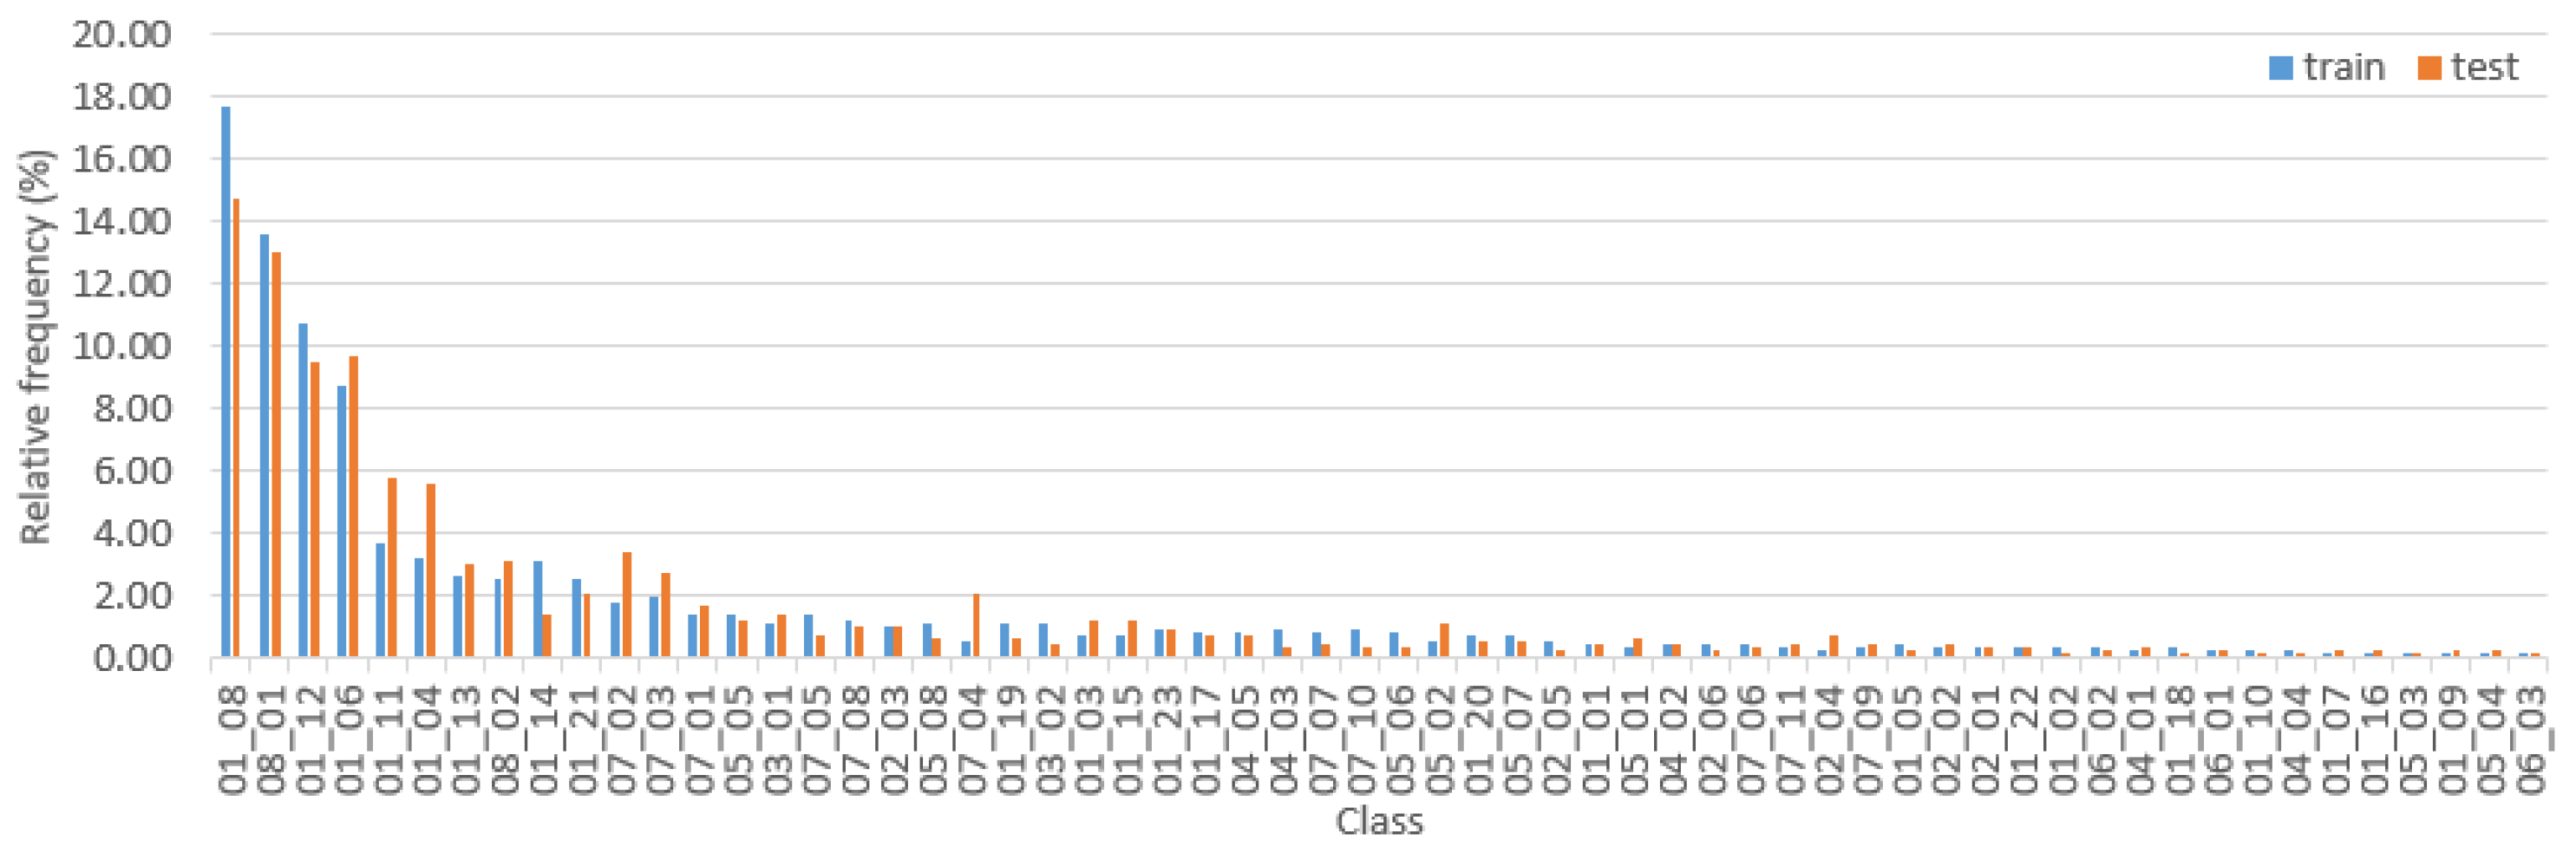
Figure 9 depicts the relative frequency of each of the 60 classes in the training and test sets. As can be seen the data set is quite imbalanced, with a few classes appearing considerably more often than the others. The six most frequent classes are ‘Speed limit: 100 km/h’, ‘Inactive LED panel’, ‘No overtaking for trucks whose weight exceeds 3.5 tonnes’, ‘Speed limit: 80 km/h’, ‘No overtaking’ and ‘Speed limit: 60 km/h’. We deliberately do not disclose any detailed information about the distribution of TS classes in the internal set, as this would contradict its purpose. We do remark, however, that the distribution is similar to those in the other sets.
3. Methods
3.1. Data Set Creation
The raw data underlying ATSD are HD videos of Austrian highways. They cover most of the 2249 km long ASFINAG (Austrian highway operator,
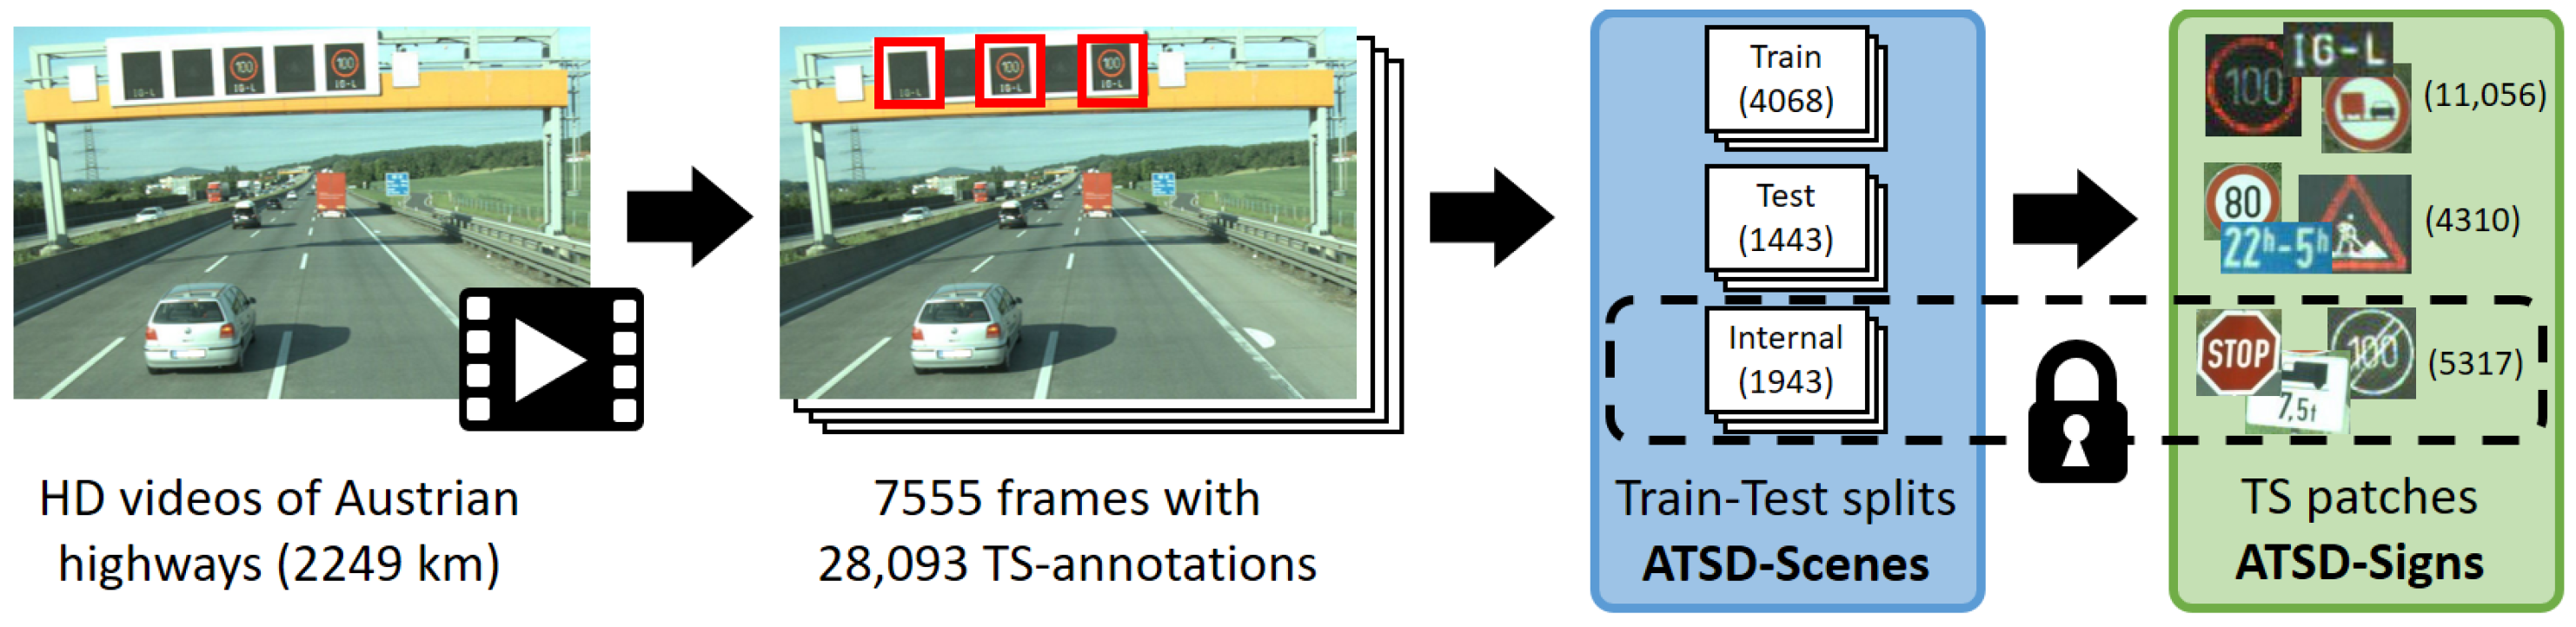
www.asfinag.at/en; accessed on 4 December 2022) highway network consisting of motorways and dual carriageways. From these videos, 7555 frames containing traffic signs were extracted and de-identified (blurring license plates, faces and some advertisements on trucks). Every physical sign is visible in at most four distinct frames. The frames were then annotated, resulting in a total of 28,093 annotations of traffic signs (see
Section 2.1 for details). Afterwards, the frames were split into training, test, and internal sets (
Section 2.2). After discarding 101 ‘invalid’ frames, the remaining 7454 frames (together with the corresponding 27,521 traffic sign annotations) make up the
ATSD-Scenes data set (
Section 2.3). A frame is invalid if it contains a heavily damaged or outdated traffic sign that has been replaced in the meantime. Finally, extracting patches from the frames showing actual traffic signs yields the
ATSD-Signs data set (
Section 2.4).
Figure 10 summarizes the whole data generation process.
The original traffic scene videos are a by-product of the last complete highway scan conducted by
RoadSTAR in the year 2014.
RoadSTAR is a high-performance measurement vehicle equipped with state-of-the-art sensors, satellite navigation and camera technology used for traffic infrastructure maintenance (
www.ait.ac.at/en/solutions/road-condition-monitoring; accessed on 4 December 2022). The forward-facing camera for recording the videos is mounted on the roof of the vehicle, at a height of about 3.30 m. The view slightly differs compared to normal cars, because the original purpose of the videos was not traffic sign recognition but traffic infrastructure maintenance. Although we do not expect this to be problematic when deploying detectors trained on our data in car-mounted devices, a thorough investigation of this question remains future work.
The annotation process was carried out by four employees of RISC Software GmbH (
www.risc-software.at/en; accessed on 4 December 2022), using the Computer Vision Annotation Tool [
34]. Frequent auditing rounds were implemented to maintain a high and consistent annotation quality.
3.2. Evaluation of Baseline Traffic Sign Recognition Systems
3.2.1. Traffic Sign Detection on ATSD-Scenes
To detect the traffic signs in the scenes we used the darknet detection framework, which is the basis for YOLO (You Only Look Once) detectors [
35]. To reduce model size and lower detection times we chose the Yolov4-tiny architecture. Compared to classic Yolov4 the average precision is reduced significantly for general detection tasks, but initial experiments revealed that Yolov4-tiny is sufficient for simple shapes such as traffic signs. The Yolov4-tiny model combines a target area and target category prediction into a single neural network, which results in a single step to obtain regions of interest (ROIs) and their respective category (e.g., prohibitory).
Supplementary Figure S1 shows the full architecture of the used network.
For training the detector we used a subset of the available categories, excluding ‘TB or TCS’ and ‘other’ due to their reduced relevance for real world applications. The model was trained for 250 epochs using the default darknet online augmentation methods: saturation, exposure and hue. The loss function that was minimized is Complete Intersection over Union (CIoU) [
36], which takes the overlapping area, the central point and the aspect ratio differences of the true and predicted bounding boxes into account.
Evaluations were performed with respect to an IoU-threshold of 50% and confidence-threshold of 25%. We trained three independent models (with same hyperparameters but different random seeds) on the training set of ATSD-Scenes and evaluated them both on the public and internal test set. This resulted in a mean average precision (mAP) of 85.39 ± 2.33% on the public test set and 86.40 ± 3.44% on the internal set. To also show the potential results when using the entire publicly available data we trained three more models on the training and test set and evaluated them on the internal set, yielding a mAP of 90.07 ± 0.3%.
3.2.2. Traffic Sign Classification on ATSD-Signs
We trained classifiers on the traffic sign patches in ATSD-Signs employing the model architecture developed by Li and Wang [
37], which achieves 99.66% accuracy on GTSRB [
5]. The model is a 19-layer CNN with asymmetric convolutions [
38]. We slightly deviated from the originally proposed training strategy in that we trained the models for a total of 101 epochs (instead of 230) and enabled on-line data augmentation from the beginning. We furthermore increased the batch size from 16 to 32 and put more weight on underrepresented classes to counter the considerable class imbalance (
Figure 9).
We first trained models on the training set of ATSD-Signs and evaluated them both on the public- and the internal test set. We then also trained models on the union of training and test set, and evaluated them only on the internal set. This should give an idea of what can be achieved (on the internal set) when making use of all publicly available data, a likely scenario for potential future challenges in connection with ATSD. In any case, during training we put aside 20% of the training data into a validation set used for monitoring the training progress and adjusting hyperparameters. Neither training- nor validation accuracy change significantly after about 60 epochs.
Besides the standard on-line data augmentation during model training (small random rotations, shifts, shearing and scaling; see [
37]) we tried traffic-sign specific augmentation strategies as well. For instance, images of some classes can be flipped and/or rotated by 90
/180
/270
while either preserving the class label or changing the label to a different class among those included in ATSD-Signs.
As explained in
Section 2.2, not all sign variants of every class appear in all three sets. A prominent example is ‘Speed limit: 40 km/h’ whose LED-versions are all contained in the test set. In our initial experiments we found that vanilla classification models consistently confuse LED-versions of classes they have never seen during training with other (similar) classes for which LED-versions exist in the training set.As a countermeasure we applied color transformations to non-LED images to make them look LED-like, and vice versa, and augmented the training data with these new images. Although the conversion is based on a simple linear transformation in LAB color space, the results look reasonable, as can be seen in
Supplementary Figure S3. More sophisticated approaches, e.g., based on
generative adversarial networks (GANs), are certainly conceivable. The list of classes treated in this way can be found in
github.com/risc-mi/atsd/blob/main/Classification_Preparation.ipynb, accessed on 4 December 2022. Note that it consists of those classes for which an LED conversion might seem reasonable to someone without access to the internal set, i.e., there are also cases where such a conversion would not have been necessary for improving the classification accuracy on the internal set. Furthermore, note that besides LED vs. non-LED there are many other sign variants that could be addressed in a similar manner.
The top-performing models trained on the training set achieve an accuracy of 97.61 ± 0.24% on the test set and 97.20 ± 0.21% on the internal set. When training on all publicly available data, the accuracy on the internal set increases to 98.27 ± 0.25%. In either case, both geometric and LED augmentation were employed. Detailed results can be found in
Supplementary Table S3.
3.2.3. Full Detection and Classification Pipeline
We combined the detectors presented in
Section 3.2.1 with the classifiers presented in
Section 3.2.2 to obtain a full
traffic sign recognition pipeline.
The detectors were trained to detect all classes contained in the eight categories from ‘01’ to ‘08’ (
Figure 4), but the classifiers can only distinguish between the 60 classes contained in ATSD-Signs (
Figure 8). Therefore, in order to assess the performance of the full pipeline in a fair way, we discard all detections of traffic signs whose classes are not included in ATSD-Signs. The same applies to all signs with attributes ‘crossed out’, ‘unusual’, ‘multiple signs’ or ‘caption’, because they are not included in ATSD-Signs either. In other words, a detection is only considered if (i) if it is a true positive and the true class is one of the 60 ATSD-Signs classes or (ii) it is a false positive, i. e., a detection that cannot be assigned to a ground truth annotation, meaning that there is no true class. Alternative evaluation protocols are conceivable as well, for instance borrowing ideas from
Open Set Recognition to ‘tweak’ the existing classifiers to automatically identify unknown traffic sign classes rather than wrongly assign them one of the known classes [
39]. We leave this for future work.
Another question concerns the treatment of disagreements between detector and classifier. If the traffic sign category predicted by the detector differs from the category of the class predicted by the classifier, this might indicate a false positive detection. Suppressing such detections can potentially improve the overall recognition performance, so we evaluated this approach in our experiments as well.
With an IoU threshold of 50% and the confidence of the classifiers as final recognition confidence, the top-performing models trained on the training set achieve a mAP of 87.87 ± 2.29% on the test set and 90.07 ± 1.96% on the internal set. When training on all publicly available data, the mAP on the internal set increases to 92.46 ± 0.68%. Detailed overall results can be found in
Supplementary Table S4, and per-class average precision is shown in
Supplementary Figure S4.
The size of the ground truth annotations has a considerable effect on recognition performance. When only considering small signs whose area does not exceed 45 × 45 pixels (first quartile over ATSD-Signs), the mean average precision drops to 68.32 ± 2.84% on the public test set.
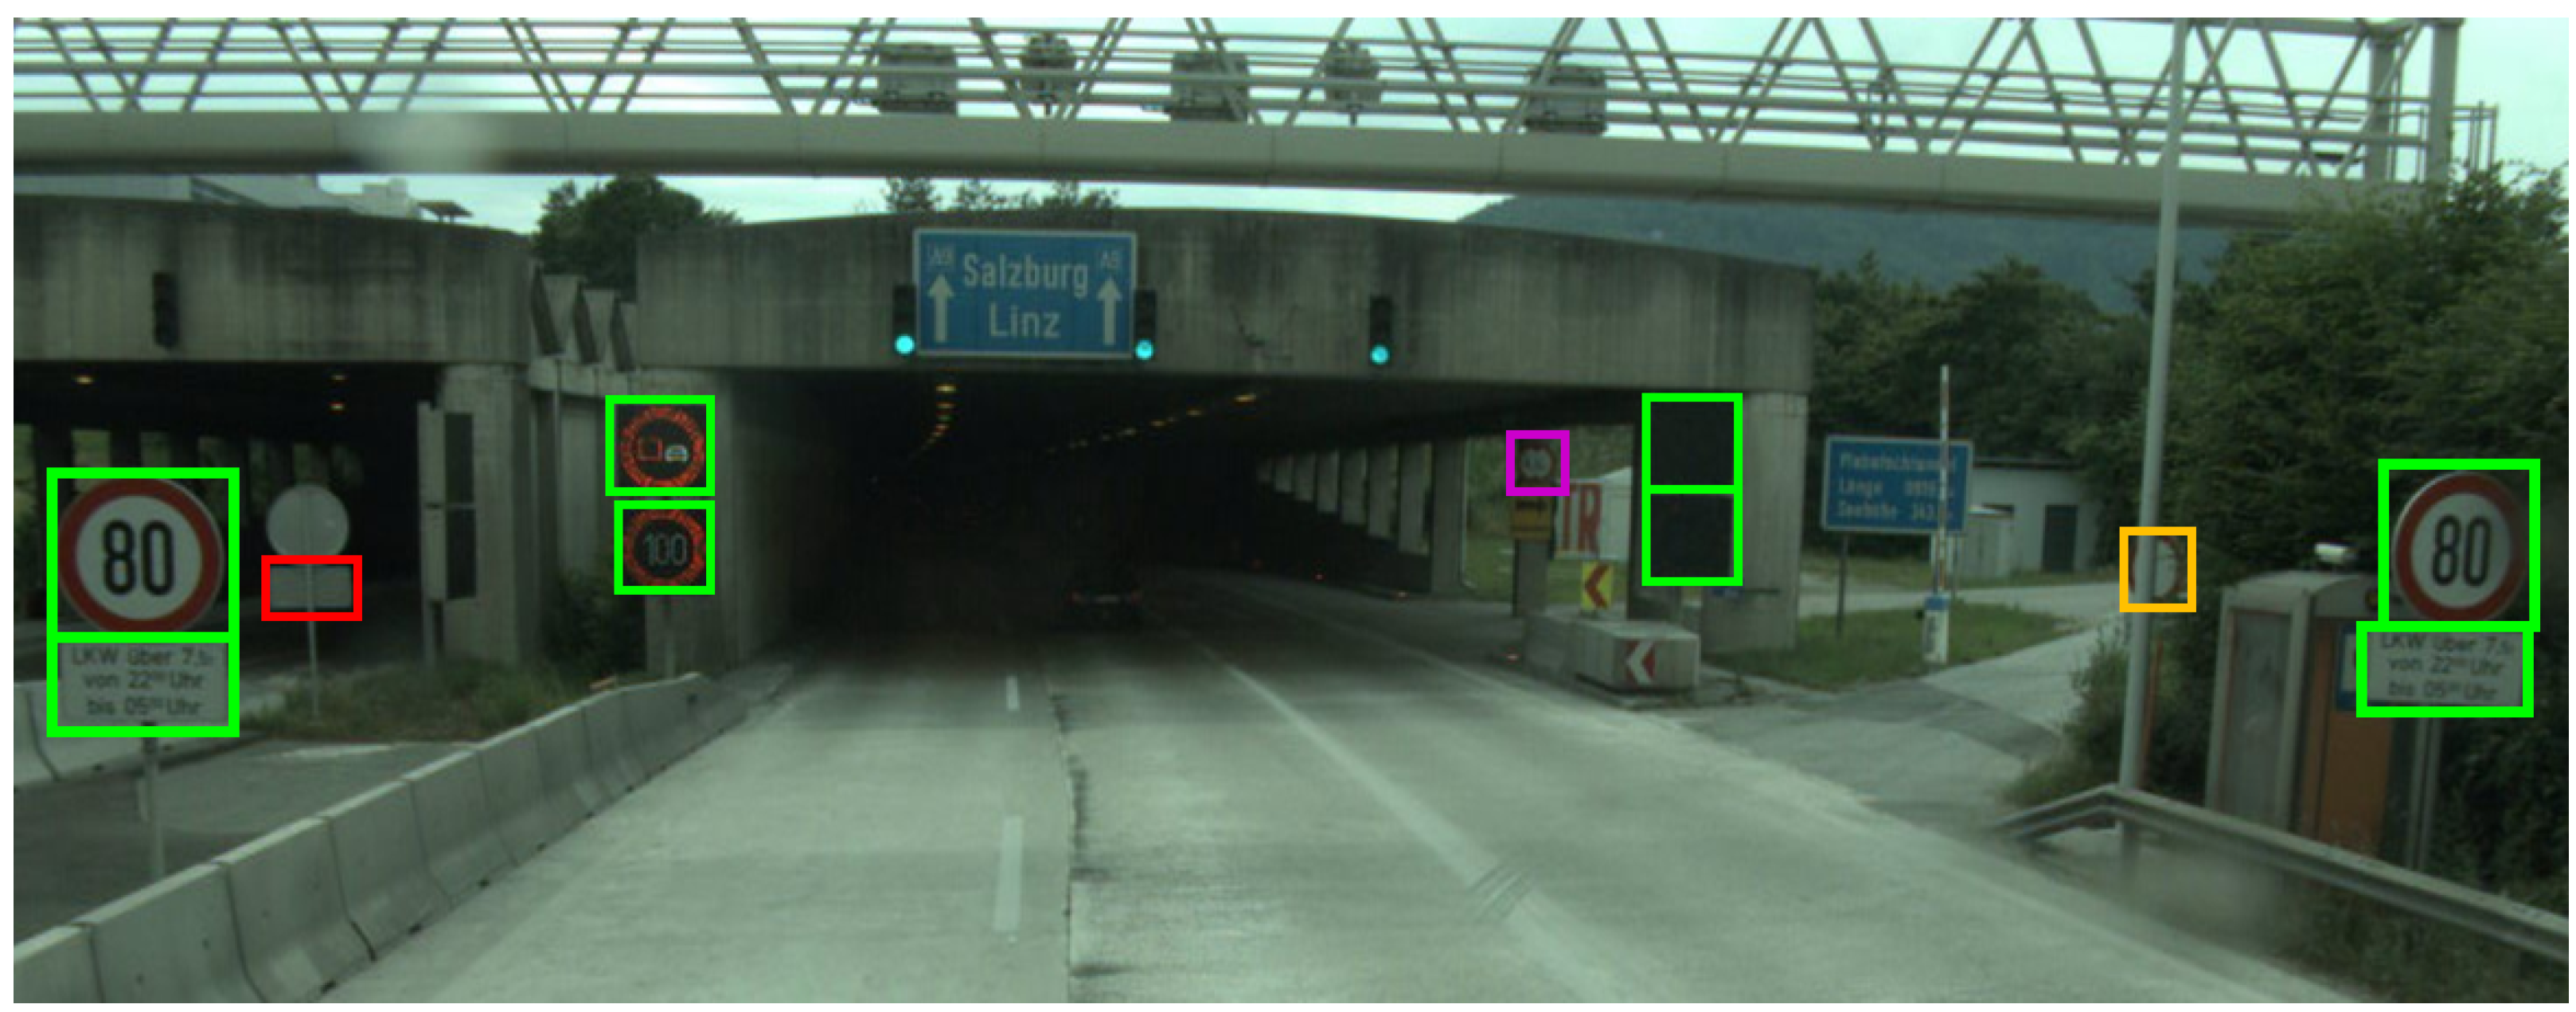
Figure 11 shows the result of applying one of the pipelines to an image from the public test set. Most traffic signs are correctly recognized, but there are also one false positive detection, one misclassified sign, and one missed sign. The false-positive detection, shown in red, is predicted as ‘Speed limit: 100km/h’ (01_08) with low detection but high classification confidence, despite its rectangular shape. The partly occluded sign shown in orange belongs to class ‘No vehicles’ (01_14) but is wrongly classified as ‘Speed limit: 100km/h’, too. The missed sign, shown in magenta, belongs to class ‘No vehicles whose height exceeds
n meters’ (01_17) and is indeed barely visible.
4. User Notes
Download ATSD and extract all files and folders from the archive. The only file formats appearing in the data set are JPEG and CSV files, which makes it particularly easy to handle.
Both ATSD-Scenes and ATSD-Signs are split into a training set and a test set, contained in sub-directories ‘train’ and ‘test’, respectively. Keep in mind that the internal set is not available for download. The ‘train’ and ‘test’ folders contain the actual images; in case of ATSD-Scenes, they are all stored in sub-directory ‘imgs’, in case of ATSD-Signs they are grouped according to the traffic sign class they belong to and stored in sub-directories with corresponding names. Directory structures like this are widely used in machine learning for image classification. The ‘train’ and ‘test’ folders additionally contain a table ‘meta_train.csv’ or ‘meta_test.csv’, respectively, with metadata about the images. Details about these metadata tables and how they can be linked to the individual images can be found in
Supplementary Tables S1 and S2.
No special software is needed to open the image and metadata files. Still, for large-scale analyses and experiments we recommend using Python. To that end,
https://github.com/risc-mi/atsd, accessed on 4 December 2022, contains a couple of Jupyter notebooks illustrating how images and metadata can be loaded, analyzed and prepared for subsequent model training; how trained detectors and classifiers can be applied to the data set (and others with similar structure); and how the results can be effectively evaluated with respect to the provided ground truth annotations. The repository additionally contains trained network weights of some of the models presented in
Section 3.2.
5. Conclusions
We presented a novel, publicly available data set of annotated traffic scene and traffic sign images. The data set covers almost all traffic signs on Austrian highways and provides rich meta information about them, in addition to bounding box and object class. Furthermore, our experiments with state-of-the-art traffic sign detection and classification models showed that the data set is challenging for various reasons, including different sign types (metal plate, prismatic inverter, LED), images acquired in tunnels and pronounced class imbalance.
ATSD shall support research on traffic sign recognition by adding Austrian varieties and specialties to the pool of public available catalogs. On Austrian highways, additional signs that restrict the meaning to selective classes of vehicles, e.g., ‘trucks only’, are quite common. Anecdotal evidence shows that traffic sign recognition systems used in currently available cars routinely ignore such information. This already had some minor impact, as cars automatically slowed down or accelerated due to traffic signs not meant for them (information provided by the customer management center of ASFINAG). We want to encourage research on the recognition of additional panels by providing ample examples in ATSD.
Insights gained during the publication of ATSD showed that the introduction of new traffic signs or a new design for some existing class will most probably require retraining of classifiers to preserve performance. New traffic signs or designs will show up only gradually ‘in the wild’. We believe that providing images of them well before in a catalog might improve the performance of classifiers on day 1 significantly. We therefore plan to add synthetic images of new traffic signs that are going to be deployed on Austrian highways to future versions of ATSD before they are actually deployed.
In general, extending ATSD with more data and/or more fine-grained annotations constitutes the main direction of future work. As each traffic scene image corresponds to a video frame, more data can easily be acquired by annotating a small number of frames before and after each currently annotated frame. Moreover, since highway traffic scene videos are systematically recorded on a regular basis, the currently used data from 2014 can be enriched by more recent data. How this can be achieved with minimum manual annotation effort yet avoiding automation bias is an interesting research direction on its own.
Supplementary Materials
The following supporting information can be downloaded at:
https://www.mdpi.com/article/10.3390/data8010016/s1, Table S1: Schema of ATSD-Scenes metadata tables; Table S2: Schema of ATSD-Signs metadata tables; Table S3: Detailed classification results; Table S4: Detailed results of the full detection and classification pipeline; Figure S1: Architecture of the used Yolov4-tiny detection model; Figure S2: Average precision of each category; Figure S3: Exemplary results of our LED augmentation approach; Figure S4: Average precision of each TS class.
Author Contributions
Conceptualization, S.T., J.K. and K.B.; methodology, J.K., S.T., A.M., N.H. and K.B.; software, N.H. and A.M.; resources, J.K.; data curation, A.M. and N.H.; writing—original draft preparation, A.M. and N.H.; writing—review and editing, J.K., A.M., N.H. and S.T.; supervision, S.T.; project administration, S.T., J.K. and K.B.; funding acquisition, S.T., J.K. and K.B. All authors have read and agreed to the published version of the manuscript.
Funding
This research was funded by FFG (Austrian Research Promotion Agency) under grant 879320 (SafeSign) and financed by research subsidies granted by the government of Upper Austria. RISC Software GmbH is Member of UAR (Upper Austrian Research) Innovation Network.
Institutional Review Board Statement
Not applicable.
Informed Consent Statement
Not applicable.
Data Availability Statement
The public part of the data presented in this paper is available at
https://doi.org/10.53177/ATSD, accessed on 4 December 2022. The held-back internal part is not publicly available, as this would contradict its very purpose of objectively and independently evaluating the quality of camera-based traffic sign recognition systems. Software for working with the data, as well as trained baseline detection- and classification models are available at
https://github.com/risc-mi/atsd, accessed on 4 December 2022.
Acknowledgments
We thank Christopher Ebner, Sara Ivcevic, Marco Jahn and Sebastian Schmalzer for annotating the traffic scene images. We also thank Samuel Haijes for his support in publishing the data.
Conflicts of Interest
The authors declare no conflict of interest. The funders had no role in the design of the study; in the collection, analyses, or interpretation of data; in the writing of the manuscript; or in the decision to publish the results.
Abbreviations
The following abbreviations are used in this manuscript:
| ADAS | Advanced Driver Assistance Systems |
| AP | Additional panel |
| ASFINAG | Austrian highway operator |
| ATSD | Austrian Highway Traffic Sign Data Set |
| CSV | Comma-separated values |
| CVAT | Computer Vision Annotation Tool |
| FAIR | Findability, Accessibility, Interoperability, Reuse |
| JPEG | Joint Photographic Experts Group |
| LED | Light-emitting diode |
| mAP | Mean average precision |
| MS | Main traffic sign |
| TB | Traffic board |
| TCS | Traffic control system |
| TS | Traffic sign |
| YOLO | You Only Look Once (image detection framework) |
References
- Maletzky, A.; Thumfart, S.; Wruß, C. An Evaluation of the Machine Readability of Traffic Sign Pictograms using Synthetic Data Sets. In Proceedings of the OAGM Workshop 2021: Computer Vision and Pattern Analysis Across Domains, St. Pölten, Austria, 24–25 November 2021; Seidl, M., Zeppelzauer, M., Roth, P.M., Eds.; Verlag der TU Graz: Graz, Austria, 2022; pp. 9–15. [Google Scholar] [CrossRef]
- Ertler, C.; Mislej, J.; Ollmann, T.; Porzi, L.; Neuhold, G.; Kuang, Y. The Mapillary Traffic Sign Dataset for Detection and Classification on a Global Scale. In Proceedings of the Computer Vision—ECCV 2020, Glasgow, UK, 23–28 August 2020; Vedaldi, A., Bischof, H., Brox, T., Frahm, J.M., Eds.; Lecture Notes in Computer Science. Springer International Publishing: Cham, Switzerland, 2020; pp. 68–84. [Google Scholar] [CrossRef]
- Wilkinson, M.D.; Dumontier, M.; Aalbersberg, I.J.; Appleton, G.; Axton, M.; Baak, A.; Blomberg, N.; Boiten, J.W.; da Silva Santos, L.B.; Bourne, P.E.; et al. The FAIR Guiding Principles for scientific data management and stewardship. Sci. Data 2016, 3, 160018. [Google Scholar] [CrossRef] [PubMed]
- Houben, S.; Stallkamp, J.; Salmen, J.; Schlipsing, M.; Igel, C. Detection of traffic signs in real-world images: The German traffic sign detection benchmark. In Proceedings of the 2013 International Joint Conference on Neural Networks (IJCNN), Dallas, TX, USA, 4–9 August 2013; pp. 1–8. [Google Scholar] [CrossRef]
- Stallkamp, J.; Schlipsing, M.; Salmen, J.; Igel, C. Man vs. computer: Benchmarking machine learning algorithms for traffic sign recognition. Neural Netw. 2012, 32, 323–332. [Google Scholar] [CrossRef] [PubMed]
- Cordts, M.; Omran, M.; Ramos, S.; Rehfeld, T.; Enzweiler, M.; Benenson, R.; Franke, U.; Roth, S.; Schiele, B. The Cityscapes Dataset for Semantic Urban Scene Understanding. In Proceedings of the IEEE Conference on Computer Vision and Pattern Recognition, Las Vegas, NV, USA, 27–30 June 2016; pp. 3213–3223. [Google Scholar]
- Geiger, A.; Lenz, P.; Stiller, C.; Urtasun, R. Vision meets robotics: The KITTI dataset. Int. J. Robot. Res. 2013, 32, 1231–1237. [Google Scholar] [CrossRef]
- Pan, X.; Shi, J.; Luo, P.; Wang, X.; Tang, X. Spatial As Deep: Spatial CNN for Traffic Scene Understanding. In Proceedings of the AAAI Conference on Artificial Intelligence (AAAI), New Orleans, LA, USA, 2–7 February 2018. [Google Scholar]
- TuSimple Lane Detection Challenge. 2017. Available online: https://github.com/TuSimple/tusimple-benchmark/tree/master/doc/lane_detection (accessed on 4 December 2022).
- Wang, K.; Belongie, S. Word Spotting in the Wild. In Proceedings of the Computer Vision—ECCV 2010, Heraklion, Greece, 5–11 September 2010; Daniilidis, K., Maragos, P., Paragios, N., Eds.; Lecture Notes in Computer Science. Springer: Berlin/Heidelberg, Germany, 2010; pp. 591–604. [Google Scholar] [CrossRef]
- Akallouch, M.; Boujemaa, K.S.; Bouhoute, A.; Fardousse, K.; Berrada, I. ASAYAR: A Dataset for Arabic-Latin Scene Text Localization in Highway Traffic Panels. IEEE Trans. Intell. Transp. Syst. 2022, 23, 3026–3036. [Google Scholar] [CrossRef]
- González, A.; Bergasa, L.M.; Yebes, J.J. Text Detection and Recognition on Traffic Panels From Street-Level Imagery Using Visual Appearance. IEEE Trans. Intell. Transp. Syst. 2014, 15, 228–238. [Google Scholar] [CrossRef]
- Rong, X.; Yi, C.; Tian, Y. Recognizing Text-Based Traffic Guide Panels with Cascaded Localization Network. In Proceedings of the Computer Vision—ECCV 2016 Workshops, Amsterdam, The Netherlands, 8–10, 15–16 October 2016; Hua, G., Jégou, H., Eds.; Lecture Notes in Computer Science. Springer International Publishing: Cham, Switzerland, 2016; pp. 109–121. [Google Scholar] [CrossRef]
- Cognata Traffic Sign Datasets. 2021. Available online: https://www.cognata.com/traffic-sign-datasets/ (accessed on 4 December 2022).
- Ros, G.; Sellart, L.; Materzynska, J.; Vazquez, D.; Lopez, A.M. The SYNTHIA Dataset: A Large Collection of Synthetic Images for Semantic Segmentation of Urban Scenes. In Proceedings of the IEEE Conference on Computer Vision and Pattern Recognition (CVPR), Las Vegas, NV, USA, 27–30 June 2016; pp. 3234–3243. [Google Scholar] [CrossRef]
- AI.Reverie. 2021. Available online: https://aireverie.com/ (accessed on 4 December 2022).
- Anyverse. 2021. Available online: https://anyverse.ai/ (accessed on 4 December 2022).
- CVEDIA. 2021. Available online: https://www.cvedia.com/ (accessed on 4 December 2022).
- Grigorescu, C.; Petkov, N. Distance sets for shape filters and shape recognition. IEEE Trans. Image Process. 2003, 12, 1274–1286. [Google Scholar] [CrossRef] [PubMed]
- Timofte, R.; Zimmermann, K.; Van Gool, L. Multi-view traffic sign detection, recognition, and 3D localisation. Mach. Vis. Appl. 2014, 25, 633–647. [Google Scholar] [CrossRef]
- Šegvić, S.; Brkić, K.; Kalafatić, Z.; Stanisavljević, V.; Ševrović, M.; Budimir, D.; Dadić, I. A computer vision assisted geoinformation inventory for traffic infrastructure. In Proceedings of the 13th International IEEE Conference on Intelligent Transportation Systems (ITSC), Funchal, Portugal, 19–22 September 2010; pp. 66–73. [Google Scholar]
- Belaroussi, R.; Foucher, P.; Tarel, J.P.; Soheilian, B.; Charbonnier, P.; Paparoditis, N. Road Sign Detection in Images: A Case Study. In Proceedings of the 20th International Conference on Pattern Recognition, Istanbul, Turkey, 23–26 August 2010; pp. 484–488. [Google Scholar] [CrossRef]
- Larsson, F.; Felsberg, M. Using Fourier Descriptors and Spatial Models for Traffic Sign Recognition. In Proceedings of the Image Analysis, 17th Scandinavian Conference, SCIA 2011, Ystad, Sweden, 23–27 May 2011; Heyden, A., Kahl, F., Eds.; Lecture Notes in Computer Science. Springer: Berlin/Heidelberg, Germany, 2011; pp. 238–249. [Google Scholar] [CrossRef]
- Møgelmose, A.; Trivedi, M.M.; Moeslund, T.B. Vision based Traffic Sign Detection and Analysis for Intelligent Driver Assistance Systems: Perspectives and Survey. IEEE Trans. Intell. Transp. Syst. 2012, 13, 1484–1497. [Google Scholar] [CrossRef]
- Zhu, Z.; Liang, D.; Zhang, S.; Huang, X.; Li, B.; Hu, S. Traffic-Sign Detection and Classification in the Wild. In Proceedings of the 2016 IEEE Conference on Computer Vision and Pattern Recognition (CVPR), Las Vegas, NV, USA, 27–30 June 2016; pp. 2110–2118. [Google Scholar] [CrossRef]
- Yang, Y.; Luo, H.; Xu, H.; Wu, F. Towards Real-Time Traffic Sign Detection and Classification. IEEE Trans. Intell. Transp. Syst. 2016, 17, 2022–2031. [Google Scholar] [CrossRef]
- Youssef, A.; Albani, D.; Nardi, D.; Bloisi, D.D. Fast Traffic Sign Recognition Using Color Segmentation and Deep Convolutional Networks. In Proceedings of the Advanced Concepts for Intelligent Vision Systems, Lecce, Italy, 24–27 October 2016; Blanc-Talon, J., Distante, C., Philips, W., Popescu, D., Scheunders, P., Eds.; Lecture Notes in Computer Science. Springer International Publishing: Cham, Switzerland, 2016; pp. 205–216. [Google Scholar] [CrossRef]
- Shakhuro, V.; Konushin, A. Russian traffic sign images dataset. Comput. Opt. 2016, 40, 294–300. [Google Scholar] [CrossRef]
- Zhang, J.; Huang, M.; Jin, X.; Li, X. A Real-Time Chinese Traffic Sign Detection Algorithm Based on Modified YOLOv2. Algorithms 2017, 10, 127. [Google Scholar] [CrossRef]
- Gámez Serna, C.; Ruichek, Y. Classification of Traffic Signs: The European Dataset. IEEE Access 2018, 6, 78136–78148. [Google Scholar] [CrossRef]
- Pavlov, A.L.; Karpyshev, P.A.; Ovchinnikov, G.V.; Oseledets, I.V.; Tsetserukou, D. IceVisionSet: Lossless video dataset collected on Russian winter roads with traffic sign annotations. In Proceedings of the 2019 International Conference on Robotics and Automation (ICRA), Montreal, QC, Canada, 20–24 May 2019; pp. 9597–9602. [Google Scholar] [CrossRef]
- Temel, D.; Chen, M.H.; AlRegib, G. Traffic Sign Detection Under Challenging Conditions: A Deeper Look into Performance Variations and Spectral Characteristics. IEEE Trans. Intell. Transp. Syst. 2019, 21, 3663–3673. [Google Scholar] [CrossRef]
- Tabernik, D.; Skočaj, D. Deep Learning for Large-Scale Traffic-Sign Detection and Recognition. IEEE Trans. Intell. Transp. Syst. 2020, 21, 1427–1440. [Google Scholar] [CrossRef]
- Sekachev, B.; Manovich, N.; Zhiltsov, M.; Zhavoronkov, A.; Kalinin, D.; Hoff, B.; TOsmanov; Kruchinin, D.; Zankevich, A.; DmitriySidnev; et al. Opencv/Cvat: V1.1.0. 2020. Available online: https://zenodo.org/record/4009388#.Y7JwZBVBxPY (accessed on 4 December 2022). [CrossRef]
- Redmon, J. Darknet: Open Source Neural Networks in C. 2013–2016. Available online: http://pjreddie.com/darknet/ (accessed on 4 December 2022).
- Zheng, Z.; Wang, P.; Ren, D.; Liu, W.; Ye, R.; Hu, Q.; Zuo, W. Enhancing Geometric Factors in Model Learning and Inference for Object Detection and Instance Segmentation. IEEE Trans. Cybern. 2021, 52, 8574–8586. [Google Scholar] [CrossRef] [PubMed]
- Li, J.; Wang, Z. Real-Time Traffic Sign Recognition Based on Efficient CNNs in the Wild. IEEE Trans. Intell. Transp. Syst. 2019, 20, 975–984. [Google Scholar] [CrossRef]
- Szegedy, C.; Vanhoucke, V.; Ioffe, S.; Shlens, J.; Wojna, Z. Rethinking the Inception Architecture for Computer Vision. In Proceedings of the 2016 IEEE Conference on Computer Vision and Pattern Recognition (CVPR), Las Vegas, NV, USA, 27–30 June 2016; pp. 2818–2826. [Google Scholar] [CrossRef]
- Vaze, S.; Han, K.; Vedaldi, A.; Zisserman, A. Open-Set Recognition: A Good Closed-Set Classifier is All You Need? arXiv 2022, arXiv:2110.06207. [Google Scholar]
Figure 1.
Some example scenes of ATSD, highlighting the diversity of the data set. It covers rural, urban and mountainous areas, and lots of tunnels.
Figure 1.
Some example scenes of ATSD, highlighting the diversity of the data set. It covers rural, urban and mountainous areas, and lots of tunnels.
Figure 2.
‘Atypical’ annotations. (a) Traffic signs were annotated even if they do not apply to the main road/lane. (b) Inactive (switched-off) LED panels and prismatic inverters were annotated as well.
Figure 2.
‘Atypical’ annotations. (a) Traffic signs were annotated even if they do not apply to the main road/lane. (b) Inactive (switched-off) LED panels and prismatic inverters were annotated as well.
Figure 3.
Different sorts of traffic signs. (a) Main sign (MS) with two additional panels (AP). (b) Traffic board (TB) with MS and AP, which itself has an AP attached to it. (c) Traffic control system (TCS), which is an ensemble of (overhead) LED panels; LED panels can consist of MS and AP.
Figure 3.
Different sorts of traffic signs. (a) Main sign (MS) with two additional panels (AP). (b) Traffic board (TB) with MS and AP, which itself has an AP attached to it. (c) Traffic control system (TCS), which is an ensemble of (overhead) LED panels; LED panels can consist of MS and AP.
Figure 4.
Traffic sign categories, sorted by frequency.
Figure 4.
Traffic sign categories, sorted by frequency.
Figure 5.
Frequency of (a) sign types and (b) attributes.
Figure 5.
Frequency of (a) sign types and (b) attributes.
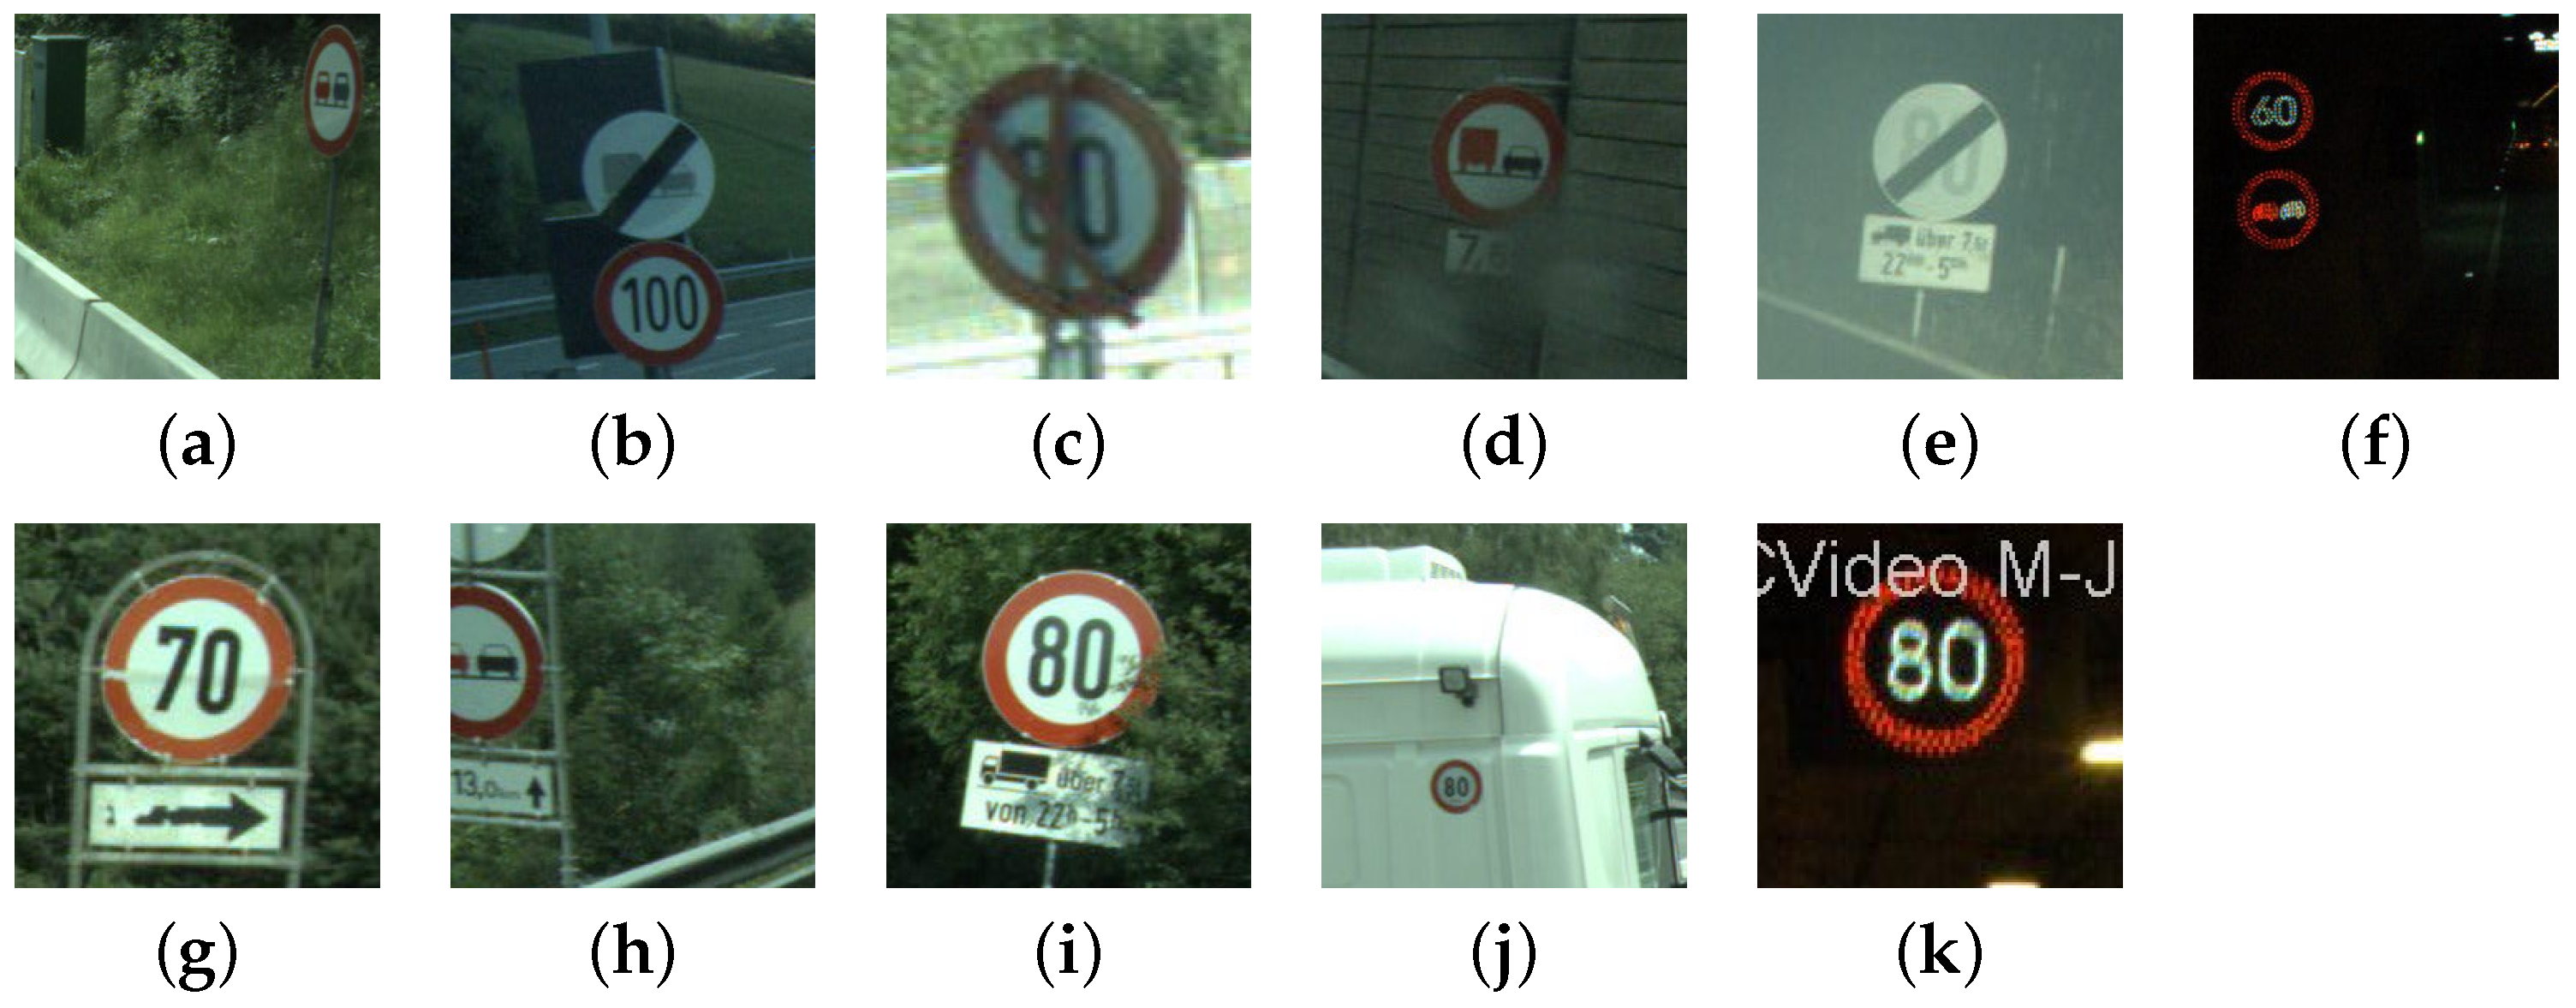
Figure 6.
Attributes of TS annotations. (a) Not normal to roadway, (b) multiple signs, (c) crossed out, (d) rain, (e) fog, (f) tunnel, (g) damaged, (h) trimmed, (i) occluded, (j) unusual sign (located on the back of a truck) and (k) figure caption.
Figure 6.
Attributes of TS annotations. (a) Not normal to roadway, (b) multiple signs, (c) crossed out, (d) rain, (e) fog, (f) tunnel, (g) damaged, (h) trimmed, (i) occluded, (j) unusual sign (located on the back of a truck) and (k) figure caption.
Figure 7.
Relative frequency of TS categories in the three sets.
Figure 7.
Relative frequency of TS categories in the three sets.
Figure 8.
One example for each of the 60 traffic sign classes contained in ATSD-Signs.
Figure 8.
One example for each of the 60 traffic sign classes contained in ATSD-Signs.
Figure 9.
Relative frequency of traffic sign classes in the training and test sets.
Figure 9.
Relative frequency of traffic sign classes in the training and test sets.
Figure 10.
Development of ATSD. 7555 frames containing traffic signs were extracted from HD videos and then annotated. After filtering invalid images, the remaining 7454 frames were then split into training, test and internal sets, forming ATSD-Scenes. ATSD-Signs consists of traffic sign patches extracted from the frames in the respective splits.
Figure 11.
Example scene with recognition results. True positives are shown in green, false positives in red, false negatives in magenta and misclassifications in orange. Image was cropped to focus on relevant parts.
Figure 11.
Example scene with recognition results. True positives are shown in green, false positives in red, false negatives in magenta and misclassifications in orange. Image was cropped to focus on relevant parts.
Table 2.
ATSD-Scenes statistics. Annotations per image are displayed as median (min-max).
Table 2.
ATSD-Scenes statistics. Annotations per image are displayed as median (min-max).
| | Train | Test | Internal | Total |
|---|
| Images | 4068 (54.57%) | 1443 (19.36%) | 1943 (26.07%) | 7454 |
| Annotations | 15,042 (54.66%) | 5485 (19.93%) | 6994 (25.41%) | 27,521 |
| Annotations per image | 3 (0–20) | 3 (0–17) | 3 (0–18) | 3 (0–20) |
| Images w/o annotations | 55 | 16 | 26 | 97 |
Table 3.
ATSD-Signs statistics. Image size refers to square root of the area, in pixels, and is displayed as median (min-max).
Table 3.
ATSD-Signs statistics. Image size refers to square root of the area, in pixels, and is displayed as median (min-max).
| | Train | Test | Internal | Total |
|---|
| Images | 11,056 (53.45%) | 4310 (20.84%) | 5317 (25.71%) | 20,683 |
| Image size | 62.1 (7.5–326.9) | 63.5 (8.2–326.3) | 65.6 (8.4–324.0) | 63.2 (7.5–326.9) |
| Disclaimer/Publisher’s Note: The statements, opinions and data contained in all publications are solely those of the individual author(s) and contributor(s) and not of MDPI and/or the editor(s). MDPI and/or the editor(s) disclaim responsibility for any injury to people or property resulting from any ideas, methods, instructions or products referred to in the content. |
© 2023 by the authors. Licensee MDPI, Basel, Switzerland. This article is an open access article distributed under the terms and conditions of the Creative Commons Attribution (CC BY) license (https://creativecommons.org/licenses/by/4.0/).


 ,
, 


