Abstract
Recent studies on indoor positioning using Wi-Fi fingerprinting are motivated by the ubiquity of Wi-Fi networks and their promising positioning accuracy. Machine learning algorithms are commonly leveraged in indoor positioning works. The performance of machine learning based solutions are dependent on the availability, volume, quality, and diversity of related data. Several public datasets have been published in order to foster advancements in Wi-Fi based fingerprinting indoor positioning solutions. These datasets, however, lack dual-band Wi-Fi data within symmetric indoor environments. To fill this gap, this research work presents the UTMInDualSymFi dataset, as a source of dual-band Wi-Fi data, acquired within multiple residential buildings with symmetric deployment of access points. UTMInDualSymFi comprises the recorded dual-band raw data, training and test datasets, radio maps and supporting metadata. Additionally, a statistical radio map construction algorithm is presented. Benchmark performance was evaluated by implementing a machine-learning-based positioning algorithm on the dataset. In general, higher accuracy was observed, on the 5 GHz data scenarios. This systematically collected dataset enables the development and validation of future comprehensive solutions, inclusive of novel preprocessing, radio map construction, and positioning algorithms.
Dataset License: Creative Commons Attribution 4.0 International
1. Introduction
The performance degradation of Global Positioning System (GPS) based positioning systems within indoor localities, render it to be considered as an inappropriate solution, for contemporary and future indoor tracking applications [1,2,3]. The emergence of Internet of Things (IoT) [4], further manifests the requirement of efficient Indoor Positioning Systems (IPS) in public indoor environments [1,5]. Within commercial indoor premises, robust tracking solutions are also imperative [6] for the realization of smart factories [7] and smart warehouses [8]. Therefore, innovative IPS dedicated research works are pertinent and prevalent. Comprehensive reviews of IPS works are reported in [1,5,9,10].
Various positioning techniques have been proposed to provide robustness against the complexities and adversaries of indoor environments [11]. Triangulation [12], trilateration [13], Dead-Reckoning (DR) [14], proximity detection [15], and Fingerprinting (FP) [16] are among the techniques utilized for IPS research. Fingerprinting is a widely employed technique for indoor positioning research studies [1,10]. The enabling technologies generally leveraged by IPS proposals include, Wireless-Fidelity (Wi-Fi) [16], Bluetooth Low Energy (BLE) [12], Radio-Identification (RFID) [6], Ultra Wideband (UWB) [17], and Ultrasound [18]. Within previously proposed IPS solutions, a significant proportion are Wi-Fi or BLE enabled, mainly due to ubiquitous availability of Wi-Fi enabled and BLE enabled devices. Similarly, FP based IPS solutions enabled by Wi-Fi technology are in abundance [11].
In order to promote fair comparison among proposed solutions and foster future indoor localization research, certain open access datasets [19,20,21,22,23,24,25,26,27] provide valid Wi-Fi data for indoor positioning. Wi-Fi data collected in a particular indoor environment are generally not useful in other indoor locations. The reason for this is because the repeatability of data is affected by variations in the indoor layouts, networks, and measurement devices [28]. Despite the homogeneity of these factors, the spatial variations in how network devices are installed also affect the repeatability of Wi-Fi data [23,29]. Due to the lower variability in Received Signal Strength Indicator (RSSI) that has been observed with dual-band Wi-Fi data, recent works [30,31] have advocated the use of dual-band data for accuracy improvements in indoor positioning.
To provide repeatable data for symmetric indoor environments and dual-band data for high-accuracy positioning, the UTMInDualSymFi dataset is introduced. The dataset is generated from meticulously selected residential complexes that possess perfect Wi-Fi network/device homogeneity in addition to high-level spatial symmetry in device location installment. The complexes comprise multiple symmetric buildings with preinstalled dual-band Wi-Fi access points. As a comprehensive source of labeled dual-band Wi-Fi Received Signal Strength Indicator (RSSI) data, the dataset includes radio maps, raw training, and test data, recorded within multiple buildings. The dataset is generated from meticulously selected residential complexes that possess perfect Wi-Fi network/device homogeneity in addition to high level spatial symmetry in device location installment. The complexes comprise multiple symmetric buildings with preinstalled dual-band Wi-Fi access points. As a comprehensive source of labeled dual-band Wi-Fi Received Signal Strength Indicator (RSSI) data, the datset includes radio maps, raw training and test data, recorded within multiple buildings. The significant contributions of our presented work include the following:
- Symmetric multibuilding indoor environment scenario: Wi-Fi RSSI data are collected from multiple residential buildings, which are similar in structure, and symmetric in Access Point (AP) deployment with perfect network device homogeneity
- Dual-band labeled Wi-Fi data: The collected data from all APs are labeled and bifurcated according to their operating frequency band. Comparative performance analysis using data of individual bands is also presented
- Comprehensive data/datasets: All collected and labeled raw data are provided. Therefore, comprehensive works across fingerprinting positioning components including datasets extraction, data filtering, data preprocessing, radio maps generation, as well as positioning algorithms can be implemented, tested, and validated
- Statistical Windowed Radio Map (SWRM) algorithm: The proposed SWRM algorithm for radio map construction is presented along with benchmark performance and resultant radio maps data
- Multipurpose database: The open access raw data and datasets are readily usable for indoor localization as well as multidisciplinary research communities like wireless communication, data science, and machine learning/artificial intelligence
The remainder of this paper is organized as follows. In Section 2, related Wi-Fi RSSI datasets/databases are described. Section 3 explains pertinent features of the indoor environment, in addition to data collection procedure. Section 4 describes the raw data, datasets formation, and statistical analysis of collected data. Section 5 reports a proposed radio map generation algorithm. Additionally, baseline performance metrics are presented for implementation of a benchmark positioning algorithm. Finally, the main conclusions are reported in Section 6.
2. Related Works
In this section, several currently available open access datasets for indoor positioning are reviewed. Due to the complexity of indoor wireless data, fair benchmark analysis with several positioning and tracking algorithms is hindered. Therefore, the indoor localization research community promote and generate open access data to ensure valid and repeatable benchmarks for prospective research [1,32]. Several open access datasets containing Wi-Fi data for fingerprinting-based indoor positioning have been published. A summarized overview of these datasets is furnished in Table 1. As evident from Table 1, a majority of datasets do not provide labeled dual-band Wi-Fi data. Only a few datasets represent the multibuilding scenario whereas data from similar buildings are lacking. The Escuela dataset [33] is the only one with data from homogeneous network devices, i.e., all the installed Access Points (APs) are the same device. None of the datasets have spatial symmetry, i.e., locations of deployed APs are not consistent across different floors or buildings.

Table 1.
Comparative summary of related open access Wi-Fi datasets.
The UJIIndoorLoc [34] database provides Received Signal Strength (RSS) Wi-Fi fingerprints for three buildings in Universitat Jaume I (UJI), Spain. Each building has either four or five floors. Wi-Fi data were collected at all floors using 25 Android1 devices. In total the recorded data corresponds to 108,703 m2 indoor area. RSS data from 520 APs in the form of training and testing datasets were recorded. Data were labeled with pertinent attributes like longitude, latitude, timestamp, building Identification (ID), floor ID, and device ID. Large errors are expected while using the data for location estimation, because within every room, data are recorded at only two locations, i.e., room center and in front of door. As one of the pioneering indoor localization datasets, UJIIndoorLoc is widely used for IPS performance analysis in multibuilding and multifloor environments. However, cross-building adaptability of data is lacking. Further details are reported in [34] and the data are available at [19].
A couple of Wi-Fi datasets [20,21], related to the work [38] are also available for fingerprinting based indoor positioning. Both databases were collected at the University of Minho, Portugal. The DSI dataset [20], was recorded in the Department of Information Systems – DSI, building 11 at the first floor. Wi-Fi data were acquired using an Adroid-based NVIDIA® SHIELD™ tablet. Along with position coordinates and timestamps, RSSI values from 157 APs were recorded. Since data from only device are available, implications of device heterogeneity in positioning performance are not possible with the dataset. The other dataset [21] contains data collected at a building (within the university) resembling an industrial floor plant. Data acquisition was implemented using a Raspberry Pi2 3 Model B device. Data from 11 APs were recorded on the internal Wi-Fi interface and four external USB Wi-Fi interfaces of the Raspberry Pi 3. In total the coverage area of data collection was around 1000 m2. The dataset therefore is useful for analysis of IPS solutions based on multiple, synchronized, Wi-Fi interfaces. Nonavailability of dual-band data and multidevice data collection, however, limits the prospective analysis perspectives.
The KTH/RSS [22] database is a collection of two separate indoor and outdoor Wi-Fi RSS datasets. The indoor data were collected using a mobile robot at the 5th floor of a university building during working hours. The mobile robot data, such as position and orientation was collected with the help of Robot Operating System (ROS) drivers of the respective robot. The dataset is a pioneering contribution of automated and swift data collection. However, a detailed description of Wi-Fi data is lacking, which is a hindrance in easy reusage of the data.
The GEOTEC dataset [35] is a collection of two datasets, one of which contains Wi-Fi RSSI data for fingerprinting positioning. RSSI data were acquired within eight corridors of the GEOTEC laboratory in UJI, Spain using two Android smartphones. Out of the 97 detected APs in the data collection, two were known to be dual-band and installed within the laboratory. The dataset is useful for performance analysis in corridors and small areas. Despite availability of some dual-band data, absence of its benchmark analysis is a significant drawback. The Wi-Fi dataset is accessible at [39].
RSS data from Wi-Fi APs collected by crowdsourcing is available in the Tampere University of Technology (TUT), dataset [23]. Twenty one different Android devices were used to capture data from a five-floor building, covering around 22,570 m2. In the TUT database, RSS data from 2.4 Gigahertz (GHz) and 5 GHz were recorded without labeling. The data acquisition application used did not differentiate between data from various frequency bands. In addition to RSS values, timestamp and device model, MAC addresses of detected Wi-Fi APs were also recorded. In total, 991 MAC addresses were detected during the 8 month period of crowdsourced measurements. The labeling in crowdsourced data collection is known to be error prone [40]. This dataset provides useful data for indoor positioning analysis in a large multifloor environment. High temporal and device diversity further augment the utility. However, nonlabeling of dual-band data restricts leveraging of multifrequency data. The dataset along with various programming scripts for data processing and localization algorithms are accessible at [41]. Another multibuilding Wi-Fi RSS database [24] was recorded at TUT. Datasets from buildings named TIE1, SAH1 within TUT are provided in the database. All data were recorded on the same smartphone. In building TIE1, 613 APs were detected and in building SAH1, 775 APs were detected during RSS measurements. For both buildings radio maps and test datasets are available in the database. This dataset is a valid source of multibuilding Wi-Fi fingerprinting data. The large number of detected APs, enables scalability analysis prospects. Despite the utility of this dataset, device heterogeneity in the data is lacking.
The UJI dataset [36] provides comprehensive long-term Wi-Fi fingerprinting data collected over 15 months. Wi-Fi RSS data were recorded and labeled using a smartphone. Overall 448 APs were detected in the measurement activity at two floors of the library in the Universitat Jaume I Spain, covering an area of 308 m2. The long-term data variations were captured by measuring training and test data on specific days in each month. Since the availability of the first version 1.0 in 2017, several subsequent versions of the database have been provided. Version 2.2 posted in 2020, is the latest version available. All previous and latest versions of the dataset along with various programming scripts for data processing and positioning algorithms are available at [25]. The dataset is a good contribution of long-term Wi-Fi data, thereby enabling a multitude of temporal analyses. However, device heterogeneity and dual-band data are however unavailable in the dataset.
The JUIndoorLoc [37] dataset also provides Wi-Fi RSSI data for indoor fingerprinting positioning. RSSI data were collected using four Android devices, at three floors within a five-floor building of Jadavpur University, India. Temporal variations were recorded by hourly repeated measurements taken for eight hours. Training and test data from 172 APs were recorded over a total period of 31 days. In addition to time-stamped location, RSSI, AP ID, and device ID, contextual attributes like open/closed room door and human presence/absence were also recorded. The multidevice, contextual dataset is accessible at [26]. The recording of human influence on received Wi-Fi data with temporal variations provides real world scenario testing possibility for fingerprinting based positioning algorithms and systems. However, access to dual-band data is lacking in the dataset.
The Escuela Técnica dataset [33] provides Wi-Fi data collected at two floors of the Escuela Técnica Superior de Ingeniería Informática building, in Spain. Within the building, Cisco Aironet™APs are installed. The two floors have structural similarity but the locations of APs installment is not similar. Training and test data were acquired using two smartphones. All recorded RSSI samples were labeled with AP ID, device ID, frequency band and location data. The open access data are archived at [27]. This dataset pioneers in terms of Wi-Fi device homogeneity within the multifloor indoor environment, coupled with labeled dual-band data availability. However, the adaptability of homogeneous Wi-Fi network data across floors is significantly limited due to presence of spatial impairments such as asymmetric locations of deployed APs.
Indoor positioning is also conveniently implemented on multisensor or hybrid [42] technologies. Therefore, in several databases Wi-Fi data are available in addition to data from other sensors. Certain databases have been generated for competitions conducted under the International Conference on Indoor Positioning and Indoor Navigation (IPIN). In general, the IPIN datasets [43,44,45,46,47] provide data recorded on multiple sensors of smartphones including Wi-Fi, collected from various indoor environments. Within the IPIN datasets [45,46,47], operating frequency measurements of detected Wi-Fi APs are also provided. The source code of application ‘GetSensorData’, used to acquire the IPIN datasets has also been made public access [48]. Data recorded from Wi-Fi and magnetic sensor for indoor localization are archived in [49,50]. Semi-autolabeled [51] data of Wi-Fi and Inertial Measurement Unit (IMU) on multiple smartphones are provided in the giaIndoorLoc [52] dataset. The giaIndoorLoc dataset includes raw Wi-Fi RSSI data in addition to the radio map. Raw Wi-Fi and BLE data for hybrid fingerprinting [29] are archived in the Hybrid-fingerprint Data with Layout Change (HDLC) dataset [53]. Miskolc [54] is another hybrid dataset comprised of Wi-Fi, Bluetooth, and magnetometer data of smartphones.
Certain other open access datasets, with data from Bluetooth Low Energy (BLE) beacons, applicable to indoor positioning are also available [55,56,57]. Furthermore, a comprehensive review of open access BLE datasets is provided in [57]. A magnetic sensors based free access dataset [58] has also been archived for indoor positioning. A list of publicly available databases/datasets for indoor fingerprinting positioning, along with the associated works, is reported in Table 2.
Table 2.
Relevant open access datasets for indoor positioning and associated works.
3. Data Collection Methodology
This section explains details of the indoor environment in which the data were collected. The practical data acquisition setup and procedure applied for Wi-Fi RSSI acquisition are also presented.
3.1. The Indoor Environment
The Wi-Fi RSSI measurements were collected at four residential buildings within the Johor campus of Universiti Teknonlogi Malaysia (UTM). Wi-Fi RSSI data were collected in multiple corridor wings at multiple floors. The four buildings were considered as two pairs of similar buildings. Prior to further elaboration of similarity between buildings, relevant structural details are presented. The quantity of Wi-Fi Access Points (APs) installed in each building, along with structural information of all buildings are summarized in Table 3. It must be noted that, numbers assigned to buildings (as in Table 3) are consistently used as identifiers in the database as well as, in this work.
Table 3.
Structural and APs related information of the four buildings, from where Wi-Fi RSSI data were acquired.
The utility and relevance of Wi-Fi data collected within an indoor environment are significantly degraded in other localities. According to the study [28], the major reasons are the random asymmetries generated in wireless channels by device and spatial impairments. Other studies [23,29] have demonstrated the adverse effect of layout variations on indoor positioning accuracy. Therefore, two different multibuilding residential complexes were carefully selected for data collection, targeting generation of data that is useful across floors and buildings. The rationales for selection of the buildings include:
- The two residential complexes selected, have 5–6 similar, multifloor and multiwing buildings in each complex
- In all buildings of both complexes, perfect Wi-Fi device homogeneity is present. All Wi-Fi access points, preinstalled in all of the buildings are the same device and model
- All preinstalled APs are dual-band devices operating at 2.4 GHz and 5 GHz bands. In all buildings, the APs are connected to the same Wi-Fi network, with a unique Service Set Identifier (SSID). Due to this feature, high data integrity is ensured as interferences from hot spots and intermittent sources are eliminated
- The multiple similar buildings in both complexes possess very high spatial symmetry. Within all similar buildings, the APs are installed at the same locations
- The perfect network devices homogeneity and very high spatial symmetry promote the collection of repeatable Wi-Fi data within and across buildings
- The two selected pairs of buildings also represent two distinct scenarios. One pair is of closely located buildings, such that they lie within typical coverage range of Wi-Fi AP. The second pair has buildings farther away from each other than typical Wi-Fi coverage range
Comparative to the typical coverage range of a Wi-Fi Access Point (AP), the buildings F03 and F04 are in close proximity of each other, whereas CX1 and CY2 are much farther apart. Wi-Fi RSSI data were collected at two floors each of buildings CX1 and F04. From the other buildings CY2, F03 data of only one floor were recorded. Training as well as test data were recorded at CX1, F04 buildings whereas, only test data samples were collected at CY2, F03 buildings. The multiple wings on a floor are named as wings A, B, C. The floors and wings of each building at which data were recorded are tabulated in Table 4.
Table 4.
Summary of basic data collection related information of each building.
Following the typical terminologies of indoor fingerprinting positioning, a Reference Point (RP), signifies a position with known location coordinate(s) or distance. Training data are therefore collected at Reference Points (RPs), to acquire pertinent data at known locations. For this database, the RPs in each wing (corridor), were taken as the distance from a specific ‘zero-distance location/point’. The zero-distance points for each floor-wing, were selected in a manner that all RPs would only be towards one side of the zero-distance point. The data acquisition activity ensured social distancing along with minimum disturbance in common areas, such as lobbies, sitting arrangements, balconies, hallways, and entrances of family residences. Therefore, certain unsuitable areas were excluded. RPs were marked at every one meter (i.e., RP spacing = 1 m). Test Points (TPs) were marked at random distances/positions other than RPs. Test data were recorded at all TPs and RPs, whereas additional training data were captured at all RPs. In context of this database and throughout this paper, the terms ‘position’ and ‘distance’ are synonymous as all positions (either RPs or TPs) are represented by relative distance from the respective zero-distance location. The floor layout of buildings F03 and F04 is presented in Figure 1.
Figure 1.
Illustration of the floor layout of buildings F03 and F04. All wings of floor 3 of F03 and all wings of floors 3,4 of F04 have the reported layout. The figure is not drawn to scale.
The AP available in each wing was preinstalled at the specific location. From Figure 1, it is evident that the deployment of an AP targeted network coverage to apartments present within the wing. The data collection Reference Points (RPs), as illustrated in Figure 1, cover the three corridors, one in each wing. Furthermore, Wi-Fi data were also captured at a significant portion of the central open space. More precisely, the RPs and TPs beyond RP#18 are located beyond the narrow corridor walls of each wing. Training and test data were collected at 18 different locations in the central open areas on two levels of building F04. Figure 2 illustrates the floor layout of the buildings CX1 and CY2.
Figure 2.
Illustration of the floor layout of buildings CX1 and CY2. All wings of floor 3,5 of CX1 have the reported layout. Floor 6, wing A, building CY2 has the same layout as wing A, floor 3/5 building CX1. The figure is not drawn to scale.
The APs available in each wing and floor were preinstalled at the specified locations. From Figure 2, it is evident that the APs installment targeted wireless network coverage to resident rooms present within the wing. The buildings CX1 and CY2 have two wings on each floor. In building CX1, the central spaces connecting both wings were not feasible for data recording, as they were dedicated for common seating, dining, laundry, and indoor recreational activities on several floors.
The Table 5, Table 6 and Table 7 are furnished to list locations of all RPs and TPs in all buildings. The notation ‘1:n’ means all integer values from 1 to n. As an example 1:5 would be the short form of 1,2,3,4,5.
Table 5.
Details of reference and test points within building 1 (F04).
Table 6.
Details of reference and test points within building 2 (CX1).
Table 7.
Details of test points within building 3 (F03) and 4 (CY2).
3.2. Symmetry of the Environment
Each pair of buildings has a specific similarity and symmetry. The building pair F03, F04 has the same structure, same number and locations of deployed Access Points (APs) in each wing and floor. The other pair CX1, CY2 has the same structure and an alternate symmetry of deployed APs in each wing and floor. Precisely, the number and locations of installed APs has two configurations, one shared by odd floor numbers and the other common to even floor numbers. Except a few wings, the AP deployment configuration of both building pairs is same. All the APs installed in the four buildings are the same device (RUCKUS® R610 [63]) and are connected to the same wireless network. Due to this fact, we also were able to ensure no data collection from intermittent or unwanted sources such as hotspots. All APs are installed at the ceiling having a relative floor clearance of around 1.95 m.
To further elaborate the similarity and symmetry of the building pairs, the access points deployment configurations of both buildings is illustrated. Figure 3 presents the AP deployment configuration on the floors at which data were recorded in buildings CX1 and CY2.
Figure 3.
Floor maps of buildings CX1 and CY2, illustrating symmetry in AP deployment.
The layouts of floors 3, 5 of building CX1 and floor 6 of building CY2 are presented in Figure 3. The symmetry of AP deployment in the three floors of both buildings is evident from the Figure 3. The quantity and location of APs in wing A of the three floors are the same. Similarly, the locations and number of APs in wing B of the floors shown are the same.Therefore, due to the multibuilding and multifloor symmetry, training data of one building could be used for model/algorithm development for evaluation on test data of the other building. In this way training data were recorded in building CX1 and not in CY2. The similarity and symmetry of buildings F03 and F04 is illustrated by the floor maps given in Figure 4.
Figure 4.
Floor maps of buildings F03 and F04, illustrating symmetry in AP deployment.
The deployment of APs on floors 3, 4 of building F04 and floor 4 of building F03, is illustrated by the floor maps provided in Figure 4. It is evident that one AP is installed at the same location in wings A, B, and C of all floors in both buildings. Due to this similarity and symmetry, training data were recorded in building F04 and not in F03.
3.3. Data Acquisition Procedure
In order to acquire labeled RSSI data, two separate measurement and collection campaigns were executed as delineated in subsequent sections.
3.3.1. Identification of Access Points
All access points installed within all buildings were identified using two Android smartphones running a free Wi-Fi analysis application. The freely available Android Application ‘WiFi Analyzer’ [64] was leveraged for identification of all preinstalled APs in the four buildings. This application is capable of displaying information of detectable 2.4 GHz and 5 GHz Wi-Fi networks. Identification of an AP was carried out by running the Android application when the smartphones were at the closest possible vicinity to the particular AP. The MAC address of the AP showing highest signal strength (RSSI) on the application (of both smart phones) was noted and identified. All deployed access points were identified as dual-band, operating in 2.4 GHz and 5 GHz frequencies. A screenshot of the Android application used, is reported as Figure 5.
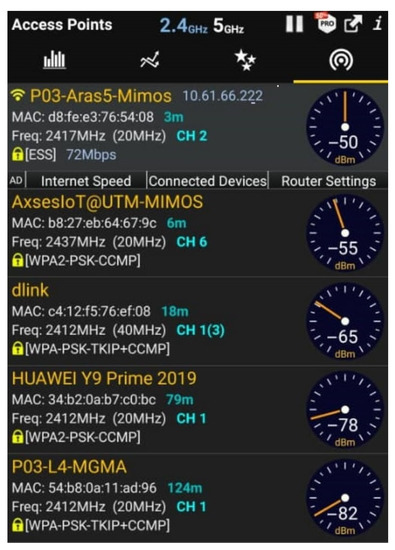
Figure 5.
Screenshot of the Android application, WiFi Analyzer used for AP identification and labeling.
As mentioned earlier, all access points installed operate in 2.4 GHz as well as 5 GHz, with separate MAC for both bands. Therefore, the identified APs were further labeled by assigning descriptive unique dual-band MAC addresses. The descriptive MAC addresses were formulated as per the scheme illustrated in Figure 6.
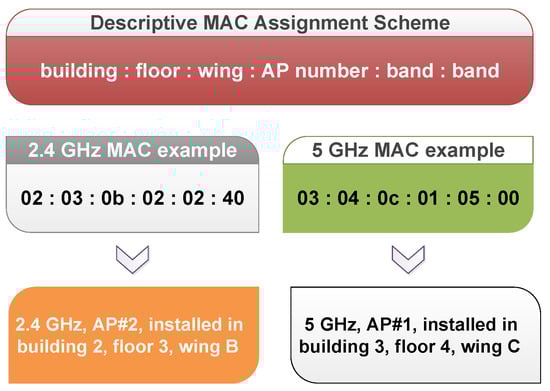
Figure 6.
Descriptive dual-band MAC address labeling scheme.
Using the scheme as in Figure 6, look-up-tables for mapping between actual and labeled MAC were maintained. The main advantage and motivation of the MAC addresses assignment scheme is to enable generation of radio map of a building using training data of that building’s other pair. The total quantity of APs identified in the procedure are reported buildingwise in Table 8.
Table 8.
Details of access points identified and installed within each building.
Table 9 provides all possible values of individual octets within the descriptive MACs, assigned to identified dual-band MACs of installed access points.
Table 9.
Details of octets within descriptive MACs assignment methodology, along with valid values.
It must also be noted that during recording of RSSI data, MAC addresses other than those identified within buildings were detected. Further details regarding handling and mapping of such (out of buildings) data sources are reported in Section 3.3.2. The access points identification activity was performed a day prior to the RSSI data acquisition procedure.
3.3.2. Dual-Band Wi-Fi RSSI Data Collection
A custom developed MATLAB® based application was used to capture, labeled training and test dual-band Wi-Fi RSSI data on two laptop devices, in selected floors and wings (as in Table 4) of all buildings. Pertinent details regarding the data recording setup are furnished in Table 10.
Table 10.
Details of hardware and software setup utilized in Wi-Fi RSSI data collection.
The data acquisition application was developed to systematically capture, label, organize, and store RSSI data, ensuring convenience for prospective research works. Figure 7 is a sample snapshot of the specifically developed data acquisition application’s Graphical User Interface (GUI).
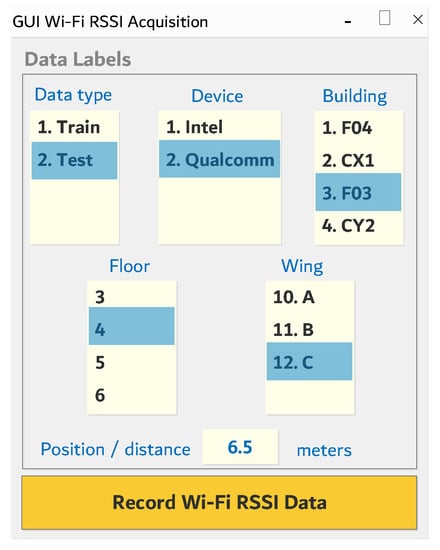
Figure 7.
Snapshot of customized MATLAB®-based data acquisition GUI.
The data acquisition application captured RSSI data of Wi-Fi APs by, invoking a Windows® system command available for wireless networks analysis. A snapshot of the exact MATLAB® command incorporated in the recording application is provided in Figure 8.

Figure 8.
MATLAB® command used for Wi-Fi RSSI data acquisition.
If invoked once, the command as in Figure 8 would return information of all wireless networks detectable at that instant, to the variable ‘wifi_data’, in textual format. However, if the device is however connected to any wireless network, only information of that particular network will be returned. Network name, MAC address, and signal strength of each detected source are included in returned information. The signal strength is provided as a percentage value. As per Windows® documentation [65], a 100% signal strength is equivalent to RSSI of −50 dBm (decibel-milliwatts). Additionally, 0% signal strength corresponds to −100 dBm RSSI. Furthermore, as per [65], the linear interpolation mathematical relation for conversion of signal strength n (%) to RSSI (dBm) value is given in Equation (1).
The conversion relation as per Equation (1) was duly implemented in the data acquisition application, to properly record instantaneous Wi-Fi RSSI values. Since the command shown in Figure 8, provides the output in text format, requisite text processing functionalities were also implemented in the data acquisition application to extract pertinent data and information.
Along with extraction of RSSI data, the application also discarded unwanted or intermittent sources such as hot spots. This was mainly possible due to the fact that, all APs installed in all buildings had the same network name. The labels and data attributes recorded in each sample by the acquisition application are reported in Table 11. Further details of values/units of data and labels are furnished in Section 4.
Table 11.
Data attributes and labels recorded during Wi-Fi RSSI data acquisition procedure.
At each Reference Point (RP), data recording was performed for 3–4 min, whereas 2–3 min data acquisition was executed at each Test Point (TP). In total, over 10 h of data acquisition on each device (laptop) was carried out and archived in the database. Acquisition of data within a single wing was completed in one session. The data collection procedure spanned forty days in the months of March and April 2022, where on several days no recording activity was done. The details of exact training and test data samples captured across all buildings are reported in Table 12.
Table 12.
Details of total RPs/TPs and total test and training data samples recorded on each device, within each building.
As a preliminary analysis on acquired data, we listed all MAC addresses detected during RSSI data recording (on the laptops), and compared them to the APs/MACs gathered from the identification activity (as reported in Section 3.3.1). From the recorded data of each building we noted the detection of several MACs, not present in the maintained lists. This analysis indicated that, valid RSSI samples were also detected from other nearby buildings. Since valid RSSI data were acquired from other buildings, the source MACs had to be recorded with a separate scheme than as given in Figure 6. Therefore, all such detected APs/MACs had to be labeled differently. Consequently, the first octets of such MACs were assigned according to the particular building where the MACs were initially detected. The values 11, 22, 33, and 44 were assigned to the first octets for MACs detected in buildings 1 (F04), 2 (CX1), 3 (F03), and 4 (CY2) respectively. We reemphasize and reiterate that this scheme is for those MACs that are not installed within the four buildings of interest, but were detected during RSSI data collection. Table 13 lists down all possible values of individual octets within the descriptive MACs, assigned to, out of buildings detected dual-band MACs.
Table 13.
A listing of all valid values of octets within the descriptive MACs, assigned to out of buildings detected dual-band sources.
4. Data Description and Analysis
In this section, organization of the dataset along with description of contents necessary for prospective research using the data are reported. Additionally, buildingwise analysis of recorded data is also presented. Firstly, the quantity of access points and band-wise MACs detected in all buildings is reported in Table 14, to facilitate the understanding of subsequent data descriptions.
Table 14.
The number of APs and frequency-wise MACs detected in each building during the Wi-Fi RSSI data recording.
In comparison to the number of APs installed within the buildings as given in Table 8, it is evident that the number of detected source APs are higher for each building. This shows that APs from other surrounding buildings were also detected throughout the data recording activity. It is reiterated that, out of building detected APs had the same network name, and therefore most probably were not hot spot or intermittent sources.
4.1. Data Organization
The complete dataset is archived in one root directory named UTMInDualSymFi. All of the data are categorized into radio maps and raw data subdirectories. The radio maps are generated by certain processing applied on training data. Overall, two kinds of file types are available in the dataset. Firstly, all ‘.csv’ files contain the Wi-Fi RSSI data in numerical format, that are conveniently accessible using programming or development tools such as Python®, MATLAB®, etc. The remaining files are ‘.txt’ files, that contain metadata and descriptions explaining data in the ‘.csv’ files.
The data within the ‘Raw Data’ directory is further arranged into buildingwise and devicewise folders. Therefore, access to data of particular building or device is facilitated. Furthermore, considering the ‘Raw Data’ folder as ‘Level (depth) 1 directory’, the actual data files are archived in ‘Level 5’ directories. The following list further illustrates the organization of raw data files:
- Raw Data→Building→Device→Frequency/band→Data type
- Raw Data→Device→Building→Frequency/band→Data type
Figure 9 illustrates the directories (with exact names) into which the raw data is arranged into at each level.
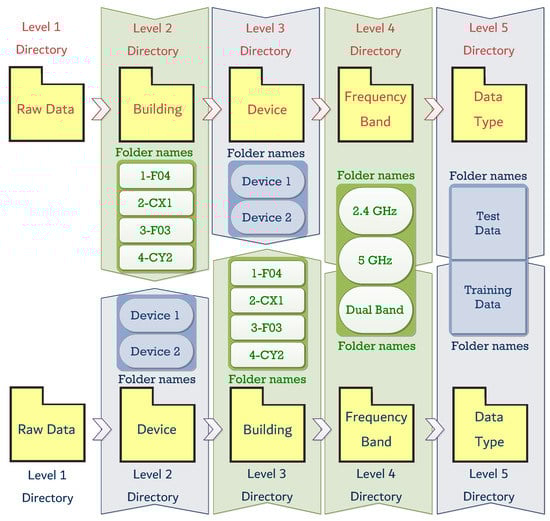
Figure 9.
Illustrating the organization of raw data into subdirectories.
All individual directories shown at any level in Figure 9, contain all folders (and data) shown at subsequent later levels. Since, the raw data files are categorized by building and device, specific data can be accessed using two different directory path options. At the final level, however, data (files) accessed by both paths would be the same. As an example, in order to access the raw data files corresponding to 5 GHz test data of device 2 in building 3, either of these two paths could be utilized:
- Raw Data→3-F03→Device 2→5 GHz→Test Data
- Raw Data→Device 2→3-F03→5 GHz→Test Data
4.2. Raw Data Description
The raw recorded Wi-Fi RSSI data are stored in two ways:
- Individual .csv files: Raw data belonging to only one position (RP or TP) are stored in individual .csv files. These individual files are actually source data files generated by the acquisition application. All such files have unique names
- Combined .csv files: Raw data recorded at all positions for a particular scenario (building, device, frequency, data type) are appended into a single .csv file. All such files are named as ‘All_pos_data.csv’
The individual data files and combined file of a certain scenario are stored in the same directory corresponding to that particular scenario. The naming convention used to archive the individual raw data files is illustrated in Figure 10.
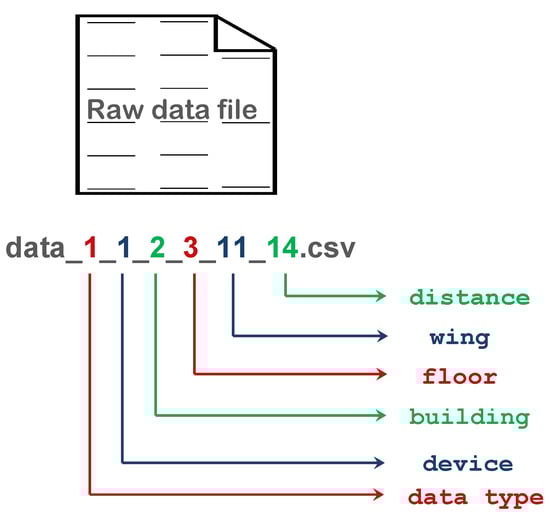
Figure 10.
File naming convention applied to individual raw data files.
The fields within the individual file names (as illustrated in Figure 10) can have certain valid values, which are listed and described in Table 15. Therefore, the example file name shown in Figure 10 corresponds to the training data recorded on device 1, at RP 14 on floor 3, wing B of building 2 (CX1).
Table 15.
Possible values and description of individual raw data file name fields, as illustrated in Figure 10.
The raw data samples within an individual or combined data file are organized in the same manner. One row within a file contains one complete data sample. Each data sample is basically constituted by three components:
- Full numerical timestamp
- RSSI from each source
- Recording scenario labels (numerical)
In each file, the RSSI data values are sandwiched between six columns of timestamp information and six columns of scenario labels. Since the number of valid sources detected in each building is different (as given in Table 14), the data corresponding to each building is necessarily arranged into different number of columns (denoted here as Ntc). We also denote the number of valid sources (MACs) for that particular building as M. Table 16 elaborates the columnwise data contents recorded in raw data files.
Table 16.
Description of contents within each column of raw data .csv files. Valid for individual and combined data files.
From Equation (1) it is known that valid RSSI values range between −100 dBm and −50 dBm inclusive. However, at many locations certain APs are not detected, and therefore RSSI value of 100 dBm is assigned to mark the nondetection. The same convention for indication of nondetection is used in currently available databases as [34,36]. Table 17 further lists the total number of columns in raw data files corresponding to each building and bandwise combinations.
Table 17.
List of total MACs and data columns associated with raw data files of each building and frequency band.
4.3. Radio Maps Description
In total there are twelve radio map files within the Radio Maps directory. Since training data were only recorded in two buildings, the radio maps also correspond to buildings F04 and CX1. Figure 11 illustrates the naming convention used to name radio map data files.
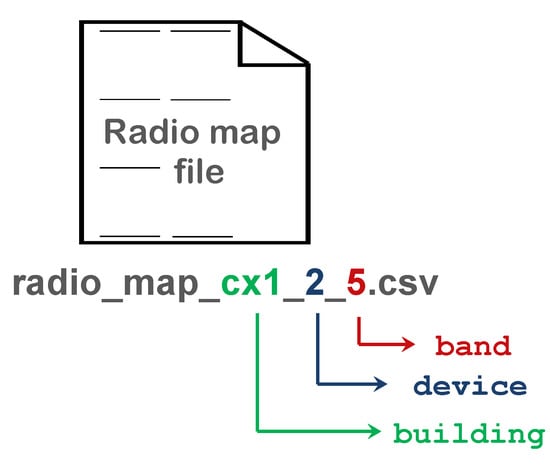
Figure 11.
File naming convention applied to radio map files.
The possible file naming options with descriptions are listed as:
- building: f04 for F04; cx1 for CX1
- device: 1 for device 1; 2 for device 2
- band: 24 for 2.4 GHz; 5 for 5 GHz; dual for dual-band
The contents within a radio map slightly differ from the raw data files. Within the radio maps, the timestamp information and corresponding columns are not present. Therefore, a radio map data sample (one row) contains RSSI values followed by six columns of scenario labels. The RSSI and scenario labeling conventions given in Table 16 are also applicable to data within radio map files. However, the column numbers are different, as the first column in radio map data represents the RSSI from first source. In other words, if the number six is subtracted from column numbers seven and onward (as in Table 16), the resultant numbering would correspond to column numbering of radio maps data. Furthermore, the total number of columns within each radio map file is readily found by addition of six to values of (M) given in Table 17 of buildings 1 (F04) and 2 (CX1).
4.4. Metadata Description
Metadata in the form of ‘.txt’ files provide important information required for proper usage of provided data. The .txt files in any directory describe pertinent information of data files available in that particular directory and subdirectories within it. All the .txt files have self explanatory names that describe what aspect of the data or dataset is explained by that file. The metadata available are of two types:
- MACs files: Files with ‘MACs’ in their name, list the descriptive MACs. The file names also include building and frequency information. Therefore, these .txt files contain a list of descriptive MACs corresponding to a building and frequency band as per their respective file name
- Columns descriptor files: Files with ‘columns descriptor’ in their name, provide details of contents in data (raw and radio map) files. Specifically, a full list of all column numbers and corresponding content is given in these metadata files.
4.5. Data Analysis
The comprehensiveness of UTMInDualSymFi dataset manifests the potential of profound multiperspective and multiapplication analyses. In this section we only present a preliminary analysis on the training data recorded at two buildings F04 and CX1. Specifically, the analysis presented is the median RSSI (dBm) values of all MACs recorded at all Reference Points (RPs) on all floors and wings. The median RSSI values are presented as power maps [23] (illustrated as color maps) where lighter colors/shades represent higher RSSI. The device and band wise power maps of median RSSI values, at all RPs in building CX1, are reported in Figure 12, Figure 13, Figure 14 and Figure 15.
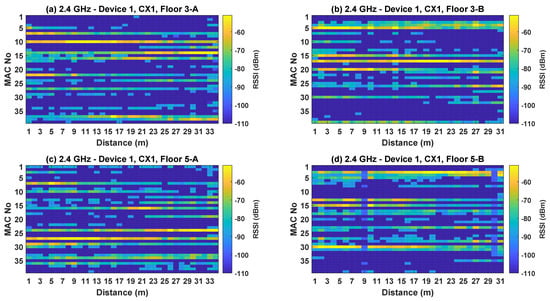
Figure 12.
Power map representation of median RSSI at all distances from all sources within, 2.4 GHz training data, of device 1, in building CX1, at floor-wing (a) 3-A (b) 3-B (c) 5-A (d) 5-B.
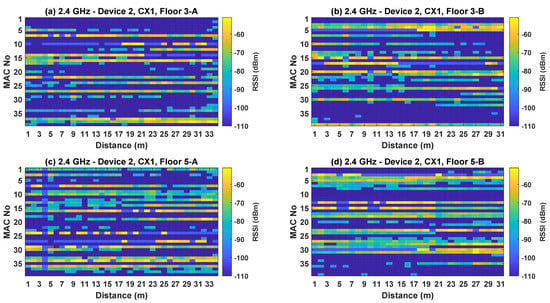
Figure 13.
Power map representation of median RSSI at all distances from all sources within, 2.4 GHz training data, of device 2, in building CX1, at floor-wing (a) 3-A (b) 3-B (c) 5-A (d) 5-B.
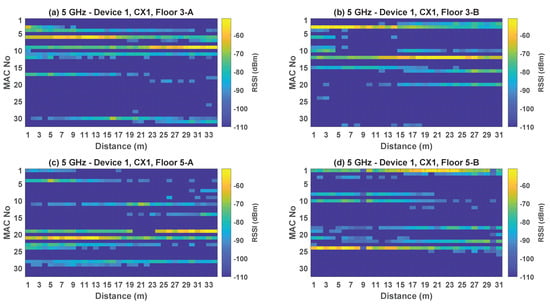
Figure 14.
Power map representation of median RSSI at all distances from all sources within, 5 GHz training data, of device 1, in building CX1, at floor-wing (a) 3-A (b) 3-B (c) 5-A (d) 5-B.
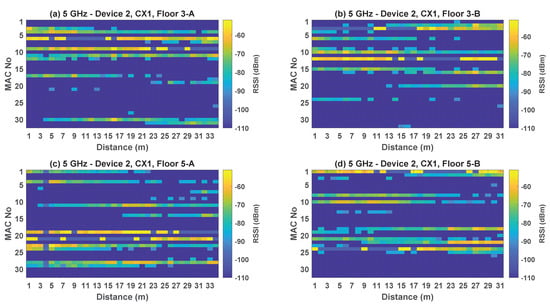
Figure 15.
Power map representation of median RSSI at all distances from all sources within, 5 GHz training data, of device 2, in building CX1, at floor-wing (a) 3-A (b) 3-B (c) 5-A (d) 5-B.
The power maps given in Figure 12, Figure 13, Figure 14 and Figure 15 signify that within a particular floor-wing, the highest RSSI values were recorded from APs of that specific floor and wing. The power maps also show that in general, RSSI values from APs at one upper and lower floor in the same wing are higher than RSSI values from APs on the same floor but in a different wing for a given location. These observations apply to data across devices and frequency bands. The analysis was performed and validated using the descriptive MACs provided in metadata (.txt) files.
The power maps also signify the adequate coverage provided by the preinstalled APs. Within any wing, the positions in close proximity to APs, exhibit RSSI values of −55 dBm or higher. The analysis of data recorded from the APs manifest, suitability for indoor positioning applications. Following the data analysis scheme used for building CX1 data, the power maps corresponding to building F04 training data are illustrated in Figure 16, Figure 17, Figure 18 and Figure 19.
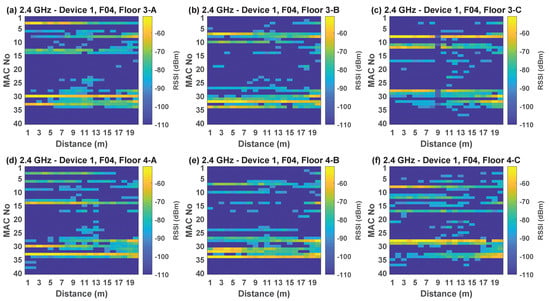
Figure 16.
Power map representation of median RSSI at all distances from all sources within, 2.4 GHz training data, of device 1, in building F04, at floor-wing (a) 3-A (b) 3-B (c) 3-C (d) 4-A (e) 4-B (f) 4-C.
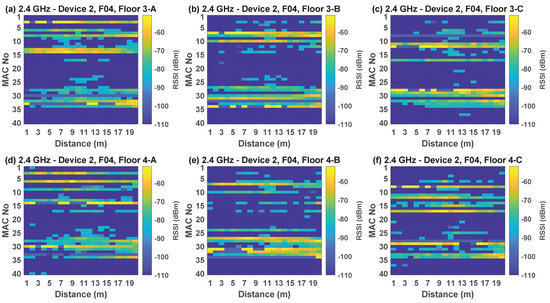
Figure 17.
Power map representation of median RSSI at all distances from all sources within, 2.4 GHz training data, of device 2, in building F04, at floor-wing (a) 3-A (b) 3-B (c) 3-C (d) 4-A (e) 4-B (f) 4-C.
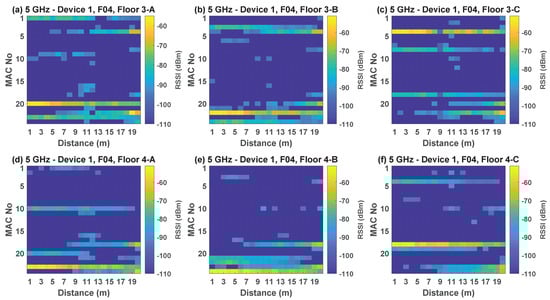
Figure 18.
Power map representation of median RSSI at all distances from all sources within, 5 GHz training data, of device 1, in building F04, at floor-wing (a) 3-A (b) 3-B (c) 3-C (d) 4-A (e) 4-B (f) 4-C.
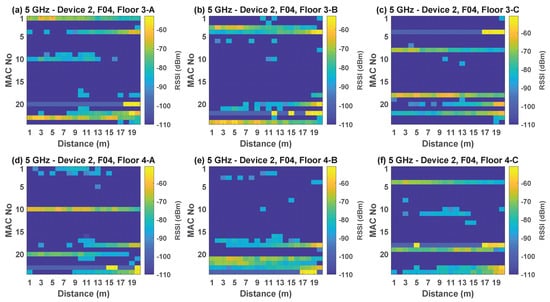
Figure 19.
Power map representation of median RSSI at all distances from all sources within, 5 GHz training data, of device 2, in building F04, at floor-wing (a) 3-A (b) 3-B (c) 3-C (d) 4-A (e) 4-B (f) 4-C.
The power maps of building F04 data shown in Figure 16, Figure 17, Figure 18 and Figure 19 exhibit certain parallels and variations in findings from the CX1 data analysis. In each floor-wing of F04, the AP of that specific floor-wing has the greatest RSSI, as observed with CX1 data. Unlike the CX1 data analysis, APs on the same level but in a different wing exhibit greater RSSI than APs on the same wing in one upper and lower floors at 20% to 25% of locations. RSSI values from APs at one upper and lower floor in the same wing are greater than RSSI values from APs on the same floor but in a different wing at majority locations of a wing (75% to 80%); which is analogous to the CX1 data analysis. All mentioned observations apply across data of both devices, frequencies, and are validated using the descriptive MACs.
Figure 20 shows the mean RSSI values recorded at each RP in floor 3 of building F04. A similar mean RSSI representation for floor 4 of building F04 is reported in Figure 21.
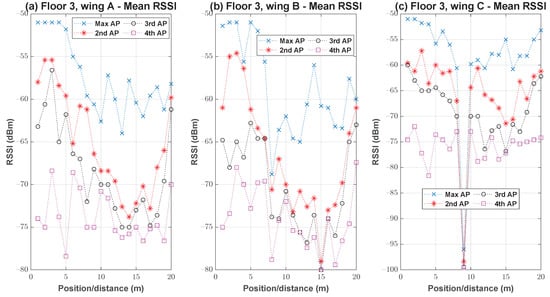
Figure 20.
Position-wise mean RSSI values of four APs with highest RSSI in 2.4 GHz training data, of device 1, in building F04, at floor-wing (a) 3-A (b) 3-B (c) 3-C.
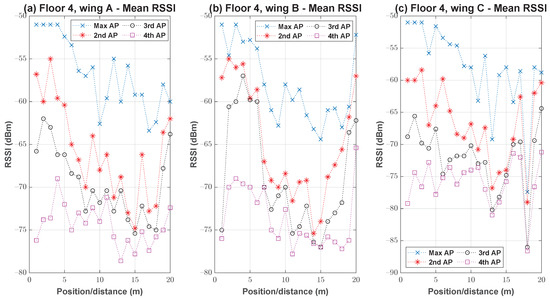
Figure 21.
Position-wise mean RSSI values of four APs with highest RSSI in 2.4 GHz training data, of device 1, in building F04, at floor-wing (a) 4-A (b) 4-B (c) 4-C.
The sub-figures within Figure 20 and Figure 21 report the position wise mean RSSI values recorded from the four APs exhibiting highest signal strengths. In each wing of building F04, the positions RP#19,20 lie in the central open space. In all subfigures corresponding to both floors and all wings, it is observed that RSSI values at RP#19 and 20, are higher than at preceding positions for all APs. It is therefore clear that AP coverage is better at the open spaces as compared to some positions within the corridor. Previous works [66,67] have shown that improvement in positioning accuracy within corridors or open spaces is mainly dependent on AP coverage. Hence, for this building, comparable or better positioning accuracy could be expected in open spaces than corridors.
5. Radio Maps Generation and Baseline Evaluation
In this section, the proposed algorithm leveraged to generate the radio maps provided in the dataset is described. Additionally, a typical use case of the dataset in the form of implementation of a fingerprinting positioning algorithm is presented.
5.1. Statistical Windowed Radio Map (SWRM) Algorithm
A radio map models characteristics of wireless network within a deployment area. The positioning algorithm utilizes information provided in the radio map, to estimate a position from unseen test data. Furthermore, a radio map construction algorithm should characterize temporal variations within recorded training data [68,69]. Traditionally only the mean or median RSSI value of all recorded samples at a certain RP is stored in the radio map. However, it is also known that radio maps with multiple values representing variations in RSSI, are a contributing factor in accuracy and precision improvements [69]. Therefore, the objective of the proposed SWRM algorithm is to statistically extract multiple data samples that characterize the temporal variations within the recording duration. More specifically, samples are statistically selected from training data of each RP and stored in the final radio map.
We denote the RSSI training data of a particular building as . The number of sources (MACs) present in the data (of the considered building) are M. The total number of RPs (at all floors and wings) are denoted by P. then denotes the total samples recorded at all positions. In this way is arranged as rows and M columns. Each column corresponds to the RSSI of a particular source (MAC). Therefore, the first row of contains the first RSSI samples of each MAC recorded at the first RP. is the number of samples available for RP x.
The RSSI training data corresponding to any RP x is denoted as . In matrix form, the dimensions of is , and is represented in Equation (3).
where refers to the training sample number b of MAC-a at position x. A single row within represents one training data sample at position x. From the data in , S certain rows are to be inserted in the radio map. The SWRM proposes a statistical, samples selection criteria in order to characterize the temporal variations in RSSI data. The samples selection is initiated by arranging the data of into S number of sample windows. Each window is a fragment of consecutive samples from the data. From each window of samples, the central sample is appended to the radio map . Therefore, at regular intervals a sample would be stored in the radio map. Since actual samples are extracted at uniform time intervals, temporal variations within RSSI data are characterized in the radio map. Furthermore, since averaging or sorting processes on training data are not required, computational efficiency of SWRM is ensured. In order to extract samples at regular intervals, is arranged as S windows each having W samples. The parameter W is defined in Equation (4).
Since W represents the number of samples in each window, it can only have positive integer values, hence integer division is used for implementation of Equation (4). The time between sample extractions is determined by Equation (4) based on the chosen value of S. Therefore, the variations needed to be included in the radio map may be controlled by changing the value of S in Equation (4). Different values of S might be employed under various environmental situations based on the variances in the data. Larger values of S might be applied if high temporal variations are observed or anticipated. However, arbitrarily high values of S would reduce the computational efficiency of the positioning algorithm. A previous study found that values of S greater than ten are not feasible [69].
To extract the central samples from each window the central index, is computed. From the matrix, S samples have to be appended to the radio map . The process is firstly exemplified and then formalized. If the number of training samples at position x i.e., is 80, and S is 4, then W would be 20. So from 4 windows of 20 consecutive samples each, the 10th () sample from each window would be stored in . With respect to the sample numbering of , sample numbers 10, 30, 50, and 70 would be taken and included in the radio map. A central sample extracted from is denoted as , which represents the central sample extracted from window number y of MAC-a, at position x. With known values of S, W, and C, is obtained by taking the sample , from . Considering the example values of , S, and W as above, the central samples extracted for position 1, MAC-1 and all windows are given as:
The samples extracted from all windows of all MACs at position x, are placed in the matrix , which is represented in Equation (5).
After appending central samples of all windows from all positions, the final form of the Radio Map is expressed in Equation (6).
Therefore the final dimensions of are . The radio maps in the dataset were generated using SWRM with value of . The proposed SWRM algorithm for radio map generation is also illustrated as the flowchart depicted in Figure 22. The related pseudocode for implementation of SWRM algorithm is also given as Algorithm A1 in Appendix A.
Figure 22.
The flowchart representation of proposed SWRM algorithm.
5.2. Radio Maps Generation of Buildings CY2 and F03
Since training data were not collected from the buildings CY2 and F03, a method to generate their respective radio maps from available ones is discussed in this section. We discuss a simple method of generating radio maps using the descriptive MACs and available radio maps of buildings CX1 and F04. The radio maps of CY2 and F03 are generated using radio maps of CX1 and F04 respectively.
- Discard data of floor 3 from radio maps of CX1 (rows 1–325) and F04 (rows 1–300). Also discard data of floor 5, wing B from CX1 radio map (rows 496–650)
- The fourth last column is the label for building in the radio maps. Replace existing building label with values 3 and 4 respectively, in modified F04 and CX1 radio maps of the previous step
- The third last column is the label for floor in the radio maps. Replace existing floor label with value 6, in modified CX1 radio map of the previous step
- For CX1 modified radio map, increment the floor label (second octet, Table 9) within the descriptive MACs by one
- Ignore the building identifier, in the descriptive MACs (first octet) of modified CX1 and F04 radio maps. Also ignore the the building identifier, in the descriptive MACs (first octet) of CY2 and F03 test data
- Rearrange the order of RSSI data columns in modified CX1 radio map according to the order of RSSI data columns in CY2 test data. The rearrangement is leveraged by matching the modified descriptive MACs from the previous step
- Rearrange the order of RSSI data columns in modified F04 radio map according to the order of RSSI data columns in F03 test data
- The modified CX1 map is the radio map for CY2. The modified F04 map is the radio map for F03
The above stated methodology was implemented to generate dual-band radio maps for buildings CY2 and F03. The fingerprinting positioning accuracy for the two buildings is further discussed in Section 5.3. Due to availability of all recorded raw training data (within the dataset), radio maps could also be generated with other existing or novel methods.
5.3. Baseline Evaluation – Fingerprinting Positioning Accuracy
The K-Nearest Neighbors (KNN)-based positioning method is commonly utilized as a performance benchmark for indoor fingerprinting studies [32] and baseline analyses of indoor positioning-related datasets [36]. Therefore, to formulate the performance baselines of the presented dataset, the K-Nearest Neighbors (KNN)-based fingerprinting algorithm [70] is implemented and evaluated. The KNN based fingerprinting algorithm is implemented using the radio maps and test data of all buildings. The algorithm basically finds the k closest samples within the radio map in comparison to a test sample, repeated for all test samples. Floor and wing are classified as the mode of the closest samples’ floor and wing. The final position/distance is estimated as the mean of positions associated to the nearest determined samples [36]. Since all generated radio maps have five fingerprint samples per RP, we have used three values of k as 3, 5, and 7, for KNN implementation. The performance benchmarks are evaluated by two metrics:
- Floor and wing classification accuracy: The percentage of test samples for which both floor and wing classification is correct
- Positioning error: The positioning accuracy is taken as the 75th percentile of the positioning error in meters. The same metric has also been adopted in [36,71]. The cumulative distribution of positioning errors are also provided in the form of empirical Cumulative Distribution Function (CDF)
The two defined performance evaluation metrics are separately determined for test data of both devices using individual frequency and dual-band data. Device aggregated performance baseline is also evaluated. The floor and wing classification accuracy of the test scenarios for building CX1 is provided in Table 18.
Table 18.
Floor and wing classification accuracy baseline results of the test scenarios for building CX1. k is the number of nearest neighbors in KNN algorithm [70].
The classification accuracy for all scenarios are comparable and 100% or close to 100%. The positioning accuracy of the test scenarios for building CX1 is provided in Table 19.
Table 19.
Positioning accuracy baseline results of the test scenarios for building CX1. k is the number of nearest neighbors in KNN algorithm [70].
For both devices the error is considerably lower for the 5 GHz test scenario. Accuracy with dual-band data is significantly better than 2.4 GHz scenarios, and slightly lower in comparison to 5 GHz data. The aggregated accuracy across devices is around 26% lower than the individual cases. A trend of higher errors for higher values of k is also evident from Table 19. The empirical CDF of positioning errors, of the test scenarios for building CX1 are reported in Figure 23 and Figure 24. Figure 23 reports results for test data of individual bands and devices, whereas dual-band and device aggregated results are illustrated in Figure 24.
Figure 23.
The empirical CDF of positioning errors when implementing KNN based fingerprinting algorithm, using building CX1 test data of (a) device 1 at 2.4 GHz (b) device 1 at 5 GHz (c) device 2 at 2.4 GHz (d) device 2 at 5 GHz.
Figure 24.
The empirical CDF of positioning errors when implementing KNN based fingerprinting algorithm, using building CX1, dual-band test data of (a) device 1 only (b) device 2 only (c) device 1 and 2.
The floor and wing classification accuracy of the test scenarios for building F04 is provided in Table 20.
Table 20.
Floor and wing classification accuracy baseline results of the test scenarios for building F04. k is the number of nearest neighbors in KNN algorithm [70].
From Table 20, it is evident that the classification accuracy of device 2 is higher than device 1. The accuracy of both devices is lower in comparison to corresponding results of building CX1. Also for both devices classification accuracy is higher at the higher frequency. For both devices, enhanced classification accuracy is recorded with dual-band data. The accuracy with device aggregated dual-band data is encouraging, at around 97%. The positioning accuracy of the test scenarios for building F04 is provided in Table 21.
Table 21.
Positioning accuracy baseline results of the test scenarios for building F04. k is the number of nearest neighbors in KNN algorithm [70].
It is observed from Table 21 that, the positioning accuracy is comparable for both devices. Like the classification accuracy evaluation, in this case the accuracy is better when the higher frequency data is used. Furthermore, in general, the accuracy results are better in comparison to building CX1. The accuracy with dual-band data is comparable to the 5 GHz data, for both devices. The device aggregated dual-band data accuracy, is on average around 70% lower than the individual device cases. The empirical CDF of positioning errors, of the test scenarios for building F04 are reported in Figure 25 and Figure 26.
Figure 25.
The empirical CDF of positioning errors when implementing KNN based fingerprinting algorithm, using building F04 test data of (a) device 1 at 2.4 GHz (b) device 1 at 5 GHz (c) device 2 at 2.4 GHz (d) device 2 at 5 GHz.
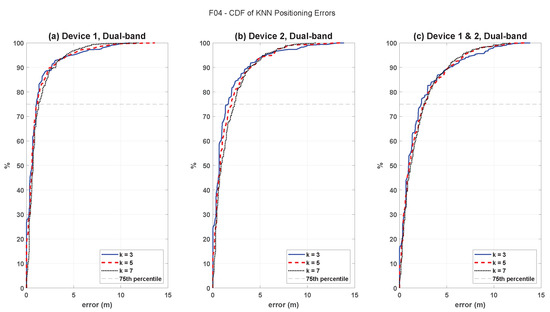
Figure 26.
The empirical CDF of positioning errors when implementing KNN based fingerprinting algorithm, using building F04, dual-band test data of (a) device 1 only (b) device 2 only (c) device 1 and 2.
Since data were recorded at open spaces in addition to corridors in building F04, the position-wise errors are analyzed. The empirical CDFs of errors in corridors and open spaces are reported in Figure 27.
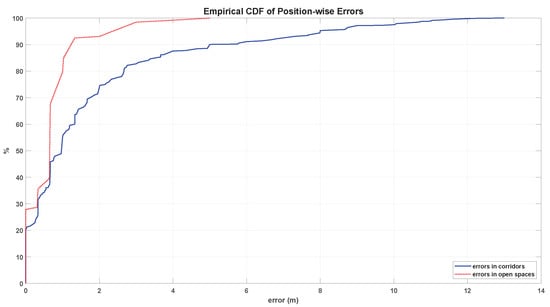
Figure 27.
The empirical CDF of positioning errors in all corridors and open spaces within building F04.
It is evident from analysis of Figure 27, that higher errors were recorded in the corridors as compared to open spaces in building F04. In the corridors, around 85% of the errors were within 4 m, whereas in open spaces around 95% of the errors were within 4 m.
The KNN based fingerprinting algorithm is implemented using the dual-band radio maps and test data of buildings CY2 and F03. The radio maps were generated using the method detailed in Section 5.2. The joint floor-wing classification accuracy for both buildings and devices is reported in Table 22.
Table 22.
Devicewise, floor and wing classification accuracy baseline results for buildings F03 and CY2, using dual-band test data. k is the number of nearest neighbors in KNN algorithm [70].
Table 22 clearly signifies the potential of radio maps generation from similar buildings with network device homogeneity and spatial symmetry in AP deployment. Other than the data of device 1, building F03, 100% classification accuracy was recorded. The positioning accuracy baseline results for buildings F03 and CY2, using dual-band test data are reported in Table 23.
Table 23.
Devicewise, positioning accuracy baseline results for buildings F03 and CY2, using dual-band test data. k is the number of nearest neighbors in KNN algorithm [70].
In comparison to accuracy achieved by using radio maps generated with training data (scenarios of buildings CX1 and F04), the positioning accuracy attained for buildings CY2 and F03 is lower. The 75th percentile of errors is around 1.3 to 4.0 m higher for building F03 in comparison to F04, across devices. The 75th percentile of errors is around 2.0 to 3.1 m higher for building CY2 in comparison to CX1, across devices. Higher errors were recorded with device 2. Analysis of these baseline results therefore signifies, that the dataset provides challenging scenarios of indoor positioning implementation. The empirical CDF of positioning errors, of the test scenarios for building CY2 and F03 are reported in Figure 28.
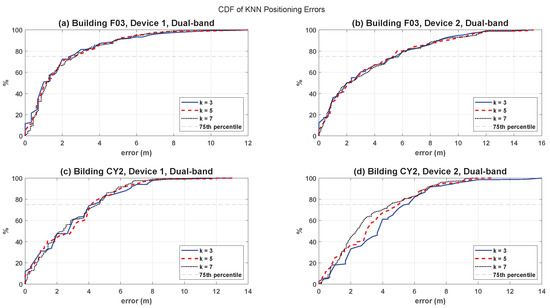
Figure 28.
The empirical CDF of positioning errors when implementing KNN based fingerprinting algorithm, using dual-band test data of (a) building F03, device 1 (b) building F03, device 2 (c) building CY2, device 1 (d) building CY2, device 2.
5.4. Baseline Evaluations—SWRM Algorithm
Baseline evaluations of the proposed SWRM algorithm, are also reported in terms of accuracy and computational cost comparisons, with traditional radio map generation techniques. Construction of radio maps with mean or median values of each RP are traditionally used methods [69]. Therefore radio maps are generated using the mean and median techniques, and subsequently compared to SWRM. In Table 24, the computational cost of radio maps generation in terms of execution time are reported.
Table 24.
Computational time measured for generation of radio maps using traditional and proposed algorithm. Experiments were performed on the same work station and averaged over 1000 repetitions.
From the results reported in Table 24, it is evident that the proposed SWRM algorithm outperforms both mean- and median-based radio map construction methods. The median-based technique took the highest computational time, due to the requisite sorting method. The SWRM algorithm was executed in around 50% less computational time in comparison to the mean-based radio map construction technique.
In order to evaluate performance of radio map algorithms, KNN is separately implemented using the mean, median, and SWRM generated radio maps. The baseline evaluations (in Section 5.3) of the dataset in terms of positioning accuracy, showed better performance using for the KNN positioning algorithm, hence it is used. Therefore, Table 25 is reported as the baseline evaluation results of KNN positioning accuracy using the three radio maps: mean, median and SWRM for both buildings’ data.
Table 25.
Positioning accuracy baseline results with various radio maps.
Analysis of the results reported in Table 25, reveal the significant superiority of KNN positioning accuracy with radio maps generated by SWRM algorithm. The 75th percentile error with SWRM generated maps is on average 40% lower than the mean and median based radio maps. Despite the improved accuracy with 5 GHz data, at best the mean and median maps exhibited around 16% higher error. The best improvement with SWRM is close to 65% for the 5 GHz test data of F04 building.
6. Conclusions
The UTMInDualSymFi dataset presented in this paper, is furnished as a comprehensive source of dual-band Wi-Fi RSSI data, to assist advancements in fingerprinting based IPS, and other applications. Data from two pairs of symmetric buildings were recorded using a specifically developed software. Prior to data collection, all APs installed within all buildings were verified as identical by make/model, operating at both 2.4 GHz and 5 GHz frequencies. The symmetric installation of APs throughout the buildings, enabled data acquisition corresponding to a distinct indoor scenario. In total, labeled samples corresponding to over twenty hours of raw data, were captured. Buildingwise, frequencywise, and devicewise radio maps are also provided in the dataset. To facilitate the use of this dataset, detailed descriptions regarding collection process, indoor environment layouts and location configurations of Wi-Fi devices are provided. The proposed SWRM algorithm, applied for construction of radio maps, was also described in the paper.
The importance and relevance of this dataset for future studies in indoor positioning applications are validated by detailed baseline analyses. Specifically the widely adopted KNN based positioning algorithm was leveraged for performance evaluations. To further highlight the potential of multiband data, detailed bandwise analyses were also performed. Results of the evaluations demonstrate higher classification and positioning accuracy with 5 GHz data for the CX1 and F04 buildings. More precisely, 75% of errors were recorded under 3.3 m for the CX1 2.4 GHz, device 1 data, whereas a 39% improvement was noted for the 5 GHz scenario. The positioning accuracy of device 2 demonstrated 42% higher accuracy for the 5 GHz data in comparison to 2.4 GHz band. The results of F04 building showed lower errors than in building CX1. The 75th percentile error of 0.9 m, recorded on device 1, 5 GHz band in building F04, was the highest accuracy throughout the dataset. The errors recorded for the lower frequency data were around 55% higher. Across various scenarios the accuracy with dual-band data was significantly better than the 2.4 GHz data, and slightly lower than the 5 GHz data. The lower accuracy of device aggregated results, indicates the impact of device heterogeneity on positioning accuracy. Baseline performance results were also presented for buildings CY2 and F03. According to the baselines, high floor-wing classification accuracy were achieved for both buildings and devices, thereby signifying the potential of radio maps generation from similar buildings. The positioning accuracy baselines further indicate the challenging implementation of indoor positioning without environment specific training data.
The performance of our proposed radio map generation algorithm SWRM was also compared to the traditional mean and median based algorithms for radio maps. According to the comparative analysis, the radio maps generated by SWRM outperformed the traditional methods both in terms of accuracy and computational cost. Firstly the computational cost of SWRM algorithm was reported on average, 50% lesser than mean-based and around 90% lower than median-based algorithm. Additionally, across the buildings, devices, and bands data, positioning accuracy with SWRM generated radio maps was on average around 40% better than with mean or median based maps. The minimum and maximum accuracy improvements noted with SWRM radio maps were 16% and 65% respectively in comparison to mean and median radio maps.
The UTMInDualSymFi dataset is presented as a comprehensive source of Wi-Fi data for indoor positioning research. The dataset includes dual-band data recorded from multibuilding and multifloor environments. It contains all recorded raw data in addition to radio maps, training, and test datasets. Therefore, in addition to facilitation of reproducible positioning algorithms, implementation of novel radio map construction and preprocessing algorithms would be enabled.
Author Contributions
Conceptualization, A.A., M.H., O.A.A., R.A.R. and A.S.A.; methodology, A.A., M.H., O.A.A., R.A.R. and A.S.A.; software, A.A. and M.H.; validation, A.A., M.H., O.A.A. and R.A.R.; formal analysis, A.A., M.H. and O.A.A.; investigation, A.A., M.H., O.A.A., R.A.R. and A.S.A.; resources, A.A., M.H., O.A.A., R.A.R. and A.S.A.; data curation, A.A., M.H., O.A.A. and R.A.R.; writing—original draft preparation, A.A., M.H., O.A.A. and R.A.R.; writing—review and editing, A.A., M.H., O.A.A., R.A.R. and A.S.A.; visualization, A.A., M.H. and O.A.A.; supervision, O.A.A. and R.A.R.; project administration, O.A.A., R.A.R. and A.S.A.; funding acquisition, O.A.A., R.A.R. and A.S.A.; All authors have read and agreed to the published version of the manuscript.
Funding
The authors wish to express their gratitude to funding by the Ministry of Higher Education Malaysia under, FRGS Registration Proposal No: FRGS/1/2019/TK04/UTM/02/46.
Institutional Review Board Statement
Not applicable.
Informed Consent Statement
Not applicable.
Data Availability Statement
The data presented in this study are openly available in the Zenodo repository at https://doi.org/10.5281/zenodo.7260097 (accessed 6 November 2022).
Conflicts of Interest
The authors declare no conflict of interest. The funders had no role in the design of the study; in the collection, analyses, or interpretation of data; in the writing of the manuscript, or in the decision to publish the results.
Abbreviations
The following abbreviations are used in this manuscript:
| AP | Access Point |
| APs | Access Points |
| BLE | Bluetooth Low Energy |
| CDF | Cumulative Distribution Function |
| dBm | decibel-milliwatts |
| DR | Dead-Reckoning |
| DSI | Department of Information Systems |
| FP | Fingerprinting |
| GHz | Gigahertz |
| GPS | Global Positioning System |
| GUI | Graphical User Interface |
| HDLC | Hybrid-fingerprint Data with Layout Change |
| ID | Identification |
| IMU | Inertial Measurement Unit |
| IoT | Internet of Things |
| IPIN | Indoor Positioning and Indoor Navigation |
| IPS | Indoor Positioning Systems |
| KNN | K-Nearest Neighbors |
| MAC | Medium Access Control |
| ML | Machine Learning |
| ROS | Robot Operating System |
| RFID | Radio-Identification |
| RP | Reference Point |
| RPs | Reference Points |
| RSS | Received Signal Strength |
| RSSI | Received Signal Strength Indicator |
| SSID | Service Set Identifier |
| SWRM | Statistical Windowed Radio Map |
| TUT | Tampere University of Technology |
| TP | Test Point |
| TPs | Test Points |
| UJI | Universitat Jaume I |
| UTM | Universiti Teknonlogi Malaysia |
| USB | Universal Serial Bus |
| Wi-Fi | Wireless-Fidelity |
Appendix A
Pseudocode of the proposed Statistical Windowed Radio Map (SWRM) algorithm.
| Algorithm A1 Statistical Windowed Radio Map (SWRM) algorithm pseudocode |
| Require:TR ← training data of a building |
| Ensure:TR ≠ {} |
| P ← # positions ▹(number of RPs) |
| S ← # sample windows |
| M ← # MACs |
| Rm ← {} |
| for x = 1 to P do ▹ (for each position) |
| tr ← data at position x in TR ▹ tr dimensions (Nx × M) |
| W ← ⌊Nx ÷ S⌋ ▹ # samples in a window |
| C ← ⌊W ÷ 2⌋ |
| for w = 1 to S do ▹ (for each window) |
| wtr ← {} |
| for m = 1 to M do ▹ (for each MAC) |
| wtrxmCw ← tr[C + W(w − 1)][m] |
| wtr ← [wtr wtrxmCw] |
| end for |
| end for |
| end for |
Notes
| 1 | Android is a trademark of Google LLC. |
| 2 | Raspberry Pi is a trademark of Raspberry Pi Ltd. |
References
- Zafari, F.; Gkelias, A.; Leung, K.K. A Survey of Indoor Localization Systems and Technologies. IEEE Commun. Surv. Tutorials 2019, 21, 2568–2599. [Google Scholar] [CrossRef]
- Brena, R.F.; García-Vázquez, J.P.; Galván-Tejada, C.E.; Muñoz-Rodriguez, D.; Vargas-Rosales, C.; Fangmeyer, J. Evolution of indoor positioning technologies: A survey. J. Sensors 2017, 2017. [Google Scholar] [CrossRef]
- Din, M.M.; Jamil, N.; Maniam, J.; Mohamed, M.A. Review of indoor localization techniques. Int. J. Eng. Technol. UAE 2018, 7, 201–204. [Google Scholar] [CrossRef]
- Atzori, L.; Iera, A.; Morabito, G. The Internet of Things: A survey. Comput. Netw. 2010, 54, 2787–2805. [Google Scholar] [CrossRef]
- Yang, T.; Cabani, A.; Chafouk, H. A Survey of Recent Indoor Localization Scenarios and Methodologies. Sensors 2021, 21, 8086. [Google Scholar] [CrossRef]
- Frankó, A.; Vida, G.; Varga, P. Reliable Identification Schemes for Asset and Production Tracking in Industry 4.0. Sensors 2020, 20, 3709. [Google Scholar] [CrossRef]
- Osterrieder, P.; Budde, L.; Friedli, T. The smart factory as a key construct of industry 4.0: A systematic literature review. Int. J. Prod. Econ. 2020, 221, 107476. [Google Scholar] [CrossRef]
- Buntak, K.; Kovačić, M.; Mutavdžija, M. Internet of things and smart warehouses as the future of logistics. Teh. Glas. 2019, 13, 248–253. [Google Scholar] [CrossRef]
- Mendoza-Silva, G.M.; Torres-Sospedra, J.; Huerta, J. A Meta-Review of Indoor Positioning Systems. Sensors 2019, 19, 4507. [Google Scholar] [CrossRef]
- Obeidat, H.; Shuaieb, W.; Obeidat, O.; Abd-Alhameed, R. A review of indoor localization techniques and wireless technologies. Wirel. Pers. Commun. 2021, 119, 289–327. [Google Scholar] [CrossRef]
- Subedi, S.; Pyun, J.Y. A survey of smartphone-based indoor positioning system using RF-based wireless technologies. Sensors 2020, 20, 7230. [Google Scholar] [CrossRef]
- Wang, Y.; Yang, X.; Zhao, Y.; Liu, Y.; Cuthbert, L. Bluetooth positioning using RSSI and triangulation methods. In Proceedings of the 2013 IEEE 10th Consumer Communications and Networking Conference, CCNC 2013, Las Vegas, NV, USA, 11–14 January 2013; pp. 837–842. [Google Scholar] [CrossRef]
- Rusli, M.E.; Ali, M.; Jamil, N.; Din, M.M. An Improved Indoor Positioning Algorithm Based on RSSI-Trilateration Technique for Internet of Things (IOT). In Proceedings of the 2016 International Conference on Computer and Communication Engineering (ICCCE), Kuala Lumpur, Malaysia, 26–27 July 2016; pp. 72–77. [Google Scholar] [CrossRef]
- Wang, B.; Liu, X.; Yu, B.; Jia, R.; Gan, X. Pedestrian dead reckoning based on motion mode recognition using a smartphone. Sensors 2018, 18, 1811. [Google Scholar] [CrossRef]
- Čabarkapa, D.; Grujić, I.; Pavlović, P. Comparative analysis of the bluetooth low-energy indoor positioning systems. In Proceedings of the 2015 12th International Conference on Telecommunication in Modern Satellite, Cable and Broadcasting Services (TELSIKS), Nis, Serbia, 14–17 October 2015; pp. 76–79. [Google Scholar] [CrossRef]
- Njima, W.; Ahriz, I.; Zayani, R.; Terre, M.; Bouallegue, R. Deep CNN for Indoor Localization in IoT-Sensor Systems. Sensors 2019, 19, 3127. [Google Scholar] [CrossRef]
- Albaidhani, A.; Morell, A.; Vicario, J.L. Anchor selection for UWB indoor positioning. Trans. Emerg. Telecommun. Technol. 2019, 30, e3598. [Google Scholar] [CrossRef]
- Qi, J.; Liu, G.P. A robust high-accuracy ultrasound indoor positioning system based on a wireless sensor network. Sensors 2017, 17, 2554. [Google Scholar] [CrossRef]
- Torres-Sospedra, J.; Montoliu, R.; Martínez-Usó, A.; Arnau, T.J.; Avariento, J.P.; Benedito-Bordonau, M.; Huerta, J. UJIIndoorLoc: A New Multi-Building and Multi-Floor Database for WLAN Fingerprint-Based Indoor Localization Problems. 2014. Available online: https://archive.ics.uci.edu/ml/datasets/ujiindoorloc (accessed on 19 February 2022).
- Moreira, A.; Nicolau, M.J.; Silva, I.; Torres-Sospedra, J.; Pendão, C.; Meneses, F. The DSI Dataset for Wi-Fi Fingerprinting Using Mobile Devices. 2020. Available online: https://doi.org/10.5281/zenodo.3778646 (accessed on 19 February 2022).
- Moreira, A.; Nicolau, M.J.; Silva, I.; Torres-Sospedra, J.; Pendão, C.; Meneses, F. Wi-Fi Fingerprinting Dataset with Multiple Simultaneous Interfaces. 2019. Available online: https://doi.org/10.5281/zenodo.3342526 (accessed on 19 February 2022).
- Parasuraman, R.; Caccamo, S.; Baberg, F.; Ogren, P. CRAWDAD Dataset kth/rss (v. 2016-01-05). 2016. Available online: http://crawdad.org/kth/rss/20160105 (accessed on 19 February 2022).
- Lohan, E.; Torres-Sospedra, J.; Leppäkoski, H.; Richter, P.; Peng, Z.; Huerta, J. Wi-Fi Crowdsourced Fingerprinting Dataset for Indoor Positioning. Data 2017, 2, 32. [Google Scholar] [CrossRef]
- Lohan, E.S.; Torres-Sospedra, J.; Gonzalez, A. WiFi RSS Measurements in Tampere University Multi-Building Campus, 2017. 2021. Available online: https://zenodo.org/record/5174851 (accessed on 19 February 2022).
- Mendoza-Silva, G.M.; Richter, P.; Torres-Sospedra, J.; Lohan, E.S.; Huerta, J. Long-Term Wi-Fi Fingerprinting Dataset and Supporting Material. 2017. Available online: https://doi.org/10.5281/zenodo.1066041 (accessed on 19 February 2022).
- Roy, P.; Chowdhury, C.; Ghosh, D.; Bandyopadhyay, S. JUIndoorLoc Dataset. 2019. Available online: https://drive.google.com/open?id=1_z1qhoRIcpineP9AHkfVGCfB2Fd_e-fD (accessed on 19 February 2022).
- Salazar González, J.L.; Soria Morillo, L.M.; Álvarez García, J.A.; Enríquez, F.; Jimenez Ruiz, A.R. Energy-Efficient Indoor Localization WiFi-Fingerprint Dataset. 2019. Available online: https://ieee-dataport.org/open-access/energy-efficient-indoor-localization-wifi-fingerprint-dataset (accessed on 19 February 2022).
- Salahat, E.; Kulaib, A.; Ali, N.; Shubair, R. Exploring symmetry in wireless propagation channels. In Proceedings of the 2017 European Conference on Networks and Communications (EuCNC), Oulu, Finland, 12–15 June 2017; pp. 1–6. [Google Scholar] [CrossRef]
- Nor Hisham, A.N.; Ng, Y.H.; Tan, C.K.; Chieng, D. Hybrid Wi-Fi and BLE Fingerprinting Dataset for Multi-Floor Indoor Environments with Different Layouts. Data 2022, 7, 156. [Google Scholar] [CrossRef]
- Ozdemir, B.N.; Ceylan, A. Constructing a precise radio map and application of indoor positioning with dual-frequency Wi-Fi fingerprinting method. Measurement 2020, 163, 107997. [Google Scholar] [CrossRef]
- İlçi, V.; Gülal, E.; Alkan, R.M. Performance comparison of 2.4 and 5 GHz WiFi signals and proposing a new method for mobile indoor positioning. Wirel. Pers. Commun. 2020, 110, 1493–1511. [Google Scholar] [CrossRef]
- Singh, N.; Choe, S.; Punmiya, R. Machine Learning Based Indoor Localization Using Wi-Fi RSSI Fingerprints: An Overview. IEEE Access 2021, 9, 127150–127174. [Google Scholar] [CrossRef]
- Salazar González, J.L.; Soria Morillo, L.M.; Álvarez García, J.A.; Enríquez De Salamanca Ros, F.; Jiménez Ruiz, A.R. Energy-Efficient Indoor Localization WiFi-Fingerprint System: An Experimental Study. IEEE Access 2019, 7, 162664–162682. [Google Scholar] [CrossRef]
- Torres-Sospedra, J.; Montoliu, R.; Martínez-Usó, A.; Arnau, T.J.; Avariento, J.P.; Benedito-Bordonau, M.; Huerta, J. UJIIndoorLoc: A new multi-building and multi-floor database for WLAN fingerprint-based indoor localization problems. In Proceedings of the International Conference on Indoor Positioning and Indoor Navigation (IPIN), Busan, Korea, 27–30 October 2014; pp. 261–270. [Google Scholar] [CrossRef]
- Torres-Sospedra, J.; Montoliu, R.; Mendoza-Silva, G.M.; Belmonte, O.; Rambla, D.; Huerta, J. Providing databases for different indoor positioning technologies: Pros and cons of magnetic field and Wi-Fi based positioning. Mob. Inf. Syst. 2016, 2016, 6092618. [Google Scholar] [CrossRef]
- Mendoza-Silva, G.M.; Richter, P.; Torres-Sospedra, J.; Lohan, E.S.; Huerta, J. Long-Term WiFi Fingerprinting Dataset for Research on Robust Indoor Positioning. Data 2018, 3, 3. [Google Scholar] [CrossRef]
- Roy, P.; Chowdhury, C.; Ghosh, D.; Bandyopadhyay, S. JUIndoorLoc: A Ubiquitous Framework for Smartphone-Based Indoor Localization Subject to Context and Device Heterogeneity. Wireless Pers. Commun. 2019, 106, 739–762. [Google Scholar] [CrossRef]
- Moreira, A.; Silva, I.; Meneses, F.; Nicolau, M.J.; Pendao, C.; Torres-Sospedra, J. Multiple simultaneous Wi-Fi measurements in fingerprinting indoor positioning. In Proceedings of the 2017 International Conference on Indoor Positioning and Indoor Navigation (IPIN), Sapporo, Japan, 18–21 September 2017; pp. 1–8. [Google Scholar] [CrossRef]
- Torres-Sospedra, J.; Montoliu, R.; Mendoza-Silva, G.M.; Belmonte, O.; Rambla, D.; Huerta, J. Geotec Database. 2016. Available online: http://indoorloc.uji.es/databases/geotecDatabaseWGS.zip (accessed on 19 February 2022).
- Wang, B.; Chen, Q.; Yang, L.T.; Chao, H.C. Indoor smartphone localization via fingerprint crowdsourcing: Challenges and approaches. IEEE Wirel. Commun. 2016, 23, 82–89. [Google Scholar] [CrossRef]
- Lohan, E.S.; Torres-Sospedra, J.; Richter, P.; Leppäkoski, H.; Huerta, J.; Cramariuc, A. Crowdsourced WiFi Database and Benchmark Software for Indoor Positioning. 2017. Available online: https://zenodo.org/record/1001662 (accessed on 19 February 2022).
- Correa, A.; Barcelo, M.; Morell, A.; Vicario, J.L. A Review of Pedestrian Indoor Positioning Systems for Mass Market Applications. Sensors 2017, 17, 1927. [Google Scholar] [CrossRef]
- Ruiz, A.R.J.; Mendoza-Silva, G.M.; Montoliu, R.; Seco, F.; Torres-Sospedra, J. Datasets and Supporting Materials for the IPIN 2016 Competition Track 3 (Smartphone-Based, Off-Site). 2016. Available online: https://zenodo.org/record/2791530 (accessed on 19 February 2022).
- Ruiz, A.R.J.; Mendoza-Silva, G.M.; Seco, F.; Torres-Sospedra, J. Datasets and Supporting Materials for the IPIN 2017 Competition Track 3 (Smartphone-Based, Off-Site). 2017. Available online: https://zenodo.org/record/2823924 (accessed on 19 February 2022).
- Ruiz, A.R.J.; Mendoza-Silva, G.M.; Ortiz, M.; Perez-Navarro, A.; Perul, J.; Seco, F.; Torres-Sospedra, J. Datasets and Supporting Materials for the IPIN 2018 Competition Track 3 (Smartphone-Based, Off-Site). 2018. Available online: https://zenodo.org/record/2823964 (accessed on 19 February 2022).
- Ruiz, A.R.J.; Perez-Navarro, A.; Crivello, A.; Mendoza-Silva, G.M.; Seco, F.; Ortiz, M.; Perul, J.; Torres-Sospedra, J. Datasets and Supporting Materials for the IPIN 2019 Competition Track 3 (Smartphone-Based, Off-Site). 2019. Available online: https://zenodo.org/record/3606765 (accessed on 19 February 2022).
- Torres-Sospedra, J.; Gaibor, D.Q.; Jiménez, A.R.; Pérez-Navarro, A.; Seco, F. Datasets and Supporting Materials for the IPIN 2020 Competition Track 3 (Smartphone-Based, Off-Site). 2020. Available online: https://zenodo.org/record/4314992 (accessed on 19 February 2022).
- Gutiérrez, J.D.; Jiménez, A.R.; Seco, F.; Álvarez, F.J.; Aguilera, T.; Torres-Sospedra, J.; Melchor, F. GetSensorData: An extensible Android-based application for multi-sensor data registration. SoftwareX 2022, 19, 101186. [Google Scholar] [CrossRef]
- Barsocchi, P.; Crivello, A.; La Rosa, D.; Palumbo, F. A multisource and multivariate dataset for indoor localization methods based on WLAN and geo-magnetic field fingerprinting. In Proceedings of the International Conference on Indoor Positioning and Indoor Navigation (IPIN), Madrid, Spain, 4–7 October 2016; pp. 1–8. [Google Scholar] [CrossRef]
- Zhong, Z.; Tang, Z.; Li, X.; Yuan, T.; Yang, Y.; Wei, M.; Zhang, Y.; Sheng, R.; Grant, N.; Ling, C.; et al. XJTLUIndoorLoc: A New Fingerprinting Database for Indoor Localization and Trajectory Estimation Based on Wi-Fi RSS and Geomagnetic Field. In Proceedings of the Sixth International Symposium on Computing and Networking Workshops (CANDARW), Takayama, Japan, 27–30 November 2018; pp. 228–234. [Google Scholar] [CrossRef]
- Laska, M.; Schulz, T.; Grottke, J.; Blut, C.; Blankenbach, J. VI-SLAM2tag: Low-Effort Labeled Dataset Collection for Fingerprinting-Based Indoor Localization. arXiv 2022, arXiv:2207.02668. [Google Scholar]
- Laska, M.; Schulz, T.; Grottke, J.; Blut, C.; Blankenbach, J. giaIndoorLoc—Auto-Labeled WLAN + IMU Dataset Generated via VI-SLAM2tag. 2022. Available online: https://zenodo.org/record/6801310 (accessed on 12 October 2022).
- Nor Hisham, A.N.; Ng, Y.H.; Tan, C.K.; Chieng, D. Hybrid Wi-Fi and BLE Fingerprinting Dataset for Multi-Floor Indoor Environments with Different Layouts. 2022. Available online: https://zenodo.org/record/7306455 (accessed on 11 November 2022).
- Tóth, Z.; Tamás, J. Miskolc IIS Hybrid IPS: Dataset for Hybrid Indoor Positioning. In Proceedings of the 26th International Conference Radioelektronika (RADIOELEKTRONIKA), Kosice, Slovakia, 19–20 April 2016; pp. 408–412. [Google Scholar] [CrossRef]
- Mendoza-Silva, G.M.; Matey-Sanz, M.; Torres-Sospedra, J.; Huerta, J. BLE RSS measurements dataset for research on accurate indoor positioning. Data 2019, 4, 12. [Google Scholar] [CrossRef]
- Baronti, P.; Barsocchi, P.; Chessa, S.; Mavilia, F.; Palumbo, F. Indoor bluetooth low energy dataset for localization, tracking, occupancy, and social interaction. Sensors 2018, 18, 4462. [Google Scholar] [CrossRef]
- Aranda, F.J.; Parralejo, F.; Álvarez, F.J.; Torres-Sospedra, J. Multi-slot ble raw database for accurate positioning in mixed indoor/outdoor environments. Data 2020, 5, 67. [Google Scholar] [CrossRef]
- King, T.; Kopf, S.; Haenselmann, T.; Lubberger, C.; Effelsberg, W. COMPASS: A Probabilistic Indoor Positioning System Based on 802.11 and Digital Compasses. In Proceedings of the 1st International Workshop on Wireless Network Testbeds, Experimental Evaluation and Characterization, Los Angeles, CA, USA, 29 September 2006; pp. 34–40. [Google Scholar] [CrossRef]
- Mendoza-Silva, G.M.; Matey-Sanz, M.; Torres-Sospedra, J.; Huerta, J. Localization. 2018. Available online: http://wnlab.isti.cnr.it/localization (accessed on 19 February 2022).
- Mendoza-Silva, G.M.; Matey-Sanz, M.; Torres-Sospedra, J.; Huerta, J. BLE RSS Measurements Database and Supporting Materials. 2018. Available online: https://zenodo.org/record/1618692 (accessed on 19 February 2022).
- Aranda, F.J.; Parralejo, F.; Álvarez, F.J.; Torres-Sospedra, J. Multi-slot BLE raw database for accurate positioning in mixed indoor/outdoor environments. 2020. Available online: https://zenodo.org/record/3927588 (accessed on 19 February 2022).
- King, T.; Kopf, S.; Haenselmann, T.; Lubberger, C.; Effelsberg, W. CRAWDAD Dataset Mannheim/Compass (v. 2008-04-11). 2008. Available online: https://crawdad.org/mannheim/compass/20080411/fingerprint (accessed on 19 February 2022).
- RUCKUS. RUCKUS R610 Indoor Access Point. 2019. Available online: https://webresources.ruckuswireless.com/pdf/datasheets/ds-ruckus-r610.pdf (accessed on 19 February 2022).
- olgor.com. WiFi Analyzer. 2018. Available online: https://play.google.com/store/apps/details?id=abdelrahman.wifianalyzerpro (accessed on 19 February 2022).
- Microsoft. Wlan Association Attributes. 2022. Available online: https://learn.microsoft.com/en-us/windows/win32/api/wlanapi/ns-wlanapi-wlan_association_attributes?redirectedfrom=MSDN (accessed on 19 February 2022).
- Wang, H.; Sen, S.; Elgohary, A.; Farid, M.; Youssef, M.; Choudhury, R.R. No Need to War-Drive: Unsupervised Indoor Localization. In Proceedings of the 10th International Conference on Mobile Systems, Applications, and Services, Low Wood Bay Lake District, UK, 25–29 June 2012; Association for Computing Machinery: New York, NY, USA, 2012; pp. 197–210. [Google Scholar] [CrossRef]
- Kim, Y.; Shin, H.; Cha, H. Smartphone-based Wi-Fi pedestrian-tracking system tolerating the RSS variance problem. In Proceedings of the 2012 IEEE International Conference on Pervasive Computing and Communications, Lugano, Switzerland, 19–23 March 2012; pp. 11–19. [Google Scholar] [CrossRef]
- Kjærgaard, M.B. A Taxonomy for Radio Location Fingerprinting. In Location- and Context-Awareness, Proceedings of the Third International Symposium, LoCA 2007, Oberpfaffenhofen, Germany, 20–21 September 2007; Hightower, J., Schiele, B., Strang, T., Eds.; Springer: Berlin/Heidelberg, Germany, 2007; pp. 139–156. [Google Scholar] [CrossRef]
- Meneses, F.; Moreira, A.; Costa, A.; Nicolau, M.J. 4—Radio Maps for Fingerprinting in Indoor Positioning. In Geographical and Fingerprinting Data to Create Systems for Indoor Positioning and Indoor/Outdoor Navigation; Conesa, J., Pérez-Navarro, A., Torres-Sospedra, J., Montoliu, R., Eds.; Academic Press: Cambridge, MA, USA, 2019; pp. 69–95. [Google Scholar] [CrossRef]
- Bahl, P.; Padmanabhan, V.N. RADAR: An in-building RF-based user location and tracking system. In Proceedings of the Proceedings IEEE INFOCOM 2000. Conference on Computer Communications. Nineteenth Annual Joint Conference of the IEEE Computer and Communications Societies (Cat. No. 00CH37064), Tel Aviv, Israel, 26–30 March 2000; Volume 2, pp. 775–784. [Google Scholar] [CrossRef]
- Torres-Sospedra, J.; Jiménez, A.R.; Moreira, A.; Lungenstrass, T.; Lu, W.C.; Knauth, S.; Mendoza-Silva, G.M.; Seco, F.; Pérez-Navarro, A.; Nicolau, M.J.; et al. Off-Line Evaluation of Mobile-Centric Indoor Positioning Systems: The Experiences from the 2017 IPIN Competition. Sensors 2018, 18, 487. [Google Scholar] [CrossRef]
Disclaimer/Publisher’s Note: The statements, opinions and data contained in all publications are solely those of the individual author(s) and contributor(s) and not of MDPI and/or the editor(s). MDPI and/or the editor(s) disclaim responsibility for any injury to people or property resulting from any ideas, methods, instructions or products referred to in the content. |
© 2023 by the authors. Licensee MDPI, Basel, Switzerland. This article is an open access article distributed under the terms and conditions of the Creative Commons Attribution (CC BY) license (https://creativecommons.org/licenses/by/4.0/).