Abstract
High dropout rates and delayed completion in higher education are associated with considerable personal and social costs. In Latin America, 50% of students drop out, and only 50% of the remaining ones graduate on time. Therefore, there is an urgent need to identify students at risk and understand the main factors of dropping out. Together with the emergence of efficient computational methods, the rich data accumulated in educational administrative systems have opened novel approaches to promote student persistence. In order to support research related to preventing student dropout, a dataset has been gathered and curated from Tecnologico de Monterrey students, consisting of 50 variables and 143,326 records. The dataset contains non-identifiable information of 121,584 High School and Undergraduate students belonging to the seven admission cohorts from August–December 2014 to 2020, covering two educational models. The variables included in this dataset consider factors mentioned in the literature, such as sociodemographic and academic information related to the student, as well as institution-specific variables, such as student life. This dataset provides researchers with the opportunity to test different types of models for dropout prediction, so as to inform timely interventions to support at-risk students.
Data Set:https://doi.org/10.57687/FK2/PWJRSJ.
Data Set License: CC0
1. Introduction
High dropout rates and delayed completion in higher education are associated with considerable personal and social costs. Dropping out from higher education represents a cost for the government and society, an unnecessary expense for the family, and an experience of failure for the university student [1,2]. Therefore, the early identification of at-risk students and understanding of the main factors of dropping out have recently attracted a great deal of research interest [3,4,5]. Early detection of at-risk students allows higher education institutions to offer individualized assistance in varied forms, including remedial courses and tutoring sessions to mitigate academic failure.
The rich data accumulated in educational administrative systems together with the emergence of efficient Statistical and Machine Learning methods have opened novel approaches to address the problem of student attrition, generating a new line of research. In the last few years, a high number of predictive analytical educational research papers have been published and Artificial Intelligence-based decision support systems have been developed to assist stakeholders in higher education [6,7,8]. For example, the application of Learning Analytics in higher education institutions can provide quality and actionable information to implement educational interventions, such as timely support for at-risk students of dropping out [9,10].
Most dropout prediction studies rely on pre-enrollment achievement measures (high school grades, assessment tests) and personal details [11,12,13,14]; some also consider first-semester university performance indicators [12,15], such as course grades [16]. On the other hand, other factors were also found to have incremental predictive power on academic performance and retention such as on/off-campus housing [17], socioeconomic status [11,18,19], psychological factors such as coping and emotional intelligence [20], and schooling background of parents [21]. Notwithstanding, ethical principles on the collection and use of educational data should be proposed and applied with the aim of protecting the privacy of students, such as the ethical principle of considering student performance as a dynamic variable [22].
In Latin America, college access grew dramatically in the early 2000s, and particularly for those students from middle and low-income segments [23]. Most of these ‘new students’ enrolled in new private programs, relying on the recent growth of middle-class family incomes, student loans, and scholarships [24]. Although the coverage expansion of higher education systems was crucial for knowledge production and social mobility, it generated major challenges regarding quality and equity. According to Lemaitre [25], 50% of students drop out and only 50% of the remaining ones graduate on time. Considering that low-income students are the ones at higher risk of dropping out and being disfavoured by disparities in lifetime earnings [26], there is an urgent need to improve higher education quality in the region and reduce dropout rates [23,27]. In this context, data-based strategies are seen as an opportunity to tackle issues related to these problems, such as providing personalized feedback and support to an increasing number of learners [27].
Therefore, in order to support the prediction of student dropout and increase student retention rates, a student dataset has been gathered and curated based on the related work and the retention prediction model developed for Tecnologico de Monterrey within the early alerts program. This program is a project whose purpose is to provide timely and reliable information in the follow-up process to high school and undergraduate students according to their information and their retention indicator. Although retention rates at the institution have increased from 91.2% in High School and 89.9% in Undergraduate in 2014 to 94.5% in High School and 92.1% in Undergraduate in 2020, new or disruptive models are needed to identify all at-risk students in an effective and timely manner. A call for proposals was launched to research and develop solutions based on this dataset using Machine Learning algorithms [28]. According to the proposals received, the dataset was enriched with more variables related to student life and dropout time. Resulting in a dataset of 50 variables and 143,326 records.
The rest of the descriptor is organized as follows. Section 2 provides the context and detail description of the student dataset. Then, Section 3 provides the methodology carried out to collect, preprocess, preserve, and explore the proposed dataset, mentioning the materials and methods used as well as presenting a brief exploratory analysis of the dataset. Finally, Section 4 gives the conclusions.
2. Data Description
The Tecnologico de Monterrey is a university in Mexico made up of 29 campuses and 18 offices around the world. The institution has a total current population of 94,424 students, of which 26,794 are in High School, 60,169 in Undergraduate, and 7461 in Postgraduate programs [29]. In the dataset given through this descriptor, non-identifiable information is provided for 121,584 High School and/or Undergraduate students who have enrolled at Tecnologico de Monterrey. The information corresponds to seven admission cohorts to the institution from 2014 to 2020; that is, August–December 2014 (AD14), August–December 2015 (AD15), August–December 2016 (AD16), August–December 2017 (AD17), August–December 2018 (AD18), August–December 2019 (AD19), and August–December 2020 (AD20).
The dropout rates in the institution have decreased from 8.8% in High School and 10.1% in Undergraduate in 2014 to 5.5% in High School and 7.9% in Undergraduate in 2020. However, in the 2015–2016 period, the dropout rates increased from 7.3% to 7.6% for High School, as well as in the 2018–2019 period from 7.5% to 9.4% for Undergraduate. Therefore, it is necessary to continue researching and developing models and strategies for student retention.
Among the categories of information available in this dataset are:
- Sociodemographic information, such as age, gender, and type of zone to which the student’s address belongs.
- Enrollment information, such as program, school, and educational model.
- Academic information related to the student, such as the average of the previous level, the average in the first term or midterm of the first semester, and the number of failed subjects.
- Information associated with scores on admission tests, such as the admission test, standardized English proficiency test, and Mathematics grade.
- Academic history, such as type of school from provenance, national/international student, and relationship with the Tecnologico de Monterrey system.
- Student life, such as participation in sports, cultural, and leadership activities.
- Scholarship and financial aid information, such as type of scholarship, percentage of scholarship, and percentage of scholarship loan.
- Academic information related to the student’s parents, such as educational level and whether the parents were students of the Tecnologico de Monterrey.
- Information on the student’s retention or dropout in the first year.
Table 1, Table 2 and Table 3 provide a detailed description of the variables constituting the student dataset.

Table 1.
Description of the attributes of the student dataset (Part I).
Table 2.
Description of the attributes of the student dataset (Part II).
Table 3.
Description of the attributes of the student dataset (Part III).
It is relevant to mention that this student dataset provides information on two educational models implemented at Tecnologico de Monterrey. The previous model, corresponding to the AD14–AD18 generations, is based on the teaching-learning process while the current model called “TEC21 Model”, corresponding to the AD19–AD20 generations, is based on challenges and competencies [29]. In this dataset, information on the average obtained in the first term or midterm, the number of subjects failed, and the number of subjects dropped out by the student is only provided for the AD19–AD20 generations. Hence, this data is interesting to analyze from this perspective as well.
In the same way, co-curricular activities related to the integrated learning of students have also evolved in accordance with the new educational model (“TEC21 Model”). The AD14–AD17 generations of students contemplated enrolling in one type of activity or the three categories of activities offered: (1) physical education, (2) cultural diffusion, and (3) student society. For the AD18–AD20 generations, the offer of activities increased since they are now part of the well-rounded education of the student to contribute to the development of transversal skills for all students [30,31]. This evolution is called the LiFE (Leadership and Student Education) program, which goes hand in hand with the TEC21 educational model [31] and is made up of the following categories: athletic or sports activities, art or culture activities, student society activities, life or work mentoring, and wellness activities.
3. Materials and Methods
The methodology used in this research is based on the Data Life Cycle used in the field of Research Data Management shown in Figure 1. The Data Life Cycle illustrates the research process and its different phases, as well as the stages associated with the data generation, use, and dissemination [32].
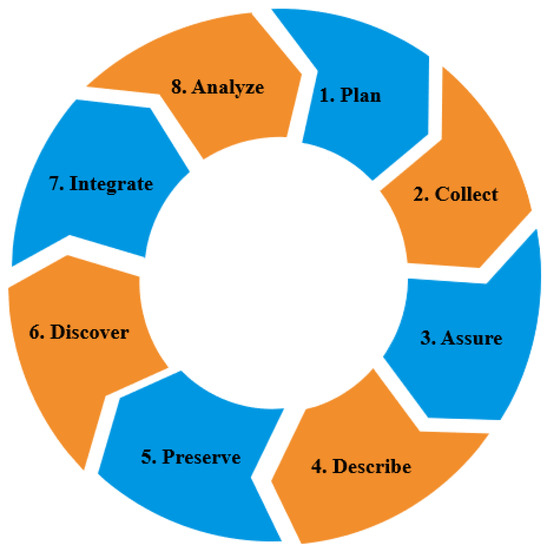
Figure 1.
Data Life Cycle Diagram, based on [33].
3.1. Data Planning
The first 40 variables shown in Table 1, Table 2 and Table 3 were defined according to the related work cited in this descriptor, as well as the Analytics and Business Intelligence Department of Tecnologico de Monterrey due to its experience in the early alerts program (student retention). The following nine variables (listed from 41 to 50 in Table 3) related to the student’s dropout semester and the student’s co-curricular activities were gathered after receiving the proposals of the researchers participating in the call for proposals. The dataset along with its data dictionary were built in Excel files to allow downloading them through the Tecnologico de Monterrey’s Data Hub (https://datahub.tec.mx/dataverse/tec (accessed on 24 August 2022)). Taking into account the sensitivity of the data, the dataset will be made available to researchers who request it through the Data Hub.
3.2. Data Collection
The data was extracted in two phases. Firstly, data was collected from the Tecnologico de Monterrey’s Data Warehouse by the Analytics and Business Intelligence Department through the SAP BusinessObjects Web Intelligence (WebI) tool. This first dataset includes personal and academic information on Undergraduate and High School students, such as gender, age, tests, schooling background of parents, among others. The variables related to retention and the socioeconomic level of the students were calculated by the same department with the purpose of designing a model to identify students at risk, used in the early alerts program. Secondly, the co-curricular activities of the students from 2014 to 2020 were obtained from the Tecnologico de Monterrey’s LiFE Department.
3.3. Data Assurance
For the dataset that was extracted from the WebI tool, the following preprocessing steps were performed:
- 1.
- Considering the privacy of students and faculty, it is important to emphasize that the data must be de-identified before it is made available for institutional use and research purposes [22]. Therefore, the student’s enrollment identifier ( student.id) and the name of the previous level school ( id.school.origin) became non-identifiable values as they represent sensitive information.
- 2.
- All records were translated into the English language.
- 3.
- 4.
- Spelling and typographical errors were checked for the categorical values of each variable.
- 5.
- Missing values for the variables socioeconomic.level and social.lag were filled in with “No information”.
- 6.
- The empty values corresponding to admission.test for the Undergraduate level were replaced by “Does not apply” when the variable tec.no.tec has the value “TEC”. That is, the student is a graduate of the Tecnologico de Monterrey’s High School.
- 7.
- The variable dropout.semester was categorized according to the period in which the student dropped out: before or during the semester.
- 8.
- The values of the variables scholarship.perc, loan.perc, and total.scholarship.loan were multiplied by 100 to represent a percentage.
3.4. Data Description
The dataset was described in detail in Section 2.
3.5. Data Preservation
This dataset will be available upon request through the Tecnologico de Monterrey’s Data Hub repository for its long-term preservation. The metadata was properly described and a specific Digital Object Identifier (DOI) was assigned in order that the data can be easily traceable and correctly cited. This dataset is protected by the Creative Commons Zero (CC0) waiver and is governed by Tecnologico de Monterrey’s Terms of Use and a Data Policy.
3.6. Data Discovery
Based on the proposals received by the researchers, information on co-curricular activities and dropout semester were identified as potential data that could be valuable for the student dropout prediction model and were added to the original dataset.
3.7. Data Integration
The first dataset consisting of 40 variables was merged with the co-curricular activities database and semester dropout information based on the variables student.id and generation to create a single data file. As a result, the final dataset is made up of 50 attributes to test and predict student dropout at the High School and Undergraduate levels.
3.8. Data Analysis
Firstly, a descriptive analysis of dataset variables was performed using the Pandas library version 1.4.3 and the Scikit-learn library version 1.1.2 in Python 3 shown in Table 4 and Table 5. Secondly, a data visualization was carried out using Tableau Desktop Professional Edition 2021.4.4.
Table 4.
Description of the numerical attributes of the student dataset.
Table 5.
Description of the categorical attributes of the student dataset.
On the one hand, Table 4 describes the numerical variables of the dataset through their unique, mean, minimum, and maximum values. The identifier of each variable corresponds to the identifier assigned in Table 1, Table 2 and Table 3. Similarly, the gain information is integrated to demonstrate the dependency between each feature in the dataset and the target variable: retention. The information gain was calculated using a mutual information classifier, the values “Does not apply” and “No information” were excluded from the calculation of the statistical variables admission.test, general.math.eval, and total.life.activities since they do not represent numerical values, and the records containing null values were also not considered in the information gain calculation. It is important to remember that for the variables average.first.period, failed.subject.first.period, and dropped.subject.first.period the data is only available for AD19 and AD20.
In addition, a correlation matrix is provided in Figure 2 to show the correlation coefficients between each numerical attribute in the dataset. Due to the considerations mentioned above, the dataset used for these analyzes resulted in 25,061 records. From this matrix, it can be seen that the degree of linear relationship between the variable total.scholarship.loan and the variable scholarship.perc is 0.94, which means that these variables are strongly correlated. While between the variables average.first.period and failed.subject.first.period the coefficient is −0.43, which indicates that they are associated in the opposite direction.
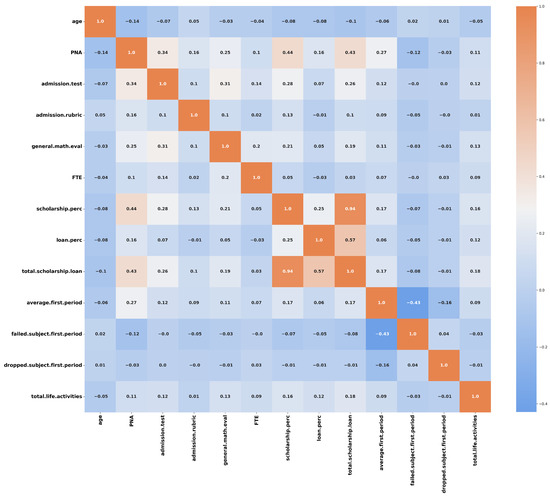
Figure 2.
Correlation matrix of the numerical attributes shown in Table 4.
On the other hand, Table 5 describes the categorical variables of the dataset through their unique and mode values, and the frequency of the mode. The identifier of each variable corresponds to the identifier assigned in Table 1, Table 2 and Table 3. Regarding the co-curricular activities, the mode and frequency were calculated according to the generation to which they correspond. For example, for the variables physical.education, cultural.diffusion, and student.society, only the values corresponding to the generations AD14 to AD17 were considered. Similarly, for the LiFE activities, only the values of the generations AD18 to AD20 were contemplated. Furthermore, the "Does not apply" value was ignored for all generations. In the same way, the gain information is integrated to demonstrate the dependency between each feature in the dataset and the target variable: retention. The information gain was calculated using a mutual information classifier, it was necessary to encode the features using an OrdinalEncoder while the target variable, in this case, “retention” was encoded with a LabelEncoder. From this calculation, it can be deduced that the retention variable is more dependent on the students’ co-curricular activities, such as cultural.diffusion, student.society, and physical.education, while the variables online.test and dropped.subject.first.period have less dependency on retention.
It is worth mentioning that it is recommended to carry out a greater analysis of the factors since the gain values may vary depending on the data preprocessing and the approach that each researcher considers in their experiments.
Subsequently, graphical representations were performed with the variables related to the dropout rates and the specific variables of the institution (student life). Figure 3 illustrates the number of High School and Undergraduate students who dropped out during their first year of study from AD14 to AD20. In general, the number of students enrolled increased over time for both levels. Figure 3 shows that in AD14 the number of High School students who dropped out is higher compared to other generations. It is also found that in AD15 there is a slight decrease in student dropout of 7.28% but during the following three generations, from AD16 to AD18, the dropout rates increased and ranged between 7.61% and 7.98%. In AD19, when the Tec21 model started, this rate started to decrease from 6.48% to 5.51% in AD20, which is the lowest dropout rate of the seven generations.
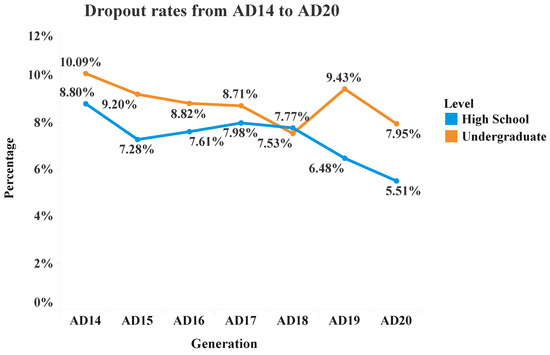
Figure 3.
High School and Undergraduate dropout rates.
Although at the Undergraduate level the number of students enrolled seems to increase year after year, the number of dropouts does not behave the same. It is observed in the orange line of Figure 3 that the year with the highest student dropout is also found in the AD14 generation with a dropout rate of 10.09%. According to the graph, there was a downward trend starting from the AD15 generation with a dropout rate of 9.20%, then between the AD16 and AD17 generations, the dropout rates decreased and had a minimum variation with percentages of 8.82% and 8.71%, respectively. In AD18, the dropout rate continued to decrease with a percentage of 7.53%. Although there was a decreasing trend in dropout rates during the past generations, in AD19, despite the number of students enrolled increased, the dropout rate rose to 9.43% but in AD20 this rate decreased to 7.95%.
Moreover, Figure 4 presents information on the number of High School and Undergraduate students who participated in different co-curricular activities during the fall semesters between 2014 and 2017. The total number of students enrolled in those years was 78,715. The graph shows that the majority (58,701) of the students were involved in Physical Education activities with a dropout rate of 7.10%, followed by cultural diffusion with 40,768 students enrolled and a dropout rate of 7.10%; while a smaller number of students (25,115), participated in some student society activity with a dropout rate of 6.31%.
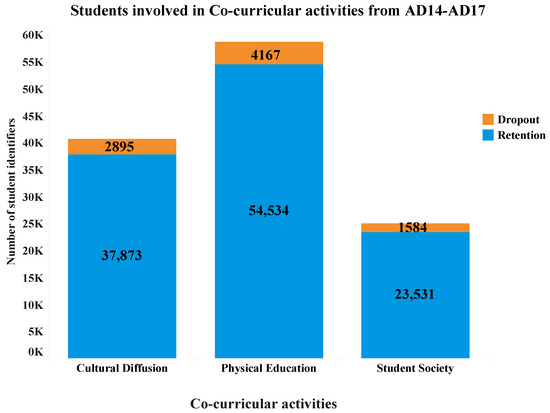
Figure 4.
Number of High School and Undergraduate students who were enrolled in co-curricular activities during the fall semesters from AD14 to AD17.
Figure 5 shows the information on the co-curricular activities that belong specifically to the Tecnologico de Monterrey’s LiFE program implemented since AD18. The number of students enrolled in these three generations was 64,611. According to the graph, more than half of the students (36,908) participated in Athletic Sports with a dropout rate of 6.09%. The Student Society Leadership was the second activity with a participation of 21,429 students and a dropout rate of 6.10%, followed by Art Culture with 20,849 students and a dropout rate of 6.02%. Compared to this last activity, slightly fewer students participated in the Wellness activities (20,052) with a dropout rate of 5.91%. Participation in activities related to Life-Work Mentoring was the least preferred by students with a participation of 12,863 but with the highest percentage of dropouts of 7.40%.
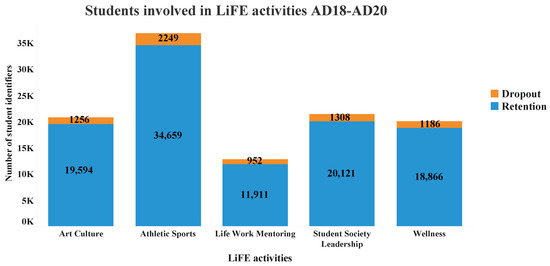
Figure 5.
Number of High School and Undergraduate students who were enrolled in LiFE activities during the fall semesters from AD18 to AD20.
It is worth mentioning that a student could have participated in one or more activities at the same time.
4. Conclusions
Through this data descriptor, a non-identifiable dataset of 121,584 High School and Undergraduate students from Tecnologico de Monterrey was provided in order to contribute to the scientific community with data that will allow it to generate more accurate models to predict student dropout in higher education institutions. The generation of an appropriate model based on this dataset would benefit the students, by having timely and personalized strategies from their institution that support their permanence in their career, as well as the institution, by improving their statistics of student degree completion and their student investment costs.
The dataset is made up of variables reported in the literature as good predictors of school dropout as well as variables of the institution that are part of the student life. The contribution of more data related to the variables found in the literature from an institution other than their own could allow testing models already developed in their own institution to find new findings or improve those models.
On the other hand, the new variables (student life) could provide new relationships between the factors already studied that could enhance the development of new or improved models to predict student performance and identify at-risk students. Most papers use traditional Machine Learning algorithms (e.g., logistic regression, k-nearest neighbors, and decision tree-based ensemble models) [13,34]. However, only 5% of the studies have applied unsupervised learning algorithms [16]. Furthermore, the emergence of Explainable Artificial Intelligence (XAI) tools has made it possible to use advanced Machine Learning algorithms for interpretable dropout prediction [35,36,37].
Author Contributions
Conceptualization, J.A.-U. and R.A.R.D.; methodology, J.A.-U., P.M.-A., A.L.M.H. and H.G.C.; software, A.L.M.H. and P.M.-A.; validation, J.A.-U., A.L.M.H., J.E.M.G., R.A.R.D., R.M., I.H. and V.H.; formal analysis, J.A.-U., P.M.-A. and A.L.M.H.; investigation, J.A.-U., P.M.-A., R.M., I.H., V.H. and J.E.M.G.; resources, H.G.C. and R.A.R.D.; data curation, A.L.M.H. and P.M.-A.; writing—original draft preparation, J.A.-U. and P.M.-A.; writing—review and editing, R.M., I.H., A.L.M.H., J.E.M.G., V.H., R.A.R.D. and H.G.C.; visualization, P.M.-A. and J.A.-U.; supervision, H.G.C. and R.A.R.D.; project administration, H.G.C.; funding acquisition, H.G.C. and R.A.R.D. All authors have read and agreed to the published version of the manuscript.
Funding
This research was funded by the Institute for the Future of Education and the APC was funded by the Tecnologico de Monterrey.
Institutional Review Board Statement
Privacy issues related to the collection, curation, and publication of student data were validated with Tecnologico de Monterrey’s Data Owners and the Data Security and Information Management Departments.
Informed Consent Statement
Not applicable.
Data Availability Statement
The data presented in this descriptor is available upon request in the Institute for the Future of Education’s Educational Innovation collection of the Tecnologico de Monterrey’s Data Hub at https://doi.org/10.57687/FK2/PWJRSJ (accessed on 24 August 2022).
Acknowledgments
The authors would like to thank the Tecnologico de Monterrey’s Analytics and Business Intelligence Department for providing the original dataset for this project. Similarly, to Yedida Betzabé López Membrila, for providing complementary data for the presented dataset. Also, to Verónica Guadalupe Barroso Sánchez, for explaining the variables related to admissions in the dataset. Finally, to the researchers who applied for the call for their recommendations on the integration of new variables.
Conflicts of Interest
The authors declare no conflict of interest.
Abbreviations
The following abbreviations are used in this manuscript:
| AD | August–December |
| CC0 | Creative Commons Zero |
| DOI | Digital Object Identifier |
| LiFE | Leadership and Student Education |
| MDPI | Multidisciplinary Digital Publishing Institute |
| PAA | Academic Aptitude Test (Prueba de Aptitud Académica) |
| PAL | Online Aptitude Test (Prueba de Aptitud en Línea) |
| SAP | Systemanalyse Programmentwicklung |
| WebI | SAP BusinessObjects Web Intelligence |
| XAI | Explainable Artificial Intelligence |
Appendix A
Table A1.
The meaning of the acronym of the program in which the student is enrolled (Part I).
Table A1.
The meaning of the acronym of the program in which the student is enrolled (Part I).
| Program | Meaning |
|---|---|
| ADI | Architecture and Design/Exploration |
| AMC | Built Environment/Exploration |
| ARQ | B.A. in Architecture |
| BIO | Bioengineering and Chemical Process/Exploration |
| CIS | Law, Economics and International Relations/Exploration |
| COM | Communication and Digital Production/Exploration |
| CPF | B.A. in Finance & Accounting |
| ESC | Creative Studies/Exploration |
| IA | B.S. Agronomy Engineering |
| IBN | B.S. Biobusiness Engineering |
| IBQ | Engineering-Bioengineering and Chemical Process (avenue)/Exploration |
| IBT | B.S. in Biotechnology Engineering |
| IC | B.S. Civil Engineering |
| ICI | Engineering-Applied Sciences (avenue)/Exploration |
| ICT | Engineering-Computer Science and Information Technologies (avenue)/Exploration |
| IDA | B.S. Automotive Engineering |
| IDS | B.S. Sustainable Development Engineering |
| IFI | B.S. in Engineering Physics |
| IIA | B.S. Food Industry Engineering |
| IID | B.S. Innovation and Development Engineering |
| IIN | B.S. Industrial Innovation Engineering |
| IIS | B.S. Industrial Engineering with minor in Systems Engineering |
| IIT | Engineering-Innovation and Transformation (avenue)/Exploration |
| IMA | B.S. Mechanical Engineering (administrator) |
| IMD | B.S. Biomedical Engineering |
| IME | B.S. Mechanical Engineering (electrician) |
| IMI | B.S. Digital Music Production Engineering |
| IMT | B.S. in Mechatronics Engineering |
| ING | Engineering/Exploration |
| INQ | B.S. Chemistry and Nanotechnology Engineering |
| INT | B.S. Business Informatics |
| IQA | B.S. Chemical Engineering (administrator) |
| IQP | B.S. Chemical Engineering (sustainable processes) |
| ISC | B.S. Computer Science and Technology |
| ISD | B.S. Digital Systems and Robotics Engineering |
| ITC | B.S. in Computer Science and Technology |
| ITE | B.S. Electronic and Computer Engineering |
| ITI | B.S. Information and Communication Technologies |
| ITS | B.S. Telecommunications and Electronic Systems |
| LAD | B.A. Animation and Digital Art |
| LAE | B.A. Business Administration |
| LAF | B.A. Financial Management |
| LBC | B.A. in Biosciences |
| LCD | B.A. Communication and Digital Media |
| LCMD | B.A. Communication and Digital Media |
| LDE | B.A. in Entrepreneurship |
| LDF | B.A. Law with Minor in Finance |
| LDI | B.A. Industrial design |
| LDN | B.A. Business Innovation and Management |
| LDP | B.A. Law with Minor in Political Science |
Table A2.
The meaning of the acronym of the program in which the student is enrolled (Part II).
Table A2.
The meaning of the acronym of the program in which the student is enrolled (Part II).
| Program | Meaning |
|---|---|
| LEC | B.A. Economics |
| LED | B.A. in Law |
| LEF | B.A. Economics and Finances |
| LEM | B.A. in Marketing |
| LIN | B.A. in International Business |
| LLE | B.A. Spanish Literature |
| LLN | B.A. International Logistics |
| LMC | B.A. Marketing and Communication |
| LMI | B.A. Journalism and Media Studies |
| LNB | B.A. in Nutrition and Wellness |
| LP | B.A. Psychology |
| LPL | B.A. Political Science |
| LPM | B.A. Advertising and Marketing Communications |
| LPO | B.A. Organizational Psychology |
| LPS | B.S. Clinical Psychology and Health |
| LRI | B.A. International Relations |
| LTS | B.A. Social Transformation |
| MC | Physician & Surgeon |
| MO | Medical and Surgical Dentist |
| NEG | Business/Exploration |
| PBB | Bicultural High School |
| PBI | International High School |
| PTB | Bilingual High School |
| PTM | Multicultural High School |
| SLD | Health Sciences/Exploration |
| TIE | Information Technologies and Electronics/Exploration |
References
- Latif, A.; Choudhary, A.I.; Hammayun, A.A. Economic Effects of Student Dropouts: A Comparative Study. J. Global Econ. 2015, 3, 137. [Google Scholar] [CrossRef]
- Raisman, N. The Cost of College Attrition at Four-Year Colleges & Universities—An Analysis of 1669 US Institutions. Policy Perspect. 2013, 269. Available online: https://eric.ed.gov/?q=source%3A%22Educational+Policy+Institute%22&id=ED562625 (accessed on 24 August 2022).
- Da Silva, J.J.; Roman, N.T. Predicting Dropout in Higher Education: A Systematic Review. In Proceedings of the Anais do XXXII Simpósio Brasileiro de Informática na Educação; SBC: Porto Alegre, Brazil, 2021; pp. 1107–1117. [Google Scholar] [CrossRef]
- Fahd, K.; Venkatraman, S.; Miah, S.J.; Ahmed, K. Application of machine learning in higher education to assess student academic performance, at-risk, and attrition: A meta-analysis of literature. Educ. Inf. Technol. 2022, 27, 3743–3775. [Google Scholar] [CrossRef]
- Ranjeeth, S.; Latchoumi, T.P.; Paul, P.V. A Survey on Predictive Models of Learning Analytics. Procedia Comput. Sci. 2020, 167, 37–46. [Google Scholar] [CrossRef]
- Dutt, A.; Ismail, M.A.; Herawan, T. A Systematic Review on Educational Data Mining. IEEE Access 2017, 5, 15991–16005. [Google Scholar] [CrossRef]
- Kumar, M.; Singh, A.J.; Handa, D. Literature Survey on Educational Dropout Prediction. Int. J. Educ. Manag. Eng. 2017, 7, 8. [Google Scholar] [CrossRef]
- Saleem, F.; Ullah, Z.; Fakieh, B.; Kateb, F. Intelligent Decision Support System for Predicting Student’s E-Learning Performance Using Ensemble Machine Learning. Mathematics 2021, 9, 2078. [Google Scholar] [CrossRef]
- Hilliger, I.; Ortiz-Rojas, M.; Pesántez-Cabrera, P.; Scheihing, E.; Tsai, Y.S.; Muńoz-Merino, P.J.; Broos, T.; Whitelock-Wainwright, A.; Pérez-Sanagustín, M. Identifying needs for learning analytics adoption in Latin American universities: A mixed-methods approach. Internet High. Educ. 2020, 45, 100726. [Google Scholar] [CrossRef]
- Namoun, A.; Alshanqiti, A. Predicting Student Performance Using Data Mining and Learning Analytics Techniques: A Systematic Literature Review. Appl. Sci. 2021, 11, 237. [Google Scholar] [CrossRef]
- Cardona, T.A.; Cudney, E.A. Predicting Student Retention Using Support Vector Machines. Procedia Manuf. 2019, 39, 1827–1833. [Google Scholar] [CrossRef]
- Lázaro Alvarez, N.; Callejas, Z.; Griol, D. Predicting computer engineering students’ dropout in cuban higher education with pre-enrollment and early performance data. J. Technol. Sci. Educ. 2020, 10, 241–258. [Google Scholar] [CrossRef]
- Nagy, M.; Molontay, R. Predicting Dropout in Higher Education Based on Secondary School Performance. In Proceedings of the 2018 IEEE 22nd International Conference on Intelligent Engineering Systems (INES), Las Palmas de Gran Canaria, Spain, 21–23 June 2018; pp. 389–394. [Google Scholar] [CrossRef]
- Varga, E.B.; Sátán, Á. Detecting at-risk students on Computer Science bachelor programs based on pre-enrollment characteristics. Hung. Educ. Res. J. 2021, 11, 297–310. [Google Scholar] [CrossRef]
- Kiss, B.; Nagy, M.; Molontay, R.; Csabay, B. Predicting Dropout Using High School and First-semester Academic Achievement Measures. In Proceedings of the 2019 17th International Conference on Emerging eLearning Technologies and Applications (ICETA), Starý Smokovec, Slovakia, 21–22 November 2019; pp. 383–389. [Google Scholar] [CrossRef]
- Alshanqiti, A.; Namoun, A. Predicting Student Performance and Its Influential Factors Using Hybrid Regression and Multi-Label Classification. IEEE Access 2020, 8, 203827–203844. [Google Scholar] [CrossRef]
- Hoffman, J.L.; Lowitzki, K.E. Predicting College Success with High School Grades and Test Scores: Limitations for Minority Students. Rev. High. Educ. 2005, 28, 455–474. [Google Scholar] [CrossRef]
- Zwick, R.; Himelfarb, I. The Effect of High School Socioeconomic Status on the Predictive Validity of SAT Scores and High School Grade-Point Average. J. Educ. Meas. 2011, 48, 101–121. [Google Scholar] [CrossRef]
- Freitas, F.A.d.S.; Vasconcelos, F.F.X.; Peixoto, S.A.; Hassan, M.M.; Dewan, M.A.A.; Albuquerque, V.H.C.D.; Filho, P.P.R. IoT System for School Dropout Prediction Using Machine Learning Techniques Based on Socioeconomic Data. Electronics 2020, 9, 1613. [Google Scholar] [CrossRef]
- Séllei, B.; Stumphauser, N.; Molontay, R. Traits versus Grades—The Incremental Predictive Power of Positive Psychological Factors over Pre-Enrollment Achievement Measures on Academic Performance. Appl. Sci. 2021, 11, 1744. [Google Scholar] [CrossRef]
- Terry, M. The Effects that Family Members and Peers Have on Students’ Decisions to Drop out of School. Educ. Res. Q. 2008, 31, 25–38. [Google Scholar]
- Slade, S.; Prinsloo, P. Learning Analytics: Ethical Issues and Dilemmas. Am. Behav. Sci. 2013, 57, 1510–1529. [Google Scholar] [CrossRef] [Green Version]
- Ferreyra, M.M.; Avitabile, C.; Botero Álvarez, J.; Haimovich Paz, F.; Urzúa, S. At a Crossroads: Higher Education in Latin America and the Caribbean; The World Bank Group: Washington, DC, USA, 2017. [Google Scholar] [CrossRef]
- Ferreira, F.H.G.; Messina, J.; Rigolini, J.; López-Calva, L.F.; Lugo, M.A.; Vakis, R. Economic Mobility and the Rise of the Latin American Middle Class; The World Bank Group: Washington, DC, USA, 2013. [Google Scholar] [CrossRef]
- Lemaitre, M.J. Quality assurance in Latin America: Current situation and future challenges. Tuning J. High. Educ. 2017, 5, 21–40. [Google Scholar] [CrossRef]
- González-Velosa, C.; Rucci, G.; Sarzosa, M.; Urzúa, S. Returns to Higher Education in Chile and Colombia; Technical Report, IDB Working Paper Series No. IDB-WP-587; Inter-American Development Bank: Washington, DC, USA, 2015. [Google Scholar]
- Cobo, C.; Aguerrebere, C. Building capacity for learning analytics in Latin America. In Learning Analytics for the Global South; Lim, C.P., Tinio, V.L., Eds.; Foundation for Information Technology Education and Development, Inc.: Quezon City, Philippines, 2018; Volume 58, pp. 63–67. [Google Scholar]
- Call for Proposals: Bringing New Solutions to the Challenges of Predicting and Countering Student Dropout in Higher Education. 2022. Available online: https://ifelldh.tec.mx/en/student-dropout-higher-education (accessed on 9 June 2022).
- Tecnologico de Monterrey. Tecnologico de Monterrey. 2022. Available online: https://tec.mx/en (accessed on 11 May 2022).
- The Tec Is Transforming Its Educational Model to Become More Flexible. 2022. Available online: https://conecta.tec.mx/en/news/national/education/tec-transforming-its-educational-model-become-more-flexible (accessed on 18 May 2022).
- Tec de Monterrey Has Reinvented Its Student Experience, Presents LiFE. 2022. Available online: https://conecta.tec.mx/en/news/national/institution/tec-de-monterrey-has-reinvented-its-student-experience-presents-life (accessed on 18 May 2022).
- Gestión de Datos de Investigación. 2022. Available online: https://biblioguias.cepal.org/c.php?g=495473&p=4994826 (accessed on 21 June 2022).
- Primer on Data Management: What You Always Wanted to Know. 2022. Available online: https://old.dataone.org/sites/all/documents/DataONE_BP_Primer_020212.pdf (accessed on 21 June 2022).
- Rastrollo-Guerrero, J.L.; Gómez-Pulido, J.A.; Durán-Domínguez, A. Analyzing and Predicting Students’ Performance by Means of Machine Learning: A Review. Appl. Sci. 2020, 10, 1042. [Google Scholar] [CrossRef]
- Baranyi, M.; Nagy, M.; Molontay, R. Interpretable Deep Learning for University Dropout Prediction. In Proceedings of the 21st Annual Conference on Information Technology Education, Virtual, 7–9 October 2020; Association for Computing Machinery: New York, NY, USA, 2020; pp. 13–19. [Google Scholar] [CrossRef]
- Nagy, M.; Molontay, R.; Szabó, M. A Web Application for Predicting Academic Performance and Identifying the Contributing Factors. In Proceedings of the SEFI 47th Annual Conference, Budapest, Hungary, 16–19 September 2019; pp. 1794–1806. [Google Scholar]
- Smith, B.I.; Chimedza, C.; Bührmann, J.H. Individualized help for at-risk students using model-agnostic and counterfactual explanations. Educ. Inf. Technol. 2022, 27, 1539–1558. [Google Scholar] [CrossRef]
Publisher’s Note: MDPI stays neutral with regard to jurisdictional claims in published maps and institutional affiliations. |
© 2022 by the authors. Licensee MDPI, Basel, Switzerland. This article is an open access article distributed under the terms and conditions of the Creative Commons Attribution (CC BY) license (https://creativecommons.org/licenses/by/4.0/).