
Event Forecasting for Thailand’s Car Sales during the COVID-19 Pandemic

Abstract
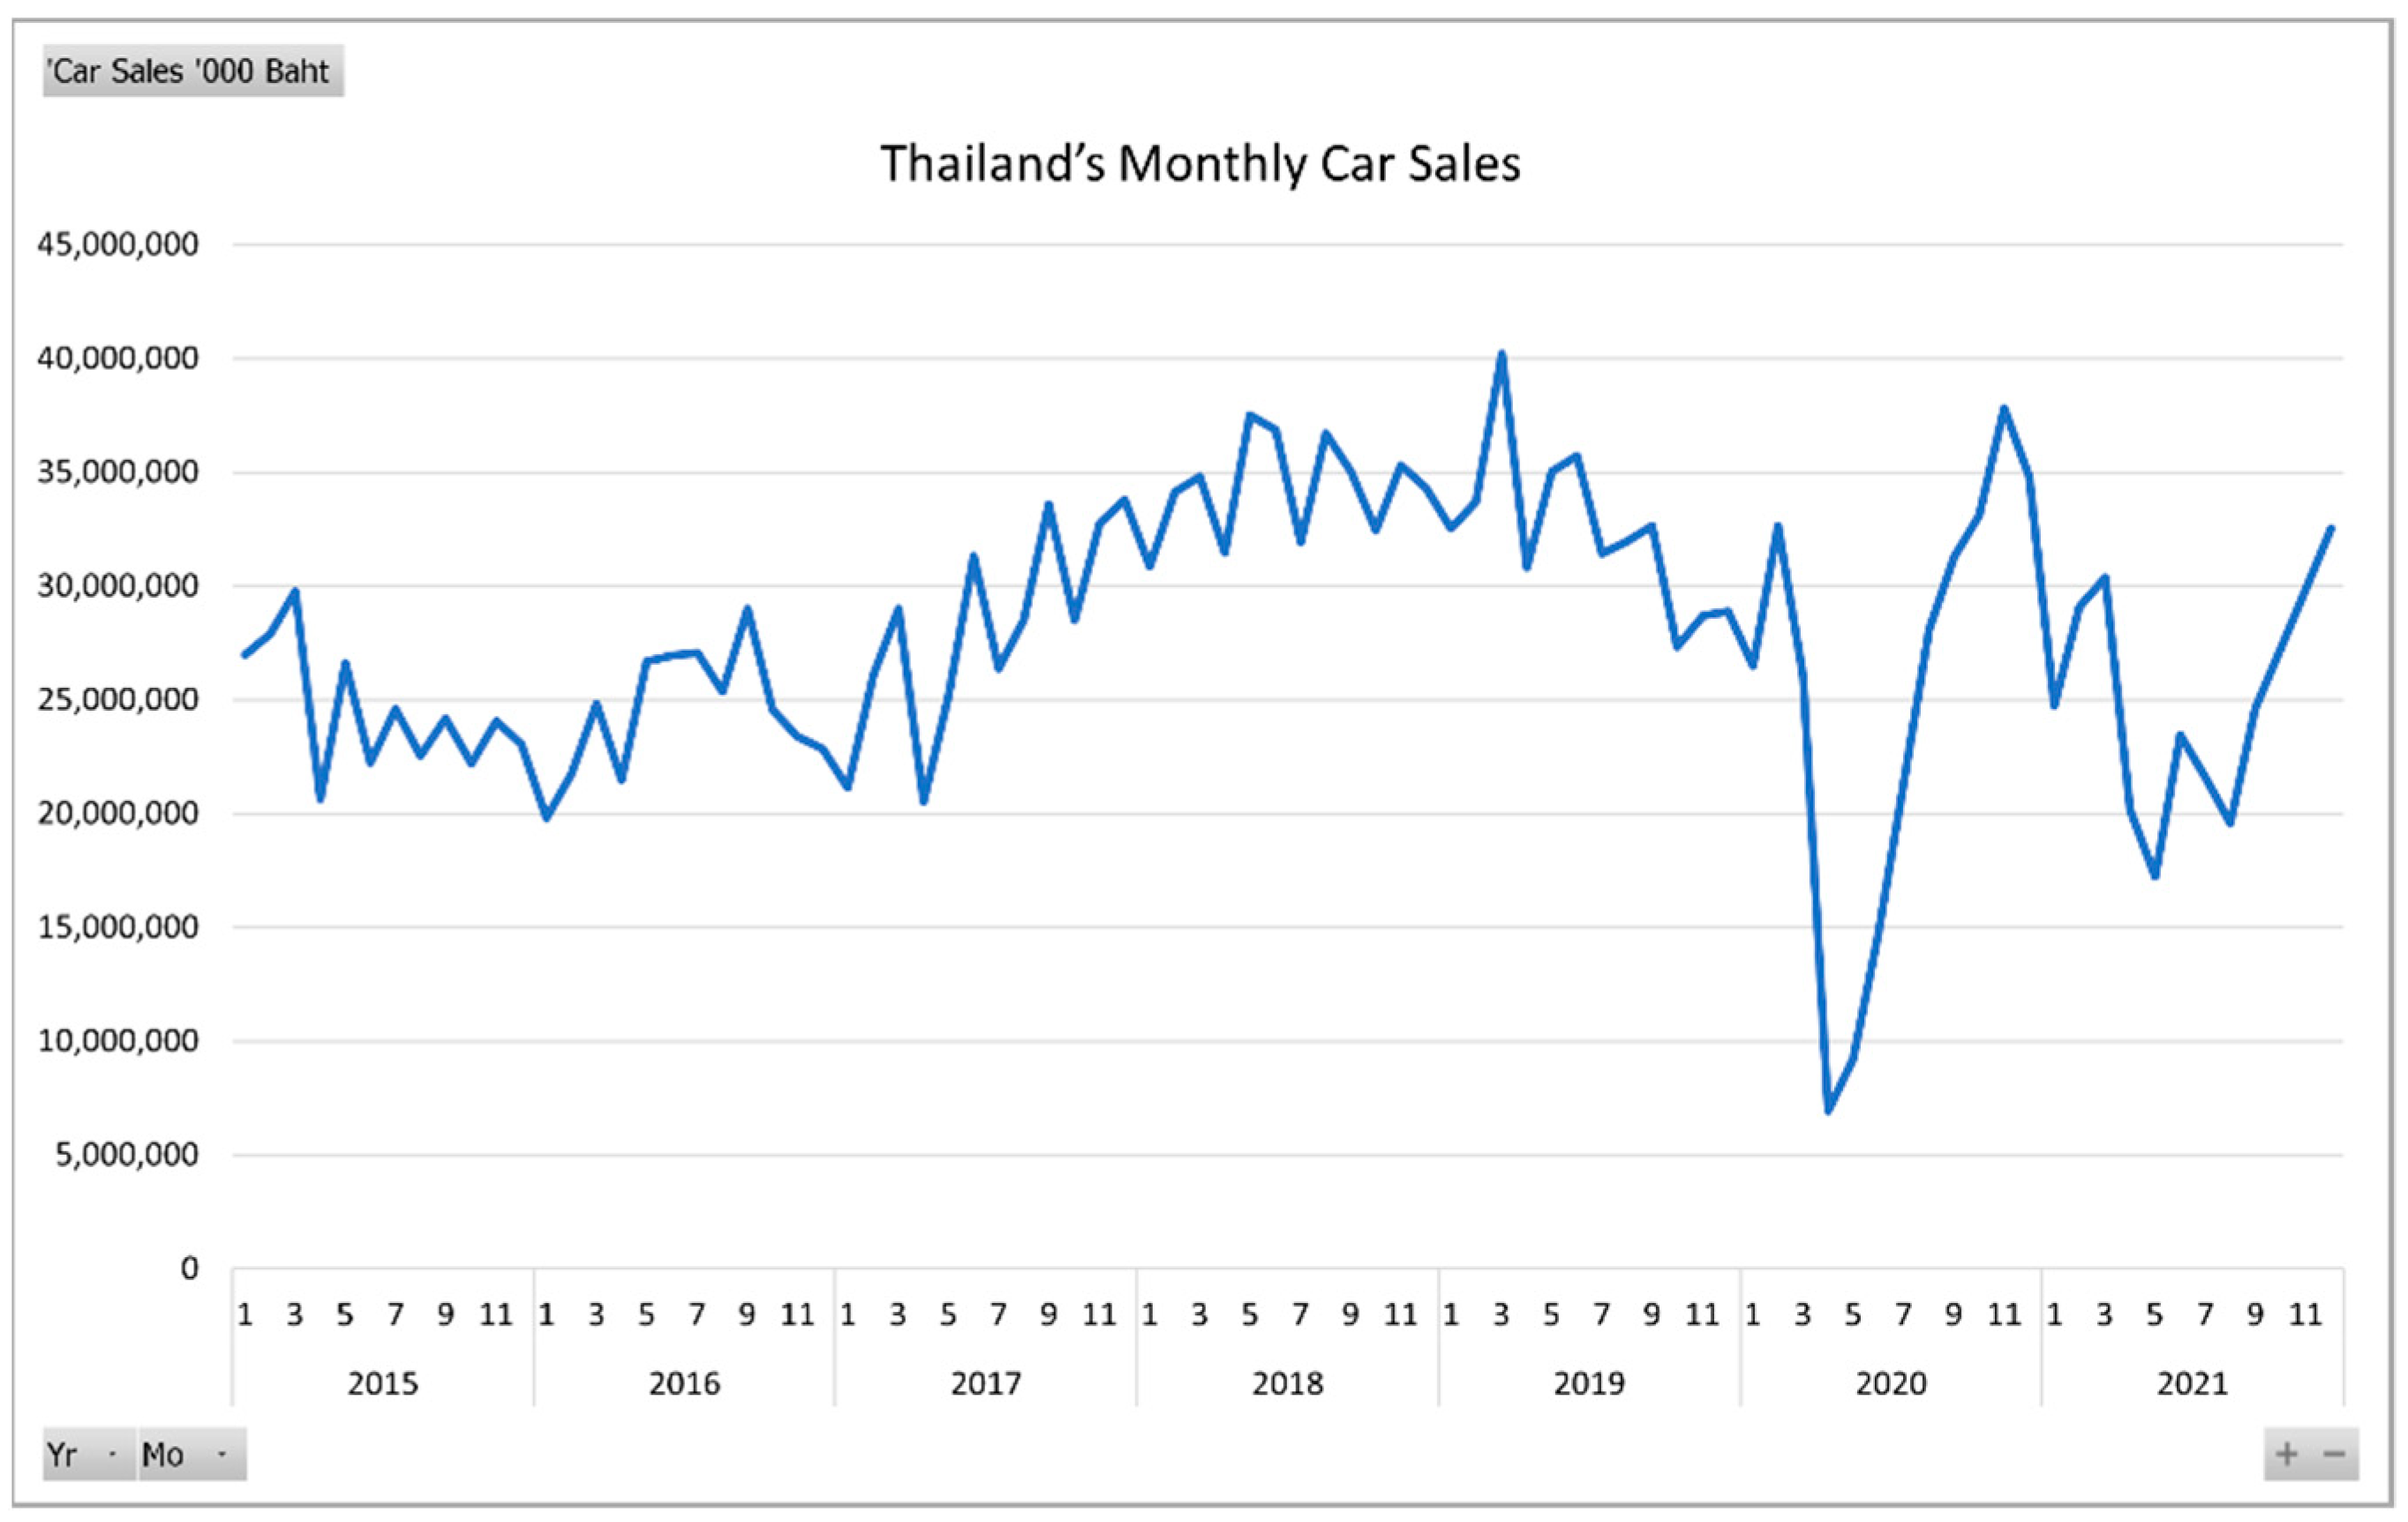
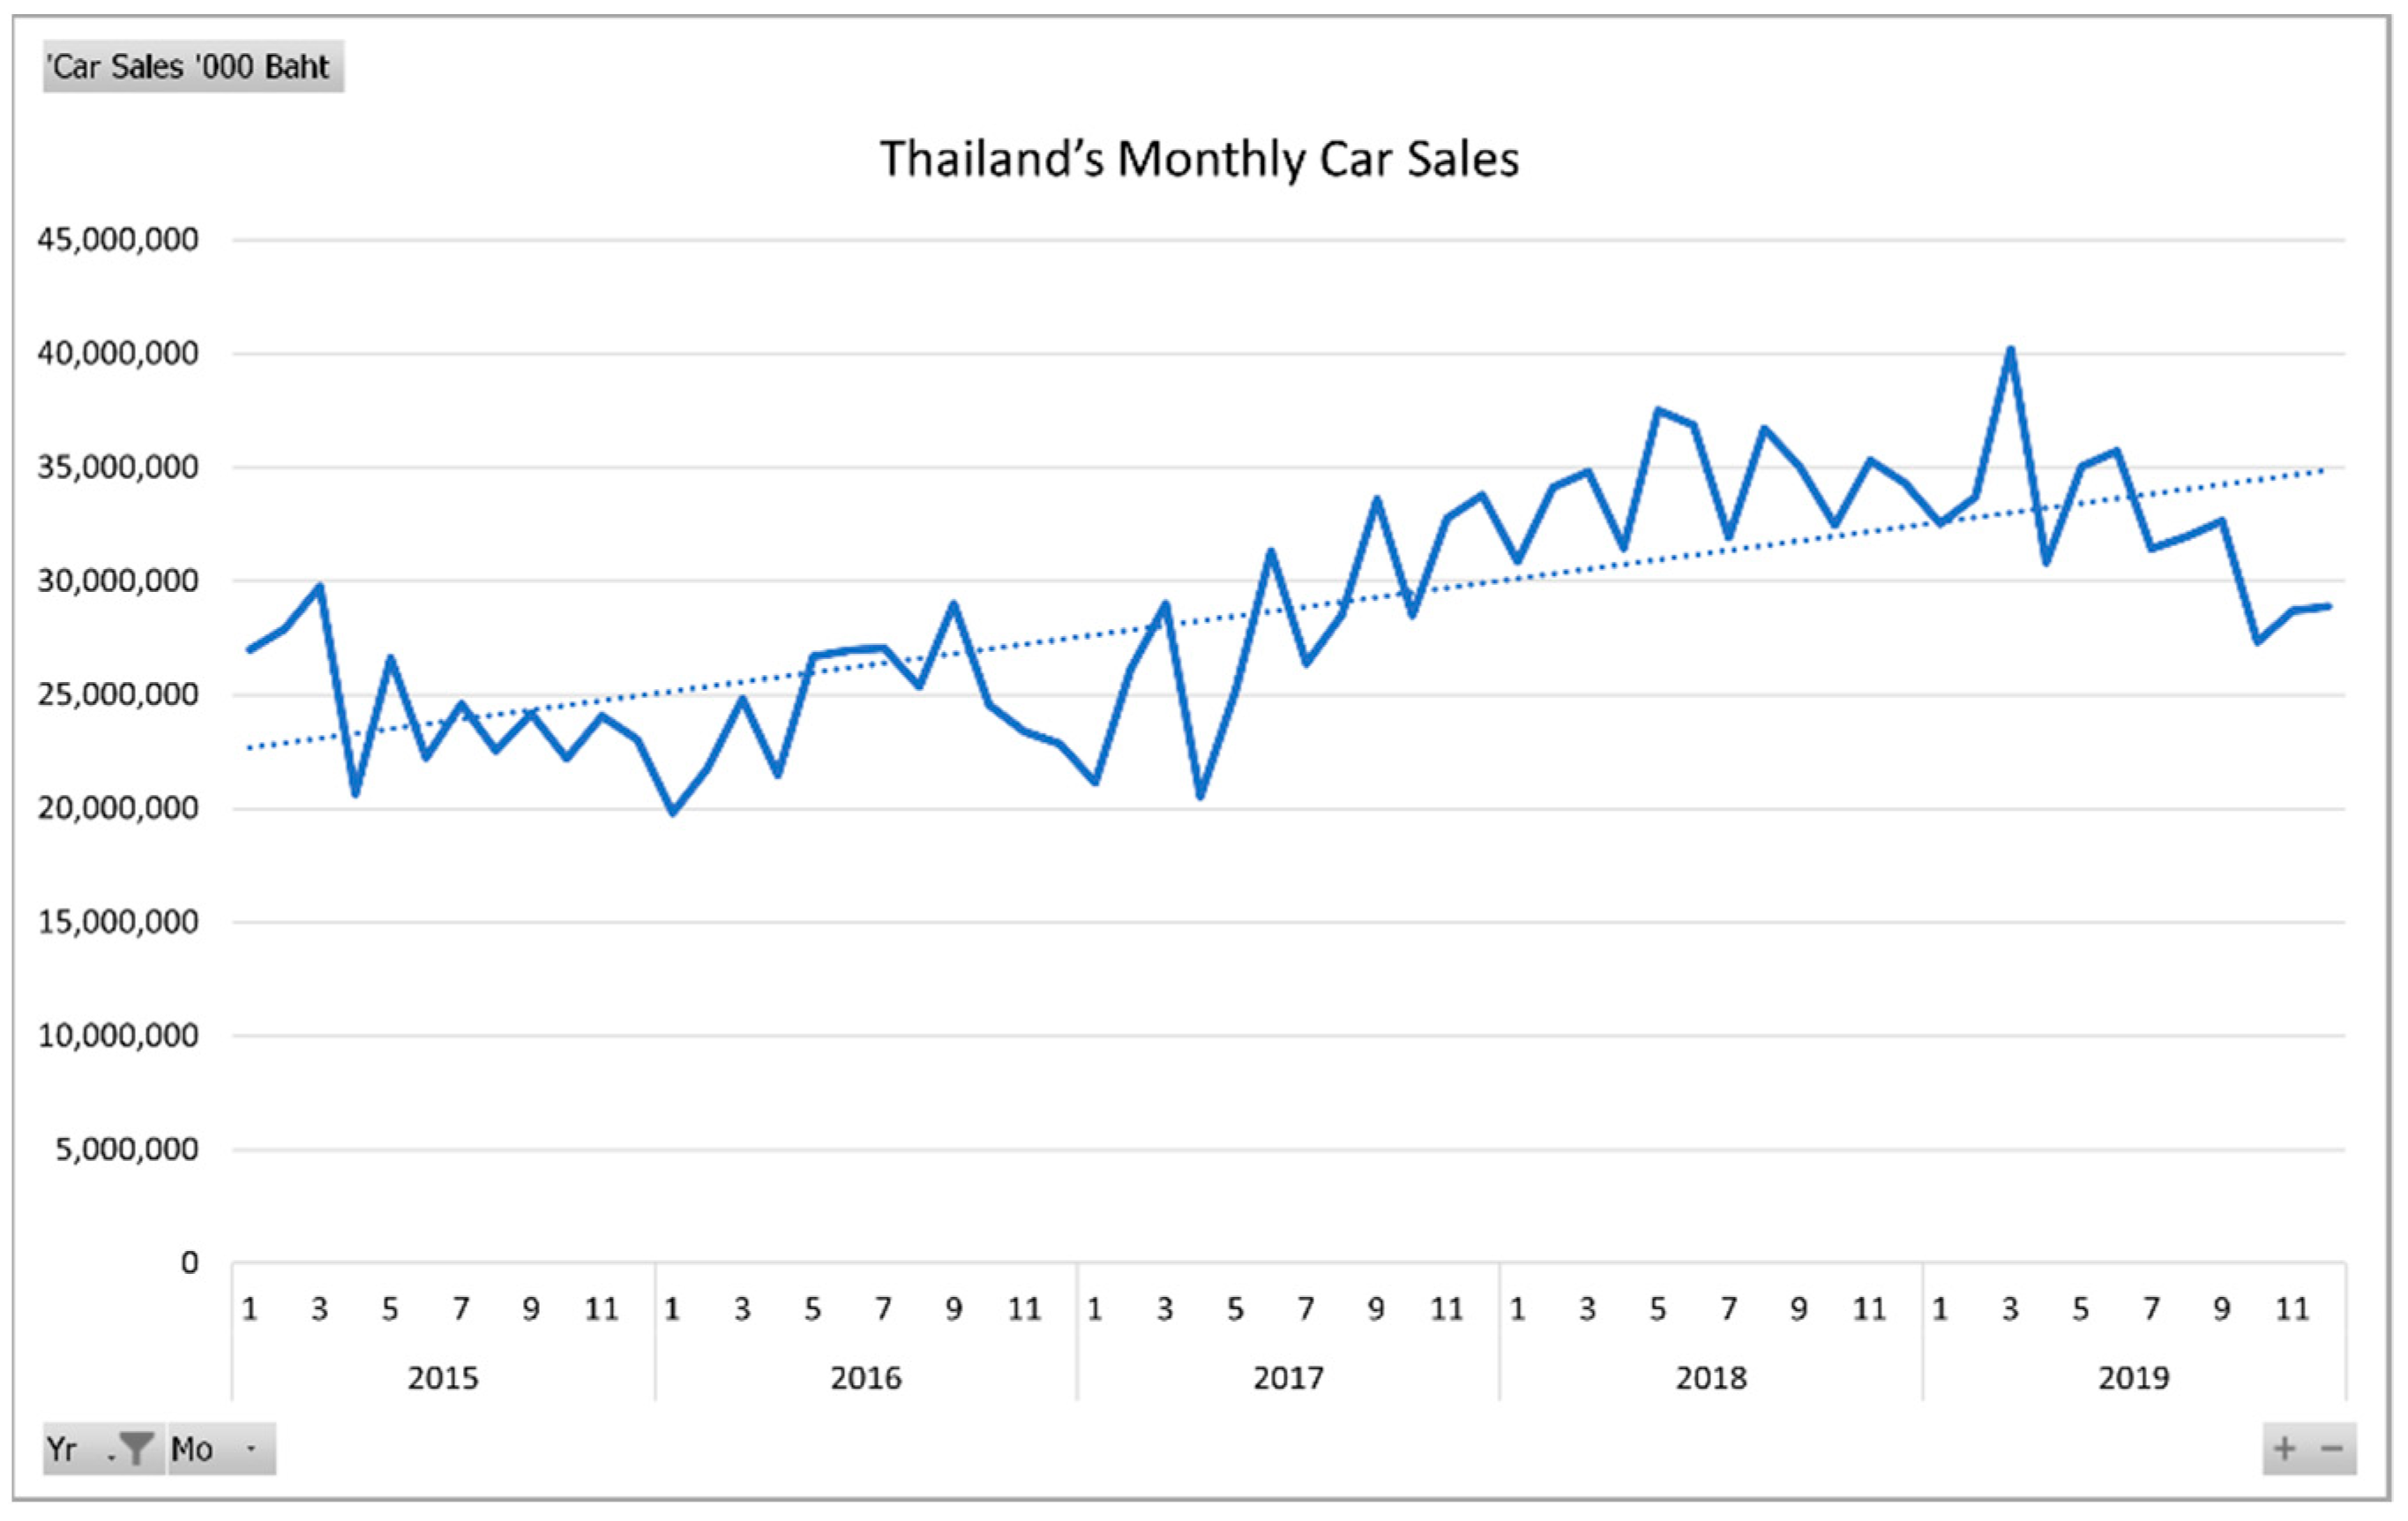
:1. Introduction
2. Literature Review
3. Materials and Methods
3.1. The Typical Holt’s Method
- Step 1: Computing the Level Estimate.
- Step 2: Computing the Trend Estimate.
- Step 3: Computing the Holt’s Estimate.
3.2. The Holt’s Method with Seasonality
- Step 1 (Additional): Dealing with Seasonality.
- Step 1.1: Finding the Moving Averages (MAs).
- Step 1.2: Finding the Centered Moving Averages (CMAs).
- Step 1.3: Computing the Seasonal Factors.
- Step 1.4: Computing the Unscaled Seasonal Indices.
- Step 1.5: Computing the (Scaled) Seasonal Indices.
- Step 1.6: Removing Seasonality From the Data (De-seasonalization).
- Steps 2 to 4: Computing Level, Trend, and Holt’s Estimates.
- Step 5 (Additional): Computing the Holt’s Estimate with Seasonality (Re-seasonalization).
3.3. The Holt’s Method with Events
- Steps 1 to 2: Computing Level and Trend Estimates.
- Step 3 (Additional): Computing the Event Estimate.
Ekt = δ (At/Lt) + (1 − δ) Ekt−; k = 1, 2, 3,
- Case 1: when t > 1, the initial value is Ek1 = 1.
- Case 2: when t ≠ 1, the initial value is Ekt = Et−1, where Et−1 refers to the event factor immediately preceding the current period t.
- Step 4: Computing the Holt’s Estimate with Events.
3.4. The Holt’s Method with Seasonality and Events
- Step 1: Dealing with Seasonality.
- Steps 1.1 to 1.3: Computing MAs, CMAs, and the Seasonal Factors.
- Step 1.4: Computing the Unscaled Seasonal Indices of the Normal Sales Periods Only.
- Step 1.5: Computing the (Scaled) Seasonal Indices of the Normal Sales Periods Only.
- Step 1.6: De-seasonalization.
- Steps 2 to 3: Computing Level and Trend Estimates.
- Steps 4 to 5: Computing the Event Estimate and Holt’s Estimate with Events.
- Step 6: Computing the Holt’s Estimate with Events and Seasonality (Re-seasonalization).
3.5. The Accuracy Measurement
4. Results and Discussion
4.1. Implementation of the Holt’s Method with Seasonality and Events on the Car Sales Data
4.2. Numerical Results
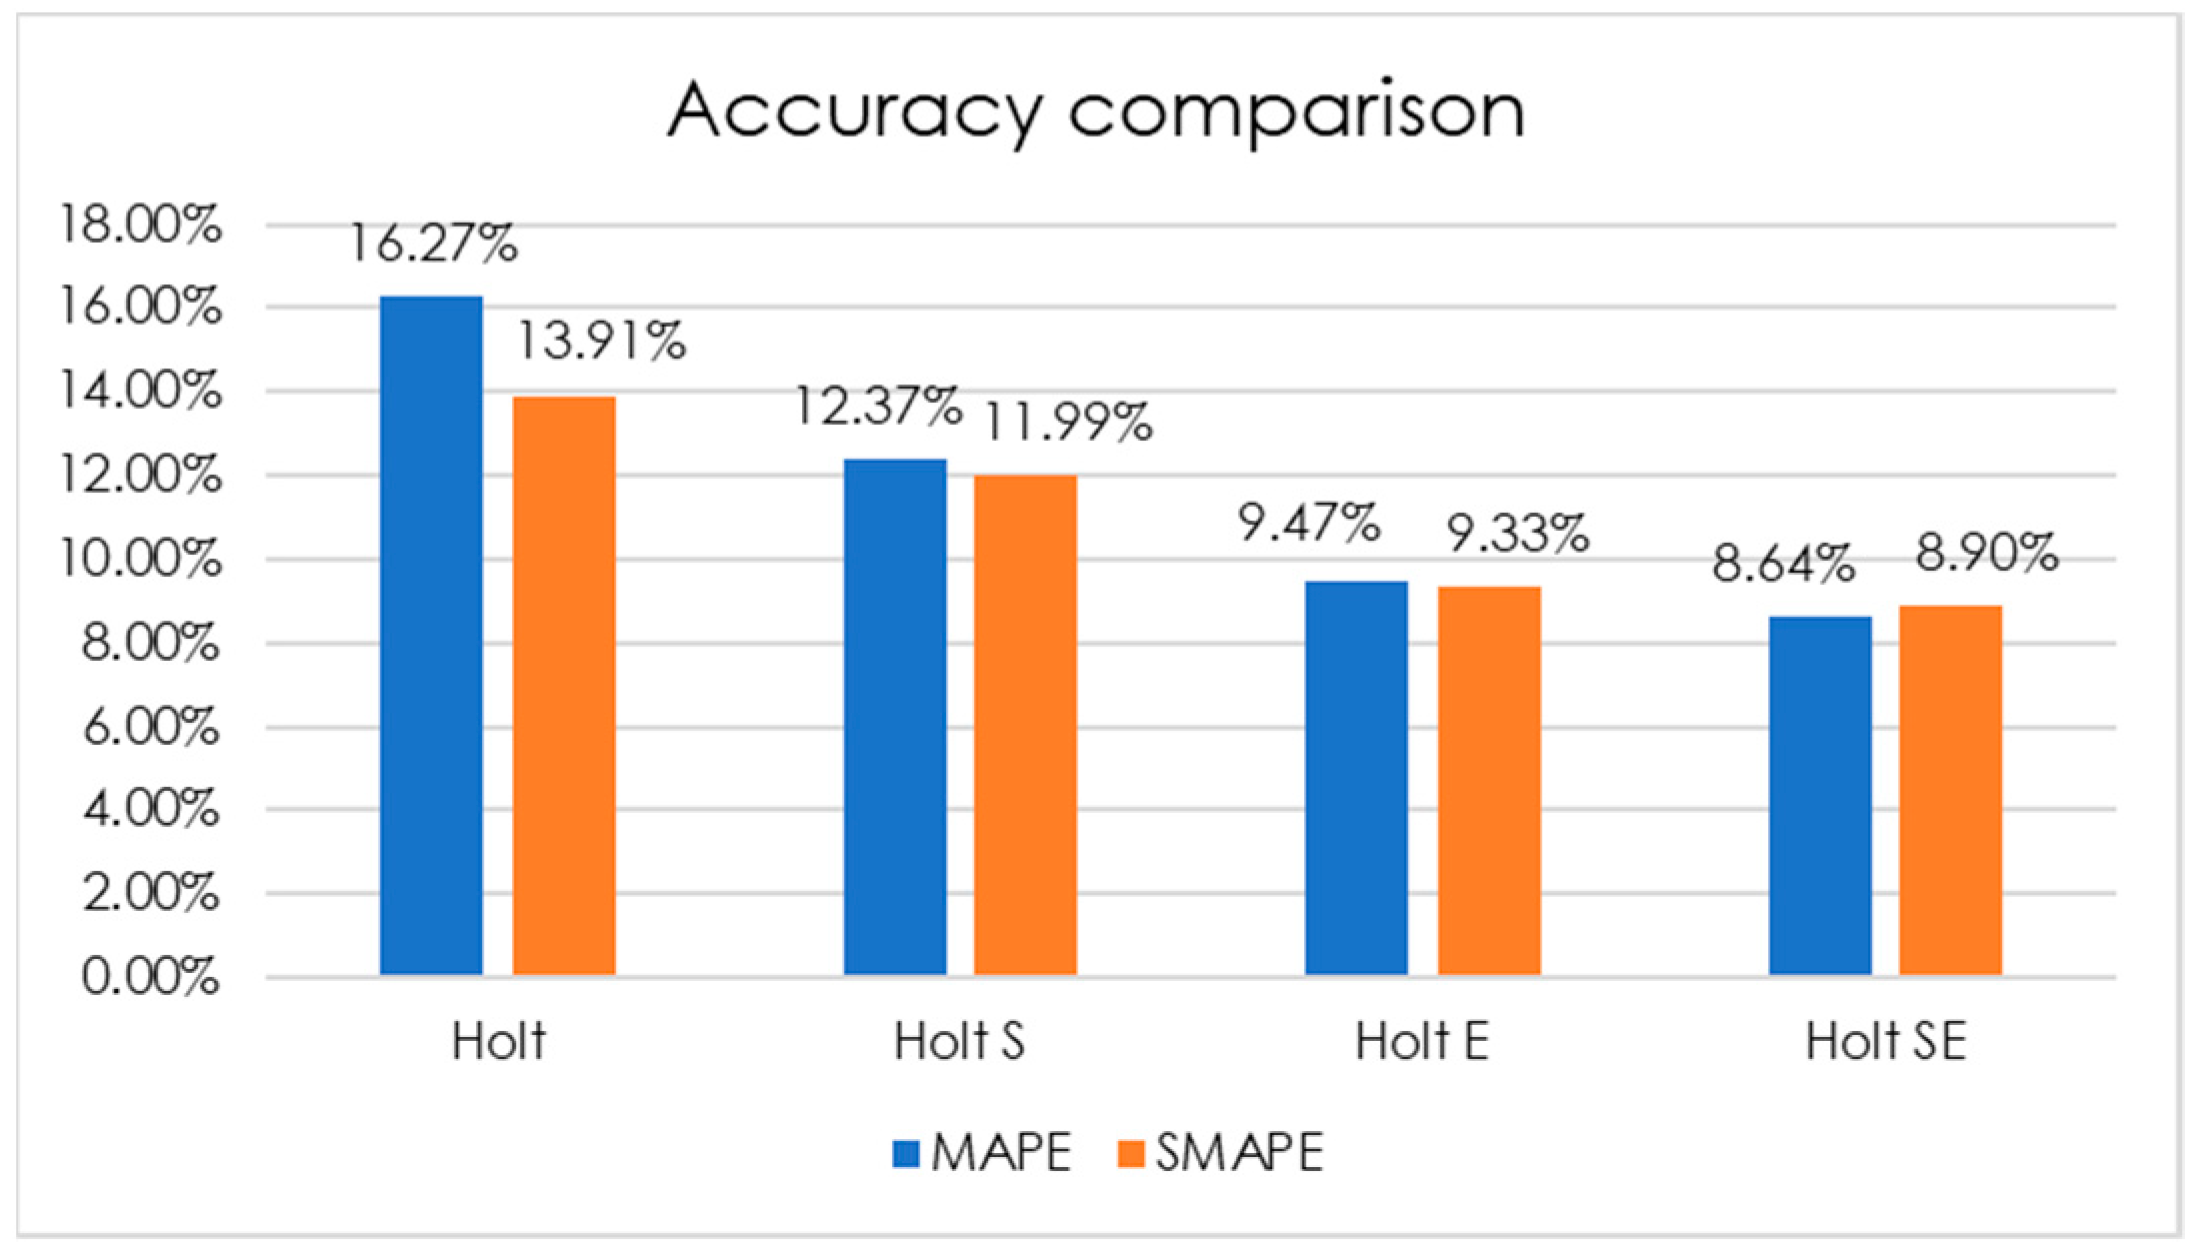
4.3. Forecasting Accuracy Comparison and Discussion
5. Conclusions
Author Contributions
Funding
Institutional Review Board Statement
Informed Consent Statement
Data Availability Statement
Conflicts of Interest
References
- ASEAN Briefing. Available online: https://www.aseanbriefing.com/news/thailands-automotive-industry-opportunities-incentives/ (accessed on 29 April 2022).
- CNN BUSINESS. Available online: https://money.cnn.com/2017/02/20/autos/traffic-rush-hour-cities/index.html (accessed on 29 April 2022).
- Mashable. Available online: https://mashable.com/article/bangkok-traffic-jams (accessed on 29 April 2022).
- Focus2move. Available online: https://www.focus2move.com/thailand-best-selling-car/#:~:text=Thailand%27s%20best%2Dselling%20car%20ranking,units%20sold%20(%2D4.8%25) (accessed on 29 April 2022).
- World Health Organization. Available online: https://www.who.int/emergencies/disease-outbreak-news/item/2020-DON234 (accessed on 28 April 2022).
- World Health Organization. Available online: https://www.who.int/news/item/13-10-2020-impact-of-covid-19-on-people’s-livelihoods-their-health-and-our-food-systems (accessed on 28 April 2022).
- The World Bank. Available online: https://www.worldbank.org/en/country/thailand/publication/monitoring-the-impact-of-covid-19-in-thailand#:~:text=Income%3A,income%20groups%20experiencing%20income%20%20declines (accessed on 28 April 2022).
- Leenawong, C. Logistics Intelligence and Forecasting with Excel 365; KMITL: Bangkok, Thailand, 2022; pp. 89–90. [Google Scholar]
- Wirotcheewan, P.; Kengpol, A.; Ishii, K.; Shimada, Y. Modelling and Forecasting for Automotive Parts Demand of Foreign Markets on Thailand. Asian Int. J. Sci. Technol. Prod. Manuf. Eng. 2011, 4, 1–13. [Google Scholar]
- Rattanametawee, W.; Leenawong, C.; Netisopakul, P. The Effects of Special Events on Regression for Subcompact Car Sales in Thailand. J. Teknol. 2016, 78, 161–165. [Google Scholar] [CrossRef] [Green Version]
- Booranawong, T.; Booranawong, A. Double exponential smoothing and Holt-Winters methods with optimal initial values and weighting factors for forecasting lime, Thai chili and lemongrass prices in Thailand. Eng. Appl. Sci. Res. 2018, 45, 32–38. [Google Scholar] [CrossRef]
- Muchayan, A. Comparison of Holt and Brown’s Double Exponential Smoothing Methods in The Forecast of Moving Price for Mutual Funds. J. Appl. Sci. Eng. Technol. Educ. 2019, 1, 183–192. [Google Scholar] [CrossRef]
- Sharif, O.; Hasan, M.Z. Forecasting the Stock Price by using Holt’s Method. Indones. J. Contemp. Manag. Res. 2019, 1, 15–24. [Google Scholar] [CrossRef]
- Suppalakpanya, K.; Nikhom, R.; Booranawong, T.; Booranawong, A. Study of Several Exponential Smoothing Methods for Forecasting Crude Palm Oil Productions in Thailand. Curr. Appl. Sci. Technol. 2019, 19, 123–149. [Google Scholar] [CrossRef]
- Rattanametawee, W.; Leenawong, C. Event Index Computation for Forecasting Case Study: Car Sales in Thailand. Thai J. Math. 2020, 18, 2079–2091. [Google Scholar]
- The Office of Industrial Economics, Ministry of Industry, Thailand. Available online: https://indexes.oie.go.th/industrialStatistics1.aspx (accessed on 3 August 2021).
- Leenawong, C. Data Analytics with Excel for Logistics & Supply Chain Management; CU Press: Bangkok, Thailand, 2022; p. 47. [Google Scholar]
- NIST. Available online: https://www.itl.nist.gov/div898/handbook/ (accessed on 6 February 2022).
- Hyndman, R.J.; Athanasopoulos, G. Forecasting: Principles and Practice, 2nd ed.; OTexts: Melbourne, Australia, 2018; p. 2. [Google Scholar]


| Period | Yr | Mo | k | Car Sales (‘000 Baht) | MA | CMA | SF | SI Unscaled | SI | Deseason |
|---|---|---|---|---|---|---|---|---|---|---|
| 1 | 2015 | 1 | 0 | 26,977,961.53 | 0.9296 | 0.9178 | 29,395,602.24 | |||
| 2 | 2015 | 2 | 0 | 27,902,176.73 | 1.0643 | 1.0508 | 26,554,084.21 | |||
| 3 | 2015 | 3 | 0 | 29,774,248.84 | 1.0950 | 1.0811 | 27,541,580.65 | |||
| 4 | 2015 | 4 | 0 | 20,635,767.24 | 0.8765 | 0.8653 | 23,847,031.31 | |||
| 5 | 2015 | 5 | 0 | 26,625,638.70 | 1.0466 | 1.0333 | 25,768,470.42 | |||
| 6 | 2015 | 6 | 0 | 22,234,255.04 | 24,564,721.20 | 1.1011 | 1.0870 | 20,453,895.19 | ||
| 7 | 2015 | 7 | 0 | 24,605,387.66 | 23,967,856.58 | 24,266,288.89 | 1.0140 | 0.9903 | 0.9777 | 25,167,107.50 |
| ⋮ | ⋮ | ⋮ | ⋮ | ⋮ | ⋮ | ⋮ | ⋮ | ⋮ | ⋮ | ⋮ |
| 61 | 2020 | 1 | 0 | 26,502,129.77 | 23,917,024.70 | 24,333,568.57 | 1.0891 | 0.9296 | 0.9178 | 28,877,128.64 |
| 62 | 2020 | 2 | 0 | 32,657,258.86 | 23,595,908.11 | 23,756,466.40 | 1.3747 | 1.0643 | 1.0508 | 31,079,424.73 |
| 63 | 2020 | 3 | 0 | 26,042,182.41 | 23,481,330.89 | 23,538,619.50 | 1.1064 | 1.0950 | 1.0811 | 24,089,369.01 |
| 64 | 2020 | 4 | 1 | 6,960,649.53 | 23,962,827.37 | 23,722,079.13 | 0.2934 | 0.8765 | 0.8653 | 8,043,840.84 |
| 65 | 2020 | 5 | 1 | 9,204,254.83 | 24,722,380.43 | 24,342,603.90 | 0.3781 | 1.0466 | 1.0333 | 8,907,939.10 |
| 66 | 2020 | 6 | 1 | 14,674,115.15 | 25,217,869.42 | 24,970,124.93 | 0.5877 | 1.1011 | 1.0870 | 13,499,117.14 |
| 67 | 2020 | 7 | 1 | 21,454,176.54 | 25,070,934.52 | 25,144,401.97 | 0.8532 | 0.9903 | 0.9777 | 21,943,956.93 |
| 68 | 2020 | 8 | 2 | 28,104,687.94 | 24,771,931.36 | 24,921,432.94 | 1.1277 | 1.0040 | 0.9912 | 28,353,320.27 |
| 69 | 2020 | 9 | 2 | 31,278,826.07 | 25,133,393.68 | 24,952,662.52 | 1.2535 | 1.0758 | 1.0621 | 29,448,765.08 |
| 70 | 2020 | 10 | 2 | 33,105,584.68 | 26,234,010.91 | 25,683,702.29 | 1.2890 | 0.9447 | 0.9327 | 35,495,335.99 |
| 71 | 2020 | 11 | 2 | 37,805,573.95 | 26,902,365.10 | 26,568,188.00 | 1.4230 | 1.0143 | 1.0014 | 37,754,524.32 |
| 72 | 2020 | 12 | 2 | 34,824,993.37 | 27,635,278.36 | 27,268,821.73 | 1.2771 | 1.0126 | 0.9997 | 34,835,988.33 |
| 73 | 2021 | 1 | 3 | 24,738,910.91 | 27,648,750.56 | 27,642,014.46 | 0.8950 | 0.9296 | 0.9178 | 26,955,898.22 |
| 74 | 2021 | 2 | 2 | 29,069,220.98 | 26,938,095.62 | 27,293,423.09 | 1.0651 | 1.0643 | 1.0508 | 27,664,742.76 |
| 75 | 2021 | 3 | 2 | 30,379,730.20 | 26,384,499.74 | 26,661,297.68 | 1.1395 | 1.0950 | 1.0811 | 28,101,659.06 |
| 76 | 2021 | 4 | 3 | 20,168,056.27 | 25,893,933.88 | 26,139,216.81 | 0.7716 | 0.8765 | 0.8653 | 23,306,536.84 |
| 77 | 2021 | 5 | 3 | 17,224,505.15 | 25,237,711.02 | 25,565,822.45 | 0.6737 | 1.0466 | 1.0333 | 16,669,990.77 |
| 78 | 2021 | 6 | 3 | 23,469,074.27 | 25,047,140.56 | 25,142,425.79 | 0.9334 | 1.1011 | 1.0870 | 21,589,838.94 |
| 79 | 2021 | 7 | 3 | 21,615,842.91 | 0.9903 | 0.9777 | 22,109,314.01 | |||
| 80 | 2021 | 8 | 3 | 19,576,828.62 | 1.0040 | 0.9912 | 19,750,017.97 | |||
| 81 | 2021 | 9 | 3 | 24,635,675.60 | 1.0758 | 1.0621 | 23,194,291.94 | |||
| 82 | 2021 | 10 | 2 | 27,218,794.28 | 0.9447 | 0.9327 | 29,183,603.23 | |||
| 83 | 2021 | 11 | 2 | 29,930,899.65 | 1.0143 | 1.0014 | 29,890,483.35 | |||
| 84 | 2021 | 12 | 2 | 32,538,147.92 | 1.0126 | 0.9997 | 32,548,420.87 |
| Period | Yr | Mo | k | Deseason | L | T | Et- | E | HE | FE |
|---|---|---|---|---|---|---|---|---|---|---|
| 1 | 2015 | 1 | 0 | 29,395,602.24 | 1.0000 | |||||
| 2 | 2015 | 2 | 0 | 26,554,084.21 | 26,554,084.21 | −2,841,518.04 | 1.0000 | 1.0000 | ||
| 3 | 2015 | 3 | 0 | 27,541,580.65 | 24,585,859.63 | −2,418,254.32 | 1.0000 | 1.0000 | 23,712,566.17 | 25,634,833.91 |
| 4 | 2015 | 4 | 0 | 23,847,031.31 | 22,550,636.44 | −2,232,608.62 | 1.0000 | 1.0000 | 22,167,605.31 | 19,182,494.35 |
| 5 | 2015 | 5 | 0 | 25,768,470.42 | 21,561,124.69 | −1,630,110.35 | 1.0000 | 1.0000 | 20,318,027.83 | 20,993,891.35 |
| 6 | 2015 | 6 | 0 | 20,453,895.19 | 20,050,269.16 | −1,572,310.49 | 1.0000 | 1.0000 | 19,931,014.34 | 21,665,861.30 |
| 7 | 2015 | 7 | 0 | 25,167,107.50 | 20,003,570.54 | −832,884.20 | 1.0000 | 1.0000 | 18,477,958.67 | 18,065,537.97 |
| ⋮ | ⋮ | ⋮ | ⋮ | ⋮ | ⋮ | ⋮ | ⋮ | ⋮ | ⋮ | ⋮ |
| 61 | 2020 | 1 | 0 | 28,877,128.64 | 27,968,469.87 | −928,188.07 | 1.0000 | 1.0000 | 27,699,998.74 | 25,421,812.91 |
| 62 | 2020 | 2 | 0 | 31,079,424.73 | 27,961,499.82 | −481,696.51 | 1.0000 | 1.0000 | 27,040,281.80 | 28,413,057.51 |
| 63 | 2020 | 3 | 0 | 24,089,369.01 | 26,706,537.99 | −856,479.06 | 1.0000 | 1.0000 | 27,479,803.31 | 29,707,463.49 |
| 64 | 2020 | 4 | 1 | 8,043,840.84 | 21,788,947.66 | −2,824,799.13 | 1.0000 | 0.3692 | 9,543,084.10 | 8,258,003.25 |
| 65 | 2020 | 5 | 1 | 8,907,939.10 | 16,670,602.24 | −3,936,424.22 | 0.3692 | 0.5344 | 10,133,495.95 | 10,470,578.87 |
| 66 | 2020 | 6 | 1 | 13,499,117.14 | 12,908,639.70 | −3,851,866.96 | 0.5344 | 1.0457 | 13,316,675.08 | 14,475,792.87 |
| 67 | 2020 | 7 | 1 | 21,943,956.93 | 11,995,986.94 | −2,427,302.62 | 1.0457 | 1.8293 | 16,567,326.39 | 16,197,550.25 |
| 68 | 2020 | 8 | 2 | 28,353,320.27 | 13,852,945.94 | −350,827.11 | 1.8293 | 2.0467 | 19,584,568.67 | 19,412,830.15 |
| 69 | 2020 | 9 | 2 | 29,448,765.08 | 17,139,112.64 | 1,411,933.73 | 2.0467 | 1.7182 | 23,199,609.81 | 24,641,323.94 |
| 70 | 2020 | 10 | 2 | 35,495,335.99 | 22,415,575.33 | 3,284,975.22 | 1.7182 | 1.5835 | 29,375,807.40 | 27,398,058.15 |
| 71 | 2020 | 11 | 2 | 37,754,524.32 | 28,449,732.24 | 4,617,435.51 | 1.5835 | 1.3271 | 34,106,193.08 | 34,152,309.63 |
| 72 | 2020 | 12 | 2 | 34,835,988.33 | 33,470,587.34 | 4,812,962.99 | 1.3271 | 1.0408 | 34,416,111.62 | 34,405,249.19 |
| 73 | 2021 | 1 | 3 | 26,955,898.22 | 35,700,022.74 | 3,560,791.15 | 1.0408 | 0.7551 | 28,906,633.86 | 26,529,208.34 |
| 74 | 2021 | 2 | 2 | 27,664,742.76 | 36,616,067.26 | 2,278,947.95 | 1.0408 | 0.7555 | 29,662,943.02 | 31,168,865.47 |
| 75 | 2021 | 3 | 2 | 28,101,659.06 | 36,433,345.92 | 1,085,837.80 | 0.7555 | 0.7713 | 30,000,386.43 | 32,432,378.60 |
| 76 | 2021 | 4 | 3 | 23,306,536.84 | 34,277,667.74 | −485,244.72 | 0.7551 | 0.6799 | 25,510,552.36 | 22,075,276.95 |
| 77 | 2021 | 5 | 3 | 16,669,990.77 | 29,887,264.59 | −2,377,978.31 | 0.6799 | 0.5578 | 18,848,141.09 | 19,475,109.96 |
| 78 | 2021 | 6 | 3 | 21,589,838.94 | 26,159,222.26 | −3,032,320.91 | 0.5578 | 0.8253 | 22,704,079.43 | 24,680,301.13 |
| 79 | 2021 | 7 | 3 | 22,109,314.01 | 22,894,817.52 | −3,144,806.20 | 0.8253 | 0.9657 | 22,333,435.23 | 21,834,961.84 |
| 80 | 2021 | 8 | 3 | 19,750,017.97 | 19,750,012.84 | −3,144,805.46 | 0.9657 | 1.0000 | 19,750,016.46 | 19,576,827.12 |
| 81 | 2021 | 9 | 3 | 23,194,291.94 | 18,107,997.33 | −2,416,440.39 | 1.0000 | 1.2809 | 21,269,388.36 | 22,591,151.02 |
| 82 | 2021 | 10 | 2 | 29,183,603.23 | 18,768,723.64 | −925,013.89 | 0.7713 | 1.5549 | 24,398,897.91 | 22,756,222.99 |
| 83 | 2021 | 11 | 2 | 29,890,483.35 | 20,591,249.28 | 406,650.48 | 1.5549 | 1.4516 | 25,902,124.83 | 25,937,148.28 |
| 84 | 2021 | 12 | 2 | 32,548,420.87 | 23,632,257.67 | 1,683,458.53 | 1.4516 | 1.3773 | 28,920,151.78 | 28,911,023.99 |
| Mo | SI Unscaled | SI |
|---|---|---|
| 1 | 0.9296 | 0.9178 |
| 2 | 1.0643 | 1.0508 |
| 3 | 1.0950 | 1.0811 |
| 4 | 0.8765 | 0.8653 |
| 5 | 1.0466 | 1.0333 |
| 6 | 1.1011 | 1.0870 |
| 7 | 0.9903 | 0.9777 |
| 8 | 1.0040 | 0.9912 |
| 9 | 1.0758 | 1.0621 |
| 10 | 0.9447 | 0.9327 |
| 11 | 1.0143 | 1.0014 |
| 12 | 1.0126 | 0.9997 |
| Sum | 12.1547 | 12.0000 |
| Method | MAPE | SMAPE |
|---|---|---|
| Holt | 16.27% | 13.91% |
| Holt S | 12.37% | 11.99% |
| Holt E | 9.47% | 9.33% |
| Holt SE | 8.64% | 8.90% |
Publisher’s Note: MDPI stays neutral with regard to jurisdictional claims in published maps and institutional affiliations. |
© 2022 by the authors. Licensee MDPI, Basel, Switzerland. This article is an open access article distributed under the terms and conditions of the Creative Commons Attribution (CC BY) license (https://creativecommons.org/licenses/by/4.0/).
Share and Cite
Leenawong, C.; Chaikajonwat, T. Event Forecasting for Thailand’s Car Sales during the COVID-19 Pandemic. Data 2022, 7, 86. https://doi.org/10.3390/data7070086
Leenawong C, Chaikajonwat T. Event Forecasting for Thailand’s Car Sales during the COVID-19 Pandemic. Data. 2022; 7(7):86. https://doi.org/10.3390/data7070086
Chicago/Turabian StyleLeenawong, Chartchai, and Thanrada Chaikajonwat. 2022. "Event Forecasting for Thailand’s Car Sales during the COVID-19 Pandemic" Data 7, no. 7: 86. https://doi.org/10.3390/data7070086
APA StyleLeenawong, C., & Chaikajonwat, T. (2022). Event Forecasting for Thailand’s Car Sales during the COVID-19 Pandemic. Data, 7(7), 86. https://doi.org/10.3390/data7070086