Abstract
The electrocardiogram (ECG) signal produced by the human heart is an emerging biometric modality that can play an important role in the future generation’s identity recognition with the support of machine learning techniques. One of the major obstacles in the progress of this modality is the lack of public datasets with a long interval between sessions of data acquisition to verify the uniqueness and permanence of the biometric signature of the heart of a subject. To address this issue, we put forward Heartprint, a large biometric database of multisession ECG signals comprising 1539 records captured from the fingers of 199 healthy subjects. The capturing time for each record was 15 s, and recordings were made in resting and reading conditions. They were collected in multiple sessions over ten years, and the average interval between first session (S1) and third session (S3L) was 1572.2 days. The dataset also covers several demographic classes such as genders, ethnicities, and age groups. The combination of raw ECG signals and demographic information turns the Heartprint dataset, which is made publicly available online, into a valuable resource for the development and evaluation of biometric recognition algorithms.
Dataset License: CC BY 4.0
1. Summary
Biometric recognition is a well-established method of identifying an individual using her/his physiological or behavioral characteristics. The importance of biometric recognition is increasing rapidly in the contemporary era of e-commerce and e-services in many applications such as information security, access control, gender, and ethnicity recognition [1]. However, traditional biometric modalities such as fingerprint, face, iris, etc. have proved to be vulnerable, as they can be easily replicated and used fraudulently [2]. For instance, the face is vulnerable to artificial masks, a fingerprint can be recreated by latex, the voice can be mimicked easily, and an iris can be faked using contact lenses with copied iris features printed on it.
In recent years, there is a growing interest in electrocardiogram (ECG) signal produced by the heart as a biometric modality [3,4,5]. In fact, ECG signals have been studied and presented as a biometric modality for the last two decades, and it has been proven that this modality has the required properties for a reliable modality, such as universality, performance, uniqueness, robustness to attacks, liveness detection, collectability, and acceptability [5,6]. The main advantage of this emerging modality is that the heart is confined inside the body’s structure, making it secure against tempering, and it is also difficult to be simulated or copied. Besides, it has liveness properties, as ECG signals can be captured from living subjects only, making the heart a biometric modality suitable for continuous and remote authentication. Furthermore, good-quality ECG signals can be easily captured from fingers [7,8] making this modality more acceptable for commercial and public applications. Fusion of this modality with traditional modalities, especially the fingerprint, could play an important role in developing a reliable, secure, and acceptable biometric recognition system as well [9,10].
Although the biometric characteristics of heart signals seem promising, the permanence of the unique signature of this modality over a reasonably long period of time has not yet been tested. The lack of a publicly available multisession dataset restricts the progress in this field beyond the demonstration of the exceptional performance of machine learning-based methods on medical ECG records or private datasets [5,11]. Most of the medical databases used for the experimental analysis are generally acquired in a single session and, therefore, excellent recognition performance is not an indication of the permanence of the biometric signature. Existing purpose-built open datasets of ECG signals for biometric recognition consist of signals from only a small number of subjects, and the interval between capturing sessions is a maximum of six months, as shown in Table 1. To unleash the potentiality of the signal produced by the heart, or what we call Heartprint, the permanence of the unique signature of this modality should be tested over an extended period of time.
We aim to address the issues of permanence and uniqueness and to reduce this research gap by putting forward Heartprint [12], a multisession biometric dataset of ECG signals with long intervals of up to ten years between the sessions of data capturing with a reasonable size of subjects. The dataset comprises 1539 single-lead ECG records of 15 s each, captured from 199 subjects in four different sessions. The capturing of raw ECG signals, transfer of the raw data into a structured database, and its curation, along with the development of corresponding biometric recognition algorithms, was a long-term project supported by the National Science, Technology, and Innovation Plan (MAARIFA). These efforts resulted in a number of publications [13,14,15,16,17,18], but access to the dataset remained restricted until now. We decided to share the dataset with the broader research community with the belief that it could be helpful to develop sophisticated methods to make this modality practically useful for various applications of identity recognition and information security.
To highlight the uniqueness of the Heartprint dataset, we have compared the existing public ECG biometric datasets in Table 1 based on the number of ECG records, capturing the location of the body, the number of sessions, the maximum interval among sessions, and the duration of a record. For each person, we have collected a good number of ECG records, making the Heartprint a valuable resource for the training and evaluation of biometric recognition algorithms in a real-world setting, where machine learning (ML) based methods have to work reliably to extract the unique signature of the ECG signal affected by various physiological factors over a long period of time. Apart from the outstanding interval among sessions of data capturing, the dataset is distinguished by the distribution of demographic properties, such as age, gender, and ethnicity, rarely found in an ECG dataset constructed for biometric recognition. In particular, this combination of raw signals and demographic information makes Heartprint unique in different types of biometric recognition.
The rest of this paper is organized as follows. In Section 2, we present the signal acquisition tools and discuss the data collection process. In Section 3, we describe the database with detail information about metadata and row signals. We also presented the results of the technical validation of the database for two possible applications in Section 4. Then notes for the usages of the database are presented in Section 5. Finally, discussions about the database, validation results, and conclusion are given in Section 6.

Table 1.
Publicly available multisession ECG biometric datasets.
Table 1.
Publicly available multisession ECG biometric datasets.
| Name of Database | Location of Body | Availability | No. of Subjects | Number of Sessions | Average Interval | Total Records | Duration of a Record |
|---|---|---|---|---|---|---|---|
| UofTDB [19] | Fingers | Upon Request | <100 | 6 | 6 Months | - | 2–5 min |
| ECG-ID [20] | Hands | Public | 90 | 1–20 | 6 Months | 310 | 20 s |
| CYBHi [21] (Long-term) | Fingers | Public | 63 | 2 | 3 Months | 126 | 2 min |
| Heartprint (Our database) | Fingers | Public | 199 | 4 | 1572.2 days (S1–S3L) | 1539 | 15 s |
2. Data Collection Process
In order to test the uniqueness and permanence of the biometric features of ECG signals, it is important that data is captured in multiple sessions with sufficiently long intervals. We captured signals for each individual in different sessions for a period of ten years from 2012 to 2022. The Institutional Review Board approved the process of database construction by integrating the newly captured data with the existing data captured earlier and sharing it for research purposes. The database construction process is divided into three main phases: (i) registration, (ii) signal acquisition, and (iii) database organization. The whole process is illustrated in Figure 1.
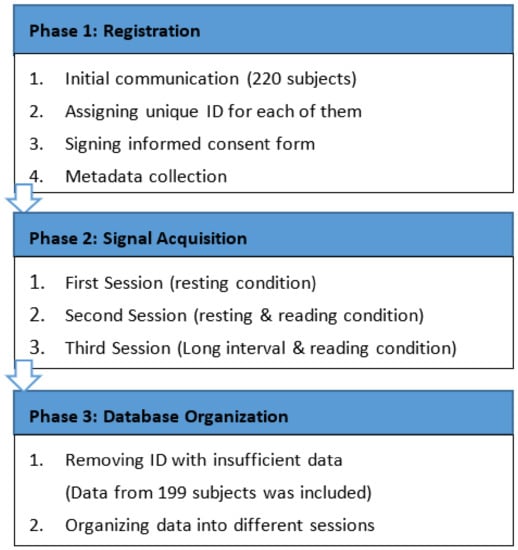
Figure 1.
Three stages of database construction process.
The raw signal data underlying the Heartprint dataset was recorded by a handheld ECG device known as ReadMyHeart by DailyCare BioMedical, Inc., Taoyuan, Taiwan, (https://dailycare.en.ec21.com/ReadMyHeart_-_Handheld_ECG_Recording--976239_976240.html, accessed on 18 October 2022), as shown in Figure 2. This is a single lead device that captures a heartbeat signal for fifteen seconds at a sampling frequency of 250 Hz from the thumbs of both hands using two dry conducting electrodes. We set up a probable device consisting of ReadMyHeart and a laptop. The device captures a signal, digitalizes it, and exports the ECG record to the computer as a text file (.txt).
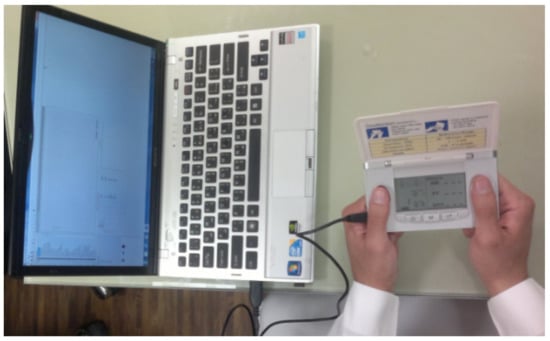
Figure 2.
Data acquisition with ReadMyHeart handheld ECG device.
2.1. Registration
Initially, we randomly selected 220 apparently healthy subjects from various walks of life, aged 18 years and older for ECG signal collection. The research team contacted each of them and explained the purpose of the research and the process of data collection. As the purpose of the dataset is biometric recognition, we did not ask any person about their cardiac or health condition. When a person agreed to participate by signing the consent form, they were registered into the system by assigning a unique ID. Simple demographic metadata related to biometric recognition, such as year of birth, gender, and ethnicity, were collected at this stage.
2.2. Signal Acquisition
One of the team members reached the subject in a pre-agreed location and time with the mobile data collection set-up. During the first session, at least two records of ECG signals (15 s each) were collected while the person was in resting condition sitting on a chair. At this stage, the next date, time, and location were agreed upon to collect data for the second session. In the second session, with an average interval of 47.5 days, at least two ECG records were collected again in resting condition (sitting on a chair) for all the subjects. To test the effect of common activities, such as talking during data acquisition, on biometric recognition, a good portion of the subjects were also asked to read from a book while data was being captured. For the collection of data with long intervals, the subjects were contacted again after one to ten years after the first session for the third session of data collection. In this session, data from available subjects were collected in resting and reading conditions.
2.3. Database Organization
When a subject participated at least in two sessions, her/his data was included in the database. Several IDs with insufficient data were excluded, and the resulting database included 199 subjects.
The collected data was organized into different sessions to build a multisession biometric database with a long interval in reading and resting conditions so that the performance and robustness of an authentication system can be evaluated. The collected signals were divided into four sessions: Session-1 (S1), Session-2 (S2), Session-3R (S3R), and Session-3L (S3L), as shown in Figure 3. S3R contains data with the reading condition, while S3L contains data with long intervals from the first session. A folder is created for each session. Each of these folders contains subfolders with the ID number (padded by 0 to make it three digits) of each subject and contains data for their particular session.

Figure 3.
Database organization showing folders for different sessions and subfolders under them.
3. Data Description
For each of the subjects, all collected ECG records were converted into text files and stored in the right sub-folder identified by the ID without any preprocessing. The metadata is provided together with the raw data in CSV format so that different types of processing and classification tasks can be performed.
3.1. Metadata
Gender, age, and ethnicity identification and their effects on the authentication process are two important research domains in ECG biometrics [22,23], and as a new modality, the suitability of ECG signals for these tasks has yet to be explored. Considering their importance, we have included this metadata in our database. The distribution of gender and ethnicity are shown in Figure 4a,b, respectively. Among the 199 subjects, there were 130 male and 69 female subjects. Data were collected from two main ethnic groups: Arab and South-Asian (briefly Asian). Only three subjects were outside of these two groups. The age distribution at the time of the first session is shown in Figure 5.
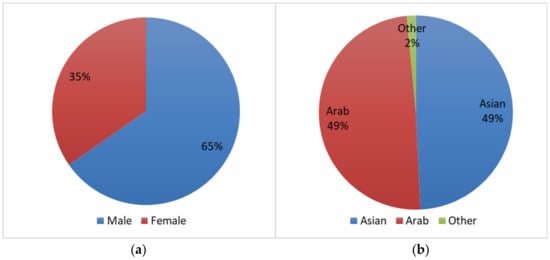
Figure 4.
Distribution of the subjects according to (a) gender and (b) ethnicity.
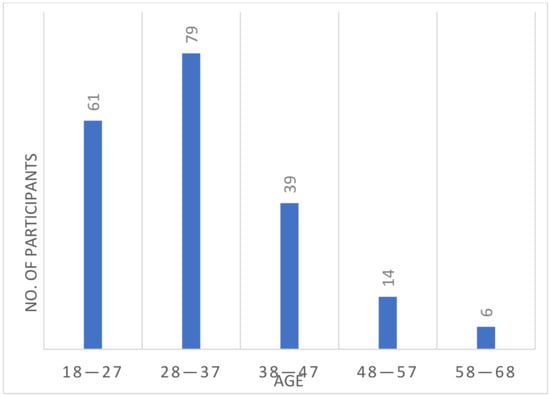
Figure 5.
Age distribution of all the subjects at the first session with 10 years as bin size.
3.2. Raw ECG Signal
Each of the ECG records contains samples (mV) of the ECG signal written in a new line of the text file. The sampling rate is 250 samples/s, and the signal was captured for 15 s, and there are exactly 3747 samples per record followed by some additional information inserted by the device. Table 2 shows the figures for the number of subjects participating in each session and the number of records. The database consists of 1539 ECG records altogether. Table 3 shows the average interval between the first session and the other sessions. Figure 6 and Figure 7 show sample ECG records of two different subjects. For each figure, the ECG records are taken from S1, S3R, and S3L, showing the ECG signal of the same person in three different sessions.

Table 2.
Statistics of Number of Records for each sessions including number of subjects, total number of records, maximum and minimum number of records per subjects.

Table 3.
Average, maximum and minimum intervals between the first session and other sessions.
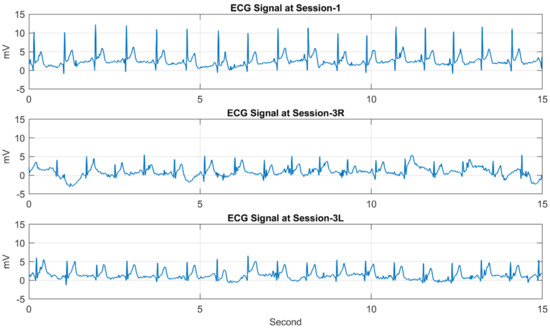
Figure 6.
Three ECG records of the first subject (ID 001) taken from Session−1, Session−3R, and Session−3L.
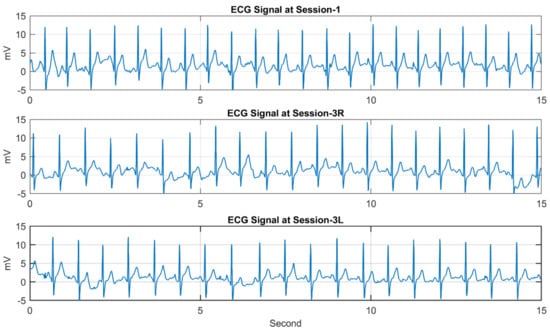
Figure 7.
Three ECG records of the second subject (ID 002) taken from Session−1, Session−3R, and Session−3L.
4. Technical Validation Method
The data was collected by all members of the research team and carefully upload to the database in the proper subfolders of the data organization. Technical validation of the collected data was carried out to check the integrity of the data collection process and the suitability of the data in biometric recognition. For this purpose, we carried out authentication experiments using a conventional feature-matching approach [15] and biometric identification using deep learning techniques.
In the preprocessing step, we used a band-pass Butterworth filter of order four with cut-off frequencies of 0.25 and 40 Hz to remove the noises. Then an efficient curvature-based method is used to detect the R-peaks of each record [24,25]. We segmented the whole record into windows of ECG signal around each R-peak with a fixed length (e.g., 0.5 s) as shown in Figure 8. Such a window is used as an instance (sample) for the authentication system [26,27].
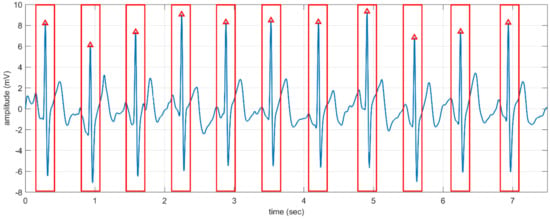
Figure 8.
A fragment of ECG signal and the segmented windows (shown by the rectangles) around the R-peaks (shown by the small triangles).
4.1. Biometric Authentication
Biometric authentication is the process of accepting or rejecting a person by matching a probe sample with a gallery sample. A feature-engineering-based method known as Wavelet Distance Measure (WDM) [28] has been used for biometric authentication. This method was based on the fact that the wavelet transform of a signal simultaneously provides both time and frequency information. The Daubechies scalar wavelet (Db3) was used with a five-level decomposition, which was empirically found to be optimal for ECG compression. Detail coefficients of the discrete wavelet transform are computed for each signal, and an absolute difference of the wavelet coefficients from the unknown signal and the enrolled data was used as the distance measure.
In this work, the average of all the segmented windows around the R-peaks of an ECG record was used as a biometric temple [15]. WDM computes the detail coefficients of the discrete wavelet transform providing temporal and morphological features of the average windows and representing them as a feature vector yielding the template. For all ECG records in the database, WDM templates were extracted.
For biometric authentication, we need two sets of samples: gallery and probe samples. Gallery samples are generally stored in a database, and a probe sample is used to compare with the gallery sample of the claimed identity. We carried out different types of experiments by using samples from different sessions as the gallery and probe sets, as shown in Table 4. In the same-session scenario, one of the samples from a particular session was used as the gallery sample the rest were used as probe samples. In cross-session experiments, gallery and probe samples were taken from two different sessions, and we reported the results of all possible combinations of matching.

Table 4.
Validation results such as error and accuracy for biometric authentication using same-session and cross-session protocols for the use of different gallery and probe sets.
A biometric authentication method can make two types of errors: false match and false non-match. A method’s false match rate (FMR) and false non-match rate (FNMR) depend on the operating threshold. The equal error rate (EER) of false matches and false non-matches is considered as the standard for measuring the performance of an authentication method [29]. We also calculated the accuracy at the threshold of computing the EER so that it could be a baseline for future comparison with performances of other machine learning-based techniques. It could be observed from Table 4 that we can achieve good authentication accuracy for same-session data (average 94.66%), the performance degrades for cross-session authentication, especially for data with long intervals and reading activity.
4.2. Biometric Identification
Biometric identification is the process of classification of a test sample in one of the categories defined by the number of individuals in the system. In this subsection, we present identification results for the proposed Heartprint dataset based on deep convolutional neural networks (CNN). Nowadays, there is a great focus on developing data-driven models for useful artificial intelligence applications. Recently, deep neural networks have seen tremendous success in the classification of ECG signals [30,31]. The main advantage of deep learning techniques is the ability to learn from raw data directly with automatic feature extraction algorithms. However, ECG signals are non-stationary, complex, and prone to noise and some signal processing may still provide great help in improving classification performance.
Continuous Wavelet Transform (CWT) is a signal processing technique that is very efficient in determining the damping ratio of 1D signals and is also very resistant to the noise in the signal. In an interesting work, Alrahhal et al. [30] used three types of wavelets to generate three different CWT time-frequency representations from ECG heartbeats. Then, they merged them into one 3D matrix that forms a kind of RGB image of size 224 × 224 × 3. Then, they fine-tuned a pre-trained VGGNet CNN model on these CWT images [30]. In a more recent work, Ammour et al. [32] used neural network convolutional layers to convert the ECG 1D signal into a 2D feature map, which was then fed into a pre-trained CNN model. The layers used for this conversion process were appended to the start of the CNN model, and then the new combined model was trained end-to-end using deep learning training techniques. Thus, in this approach, the filters used in the conversion process were learned from the data through training.
The scalogram is a 2D time-frequency representation that can be extracted from ECG signals using the CWT algorithm. It is the absolute value of the CWT of a signal, plotted as a function of time and frequency. It is similar to the spectrogram, which is obtained by windowing the input signal with a window of constant length that is shifted in time and frequency. The window used in the spectrogram has a fixed size, and because of that, the time-frequency resolution of the spectrogram is fixed. On the other hand, the scalogram uses a window with variable size, which means it can provide better time localization for short-duration and high-frequency events and better frequency localization for low-frequency, longer-duration events. By visually representing signals at various scales and various frequencies through CWT, hidden features can be seen in the frequency-time domain. It can be more useful than the spectrogram for analyzing real-world signals with features occurring at different scales. Furthermore, a scalogram is a 2D matrix, which means that the CWT algorithm effectively converts the 1-D ECG signal is converted to a 2-D signal. Therefore, we can make use of transfer learning techniques which exploit the power of image pre-trained CNN models.
The CWT (c) of the signal f(x) is computed at different scales and time positions using the following equation:
where ψ is the mother wavelet. More formally, CWT is computed as follows:
where s and t are real numbers representing the scale and time position parameters with s >0. The result of the CWT is a 2D matrix filled with wavelet coefficients located by scale and position.
Figure 9 shows three examples of mother wavelets: (1) the Mexican hat wavelet, (2) the Morlet wavelet, and (3) the Gaussian wavelet. The Python package “PyWavelets”, which is used in this work, provides more mother wavelets that are compatible with CWT. One initial observation we can make is that the wavelet’s shape is similar to an ECG heartbeat shape (especially the Gaussian wavelet), which is strong motivation for using CWT as an ECG analysis tool.
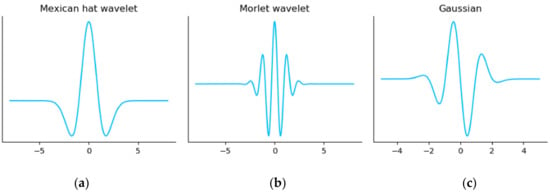
Figure 9.
The plots for the most common mother wavelets. (a) Mexican hat wavelet, (b) Morlet wavelet, and (c) Gaussian wavelet.
Figure 10b–d shows the scalogram of a sample ECG heartbeat in Figure 10a, while Figure 10e shows how to merge three CWT matrices as the RGB bands of one CWT image. Finally, the resultant CWT image is visualized in Figure 10f. It is important to note here that unlike RGB images, which have pixel values ranging between 0 to 255, the pixel values in the CWT images are real numbers with a much larger range. In other words, the CWT pixel values are transformed in order to produce the visualization in Figure 10f. Finally, we show in Figure 11 a sample image representation produced by our CWT algorithm pertaining to sample ECG heartbeats from the subjects/classes with ID 060, 174, 211, and 219. The similarity of the CWT images of a class (person) and differences between classes could be observed.
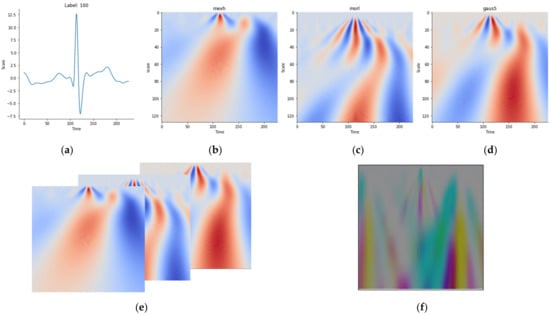
Figure 10.
The scalogram of a sample ECG heartbeat: (a) ECG heartbeat sample, (b) Mexican hat wavelet, (c) Morlet wavelet, (d) Gaussian wavelet (size 5), (e) merging scalograms in (b–d) as RGB bands of an image, and (f) merged image result.
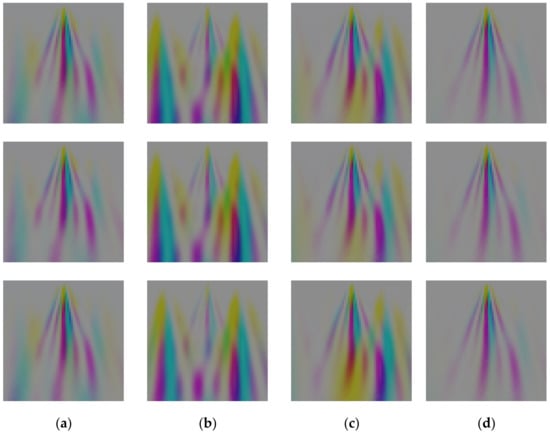
Figure 11.
Image representation produced by our CWT algorithm pertaining to sample ECG heartbeats from four different subjects/classes such as (a) ID 060, (b) ID 174, (c) ID 211, and (d) ID 219.
We built the deep CNN model, as shown in Figure 12, for the Person identification problem under consideration. We name it the HeartprintCNN. The HeartprintCNN takes in as input the CWT image extracted in the previous step. Then, it applies two consecutive convolutional blocks, composed of a convolutional (Conv) layer followed by a MaxPooling (Mpool) layer. In the first block, the Conv layer has 32 filters with a 5 × 5 kernel and the ReLU activation function. The Mpool layer uses a kernel size of 2 × 2. The first Conv block outputs a feature map of size 32 × 32 × 32. Thus, in the second block, the Conv layer increases the number of filters to 64, giving a feature map of size 16 × 16 × 64. Next, it flattens the feature map to a 1D vector and then compresses the size of the feature vector through two consecutive fully connected (FC) layers with 256 neurons, followed by BatchNormalization (BN) and ReLU activation functions.
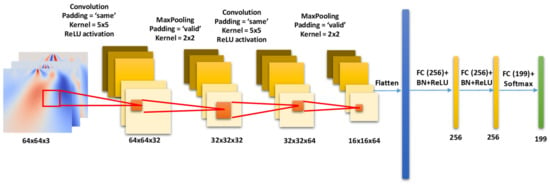
Figure 12.
Proposed CNN model consisting for input, Convolution, MaxPooling and Fully Connected (FC) Layers for ECG biometric identification.
HeartprintCNN is initialized with random network weights. We used the Adam optimizer to train the model with a learning rate set to 0.001 for the first 20 epochs; then, we reduced the learning rate to 0.0001 and trained with early stopping. The early stopping criteria is when the loss no longer improves with a patience period of five epochs. In other words, if the loss is not lower than the best so far for a consecutive five training epochs, then we stop the training. Finally, the batch size was set to eight samples per batch.
We trained and tested the HeartprintCNN with different training and test sets as shown in Table 5. For the mixed-session protocol, we mixed all the samples (segmented heartbeats) of S1 and S2 for each individual and then divided them into training and test data for the individual. Then we gathered training and test data from all individuals to make the training and test sets, respectively. In the cross-session protocol, training and test data for each individual came from different sessions without mixing data between training and test sessions.

Table 5.
Identification performances for mixed and cross-session experiments for the use of different gallery and probe sets.
The results for different train-test setups are shown in Table 5. First, we observe from the mixed session experiment that HeartprintCNN achieves an impressive 100% accuracy when the training and testing sets belong to the same dataset or domain in the deep learning lingo. HeartprintCNN is able to learn perfect features from the dataset, allowing it to classify the Heartprint signal of the correct subject. However, in all other experiments, when the training and testing sets belong to different sessions, the identification accuracy degrades significantly. Although the machine-learning-based method improved the biometric recognition performance using a specially prepared training set (mixed session), it still failed to achieve acceptable accuracy when the data used for the training and test set came from different sessions. This is a known limitation of deep learning models, especially for biometric datasets such as Heartprint. Domain adaptation approaches [33] could be explored in these cases to improve identification accuracy.
5. User Notes
In this section, we provide instructions on possible usages of Heartprint to train and validate biometric recognition processes. Generally, in traditional biometrics, two sets of samples are used as gallery and probe sets, as shown in Table 4. Cross-session validation is more appropriate to check the permanence of the biometric signature. However, with the increasing interest in machine learning for biometric recognition, data can be utilized in two different validation processes, such as mixed-session validation and cross-session validation, as shown in Table 6.

Table 6.
Possible usage of the Heartprint database for experimental evaluation using different training, validations and test sets.
5.1. Mixed-Session Validation
In the mixed-session validation, data (e.g., segmented heartbeats) from the first two sessions could be mixed and divided into training, validation, and test sets. An n-fold cross-validation process can be used to train a model. Then, the trained model can be further tested by the data in the other two sessions, such as S3R and S3L, for testing the effects of reading and long intervals between sessions, respectively.
5.2. Cross-Session Validation
In the cross-session approach, data from one of the first two sessions can be used for training and validation, while the other is used for testing. In this way, 2-fold cross-validation could be used to obtain a model by using data from one of the two sessions as training and validation, while the remaining session for testing by data with a short interval and in resting condition. Then, the trained model can be further tested by the data in the other two sessions, such as S3R and S3L, for testing the effects of reading and long intervals between sessions, respectively.
5.3. Code for Interfacing the database
The database [12] could be downloaded and utilized for various biometric recognition and analysis. The database divided into folders and subfolders (as shown in Figure 2) is uploaded as a WinRAR archive (Heartprint.rar), which must be downloaded and uncompressed before use. The metadata is also uploaded as ‘Heartprint Metadata.xlsx’. Figure 13 gives an example of code to obtain the data from the Heartprint database organization. This simple MATLAB function illustrates how to read data from a text file based on the session, the user’s ID, and the record number. The function also includes code to plot raw data to display the signal.
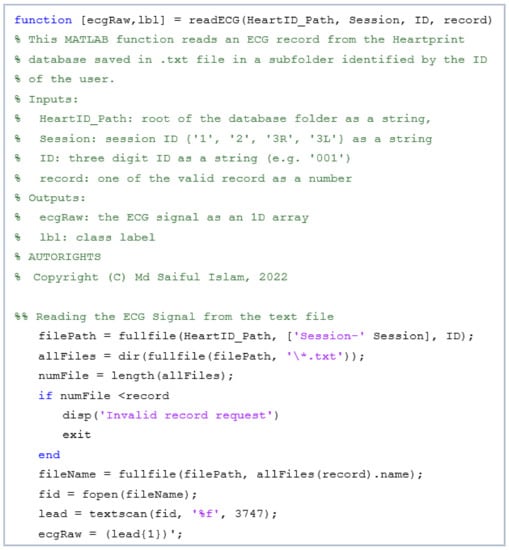
Figure 13.
Example MATLAB function for reading an ECG record from the Heartprint database.
6. Discussions and Conclusions
In this paper, we have presented Heartprint, which is a large biometric database of multisession ECG signals captured from the fingers of 199 healthy subjects. The signals were collected in multiple sessions over a period of ten years in reading and resting conditions. The collected data was organized into different sessions to build a multisession database with a long interval so that the performance and robustness of the biometric modality can be evaluated. The dataset also presents valuable demographic information about the participants, such as genders, ethnicities, and age groups, which could be utilized for different biometric applications.
We have presented the results of the technical validation process of the dataset for two different applications, namely biometric authentication and identification. In the authentication process, we implemented a feature-engineering-based method and tested it in an authentication setting. Here, we found that the authentication performance dropped when the train and test sets are from different sessions, and the performance decreased further when the interval between sessions increased. We also developed a deep learning model for biometric identification and tested it on the multisession database. Although we achieved a 100% recognition rate when we mixed data from different training and test sessions, the performance dropped significantly when training and test data came from different sessions, especially for sessions with longer times between them. Our results show that ECG signals recorded in different sessions under different subject conditions or after long periods of time suffer from the data shift problem.
Although ECG signals have been studied and presented as a biometrics modality for the last two decades, one of the major obstacles in the progress of this modality is the lack of public datasets with a long interval between sessions of data acquisition to verify the uniqueness and permanence of the biometric signature of the heart of an individual. We aim to address this issue and reduce the research gap by putting forward Heartprint. The combination of raw ECG signals and demographic information turns the Heartprint dataset, which is made publicly available online, into a valuable resource for the development and evaluation of biometric recognition algorithms. It could be noted that the quality of the captured ECG signals, such as the sampling frequency and bandwidth, was limited by the hardware device used. Capturing higher-quality signals in a fourth session with a new device could be a valuable contribution, and we want to leave it as a future work.
Author Contributions
Conceptualization, M.S.I. and N.A. (Naif Alajlan); methodology, M.S.I., H.A. and R.M.J.; validation, M.S.I., H.A., Y.B. and N.A. (Nassim Ammour); investigation, M.S.I. and N.A. (Naif Alajlan); resources, M.S.I., H.A. and N.A (Naif Alajlan); data curation, M.S.I., H.A., N.A. (Nassim Ammour) and R.M.J.; writing—original draft preparation, M.S.I. and H.A.; writing—review and editing, M.S.I., H.A., Y.B., N.A. (Nassim Ammour), N.A. (Naif Alajlan) and R.M.J.; supervision, N.A. (Naif Alajlan); project administration, M.S.I., Y.B., N.A. (Nassim Ammour) and N.A. (Naif Alajlan); funding acquisition, M.S.I., Y.B., N.A. (Nassim Ammour) and N.A. (Naif Alajlan). All authors have read and agreed to the published version of the manuscript.
Funding
This research was funded by National Science, Technology and Innovation Plan, MAARIFA, King Abdulaziz City for Science and Technology, Saudi Arabia, grant number 13-INF2168-02.
Institutional Review Board Statement
The study was conducted in accordance with the Declaration of Helsinki and approved by the Institutional Review Board of King Saud University (Project No.: E-22-6748, date of approval: 24 April 2022).
Informed Consent Statement
Informed consent was obtained from all subjects involved in the study.
Data Availability Statement
https://figshare.com/articles/dataset/Heartprint_A_Multisession_ECG_Dataset_for_Biometric_Recognition/20105354/3 (accessed on 18 October 2022).
Conflicts of Interest
The authors declare no conflict of interest.
References
- Theofanos, M.; Stanton, B.; Wolfson, C.A. Usability & Biometrics Ensuring Successful Biometric Systems; National Institute of Standards and Technology (NIST): Gaithersburg, MD, USA, 2008. [Google Scholar]
- ISO/IEC 30107-1:2016; Information Technology—Biometric Presentation Attack Detection—Part 1: Framework. ANSI: Washington, DC, USA, 2016. Available online: https://webstore.ansi.org/Standards/ISO/ISOIEC301072016 (accessed on 12 June 2022).
- Wu, S.; Hung, P.; Swindlehurst, A.L. ECG biometric recognition: Unlinkability, irreversibility and security. IEEE Internet Things J. 2020, 8, 487–500. [Google Scholar] [CrossRef]
- Islam, M.S.; Alajlan, N.; Bazi, Y.; Hichri, H.S. HBS: A novel biometric feature based on heartbeat morphology. IEEE Trans. Inf. Technol. Biomed. 2012, 16, 445–453. [Google Scholar] [CrossRef] [PubMed]
- Uwaechia, A.N.; Ramli, D.A. A comprehensive survey on ECG signals as new biometric modality for human authentication: Recent advances and future challenges. IEEE Access 2021, 9, 97760–97802. [Google Scholar] [CrossRef]
- Srivastva, R.; Singh, Y.N.; Singh, A. Statistical independence of ECG for biometric authentication. Pattern Recognit. 2022, 127, 108640. [Google Scholar] [CrossRef]
- Islam, M.S.; Alajlan, N. Biometric template extraction from a heartbeat signal captured from fingers. Multimed. Tools Appl. 2016, 76, 12709–12733. [Google Scholar] [CrossRef]
- Lourenço, A.; Silva, H.; Fred, A. Unveiling the biometric potential of finger-based ECG signals. Comput. Intell. Neurosci. 2011, 2011, 1–8. [Google Scholar] [CrossRef]
- Jomaa, R.M.; Islam, M.S.; Mathkour, H.; Al-Ahmadi, S. A multilayer system to boost the robustness of fingerprint authentication against presentation attacks by fusion with heart-signal. J. King Saud Univ.-Comput. Inf. Sci. 2022, 34, 5132–5143. [Google Scholar] [CrossRef]
- Jomaa, R.M.; Mathkour, H.; Bazi, Y.; Islam, M.S. End-to-end deep learning fusion of fingerprint and electrocardiogram signals for presentation attack detection. Sensor 2020, 20, 2085. [Google Scholar] [CrossRef]
- Rathore, A.S.; Li, Z.; Zhu, W.; Jin, Z.; Xu, W. A survey on heart biometrics. ACM Comput. Surv. 2021, 53, 1–38. [Google Scholar] [CrossRef]
- Islam, M.S.; AlHichri, H.; Bazi, Y.; Ammour, N.; Alajlan, N.; Jomaa, R.M. Heartprint: A Multisession ECG Dataset for Biometric Recognition. Available online: https://figshare.com/articles/dataset/Heartprint_A_Multisession_ECG_Dataset_for_Biometric_Recognition/20105354/3 (accessed on 18 October 2022).
- Islam, M.S.; Alajlan, N. An Efficient QRS Detection Method for ECG Signal Captured from Fingers. In Proceedings of the 2013 IEEE International Conference on Multimedia and Expo Workshops, ICMEW, San Jose, CA, USA, 15–19 July 2013. [Google Scholar]
- Islam, M.S.; Alajlan, N. Model-based alignment of heartbeat morphology for enhancing human recognition capability. Comput. J. 2015, 58, 2622–2635. [Google Scholar] [CrossRef]
- Islam, S.; Ammour, N.; Alajlan, N.; Abdullah-Al-Wadud, M. Selection of heart-biometric templates for fusion. IEEE Access 2017, 5, 1753–1761. [Google Scholar] [CrossRef]
- Islam, M.S. Using ECG signal as an entropy source for efficient generation of long random bit sequences. J. King Saud Univ.-Comput. Inf. Sci. 2022, 34, 5144–5155. [Google Scholar] [CrossRef]
- Alharbi, S.; Islam, M.S.; Alahmadi, S. Time-invariant cryptographic key generation from cardiac signals. Proc. Future Technol. Conf. 2019, 1070, 338–352. [Google Scholar] [CrossRef]
- Hamad, N.; Rahman, S.M.M.; Islam, M.S. Novel Remote Authentication Protocol Using Heart-Signals with Chaos Cryptography. In Proceedings of the 2017 International Conference on Informatics, Health and Technology, ICIHT, Riyadh, Saudi Arabia, 21–23 February 2017. [Google Scholar]
- Pouryayevali, S.; Wahabi, S.; Hari, S.; Hatzinakos, D. On Establishing Evaluation Standards for ECG Biometrics. In Proceedings of the 2014 IEEE International Conference on Acoustics, Speech and Signal Processing (ICASSP), Florence, Italy, 4–9 May 2014; pp. 3774–3778. [Google Scholar] [CrossRef]
- ECG-ID Database v1.0.0. Available online: https://physionet.org/content/ecgiddb/1.0.0/ (accessed on 30 May 2022).
- Da Silva, H.P.; Lourenço, A.; Fred, A.; Raposo, N.; Aires-de-Sousa, M. Check your biosignals here: A new dataset for off-the-person ECG biometrics. Comput. Methods Programs Biomed. 2014, 113, 503–514. [Google Scholar] [CrossRef]
- Goshvarpour, A. Gender and age classification using a new poincare section-based feature set of ECG. Signal Image Video Process. 2019, 13, 531–539. [Google Scholar] [CrossRef]
- Attia, Z.I.; Friedman, P.A.; Noseworthy, P.A.; Lopez-Jimenez, F.; Ladewig, D.J.; Satam, G.; Pellikka, P.A.; Munger, T.M.; Asirvatham, S.J.; Scott, C.G.; et al. Age and sex estimation using artificial intelligence from standard 12-lead ECGs. Circ. Arrhythmia Electrophysiol. 2019, 12, e007284. [Google Scholar] [CrossRef]
- Islam, M.S.; Alajlan, N. Augmented-Hilbert Transform for Detecting Peaks of a Finger-ECG Signal. In Proceedings of the Biomedical Engineering and Sciences (IECBES), Sarawak, Malaysia, 8–10 December 2014; pp. 864–867. [Google Scholar]
- Jomaa, R.M.; Islam, M.S.; Mathkour, H. Enhancing the information content of fingerprint biometrics with heartbeat signal. In Proceedings of the 2015 World Symposium on Computer Networks and Information Security (WSCNIS), Hammamet, Tunisia, 19–21 September 2015. [Google Scholar] [CrossRef]
- Alduwaile, D.; Islam, M.S. Single Heartbeat ECG Biometric Recognition Using Convolutional Neural Network. In Proceedings of the 3rd International Conference on Advanced Science and Engineering, ICOASE 2020, Virtual Conference, 23–24 December 2020; Institute of Electrical and Electronics Engineers Inc.: Piscataway, NJ, USA, 2020; pp. 145–150. [Google Scholar]
- AlDuwaile, D.A.; Islam, M.S. Using convolutional neural network and a single heartbeat for ECG biometric recognition. Entropy 2021, 23, 733. [Google Scholar] [CrossRef]
- Chan, A.D.C.; Hamdy, M.M.; Badre, A.; Badee, V. Wavelet distance measure for person identification using electrocardiograms. IEEE Trans. Instrum. Meas. 2008, 57, 248–253. [Google Scholar] [CrossRef]
- Unar, J.A.; Seng, W.C.; Abbasi, A. A review of biometric technology along with trends and prospects. Pattern Recognit. 2014, 47, 2673–2688. [Google Scholar] [CrossRef]
- Al Rahhal, M.M.; Bazi, Y.; Al Zuair, M.; Othman, E.; BenJdira, B. Convolutional neural networks for electrocardiogram classification. J. Med. Biol. Eng. 2018, 38, 1014–1025. [Google Scholar] [CrossRef]
- Ebrahimi, Z.; Loni, M.; Daneshtalab, M.; Gharehbaghi, A. A review on deep learning methods for ECG arrhythmia classification. Expert Syst. Appl. X 2020, 7, 100033. [Google Scholar] [CrossRef]
- Ammour, N.; Alhichri, H.; Bazi, Y.; Alajlan, N. LwF-ECG: Learning-without-forgetting approach for electrocardiogram heartbeat classification based on memory with task selector. Comput. Biol. Med. 2021, 137, 104807. [Google Scholar] [CrossRef]
- Bazi, Y.; Alajlan, N.; AlHichri, H.; Malek, S. Domain Adaptation Methods for ECG Classification. In Proceedings of the 2013 International Conference on Computer Medical Applications (ICCMA), Sousse, Tunisia, 20–22 January 2013. [Google Scholar] [CrossRef]
Publisher’s Note: MDPI stays neutral with regard to jurisdictional claims in published maps and institutional affiliations. |
© 2022 by the authors. Licensee MDPI, Basel, Switzerland. This article is an open access article distributed under the terms and conditions of the Creative Commons Attribution (CC BY) license (https://creativecommons.org/licenses/by/4.0/).