Data Descriptor

Multi-Temporal Surface Water Classification for Four Major Rivers from the Peruvian Amazon

by
Margaret Kalacska
1,*,
J. Pablo Arroyo-Mora
2,
Oliver T. Coomes
1,
Yoshito Takasaki
3 and
Christian Abizaid
4
1
Applied Remote Sensing Lab., Department of Geography, McGill University, Montreal, QC H3A 0B9, Canada
2
Flight Research Lab., National Research Council Canada, Ottawa, ON K1A 0R6, Canada
3
Graduate School of Economics, University of Tokyo, Tokyo 113-0033, Japan
4
Department of Geography & Planning, School of the Environment, University of Toronto, Toronto, ON M5S 3B3, Canada
*
Author to whom correspondence should be addressed.
Submission received: 15 November 2021 / Revised: 14 December 2021 / Accepted: 2 January 2022 / Published: 6 January 2022
(This article belongs to the Section Spatial Data Science and Digital Earth)

Abstract

:
We describe a new minimum extent, persistent surface water classification for reaches of four major rivers in the Peruvian Amazon (i.e., Amazon, Napo, Pastaza, Ucayali). These data were generated by the Peruvian Amazon Rural Livelihoods and Poverty (PARLAP) Project which aims to better understand the nexus between livelihoods (e.g., fishing, agriculture, forest use, trade), poverty, and conservation in the Peruvian Amazon over a 35,000 km river network. Previous surface water datasets do not adequately capture the temporal changes in the course of the rivers, nor discriminate between primary main channel and non-main channel (e.g., oxbow lakes) water. We generated the surface water classifications in Google Earth Engine from Landsat TM 5, 7 ETM+, and 8 OLI satellite imagery for time periods from circa 1989, 2000, and 2015 using a hierarchical logical binary classification predominantly based on a modified Normalized Difference Water Index (mNDWI) and shortwave infrared surface reflectance. We included surface reflectance in the blue band and brightness temperature to minimize misclassification. High accuracies were achieved for all time periods (>90%).
Dataset License: CC BY 4.0

1. Summary

Surface freshwater mapping at different temporal (e.g., single or multiple time periods) and spatial scales (e.g., local to global) provides key baseline information to better understand human activities that both benefit from (e.g., ecosystem services), and that impact (e.g., impoundment) these ecosystems. Given the wealth of long-term continuous spaceborne Earth observation systems (e.g., Landsat series, Copernicus, PlanetScope, etc.) in orbit, satellite imagery has been the preferred method to map surface freshwater over large geographical areas (e.g., [1,2,3]). For example, Ref. [1] generated a 30 m pixel size global water cover dataset for 2000 and 2010 from Landsat TM/ETM+ and HJ-1 satellite imagery through a combination of pixel-based (spectral) and object-based analysis. Other global data sets such as ESA’s Land Cover CCI [4] include water as one of the multi-temporal land cover classes, but the output is provided at a pixel size of 300 m. Recently, Ref. [3] produced a global surface water cover dataset using the Landsat top-of-the-atmosphere reflectance archives for the period of March 1984–Oct 2015 with Google Earth Engine. The classification was based on an expert system taking into account the multi-temporal and multispectral aspects of the imagery producing surfaces of water occurrence, maximum extent, seasonality, recurrence, and transitions. A recently updated version includes data up to the year 2020 [5]. However, as shown by [6,7] the high discrepancy between freely available freshwater datasets and in some cases inaccuracy, presents a challenge when determining which dataset to choose for specific applications. Additionally, large-extent fine spatial scale datasets such as the 2.5 million square kilometer riverscape classification at 2.5 m spatial resolution for Europe [8] do not yet exist for South American rivers.
The Peruvian Amazon Rural Livelihoods and Poverty (PARLAP) Project [9] is an effort aiming to better understand the nexus between livelihoods (e.g., fishing, agriculture, forest use, trade), poverty, and conservation in the Peruvian Amazon over a 35,000 km river network (Napo, Amazon, Pastaza and Ucayali basins) [10]. River basins were selected to reflect heterogeneity in environmental conditions, economic activities, history, and indigeneity of its peoples. In the absence of roads, settlements are concentrated along rivers, and river reaches in each basin were the focus of community and household surveys. The character of surface water around communities is a key environmental feature, specifically of primary and non-main river features (e.g., oxbow lakes), which can be indicative of the available habitat for fish and other aquatic species along the active channel and floodplain, respectively.
Here we developed a minimum extent persistent surface water classification along reaches of the four major rivers (i.e., Amazon, Napo, Pastaza, and Ucayali) investigated by the PARLAP project, using Landsat satellite imagery with a 30 m pixel size, representing circa 1989, 2000, and 2015. Different from other surface water classification methodologies, we implemented a hierarchical ruleset predominantly based on a modified Normalized Difference Water Index (mNDWI) and shortwave infrared surface reflectance. Surface reflectance in the blue band and brightness temperature (BT) were included to minimize misclassification. Importantly, we differentiate between primary (i.e., main) and non-main channel water, this distinction is not available from any of the freely available datasets. Therefore, our surface water layers are distinct from other classifications and are part of PARLAP’s effort to better establish the link between livelihoods and this vast riverscape.

2. Data Description

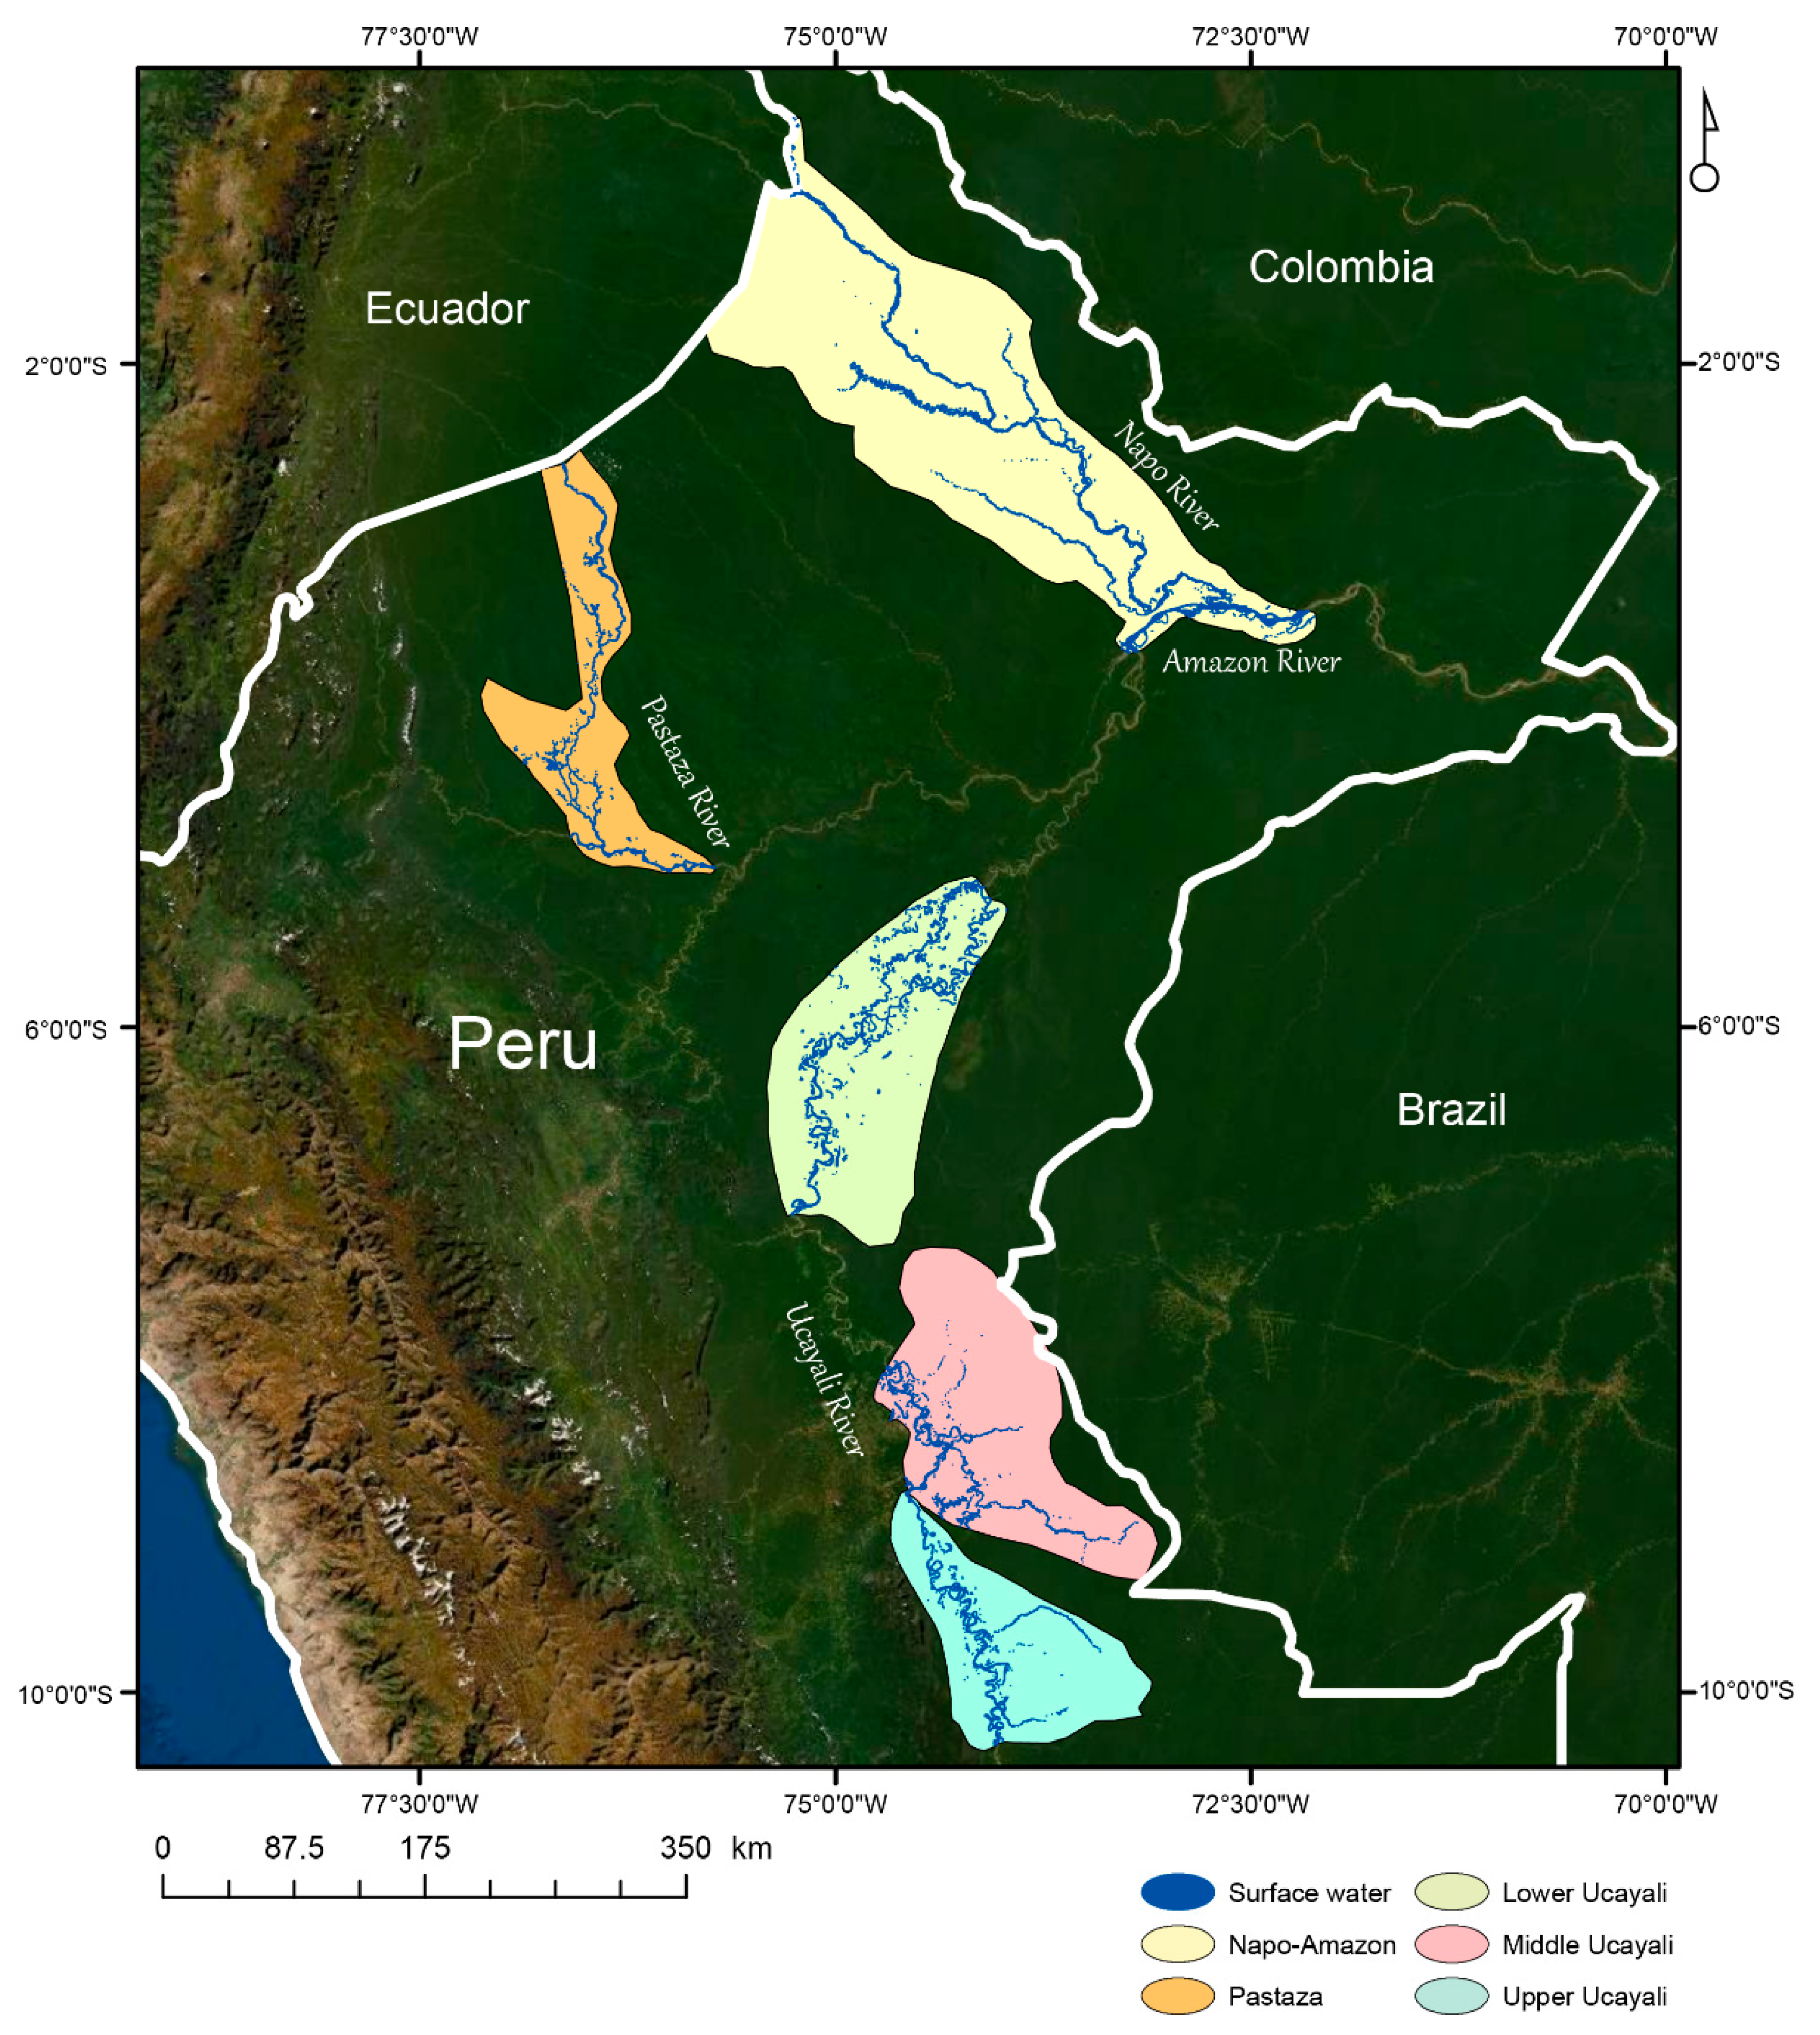
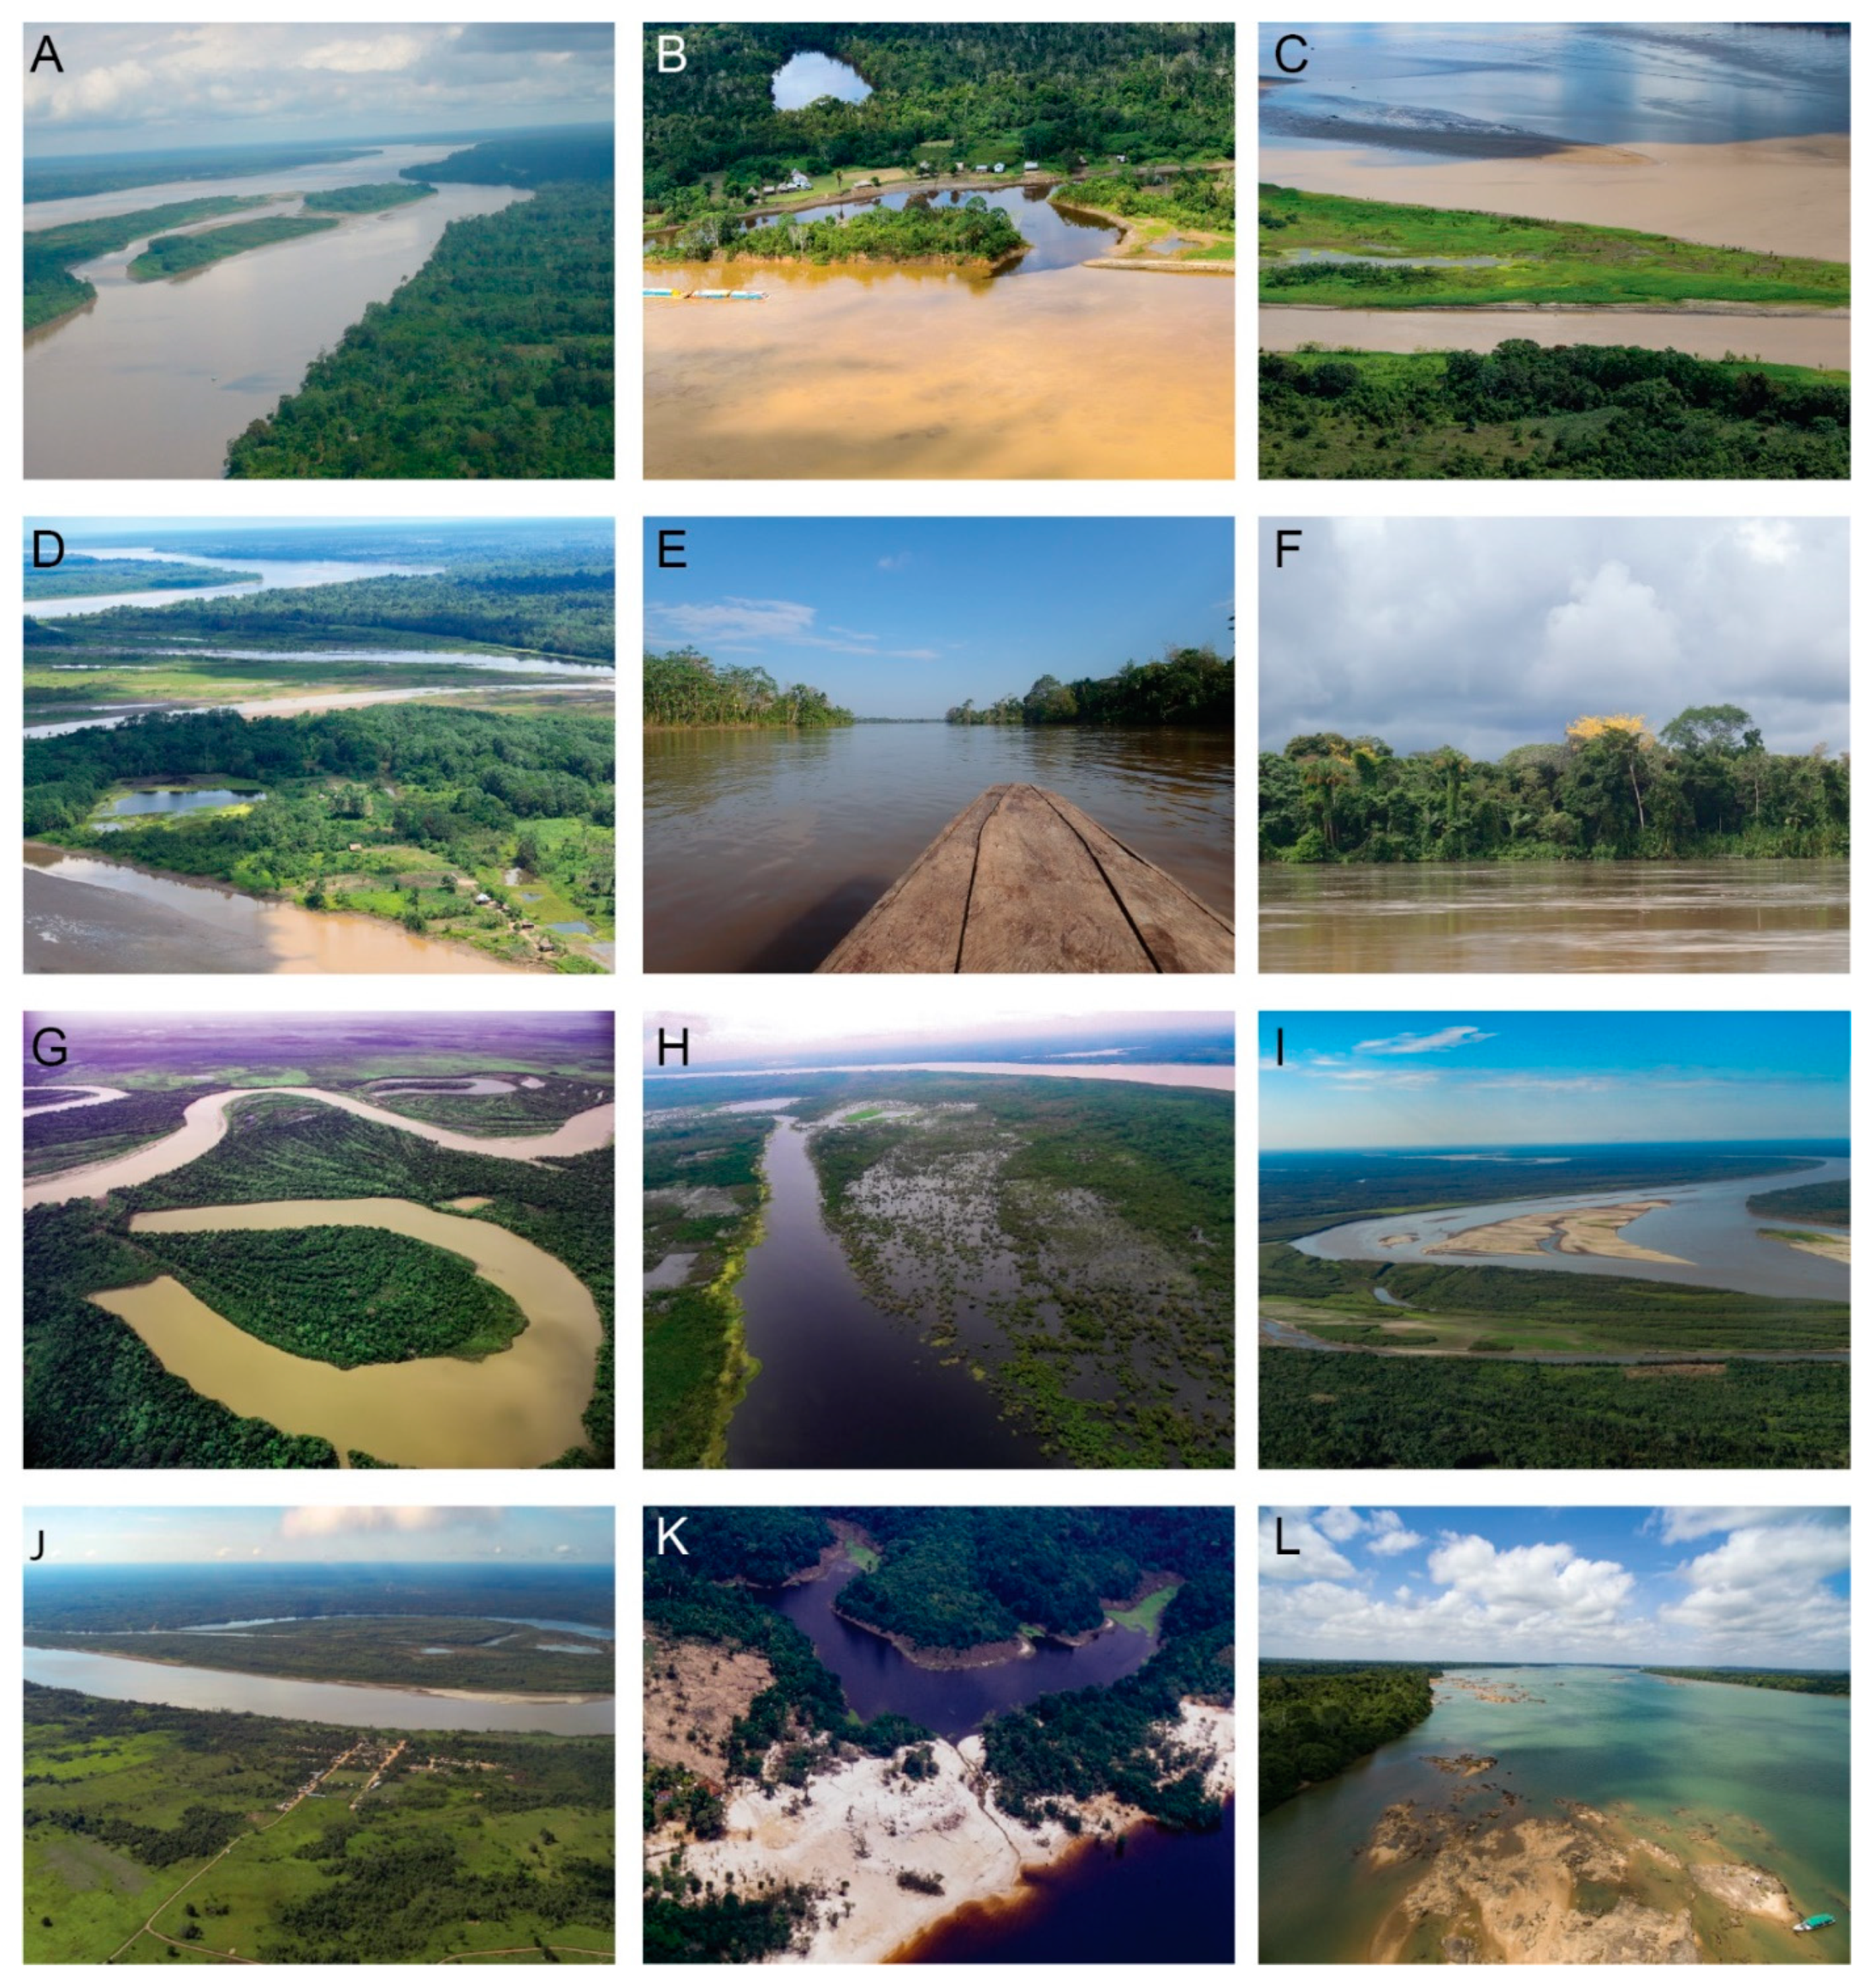
The multi-temporal surface water classifications are available for download from the PARLAP Dataverse [11] in ESRI shapefile format (Figure 1). The datasets are projected in UTM 18S WGS84. The attribute tables of the layers indicate whether the polygons belong to the main channel or non-main channel surface water classes. The non-main channel designation includes all water bodies not directly connected to the main river channel (e.g., oxbow lakes) (Figure 2).

3. Methods

The surface water classifications were created for three time periods representing circa 1989, 2000, and 2015 from Landsat (TM 5, 7 ETM+, and 8 OLI respectively) satellite imagery at a 30 m pixel size for reaches of four rivers of interest in the Peruvian Amazon (i.e., Napo, Amazon, Pastaza, Ucayali). The circa 1989 data correspond to the earliest time for which imagery was available for the entire study area. The circa 2015 data correspond to when PARLAP carried out large-scale community and household surveys in the study area (2014–2016), and circa 2000 an intermediate period in-between. Due to the overall length of time (30 years), imagery from multiple satellites was necessary. Landsat TM 5 was in operation from March 1984–June 2013 [12], Landsat 7 ETM+ has been in operation since April 1999 but suffered a Scan Line Corrector failure in June 2003 [13], and Landsat 8 has been in operation since February 2013 [14]. For practical purposes and for relating to other PARLAP field data, these surface water layers are organized into the five regions as shown in Figure 1. The combined area across the river basins examined here is 113,691 km2.
The classifications were carried out in Google Earth Engine using the USGS Landsat Surface Reflectance Tier 1 imagery collection [15]. As commonly seen in the tropics [16], the study area is prone to extensive cloud clover. The pixel QA bands were used to mask out clouds in order to generate a median surface reflectance product for each period. The QA bands are available as one of the metadata bands produced during standard Landsat processing and represent the pixel quality attributes generated from the CFMASK algorithm [17]. The median reflectance composites represent the 1985–1989, 1999–2000, and 2014–2015 periods. The differences in the length of time are the minimum number of years needed to generate a cloud-free composite for the entire study area. Table 1, Table 2 and Table 3 describe the optical and thermal bands from the three Landsat satellites. Figure 3 illustrates the relative spectral responses of the optical bands. Importantly, as surface reflectance products, the images had undergone an atmospheric compensation to remove the effects of the atmosphere (e.g., scattering, absorption).
Classification was based on a hierarchical, binary logical ruleset that took into consideration surface reflectance, and brightness temperature (BT). Our final products represent the minimum extent of persistent surface water. Each component of the ruleset is described below.

3.1. Surface Reflectance

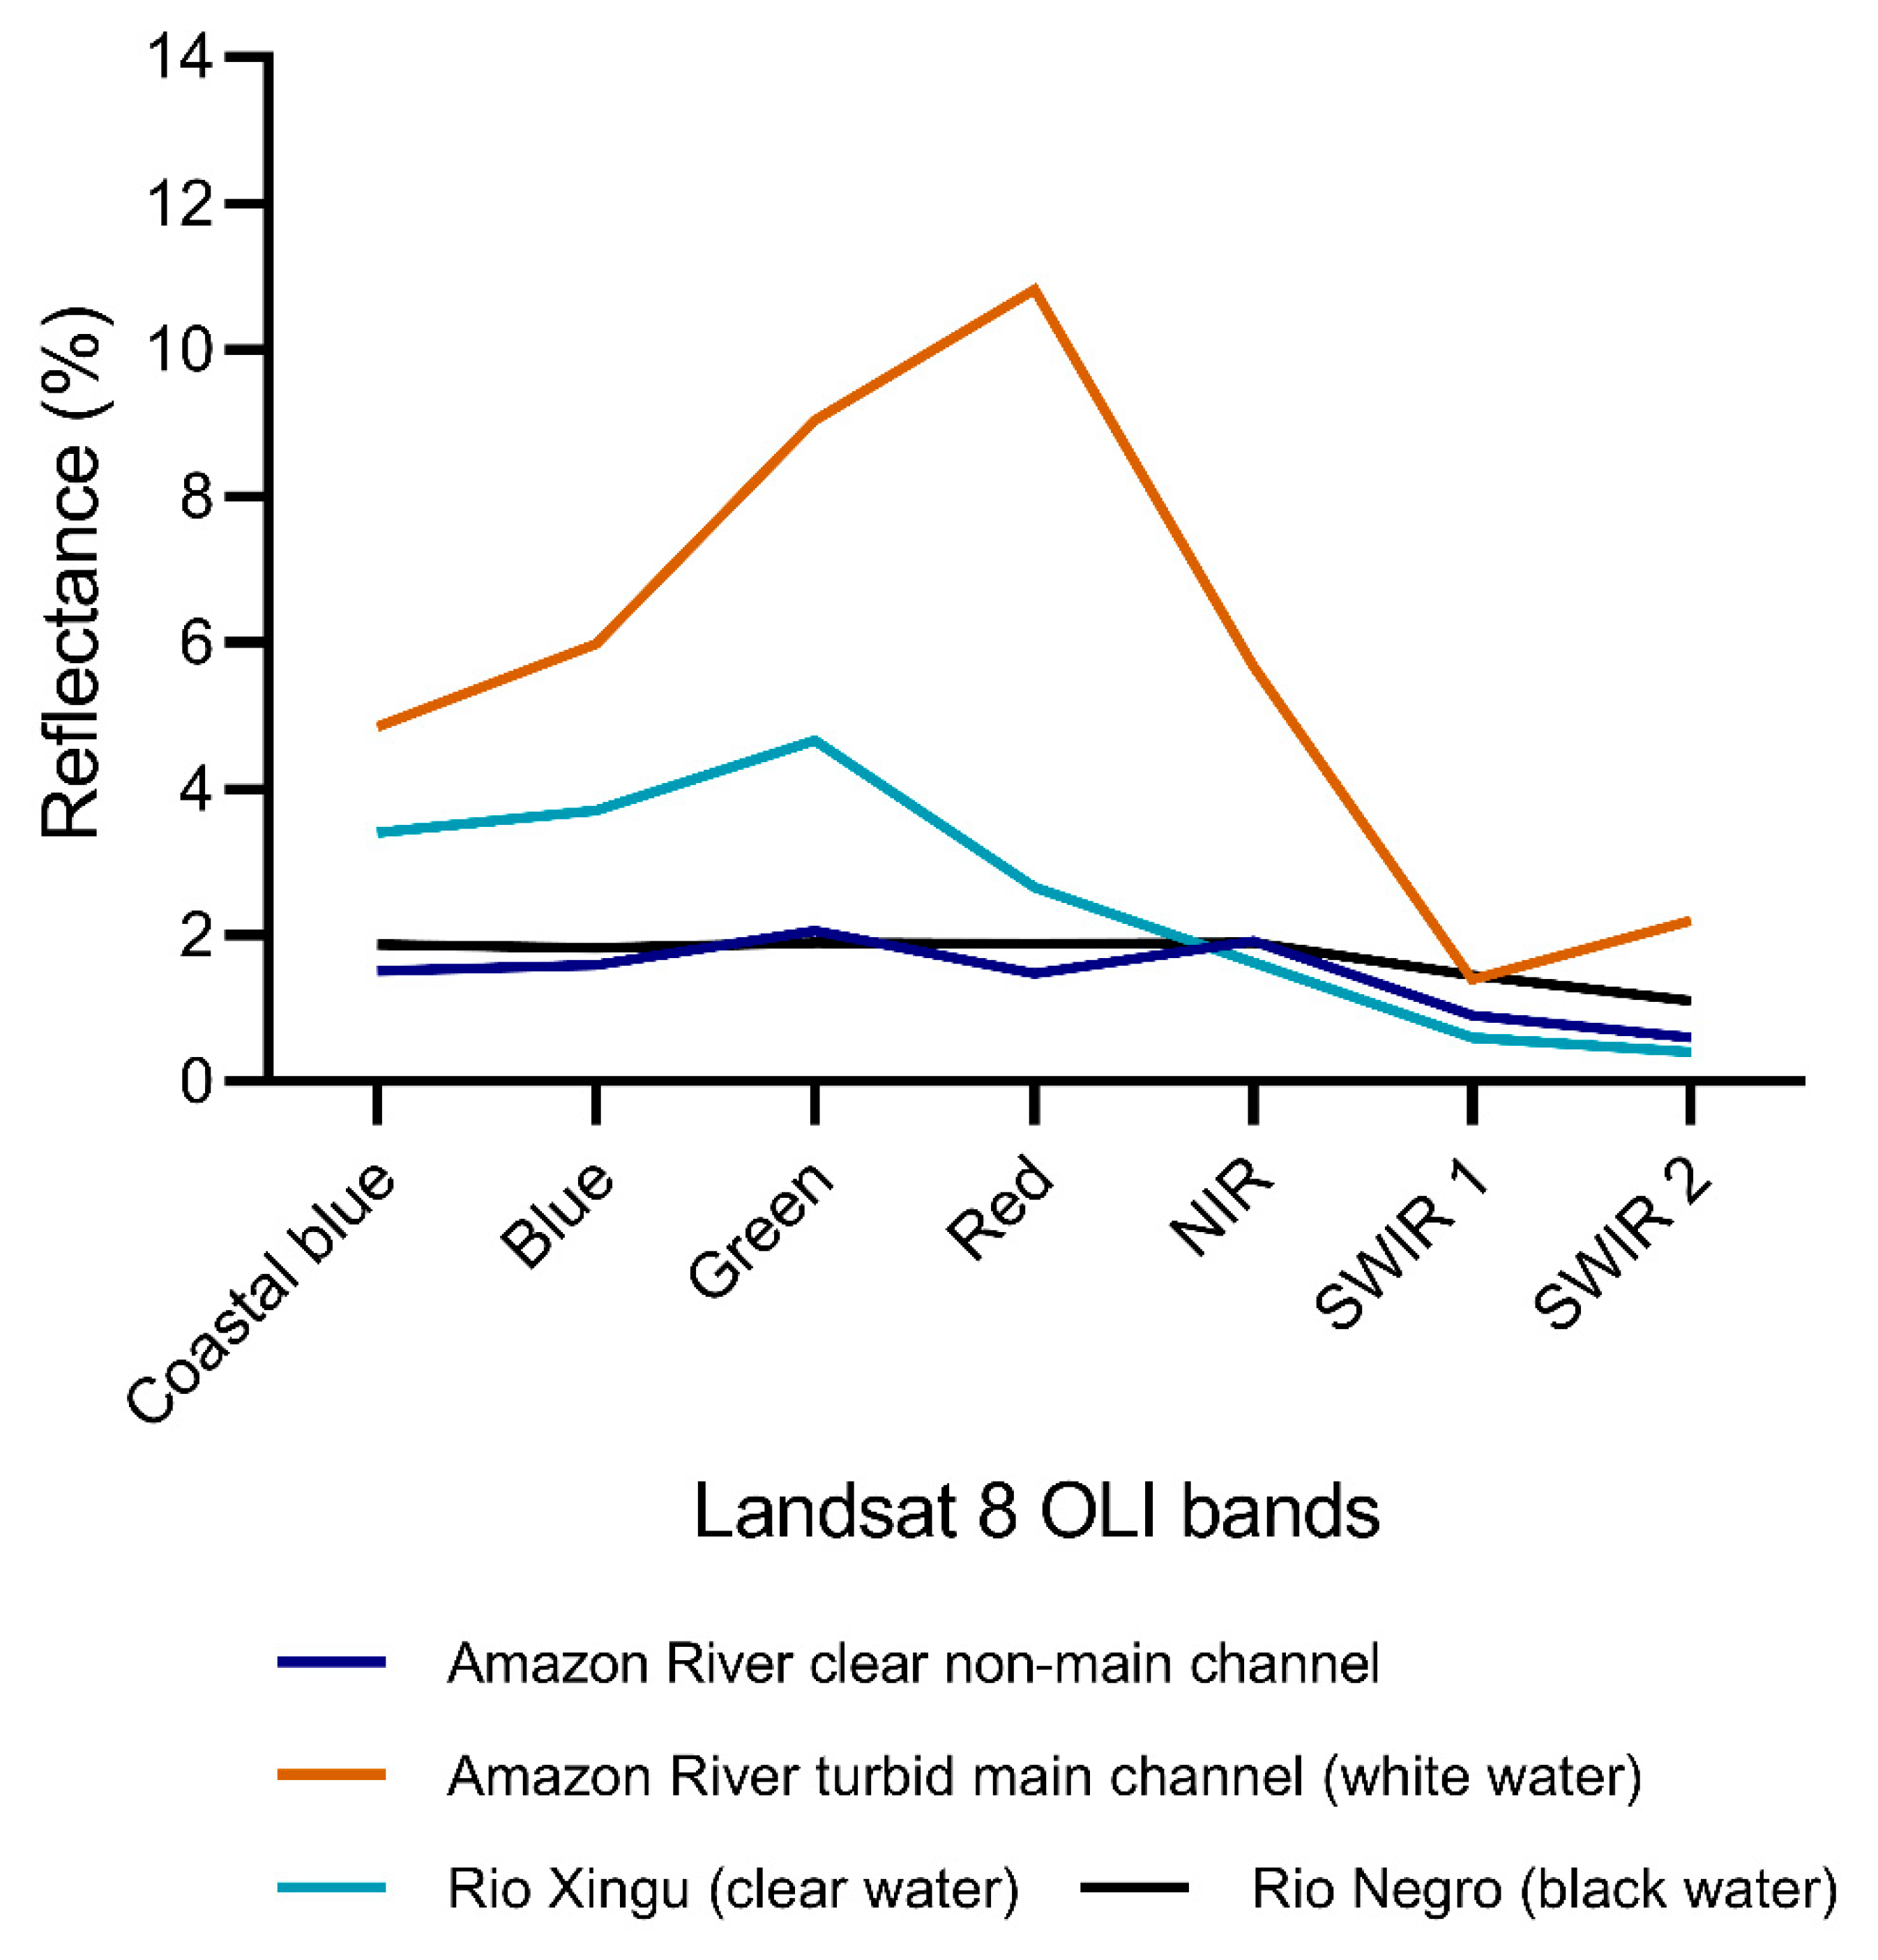
Unlike many other large bodies of freshwater such as the African and North American Great Lakes, or clearwater and blackwater tributaries of the Amazon such as the Rio Xingu, and Rio Negro, respectively, the main channels of the rivers mapped in this dataset are considered whitewater rivers. An important characteristic of whitewater rivers is the high sediment load (see Figure 2) which impacts the surface reflectance (Figure 4 and Figure 5). Water is known to be a low signal target, absorbing most of the solar irradiance across wavelengths. High sediment loads increase reflectance in the visible and near-infrared (NIR) bands which can lead to confusion with some terrestrial land covers. Across the surface water in the study area, a range of turbidities can be seen, from relatively clear, small lakes to the high sediment-laden main channels.
For open water delineation, the original formulation of NDWI [20] was developed as Equation (1):
NDWI = ρ Green ρ NIR ρ Green + ρ NIR
where ρ denotes surface reflectance.
Other previous formulations of NDWI (e.g., [21]) using a NIR and SWIR band instead were developed for assessing water content in plant canopies or as defined by [22] replace the NIR band with a SWIR band in Equation (1) for open water mapping.
In order to account for the range of turbidities encountered in the study area (Figure 4), a modified Normalized Difference Water Index (mNDWI) based on [20] was calculated from the green, red, and NIR bands according to Equation (2):
mNDWI = ρ NIR ρ Red ρ Green × 100
where ρ is the surface reflectance in the NIR, red, or green bands of the respective sensors (Figure 3). The value of 100 is a scaling factor. The mNDWI from Equation (2) is the first level in the hierarchical ruleset (see Section 3.3).
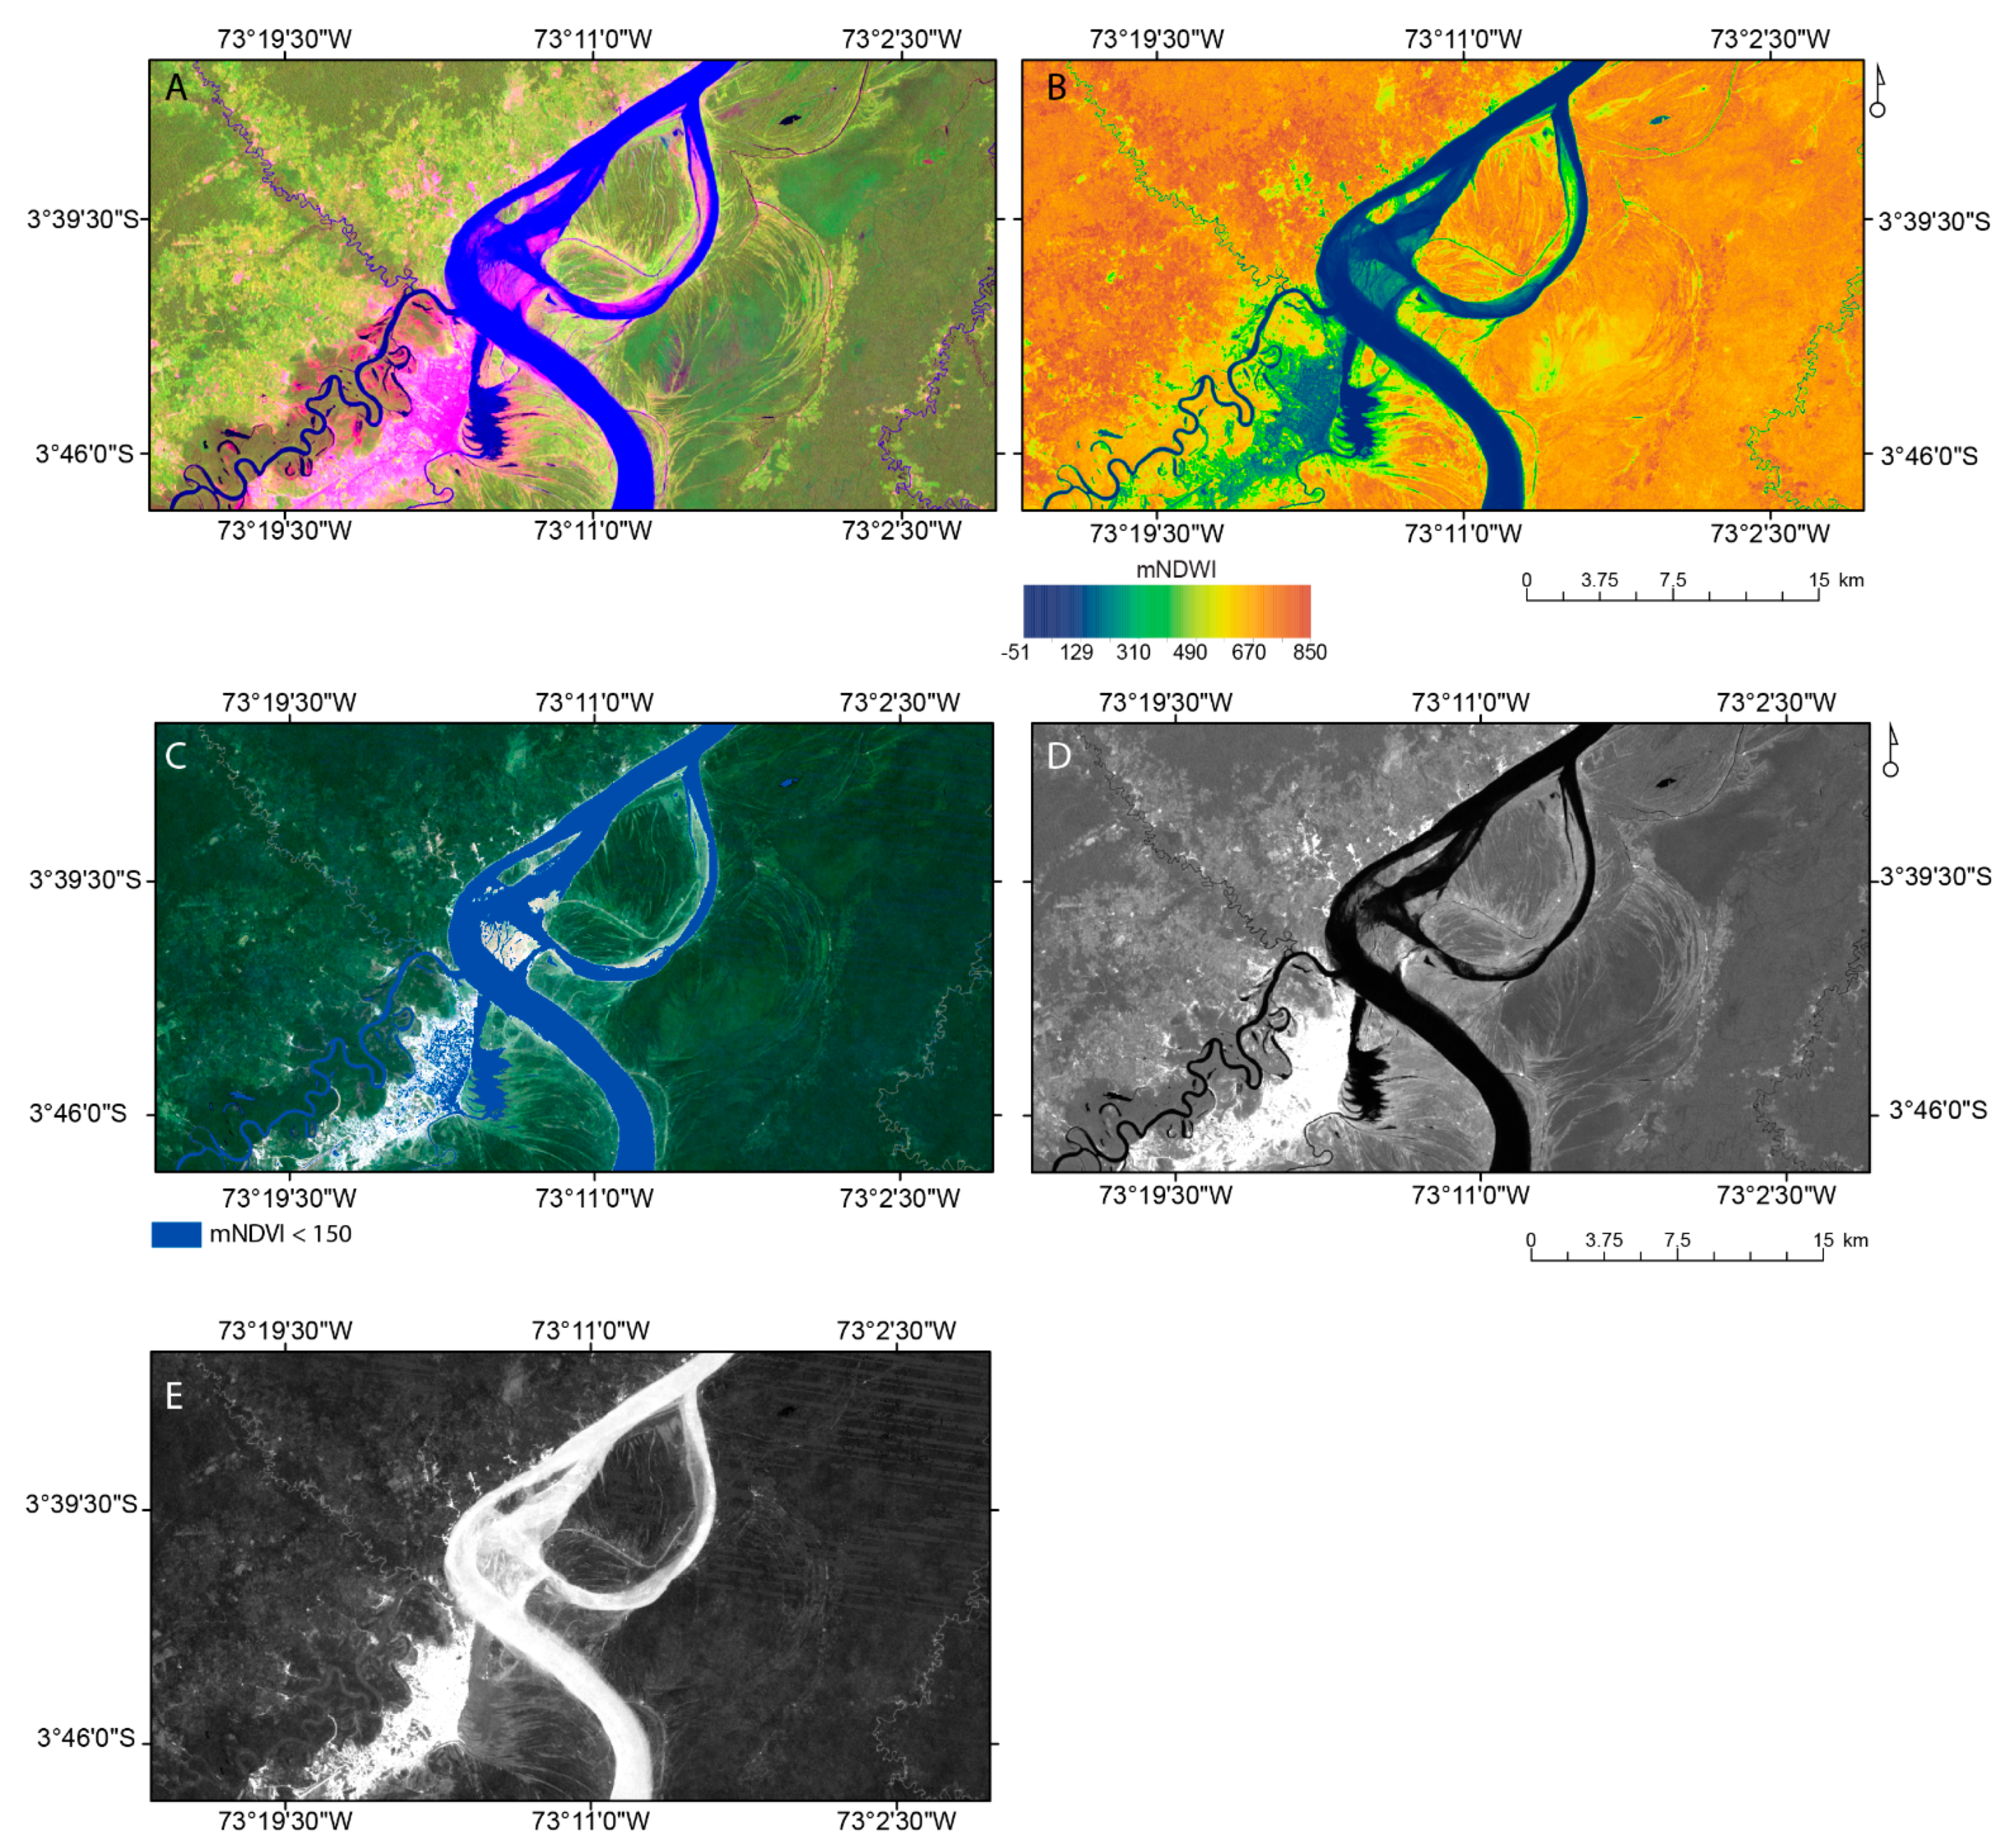
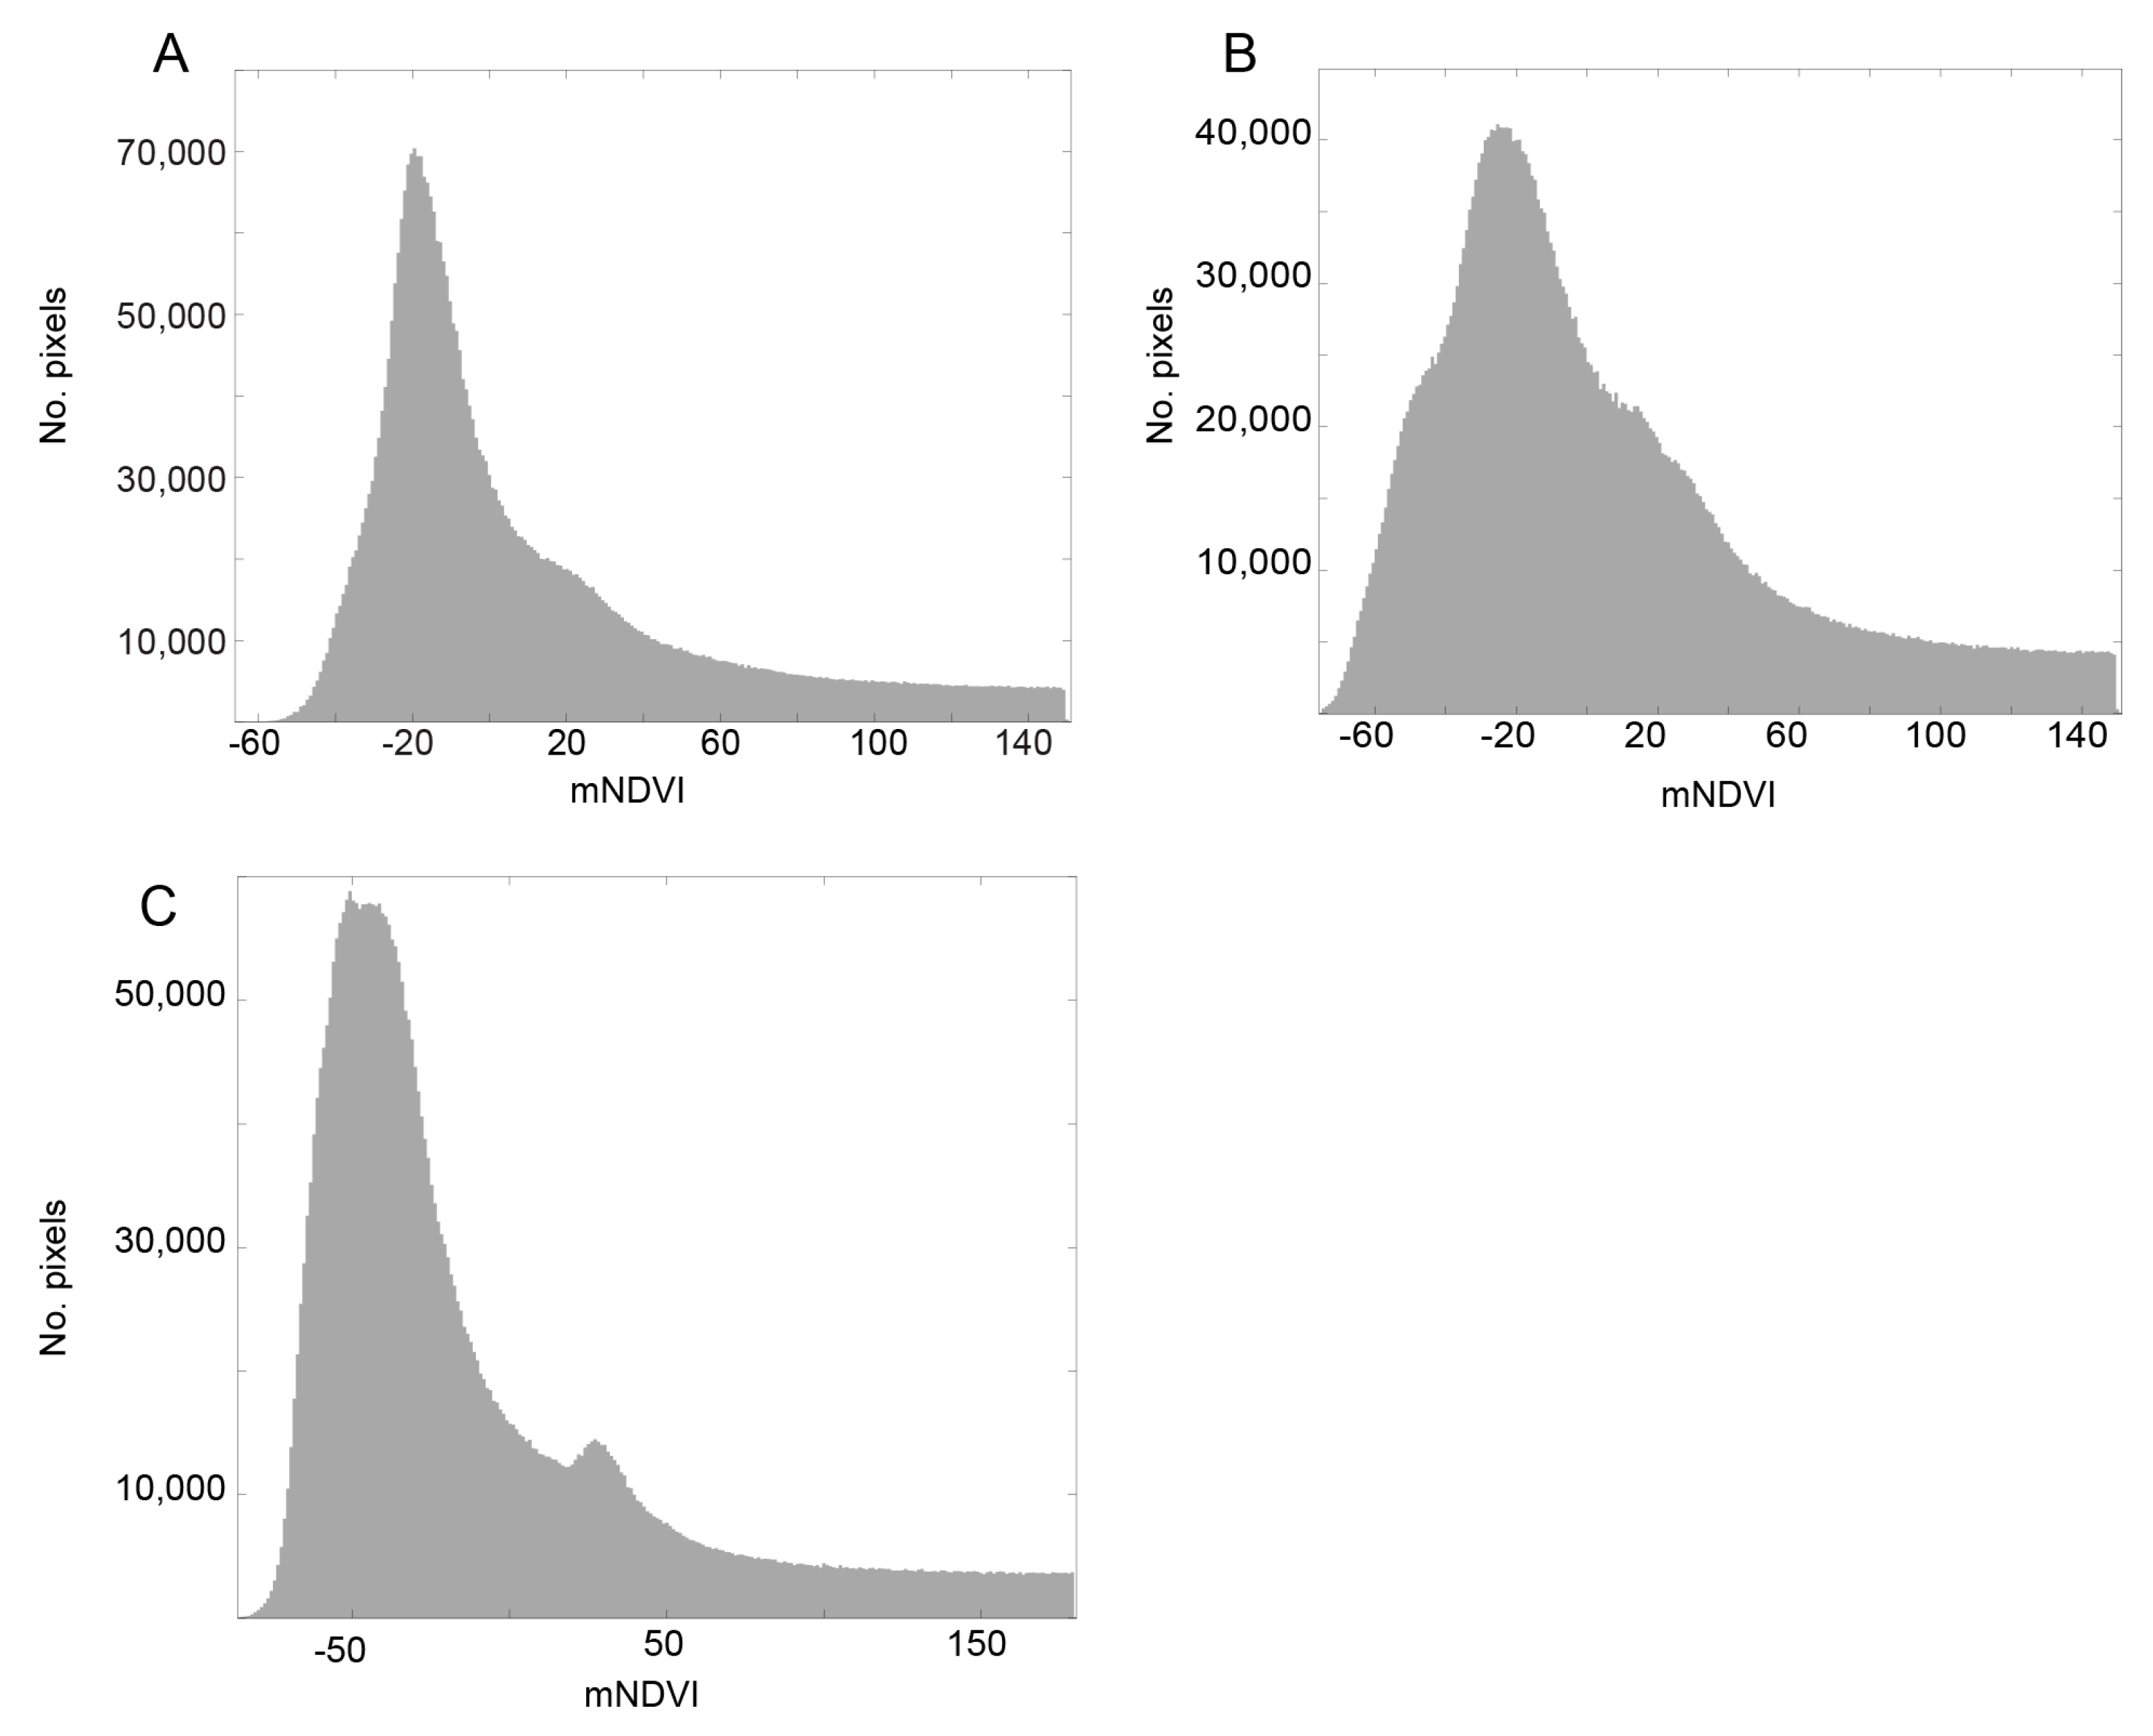
In our ruleset, the threshold of mNDWI from Equation (2) varied by time period. For example, for the earliest period from TM 5 (circa 1989) the mNDWI threshold was set to <150 (Figure 5 and Figure 6, Table 4).
To refine the separation of open water from other land cover classes, the next level in the hierarchical ruleset was a threshold of SWIR2 reflectance (Table 1). As seen in Figure 5, in order to include the less turbid non-main channel features, the relatively higher threshold of mNDVI also results in the inclusion of pixels representing larger settlements such as Iquitos, but the reflectance of the urban areas and water are considerably different in the SWIR2 band (Figure 5). The third level of the hierarchical ruleset is the reflectance in the blue band. Water is higher reflectance than the surrounding vegetation in the blue band (Figure 5), therefore this threshold refined the edges of the detected surface water and eliminated misclassifications due to topographic shadows.

3.2. Brightness Temperature

The fourth level of the ruleset (predominantly for refinement) was brightness temperature (BT) from the thermal band of the images used in the surface reflectance mosaics. For Landsat TM 5 and 7 ETM+ this is band 6 (10.4–12.5 µm). Landsat 8 TIRS has two longwave infrared bands (bands 10 and 11); here we used band 10 (10.6–11.19 µm). While these longwave infrared (LWIR) bands were acquired at 120 m (TM 5), 60 m (7 ETM+), or 100 m (TIRS) pixel sizes, in the surface reflectance collections accessed through Google Earth Engine, they have been resampled to 30 m through cubic convolution [15]. Brightness temperature considers an emissivity (ε) of 1 and represents the temperature a blackbody (i.e., theoretical perfect emitter and absorber of radiation) would be if observed at the same wavelength. Emissivity is a measure of the efficiency of a material to emit radiation in comparison to a blackbody and is a fundamental property of materials in the LWIR (i.e., thermal) region according to Kirchoff’s Law Equation (3):
E = ε σ T 4
where E is the total amount of energy emitted (i.e., flux density) by a material (per unit time, per unit area) at a specific temperature (T) and σ is the Stefan-Boltzmann constant (5.67 × 10⁻⁸ W m−2 K−4). Emissivity is unitless ranging from 0–1, with values closer to 1 representing material more similar to a blackbody at the wavelength of observation. Materials differ in their ε values across wavelengths; liquid water generally has an ε > 0.97 with minimal effect of turbidity in the LWIR [23,24,25,26]. While LWIR energy emission is generally considered to be a surface property, in water bodies up to the top 100 µm may comprise the volume contributing to the emission [25]. For the surface water classifications, the BT threshold was set to less than 298 K for all datasets. The majority of the urban pixels had a BT > 300 K.

3.3. Final Ruleset

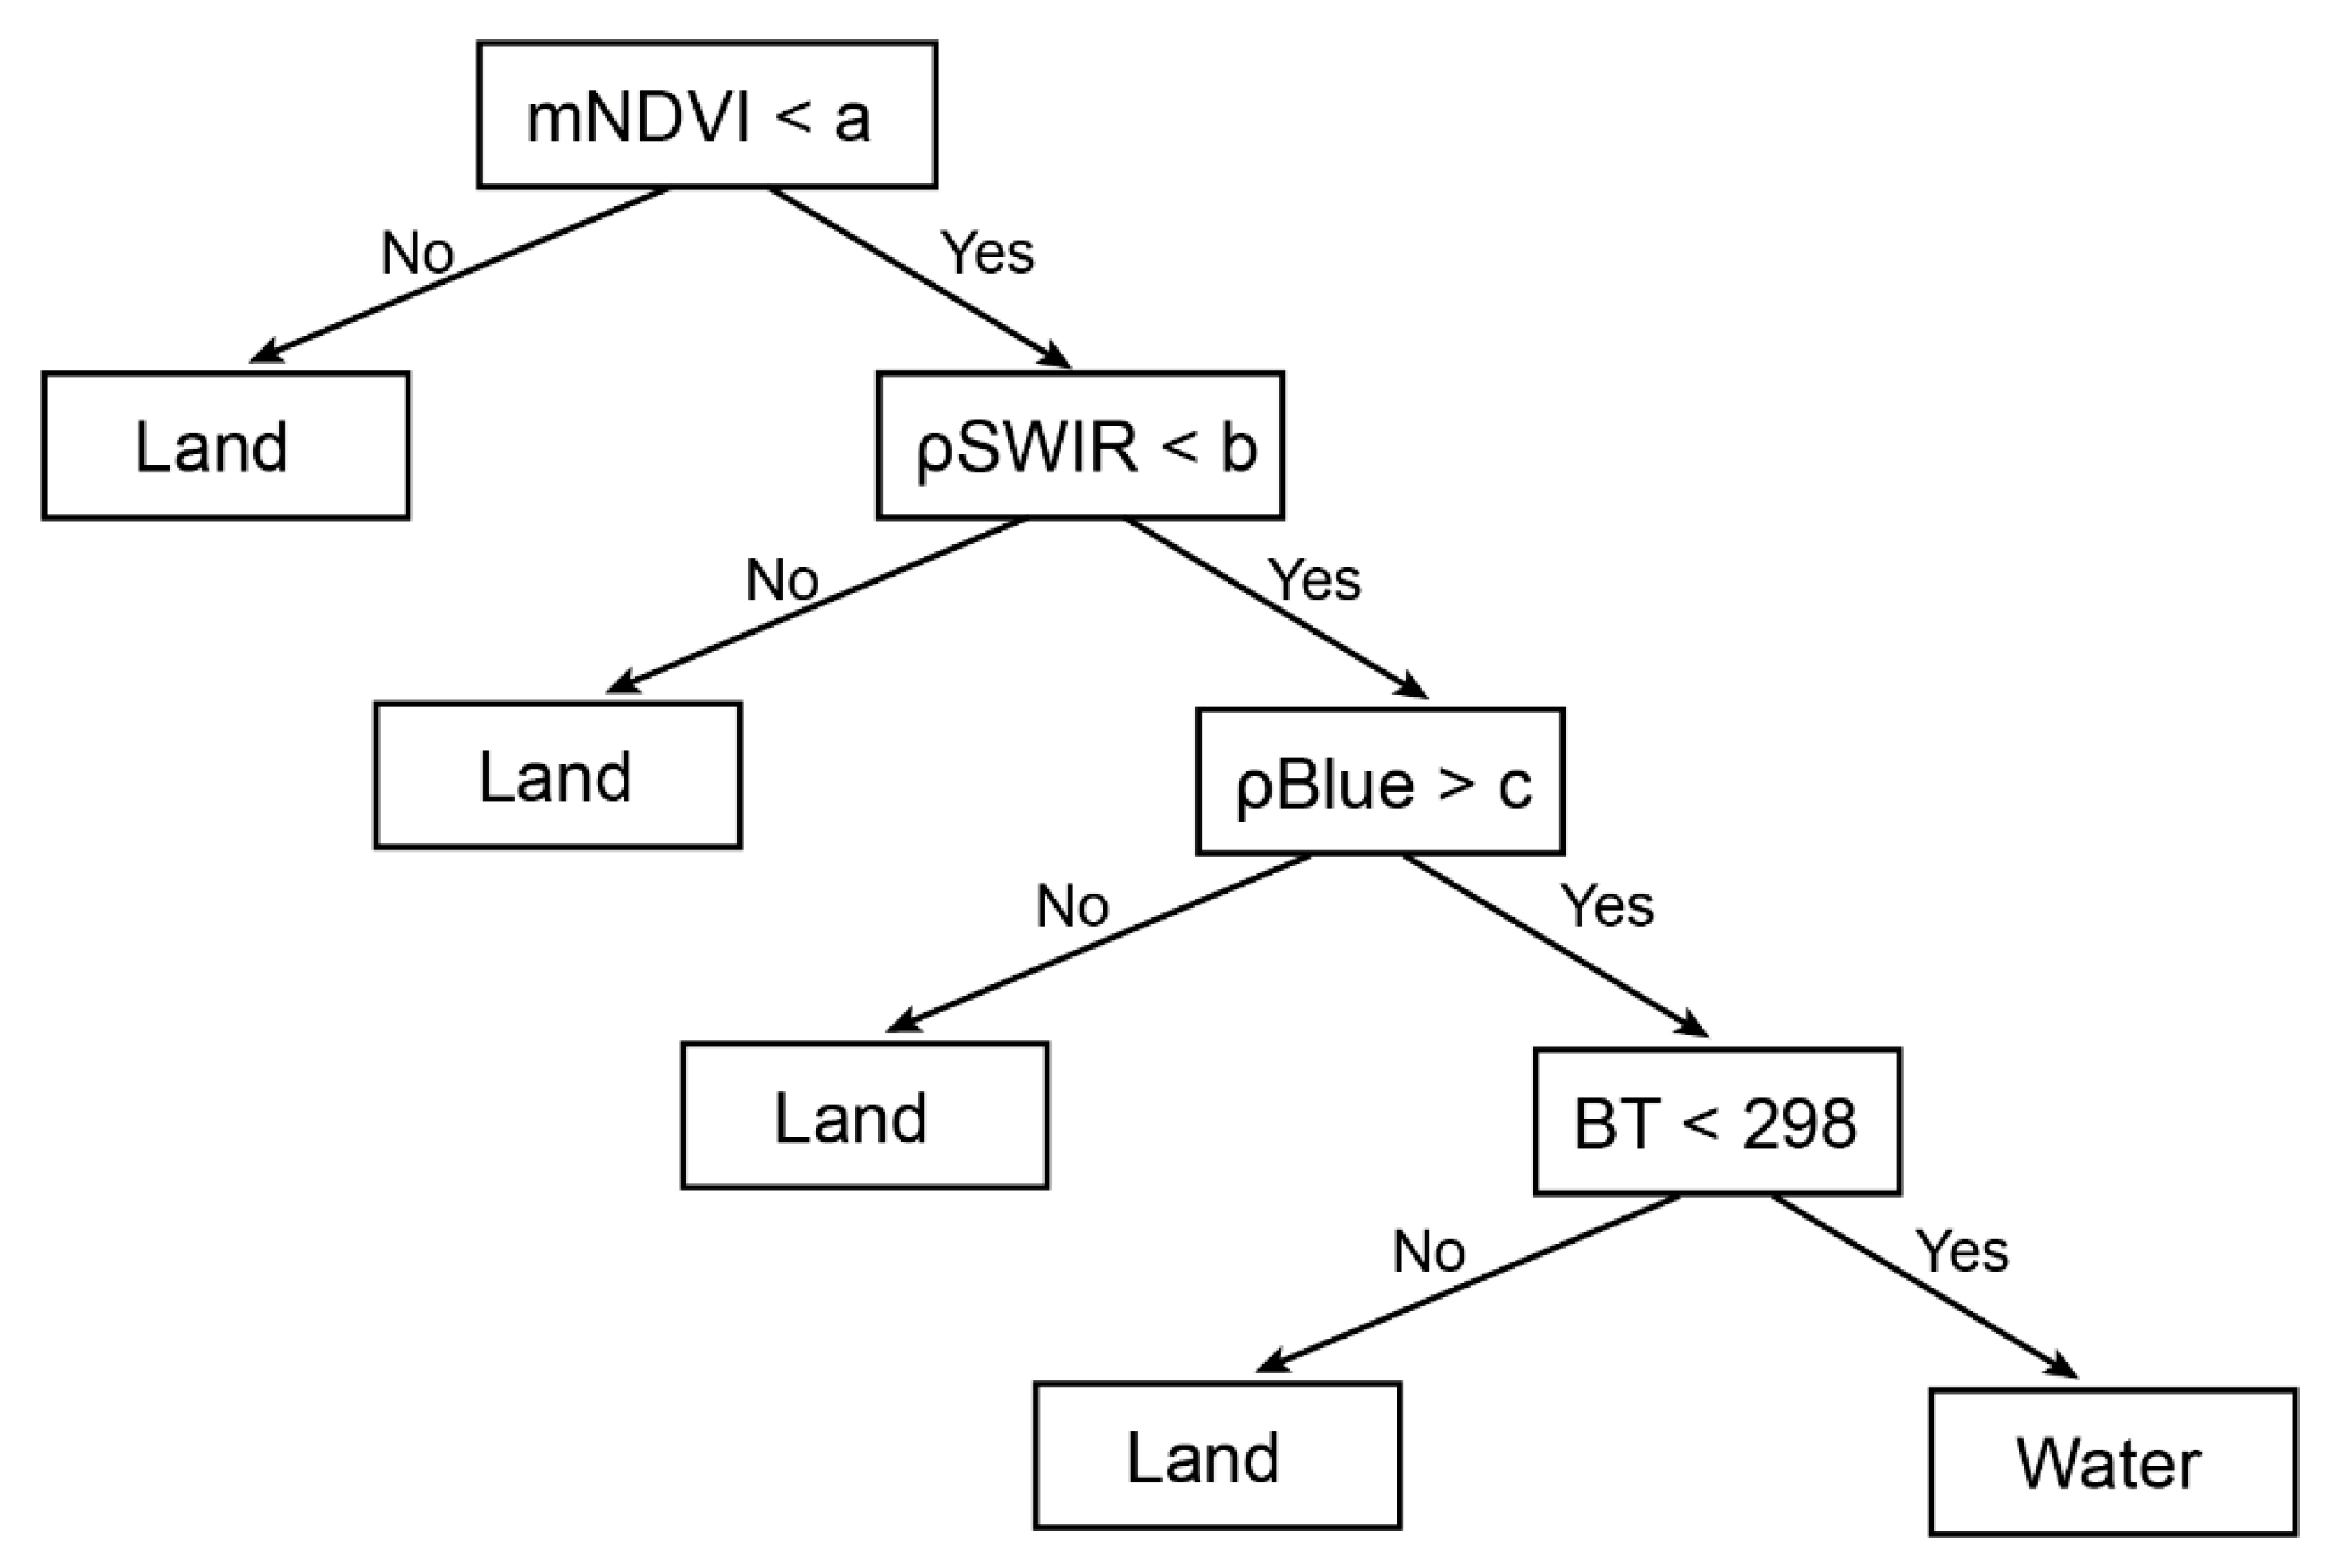
The final hierarchical binary ruleset is shown in Figure 7 where a-c are the time period specific thresholds for each term (see Table 4):

3.4. Generation of Vector Datasets

The binary surface water classifications were exported as images in GeoTiff format from Google Earth Engine and converted to a vector (polygons) data type in ArcMap 10.5 (ESRI, Redlands, CA, USA) for clean-up. Polygons representing the non-main channel water were manually extracted into a separate shapefile and polygons were dissolved into a single aggregate polygon layer. For polygons that comprised the main channel, topological rules of Must Not Have Gaps and Must Not Overlap [27] were applied. The main channel polygons were also dissolved into a single aggregate polygon layer.

3.5. Validation

Validation points were created in Google Earth Engine through visual interpretation of the corresponding cloud-free Landsat mosaics. A total of 445 water and 445 land points were generated for each of the three time periods across all basins. Edge pixels representing the boundaries between classes were avoided. Table 5, Table 6 and Table 7 illustrate the confusion matrices for the three time periods. High accuracies were achieved for all time periods (>90%). The misclassifications result from points where the river is too narrow to have been included in the final classification.

4. User Notes

Unlike [7,8] which are surface water datasets created at a high spatial resolution (<5 m), the datasets described here were generated at a pixel size of 30 m. The implication of this moderate spatial resolution is that smaller water bodies, such as small rivers and creeks narrower than the pixel size are not included. Similarly, narrow rivers or streams with thick vegetation cover restricting the view of the satellites could not be classified resulting in an underestimation of the total area of surface water. In addition, due to the high frequency of cloud cover in the region, in order to generate a cloud-free mosaic, multiple years are considered in each period; small temporal scale changes in the course of the rivers during those periods may not be represented. The use of higher spatial resolution, and higher temporal frequency imagery (see Section 5) would improve upon the detection of these small water bodies.

5. Discussion and Conclusions

To improve upon our results, further research examining the potential of monthly or quarterly high spatial resolution basemap mosaics (3.7 m resolution) suitable for machine vision analysis, or surface reflectance mosaics from the Planet Dove constellation for recent (from 2016 onwards) time periods should be examined. These data would increase the number of small non-main channel water bodies and narrow creeks that could be resolved (e.g., [28]). For example, Ref. [29] showed a significant decrease in the Lake Powell reservoir surface area between 2019 and 2021 from PlanetScope imagery classified in Google Earth Engine on a bi-weekly basis. Such high temporal resolution data may also be beneficial in the Peruvian Amazon to track rapid changes during the inundation of the floodplain in the high water season. As shown by [30], such imagery used in combination with in situ river gauge data, a semi-automated river flow estimation could be derived. Nevertheless, for long-term records of historical change (i.e., prior to the availability of high spatial resolution satellite imagery) in locations without aerial or satellite photography, moderate resolution satellite imagery continues to be a source of valuable information about changes in the landscape.
Author Contributions

Conceptualization, M.K.; methodology, M.K. and J.P.A.-M.; validation, M.K.; formal analysis, M.K., J.P.A.-M.; writing—original draft preparation, M.K., J.P.A.-M. and O.T.C.; writing—review and editing, M.K., J.P.A.-M, O.T.C., Y.T. and C.A. All authors have read and agreed to the published version of the manuscript.

Funding

This research was funded by the Japan Society for the Promotion of Science (23243045; 26245032; 18H05312; 20K20332; 18KK0042), the Social Sciences and Humanities Council of Canada (435-2015-0520; 430-2016-00974), and the Arts and Science Tri-Council Bridge Funding Program at the University of Toronto. The APC was funded by the Natural Sciences and Engineering Research Council (NSERC) Canada.

Institutional Review Board Statement

Not applicable.

Informed Consent Statement

Not applicable.

Data Availability Statement

The datasets are available for download from: https://doi.org/10.5683/SP3/SLF3PS (accessed on 2 January 2022).

Acknowledgments

We thank three anonymous reviewers for their comments which helped improve the manuscript and D. Zayonc and O. Lucanus for providing field photographs.

Conflicts of Interest

The authors declare no conflict of interest. The funders had no role in the design of the study; in the collection, analyses, or interpretation of data; in the writing of the manuscript, or in the decision to publish the results.

References

  1. Liao, A.P.; Chen, L.J.; Chen, J.; He, C.Y.; Cao, X.; Chen, J.; Peng, S.; Sun, F.D.; Gong, P. High-resolution remote sensing mapping of global land water. Sci. China-Earth Sci. 2014, 57, 2305–2316. [Google Scholar] [CrossRef]
  2. Malthus, T.J.; Hestir, E.L.; Dekker, A.G.; Brando, V.E. The case for a global inland water quality product. In Proceedings of the 2012 IEEE International Geoscience and Remote Sensing Symposium, Munich, Germany, 22–27 July 2012; pp. 5234–5237. [Google Scholar] [CrossRef]
  3. Pekel, J.-F.; Cottam, A.; Gorelick, N.; Belward, A.S. High-resolution mapping of global surface water and its long-term changes. Nature 2016, 540, 418–422. [Google Scholar] [CrossRef]
  4. Bontemps, S.; Defourny, P.; Radoux, J.; Van Bogaert, E.; Lamarche, C.; Achard, F.; Mayaux, P.; Boettcher, M.; Brockmann, C.; Kirches, G.; et al. Consistent global land cover maps for climate modelling communities: Current achievements of the ESA Land Cover CCI. In Proceedings of the ESA Living Planet Symposium, Edinburgh, UK, 9–13 September 2013; pp. 1–6. [Google Scholar]
  5. European Commission’s Joint Research Centre; UN Environment; Google. Global Surface Water Explorer. Available online: https://global-surface-water.appspot.com/ (accessed on 7 December 2021).
  6. Kalacska, M.; Arroyo-Mora, J.P.; Lucanus, O.; Sousa, L.; Pereira, T.; Vieira, T. Deciphering the many maps of the Xingu River Basin—An assessment of land cover classifications at multiple scales. Proc. Acad. Natl. Sci. USA 2020, 166, 1–55. [Google Scholar] [CrossRef]
  7. Kalacska, M.; Lucanus, O.; Sousa, L.; Arroyo-Mora, J.P. High-Resolution Surface Water Classifications of the Xingu River, Brazil, Pre and Post Operationalization of the Belo Monte Hydropower Complex. Data 2020, 5, 75. [Google Scholar] [CrossRef]
  8. Demarchi, L.; van de Bund, W.; Pistocchi, A. Object-Based Ensemble Learning for Pan-European Riverscape Units Mapping Based on Copernicus VHR and EU-DEM Data Fusion. Remote Sens. 2020, 12, 1222. [Google Scholar] [CrossRef] [Green Version]
  9. Coomes, O.T.; Takasaki, Y.; Abizaid, C.; Arroyo-Mora, J.P. Environmental and market determinants of economic orientation among rain forest communities: Evidence from a large-scale survey in western Amazonia. Ecol. Econ. 2016, 129, 260–271. [Google Scholar] [CrossRef]
  10. Webster, K.; Arroyo-Mora, J.P.; Coomes, O.T.; Takasaki, Y.; Abizaid, C. A cost path and network analysis methodology to calculate distances along a complex river network in the Peruvian Amazon. Appl. Geogr. 2016, 73, 13–25. [Google Scholar] [CrossRef]
  11. Kalacska, M.; Arroyo-Mora, J.P.; Coomes, O.; Takasaki, Y.; Abizaid, C. Multi-Temporal Surface Water Classification for Four Major Rivers from the Peruvian Amazon [data], Scholars Portal Dataverse, V1. 2021. Available online: https://dataverse.scholarsportal.info/dataset.xhtml?persistentId=doi:10.5683/SP3/SLF3PS (accessed on 2 January 2022).
  12. USGS. Landsat 5. Available online: https://www.usgs.gov/core-science-systems/nli/landsat/landsat-5 (accessed on 7 December 2021).
  13. USGS. Landsat 7. Available online: https://www.usgs.gov/landsat-missions/landsat-7 (accessed on 7 December 2021).
  14. USGS. Landsat 8. Available online: https://www.usgs.gov/landsat-missions/landsat-8 (accessed on 7 December 2021).
  15. Earth Engine Catalogue. USGS Landsat 8 Surface Reflectance Tier 1. Available online: https://developers.google.com/earth-engine/datasets/catalog/LANDSAT_LC08_C01_T1_SR#description (accessed on 7 December 2021).
  16. Asner, G.P. Cloud cover in Landsat observations of the Brazilian Amazon. Int. J. Remote Sens. 2001, 22, 3855–3862. [Google Scholar] [CrossRef]
  17. Department of the Interior; USGS. Landsat 4-7 Collection 1 Surface Reflectance Code LEDAPS Product Guide V3; USGS: Sioux Falls, SD, USA, 2020.
  18. USGS. What Are the Band Designations for the Landsat Satellites? Available online: https://www.usgs.gov/faqs/what-are-band-designations-landsat-satellites?qt-news_science_products=0#qt-news_science_products (accessed on 7 December 2021).
  19. Rowan, G.S.L.; Kalacska, M. A Review of Remote Sensing of Submerged Aquatic Vegetation for Non-Specialists. Remote Sens. 2021, 13, 623. [Google Scholar] [CrossRef]
  20. McFeeters, S.K. The use of the normalized difference water index (NDWI) in the delineation of open water features. Int. J. Remote Sens. 1996, 17, 1425–1432. [Google Scholar] [CrossRef]
  21. Gao, B.-C. NDWI—A normalized difference water index for remote sensing of vegetation liquid water from space. Remote Sens. Environ. 1996, 58, 257–266. [Google Scholar] [CrossRef]
  22. Xu, H. Modification of normalised difference water index (NDWI) to enhance open water features in remotely sensed imagery. Int. J. Remote Sens. 2006, 27, 3025–3033. [Google Scholar] [CrossRef]
  23. Davies, J.A.; Robinson, P.J.; Nunez, M. Field determinations of surface emissivity and temperature for Lake Ontario. J. Appl. Meteorol. Climatol. 1971, 10, 811–819. [Google Scholar] [CrossRef]
  24. Okwen, R.; Pu, R.; Cunningham, J. Remote sensing of temperature variations around major power plants as point sources of heat. Int. J. Remote Sens. 2011, 32, 3791–3805. [Google Scholar] [CrossRef]
  25. Handcock, R.N.; Torgersen, C.E.; Cherkauer, K.A.; Gillespie, A.R.; Tockner, K.; Faux, R.N.; Tan, J. Thermal infrared remote sensing of water temperature in riverine landscapes. In Fluvial Remote Sensing for Science and Management; Carbonneau, P., Piegay, H., Eds.; John Wiley & Sons: Hoboken, NJ, USA, 2012. [Google Scholar]
  26. Tavares, M.H.; Cunha, A.H.F.; Motta-Marques, D.; Ruhoff, A.L.; Cavalcanti, J.R.; Fragoso, C.R.; Martín Bravo, J.; Munar, A.M.; Fan, F.M.; Rodrigues, L.H.R. Comparison of Methods to Estimate Lake-Surface-Water Temperature Using Landsat 7 ETM+ and MODIS Imagery: Case Study of a Large Shallow Subtropical Lake in Southern Brazil. Water 2019, 11, 168. [Google Scholar] [CrossRef] [Green Version]
  27. ESRI. Geodatabase Topology Rules and Topology Error Fixes. Available online: https://desktop.arcgis.com/en/arcmap/10.7/manage-data/editing-topology/geodatabase-topology-rules-and-topology-error-fixes.htm (accessed on 7 December 2021).
  28. Cooley, S.; Smith, L.S.; Stepan, L.; Mascaro, J. Tracking Dynamic Northern Surface Water Changes with High-Frequency Planet CubeSat Imagery. Remote Sens. 2017, 9, 1306. [Google Scholar] [CrossRef] [Green Version]
  29. Kimball, R. Measuring the Bathtub Ring: Calculating Reservoir Surface Area Changes in the Colorado River Basin. 2021. Available online: https://www.planet.com/pulse/measuring-the-bathtub-ring-calculating-reservoir-surface-area-changes-in-the-colorado-river-basin/ (accessed on 13 December 2021).
  30. Junqueira, A.M.; Mao, F.; Mendes, T.S.G.; Simoes, S.J.C.; Balestieri, J.A.P.; Hannah, D.M. Estimation of river flow using CubeSats remote sensing. Sci. Total Environ. 2021, 788, 147762. [Google Scholar] [CrossRef] [PubMed]
Figure 1. Map of the extent of surface water classification for the reaches of the four major rivers. The polygons represent the focal areas of PARLAP. The white line illustrates the borders of Peru.
Data 07 00006 g001
Figure 2. Field photographs showing examples of the variability of the riverscape. (A) Amazon River; (B) confluence of non-main channel water with the Amazon River. A small lake can also be seen in proximity; (C) islands exposed during the low water season on the Amazon River; (D) non-main channel water (Amazon River) near Iquitos; (E,F) Napo River; (G) oxbow lake off the Ucayali River main channel; (H) non-main channel water with the Ucayali River in the background; (I,J) Ucayali River, (K) Rio Negro (blackwater river) for comparison, (L) Xingu River (clearwater river) for comparison. Photographs by C. Abizaid, J.P. Arroyo-Mora, O. Coomes, O. Lucanus, and D. Zayonc.
Data 07 00006 g002
Figure 3. Relative spectral responses of the multispectral bands from Landsat TM 5 (A), 7 ETM+ (B), and 8 OLI (C).
Data 07 00006 g003
Figure 4. Example spectral signature of the Amazon River main channel south of Iquitos illustrating the comparatively high reflectance in all but two shortwave infrared (SWIR) bands. The clearer non-main channel Amazon River surface water example resembles the spectra of the Xingu River, Brazil, a large clearwater tributary of the Amazon, and the Rio Negro, a large blackwater tributary of the Amazon, both included here for comparison. The spectrum shown from the Xingu is from an image acquired at the start of the low-water season when the water is clear [6]. Water strongly absorbs in wavelengths from the NIR onwards [19] resulting in low reflectance.
Data 07 00006 g004
Figure 5. (A) Subset of the TM 5 surface reflectance mosaic of the Amazon River including the city of Iquitos displayed as a SWIR2:NIR:Green composite. The main channel of the Amazon River can be seen as a lighter blue compared to the low reflectance (dark) clearwater in the small lakes; (B) mNDWI; (C) surface water as delineated by the mNDWI threshold (mNDWI < 150) prior to refinement, a true colour (Red:Green:Blue) composite is shown as the background for context. With the mNDVI threshold of 150, some pixels representing the city of Iquitos are misclassified as water; (D) surface reflectance in the SWIR2 band. The land and water pixels are clearly separable; (E) surface reflectance in the blue band.
Data 07 00006 g005
Figure 6. Histograms of mNDVI values within the threshold range of water for (A) TM 5, (B) 7 ETM+, and (C) 8 OLI.
Data 07 00006 g006
Figure 7. The hierarchical ruleset for classifying persistent surface water. a–c represent the time period specific thresholds for mNDVI, SWIR2 reflectance, and Blue reflectance, respectively, for the three datasets (see Table 4).
Data 07 00006 g007
Table 1. Band information for Landsat TM 5 [18].
BandWavelength Range (µm)Resolution (m)Designation
10.45–0.5130Blue
20.52–0.6030Green
30.63–0.6930Red
40.76–0.9030NIR
51.55–1.7530SWIR1
610.40–12.50120 (30) *Thermal infrared
72.08–2.3530SWIR2
* The thermal infrared band is resampled from the 120 m spatial resolution it was acquired at to 30 m pixels.
Table 2. Band information for Landsat 7 ETM+ [18].
BandWavelength Range (µm)Resolution (m)Designation
10.45–0.5230Blue
20.52–0.6030Green
30.63–0.6930Red
40.77–0.9030NIR
51.55–1.7530SWIR1
610.40–12.5060 (30) *Thermal infrared
72.09–2.3530SWIR2
80.52–0.9015Panchromatic
* The thermal infrared band is resampled from the 60 m spatial resolution it was acquired at to 30 m pixels.
Table 3. Band information for Landsat 8 OLI and TIRS [18].
BandWavelength Range (µm)Resolution (m)Designation
10.43–0.4530Coastal aerosol
20.45–0.5130Blue
30.53–0.5930Green
40.64–0.6730Red
50.85–0.8830NIR
61.57–1.6530SWIR1
72.11–2.2930SWIR2
80.50–0.6815Panchromatic
91.36–1.3830Cirrus
10 *10.60–11.19100Thermal infrared 1
11 *11.50–12.51100Thermal infrared 2
* Bands 10 and 11 are part of the Thermal Infrared Sensors (TIRS), and bands 1–9 are part of the Operational Land Imagery (OLI).
Table 4. Thresholds of mNDWI, ρBlue, and ρSWIR2 for the three-time periods from the three Landsat sensors.
PeriodSensormNDWIρBlue (%)ρSWIR2 (%)
1989TM5−65–150>2.0<3.0
2000ETM7+−75–150>3.5<3.0
2015OLI8−85–160>3.0<3.0
Table 5. Confusion matrix for the persistent surface water classification from Landsat TM 5 (circa 1989). OA is the overall accuracy.
Water-ReferenceLand-ReferenceUser’s Accuracy (%)
Water-classification4240100
Land-classification2144595.5
Producer’s Accuracy (%)95.2100OA = 97.3
Table 6. Confusion matrix for the persistent surface water classification from Landsat 7 ETM+ (circa 2000). OA is the overall accuracy.
Water-ReferenceLand-ReferenceUser’s Accuracy (%)
Water-classification4150100
Land-classification3044593.7
Producer’s Accuracy (%)93.2100OA = 96.6
Table 7. Confusion matrix for the persistent surface water classification from Landsat 8 OLI (circa 2015). OA is the overall accuracy.
Water-ReferenceLand-ReferenceUser’s Accuracy (%)
Water-classification4160100
Land-classification2944593.9
Producer’s Accuracy (%)93.5100OA = 96.7
Publisher’s Note: MDPI stays neutral with regard to jurisdictional claims in published maps and institutional affiliations.