Article

Business Intelligence for IT Governance of a Technology Company

by
Vittoria Biagi
1,2,*,
Riccardo Patriarca
1 and
Giulio Di Gravio
1
1
Department of Mechanical and Aerospace Engineering, Sapienza University of Rome, Via Eudossiana 18, 00184 Rome, Italy
2
FSTechnology, Piazza della Croce Rossa 1, 00161 Rome, Italy
*
Author to whom correspondence should be addressed.
Submission received: 9 November 2021 / Revised: 13 December 2021 / Accepted: 15 December 2021 / Published: 27 December 2021
(This article belongs to the Section Information Systems and Data Management)

Abstract

:
Managers are required to make fast, reliable, and fact-based decisions to encompass the dynamicity of modern business environments. Data visualization and reporting are thus crucial activities to ensure a systematic organizational intelligence especially for technological companies operating in a fast-moving context. As such, this paper presents case-study research for the definition of a business intelligence model and related Key Performance Indicators (KPIs) to support risk-related decision making. The study firstly comprises a literature review on approaches for governance management, which confirm a disconnection between theory and practice. It then progresses to mapping the main business areas and suggesting exemplary KPIs to fill this gap. Finally, it documents the design and usage of a BI dashboard, as emerged via a validation with four managers. This early application shows the advantages of BI for both business operators and governance managers.

1. Introduction

Over recent years, a benchmark approach has often been used in technology companies to carry out performance analysis based on cost indicators (e.g., IT cost over revenue, IT costs per employee). This approach does not necessarily consider the dynamic evolution of the current technological context, the complexities of organizational realities, and the actual value delivered to businesses. It also does not necessarily correlate the costs of developing a product or service to their earned value for the end customer. In parallel, companies’ attention to decisional problems is growing, pushing for data-driven decision making in all business areas [1].
Traditionally, organizational business intelligence (BI) focuses on quantitative results oriented to economic and financial terms. Due to current market evolution, this kind of analysis is not exclusive, and hence requires an extension towards cyber-physical technological dimensions of investigation. Governance acquires a crucial role because it is expected to improve interactions among business units, while guaranteeing a continuous alignment to the company’s strategic goals. In this context, IT governance has the main purpose of identifying the business value derived from investments in IT systems and ensuring the maximization of business value consistent with the corporate strategy. More formally, IT governance “[…] involves the leadership and organizational structures and processes required to ensure that the organization’s IT sustains and aligns with the organization’s strategies and objectives” (IT Governance Institute, 2011). As such, the development and implementation of a framework for IT governance is central for modern enterprises [2]. IT governance thus warrants dedicated and continuous attention to assess and improve operations [3].
This research proposes an approach to build reliable, easy-to-use, and flexible support systems which can be adopted for risk prevention and maximization of opportunities within IT governance. The proposed solution enables information sharing within the organization and facilitates the identification of critical governance areas to be monitored. This approach is meant to overcome the current limitations for governance: siloed information management, and non-standardized data extraction and report development techniques [4]. The scope of this research ranges from project and contract management to accountability management, thus contributing to the increase in the dynamicity of the processes being investigated [5,6,7]. This study was based on case-study research for an existing company, FSTechnology, which is part of the Italian Ferrovie dello Stato Group. Ferrovie dello Stato Group is an Italian rail transportation company having about 83,000 employees. In its 2019–2023 strategic plan, it declared the intention to invest EUR 58 billion, with EUR 6 bn intended for technology. These numbers confirm the company’s intention to pursue a path toward innovation and digitalization. FSTechnology is the services company dedicated to the technology and innovation initiatives in support of the Group.
The remainder of the paper is organized as follows: Section 2 describes the theoretical background of performance management, followed by a rapid overview of the state-of-the-art techniques for BI and data analysis, in the context of governance management. Section 3 details the data model and classification, the KPI indicators along with the BI system developed for the analysis, with the main findings. Section 4 highlights the strengths and weaknesses of the proposed solution and the managerial implications. Finally, Section 5 summarizes the contributions of the paper, documenting the potential for future research.

2. Theoretical Background

2.1. Performance Management

Performance management is one of the usual mechanisms to improve the alignment between management of business units/customers and staff [8]. The dynamic business environment now requires the IT structure to provide business flexibility, effective use of technology systems and products for growth, cost efficiency, and support for effective asset utilization. Therefore, a centralized governance is necessary to drive, coordinate, and support business. IT governance has been also recognized as the structure that specifies the decision rights and accountability framework to encourage desirable behaviors [9]. The design and construction of an internal performance management system is crucial to increase the effectiveness and efficiency of services and products delivered to the business.
Accordingly, the two principal families of KPIs usually used refer to the efficiency and effectiveness of IT in supporting the business. Although there is a large number of best practices and methods for measuring IT performance, problems still occur when traditional financial measures are simply applied to IT [2]. The ability to make well-informed IT decisions requires an in-depth knowledge of IT processes and dedicated KPIs. Understanding and even improving any IT system requires measures to map the essential characteristic of the system itself [10]. This developed knowledge needs to be linked with the enterprise architecture, which then provides elements such as BI dashboards to provide data in a complex and ever-changing management environment [11,12]. In contrast, measuring performance relates to recognizing the variables that influence tasks’ performability and outputs’ generation. These elements are the Key Performance Drivers (KPDs), which often result in a KPD map [13]. This latter is a useful tool to identify critical factors or major drivers affecting company’s performance, as measured by Key Performance Indicators (KPIs). KPDs can be translated into a “works map”, which in turn helps to identify critical tasks. In summary, the three principal steps an organization should take for IT governance control are: to articulate a strategic performance objective; to define a set of KPDs; and to link these to specific KPIs.
KPIs can be either lagging or leading. Leading indicators are typically input-oriented and they set the target, i.e., costumer confidence or satisfaction. Lagging indicators are event-based, output-oriented and often follow the metrics for setting company’s goals. Lagging indicators are generally easier to identify and measure because they are associated with a more tangible measurement baseline. A good mix of leading and lagging indicators helps to reach company goals [14].
An effective strategy for the selection of indicators should consider the quality of the policy, the quality of the targets, the areas of interest within the organization, performance factors, and process targets. According to the UNI 11097 standards, indicators should be representative, simple and easy to interpret, capable of mapping trends, sensitive to changes within or outside the organization, and they should allow easy data collection and processing, being quick to update [15]. As such, it is firstly required to define a theoretical framework, which should be able of capturing not only a holon of the physical system, but should also explicitly be linkable to the mental model of the designers. To this extent, reflexivity is thus an essential feature to be considered. The event observed and the observer itself are not separated because the way the observer approaches the problem shapes the problem itself [8]. Defining an indicator is about understanding its applicability for the individuals, teams, and organization. Furthermore, the metric design should be intended as a collaborative effort to ensure that the observer and the observed individuals share the same functional perspective [5].
A critical insight into how to deal with performance data comes from Goodhart’s Law: “When a measure becomes a target, it ceases to be a good measure” [16,17]. The measure of performance is no longer reliable when the measure’s optimization comes from the people that are measured themselves. A set of indicators is thus needed to capture potential inter-relationships in the measurement system.
The importance of metric fixation is widely recognized in the field of social science, in particular, an observation of a phenomena and the public reporting can affect the behaviors being observed. A system cannot be observed without introducing a change to itself. This phenomenon is even emphasized when the observed system is a socio-technical system, in which the people being observed change their behavior when they know they are being observed, as per the so-called Hawthorne effect [18]. A plethora of cases in industry for diverse sectors or organizations prove the significance of Goodhart’s Law. Similarly, the theory of constraints (i.e., critically reflecting on the reality being measured), in addition to a systematic balance scorecard to jointly measure multiple perspectives, and the usage of human discretion to define incremental measurement systems, can reduce the side effects of measurement. This is stated by Campbell’s Law as: “The more any quantitative social indicator is used for social decision-making, the more subject it will be to corruption pressures and the more apt it will be to distort and corrupt the social processes it is intended to monitor” [19].
Consequently, a reliable performance management system should be designed considering the time needed to acquire these metrics, whether the metrics are really useful, who are the key users, and the effects of the metrics, in addition to the reward and transparency aspects [20].

2.2. Business Analytics

The ability of the business to quickly respond to dynamic changes in the marketplace relies on the IT support to provide the technology and tools to the business for facing the related challenges. These tools collect and analyze a huge amount of data and support the business in the decision-making phase: they are called business analytics (BA) systems [21]. BA is recognized as a crucial company asset that encompasses people, processes, and technologies involved in the data gathering, analysis, and transformation to support managerial decisions [22]. The importance of data visualization and business analytics both in new product development (NDP) and project management has been widely discussed in the literature, in addition to the benefits in considering appropriate visualizations as part of the PPM process [23,24,25]. BA is considered a key element for helping decision makers and analysts throughout a project lifecycle [26]. BA is presented as a crucial asset for decision makers, who need comprehensive dashboarding, and online analytical processing technologies to improve and to enhance their decision-making capabilities [27]. This area embraces statistical analysis, data visualization, predictive modelling, and forecasting systems. BA is widely used as an umbrella term that includes earlier and complementary systems such as decision support and business intelligence systems [28,29].
According to Shanks et al. [30], BA provides value to the organization when it is embedded in it. High-quality infrastructure is crucial to embed BA into operational systems; it should be coupled with processes that are both external, for business development, and internal, in support of the fabric and operations. BA should be the everyday support tool for any decision makers, constantly and fully aligned with business strategies [30].
BA applications are widespread. Benefits for socio-technical system management have been documented in aviation, in line with the International Civil Aviation Organization (ICAO) push for standardization [31]. This also applies within industrial safety management for making fact-based decisions [32]. Another field of application is healthcare, in which a system of KPI indicators with a dashboard was designed to monitor the intensive care unit (ICU) performance in terms of both costs and quality of service [33]. In particular, product, service, and portfolio management are examples of areas that can benefit from true digital analytics [34]. BA considerably lowers time-consuming efforts, and enables making full use of the quality of work for analysts [35].
As shown in the literature, the capacity of a human mind is presently insufficient to settle on ideal business decisions in the era of big data [36]. Therefore, BA is becoming an essential tool that consolidates the business and technologies and provides support to decision makers through multi-scenario simulation and sensitivity analysis, which can help in dealing with business needs.
Finally, in today’s organizations it is crucial to consider how the company information must be shared across the enterprise. Reporting based on siloed data, business applications, data warehouses, and analytics applications needs to be replaced, and the information must be used as the basis for any decision [25,37]. Organizations must reengineer all their data management practices, that previously were based on gut feeling and experience of key users, in order to ensure they are systematically supported by BA [34]. Nevertheless, assuming that organizations actually take advantage of data is not straightforward: most enterprises are not even aware of the value their data and information silos have. In addition, they must also understand the value of IT technology in sharing company data. The challenge lies in achieving the right balance of people, processes, and technology. Furthermore, the role of technology is only one of supporting people making decisions; however, the data must be systematically governed at an aggregated level beyond technology [38]. When the information is managed in silos, a holistic version of organizational work domain is lost [39].

2.3. Business Analytics Background

In order to actualize these observations into an enterprise governance management paradigm, a scoping literature review was performed. The research was carried out in Scopus following the criteria defined in Table 1, and leading to the results synthesized in Table 2 and Figure 1.
After a first selection in Scopus of 172 initial articles, 72 were excluded after title reading (100 articles progressed to the next phase). Out of 100, 64 were excluded after abstracts reading, and the remaining 36 full-texts were deeply analyzed. The resulting articles (see Table 2), are focused on diverse aspects of project governance, particularly in those enterprises operating in technical and high-risk environments characterized by (i) new product development (NDP); (ii) time-to-market reduction [3]; (iii) the ability to perform forecast scenarios and predictive analysis of the company business and status; and (iv) high risk in project portfolios, which leads to a higher project portfolio success and fewer errors and failures [40,41].
Any project is characterized by an intertwined context, which accounts for various disciplines, in turn demanding interdisciplinary cooperation [4]. Identifying these functional links is thus a crucial step for effective governance, and for designing IT tools capable of responding to specific project needs [42], and achieving strategic objectives [43]. IT tools for governance have been recognized to enhance efficiency, legitimacy, and accountability [44]. For the implementation of a governance system, it is essential to establish an organizational mission and vision, as part of the strategy and objectives to be governed. The benefits of standardization can help to build a staging area for learning from different domains and sectors [45]. The governance system should include both project management and benefit management to ensure correct project delivery in terms of timing and costs [46]. It should also extend towards a thorough product portfolio management, including targets and related KPIs, during product lifecycle [47]. For example, governance control may foster new product development in terms of a more effective product selection and improvements to the portfolio cash margins [48]. A project governance system should be conceived to be implemented not only at the top management level, but also in more operational roles [45].
A continuous performance monitoring system strengthens governance management [49] and, as such, it fosters a simultaneous control of costs and quality levels [50]. Although governance frameworks have been discussed in previous literature, empirical examples are scarce [51]. Consequently, this manuscript proposes a solution that accounts for a centralized data model to support holistic decision-making in project governance. The solution is aimed to be usable at different organizational levels, and compatible with IT systems to dynamically incorporate targets and KPIs.

3. Results

3.1. Data Model

This section describes a case-study on the application of BA and, more specifically, business intelligence (BI) for a reporting system in the governance of a technology company (i.e., FSTechnology). The data model was developed according to the two dimensions of a BI system: technical (data quality, correlation with other systems, and user access) and organizational dimensions (flexibility and risk management support) [52]. The building process started from the strategic objectives of the company followed by the identification of the critical success factors, considering both internal (organizational needs, process structures, key resources, etc.) and external constraints (e.g., regulatory environment). The key elements at this stage are summarized in Figure 2, as a support to develop the tailored model for the case-study. This map allows the information needs’ identification in building the BI model, and its key data elements to serve as a basis for the governance system.
The main objective of a directional information system is delivering useful information to decision-makers to support them in monitoring company’s performance. In this research, a system of indicators was constructed to enable the representation of the enterprise’s capacity to achieve short-, medium-, and long-term objectives. The main features of this directional system are [53]:
  • Completeness: The ability to measure the overall created value;
  • Relevance: The system is strictly related to the decision-making phase of the company so that it can cover the critical area for the management at any moment;
  • Selectivity: A balanced quantity of information delivered, without information overloading;
  • Flexibility: The system must follow the rapid change of the strategic area (e.g., in the current environment, the strategic factor or the critical area for a company changes rapidly);
  • Understandability: Information can rapidly spread through the organization so that the company staff can understand actual performance, critical variables, achieved results, and processes implementation status;
  • Timing: The capability to produce and transmit information at the right time and with the right frequency customized to support company decision-making.
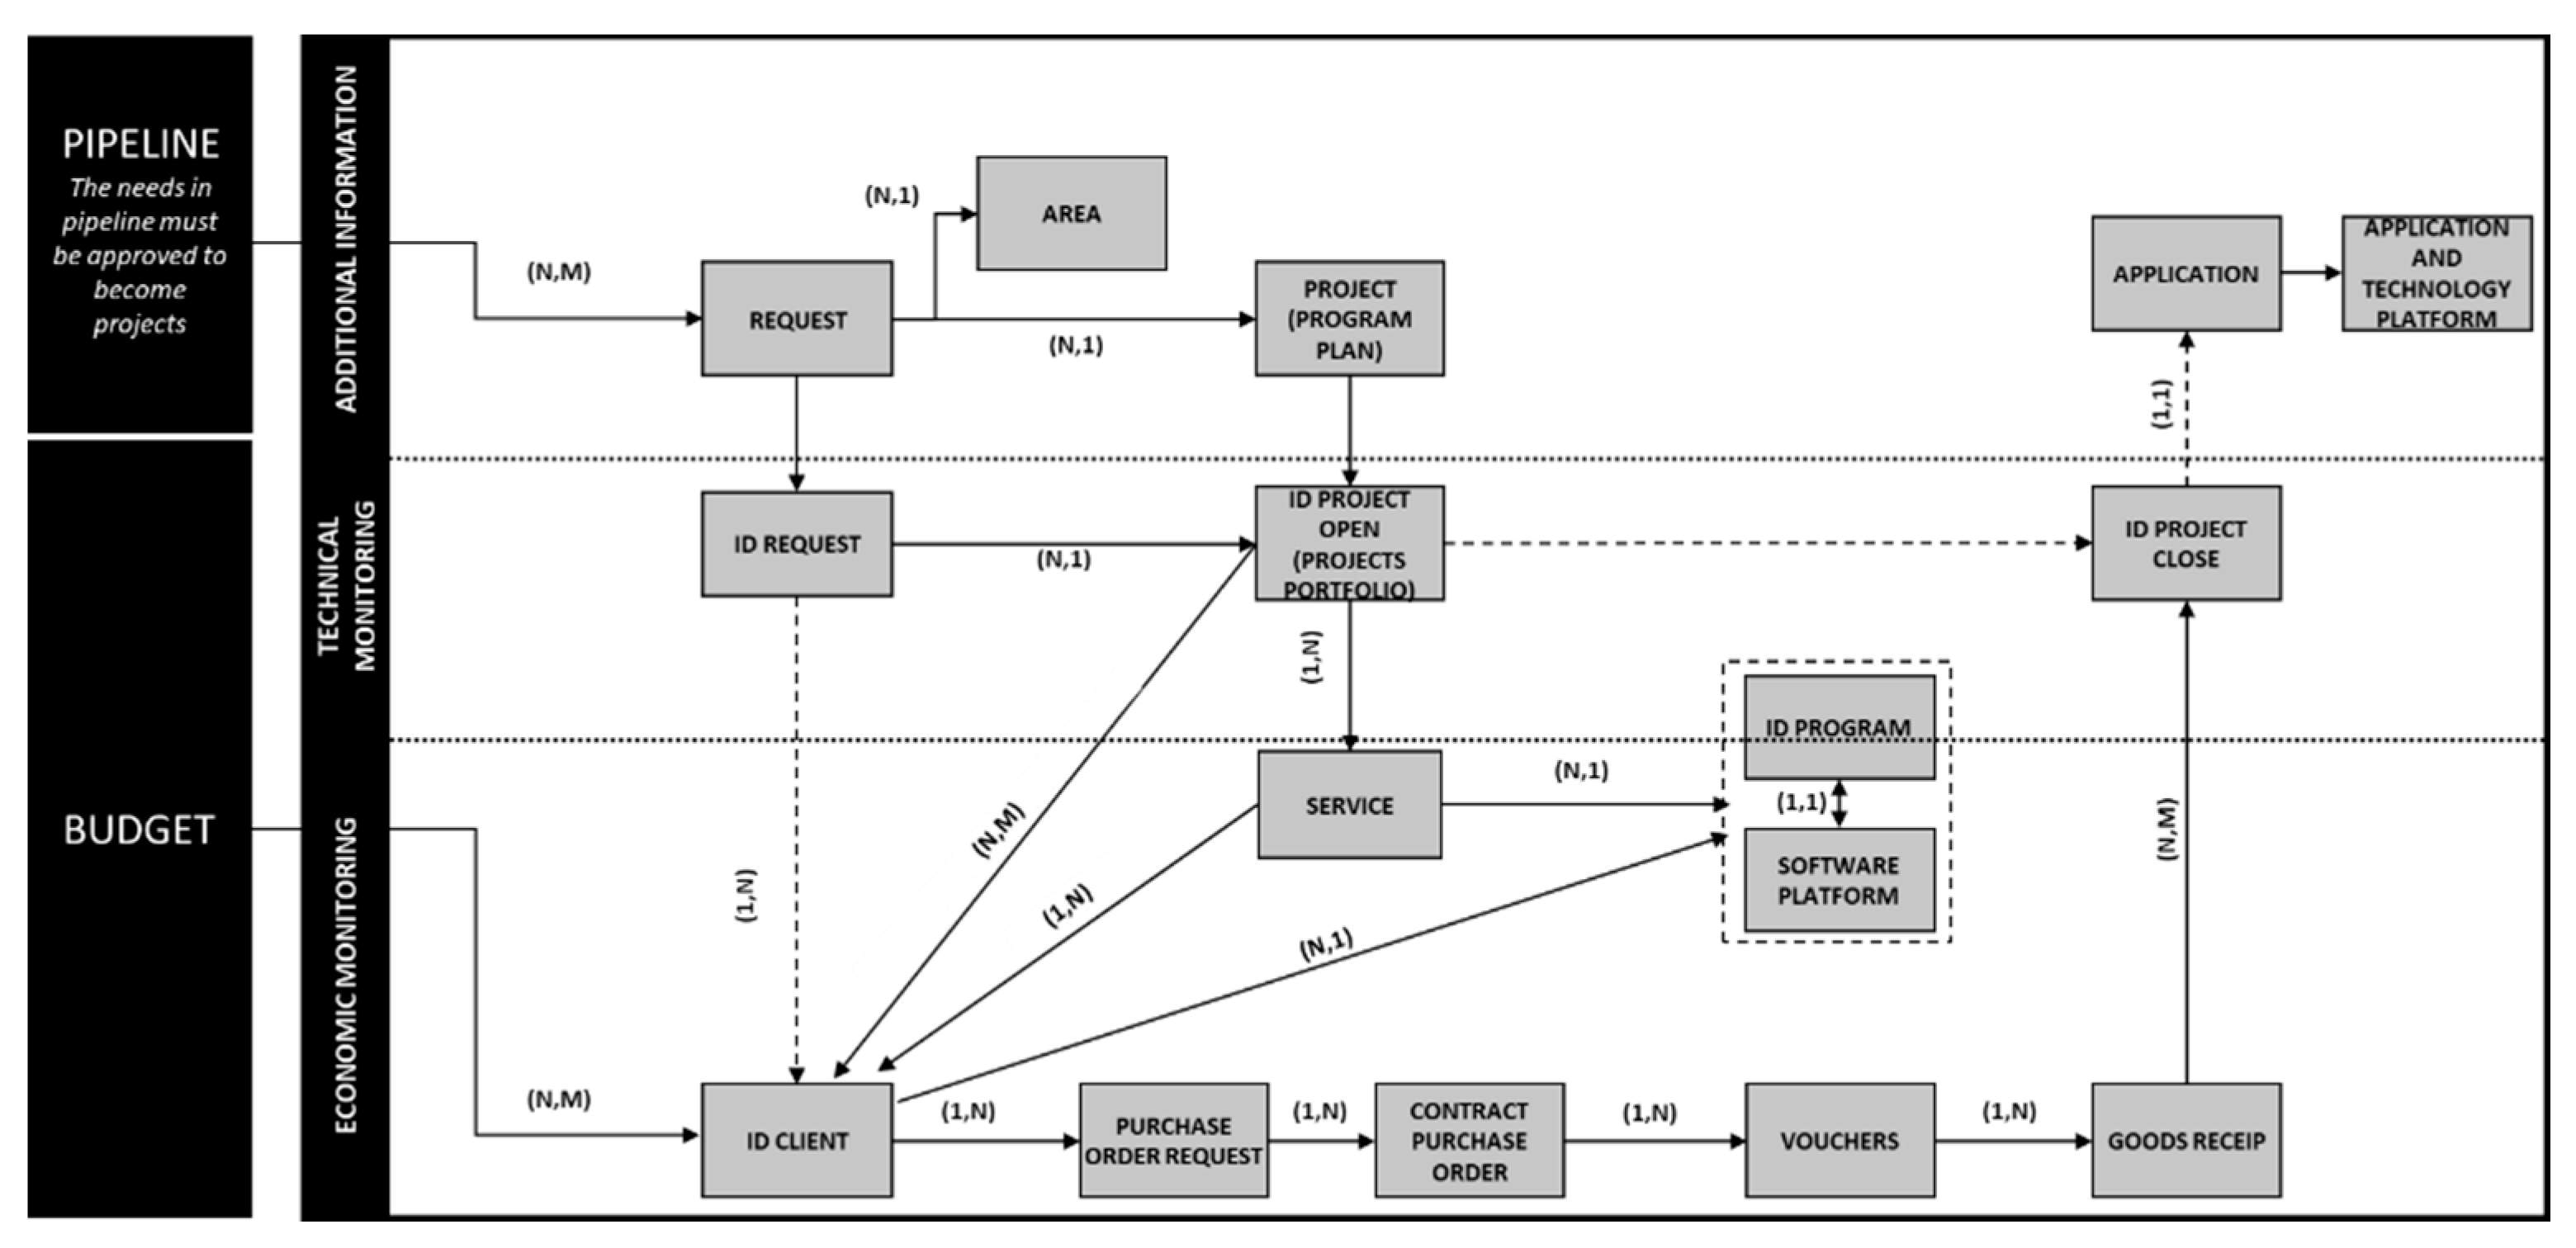
In this research, the BI model representative of the case-study company started from the definition of the strategic areas and the processes to be monitored, in particular: Master Plan Management, Portfolio and Program Management, and their relationships with Project Governance. Then, a first data model was designed for the Entity–Relationship (ER) diagram [54] (Figure 3), depicting the main entities, the investigated areas, and the respective relationships.

3.2. Data Classification and Collection

In order to design and build the performance management system, additional features of BA and BI should be considered [32]:
  • Descriptive analytics: To support the answer to questions about past events and historical data, by summarizing large sets of data to highlight the outcomes;
  • Diagnostic analytics: To examine closely the descriptive analytics results to find the cause;
  • Predictive Analytics: To enable the prediction of certain phenomena based on historical data;
  • Prescriptive Analytics: To help to answer questions about how to solve a certain problem and allow the business to make a fact-based decision;
  • Cognitive Analytics: To attempt to drew inferences (i.e., an unstructured hypothesis based on queries from different sources) and use different data and patterns for self-learning, to thus learn what might change if a certain circumstance changes.
Firstly, the enterprise as-is status must be understood and analyzed, and the data acquisition processes must be consolidated to build a solid and reliable BI for descriptive analytics. Subsequently, data can be aggregated for reporting by means of different queries from different data sources. Although project governance is widely recognized as a critical success factor in project delivery, there is a lack of consensus about its actual organizational benefits [55,56], which often results in difficulties for data collection [57].
Additionally, data typology and information the system receives requires an in-depth analysis: data can be structured, unstructured, or semi-structured. Structured data is the datatype that an IT system can easily analyze because it is included in a predefined field, whereas unstructured data do not necessarily adhere to a certain data structure or schema. Structured data can be classified as categorical or numeric; unstructured or semi-structured data are textual. In this research, only structured data were considered.
In the case study at hand, input data were collected through centralized and shared files from the company’s management information system and business units’ personnel. These data integrate the project information, the project status, and the technology involved.
A star schema logic was used to build the data model [58]. The star schema separates business process data into facts that contain the measurable, quantitative information about a business, along with the dimensions that are descriptive attributes related to the factual data. Fact tables contain the values of the data events and can be aggregated into a visual representation. The dimension tables contain the details about the data in fact tables. These latter’s are connected to the fact table through key columns.
The data-entry system adopted was an open-source system (Vtenext), which was customized in line with the project needs. In the early testing stages, it was introduced to 24 analysts and four managers. Following revisions and fine-tuning (interface, functionalities), the system is currently in use in the organization to collect data and feed the BI data model. Data from different company sources was integrated in order to gain a holist view of the company status, (e.g.) analyzing IT spending independently from the KPIs related to the technology context, and its evolution, might not support a complete situational awareness.
As anticipated in Figure 3, the data model was designed using four types of cardinalities: many-to-one, one-to-many, one-to-one, and many-to-many. Many-to-one (N,1) and one-to-many (1, N) cardinalities describe a relationship composed of many value instances in one column that are related to one value for another column. They usually describe the directionality between facts and tables. One-to-one (1,1) cardinality describes a relationship in which only one instance of a value is common between two tables and requires unique values in both tables. The last is the many-to-many relationship, which represents the correspondence between multiple values of one table and multiple values of the other. The core components of the BI data model are the relationships between the data recorded from the last database version and the table representing the current status (related with a one-to-one cardinality). Many records (i.e., projects) of this latter table correspond to one project already on-going in the transactional system.
Furthermore, a routine in the customized data entry system allows the historical data storage (it runs the first day of each month), to enable the comparison of the current data with the historical one. This data model allows dashboards to be produced and shared enterprise-widely, as described in the following paragraph.

3.3. KPI Mapping

In order to optimize the visualization of indicators in the BI system, a KPI booklet was developed starting from the Program and Portfolio Management processes. The KPI mapping was performed through a literature review [47,59,60,61,62,63,64] and a further check with the company managers involved in the process [65]. As shown by the literature contributions, the project portfolio efficiency is often associated with time, cost, and quality, which should constitute the core triad of elements being investigated [66]. Because the case-study refers to a technology company, technology was an additional factor included in the first iteration of the KPI booklet.
Accordingly, a number of KPIs were defined, as exemplified in Table 3 for the case of the KPI 1.1 and KPI 1.2. These two illustrative KPIs provide an overview of numerosity and main features of programs and projects carried out in each business area. A set of target values for each dimension depends on the business unit (de-identified in order not to break any intellectual property).

3.4. Business Intelligence

A performance dashboard is interpreted as an executive information system that synthetically captures the performance level of a system. When designing such dashboard, the number of indicators should follow certain user interface best practices and be sustainable in terms of readability and significance for the problem at hand [67]. A BI dashboard is then made available for selected personnel to monitor both project and contract status, and to consider the associated risk factors as per the defined KPIs. In the case study at hand, the dashboard was built through row level security to customize the readability of data for a certain group of users.
The dashboard is composed of two main reports (e.g.) one showing the updated company information about project status, number of projects underway, and the project total budget (total and split by business area); another one provides a monthly picture of the number of project managers and applications/systems in development, as well as an overview of the architecture (cloud, on premises); other are focused on decomposition of cost planning and expenses.
An example of a descriptive report for project planning is shown in Figure 4. A basic area chart was used to highlight the distribution of projects per starting and end dates, along with filters to highlight their status.
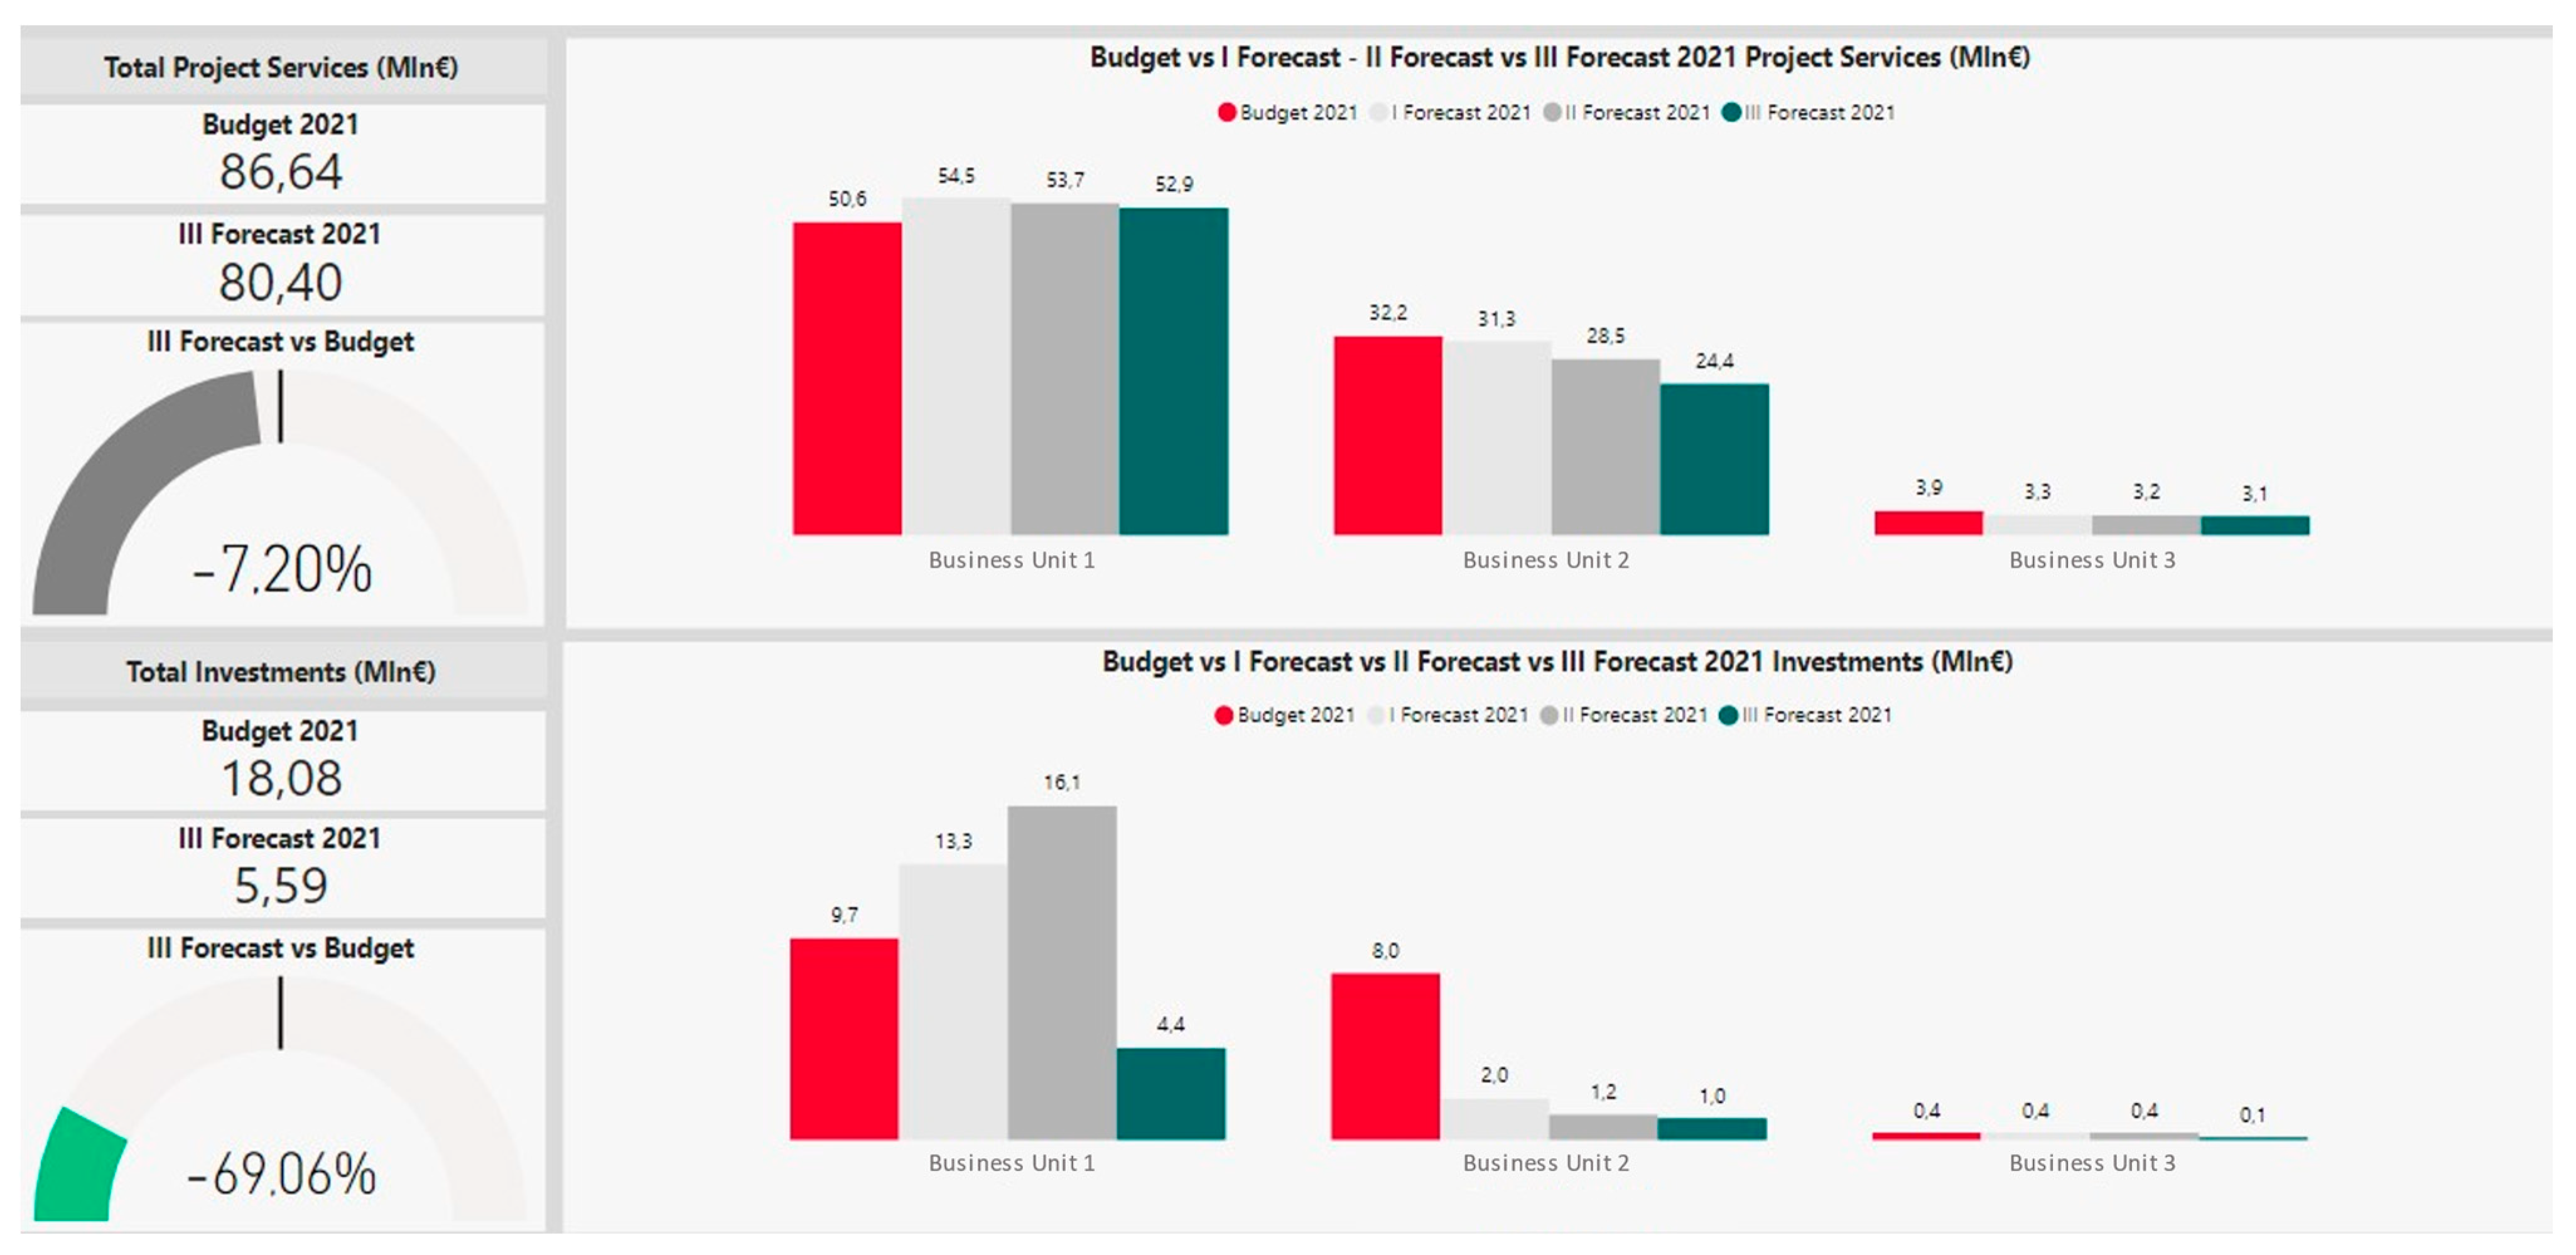
Another example of a possible BI dashboard referred to cost planning is presented in Figure 5. The different spending levels are justified by the diversity of portfolio management strategies in each business unit. This operational tendency is confirmed by research that compares IT investment in different industries by using the spending cost as a variable: high IT spending is linked to a technologically complex IT portfolio, such as the development of new products and CRM systems [68].

4. Discussion

Governance models have been previously described in literature, but case-study applications are still scarce [51]; requirements are only partial, and no IT tool is available [69]. On the contrary, the BI discussed in this manuscript and the related analytics were designed with the intention to allow identifying critical governance aspects as a function of specific KPIs. This BI solution spans all organizational levels; although it mainly relies on a comprehensive data gathering tool based on opensource software (Vtenext) used by front-line operators, its analytics are designed for top-level management to both encompass projects and benefit management [46,70]. The solution elicits data from multiple business units, which differ widely in terms of products, policies, and customers. The developed system is currently in use in the case-study company to ensure dynamic and reliable data analysis for executives and middle managers. A dedicated user interface for highlighting the most critical information has been suggested.
The possibility to drill down into the data and product portfolio reports increases the analytical capability and the understanding of targets and KPIs [47]. In the domain of a complex product portfolio, this solution represents a strategic tool to facilitate fast decision-making for new product development, with a short product lifecycle (which is relevant for any IT company). This reasoning is mainly pervasive for the governance of idea-to-launch processes [48] and high-risk environments [51]. The innovative support system allows all of the members of the organization to acknowledge project risks, while still respecting security, segregation, and privacy constraints.
The proposed methodology can be applied in different contexts, following these building steps: (i) starting from the model in Figure 2, the critical areas to monitor should be identified; (ii) the standard model should be then tailored to the specific company being considered in order to elicit the information needed (i.e., company strategic objectives, competitors, constraints, and organization needs); (iii) finally, KPIs should be adapted and extended, as needed.

5. Conclusions

In today’s highly competitive environment and fast-paced business world, the ability to transform data into useful information helps business leaders to make significant data-driven decisions. The presented work provided an approach to implement this observation through a BI system in the governance area of a technology company. The case-study adds to the current literature by demonstrating that a BI solution can support decision makers to make data-driven and faster decisions. Although the validation of this approach is beyond the scope of this work, the current paper aims to provide exemplary evidence on the possibility of linking governance to data-driven solutions. The case-study highlights the importance of standardized criteria for data structures, especially when dealing with projects of different natures. The results of this work call for the design of collaborative work environments and abandoning the siloed mentality regarding data. This paper promotes data sharing and continuous monitoring of performance, particularly in the governance area, to ensure company success. Similar BI solutions are expected to allow diverse statistical and sensitivity analyses, and include other data originating from the company context [33]. For this purpose, future development of this research can refer to a wider integration with other data sources from other areas (such as economics, contracting, asset management, and human resource management). In turn, this increasingly complex data structure will require more sophisticated algorithms, including machine learning solutions. In this manner, the BI solution may be used as a common approach for identifying future changes and further enhancing decision-making.
Further research is required to improve the methodology for designing and selecting the most representative KPIs for any given process, also encompassing quality monitoring logics [50]. From a descriptive perspective, the analysis may also include predictive governance that implements machine learning algorithms applied to the acquired data.
Additional investigations can be oriented towards visual analytics systems and tools. As it is documented in literature, BI is increasingly becoming a prominent technology for organizations operating in dynamic environments, and which seek to gain knowledge from heterogeneous sources and big data to support decision making [24].
Overall, research in this direction is expected to support decision-making at large, in light of uncertainties that characterize modern technological companies.

Author Contributions

Conceptualization, V.B. and G.D.G.; Methodology, V.B. and R.P.; Software, V.B.; Validation, R.P.; Formal analysis, V.B. and R.P.; Investigation, V.B.; Data curation, V.B.; Writing—original draft preparation, V.B.; Writing—review and editing, R.P. and G.D.G.; Visualization, R.P.; Supervision, G.D.G. and R.P.; Project administration, G.D.G.; Funding acquisition G.D.G. and R.P. All authors have read and agreed to the published version of the manuscript.

Funding

This research received no external funding.

Institutional Review Board Statement

Not applicable.

Informed Consent Statement

Not applicable.

Data Availability Statement

The data presented in this study are available within the article.

Conflicts of Interest

The authors declare no conflict of interest.

Notes

1
t is the budget year, p a t i t is the project referred to the a t   business unit, and the i t programme, where a t = 1 ,   . A t   is the business unit index, and i t = 1 ,   . I t   is the program index, r.
2
t is the budget year, p a t c t is the project referred to the a t   business unit, and the c t client, where a t = 1 ,   . A t   is the business unit index, and c t = 1 ,   . C t   is the client index.

References

  1. Rajeshkumar, V.; Anandaraj, S.; Kavinkumar, V.; Elango, K.S. Analysis of factors influencing formwork material selection in construction buildings. Mater. Today Proc. 2020. [Google Scholar] [CrossRef]
  2. Pajić, A.; Pantelić, O.; Stanojević, B.; Pajić, A.; Pantelić, O.; Stanojević, B. Representing IT Performance Management as Metamodel. Int. J. Comput. Commun. Control ISSN 2014, 9, 758–767. [Google Scholar] [CrossRef] [Green Version]
  3. Sirisomboonsuk, P.; Gu, V.C.; Cao, R.Q.; Burns, J.R. Relationships between project governance and information technology governance and their impact on project performance. Int. J. Proj. Manag. 2018, 36, 287–300. [Google Scholar] [CrossRef]
  4. Erasmus, W.; Marnewick, C. An IT governance framework for IS portfolio management. Int. J. Manag. Proj. Bus. 2020, 14, 721–742. [Google Scholar] [CrossRef]
  5. Yigitbasioglu, O.M. Drivers of management accounting adaptability: The agility lens. J. Account. Organ. Chang. 2017, 13, 262–281. [Google Scholar] [CrossRef]
  6. Otley, D. Management control and performance management: Whence and whither? Br. Account. Rev. 2003, 35, 309–326. [Google Scholar] [CrossRef]
  7. Hope, J.; Fraser, R. New Ways of Setting Rewards: The beyond Bugeting Model; California Management Review: Berkeley, CA, USA, 2003. [Google Scholar]
  8. Nardo, M.; Saisana, M.; Saltelli, A.; Tarantola, S. Tools for Composite Indicators Building; European Commission: Ispra, Italy, 2005. [Google Scholar]
  9. Alaeddini, M.; Hashemi, S.A. Evaluating the Performance of IT Governance in Service-Oriented Enterprises. Lect. Notes Inf. Syst. Organ. 2019, 30, 323–333. [Google Scholar] [CrossRef]
  10. Harbour, J.L. The Performance Mapping and Measurement Handbook; CRC Press by Taylor & Francis Group: New York, NY, USA, 2013. [Google Scholar]
  11. Simonsson, M. Perdicting IT Governance Performance: A Method for Model-Based Decision Making. Ph.D. Thesis, KTH, Stockholm, Sweden, 2008. [Google Scholar]
  12. Weill, P.D.; Ross, J.W. IT Governance: How Top Performers Manage IT Decision Rights for Superior Results. Int. J. Electron. Gov. Res. 2004, 69–83. [Google Scholar] [CrossRef]
  13. Harbour, J.L. The Performance Paradox: Understanding the Real Drivers That Critically Affect Outcomes; CRC Press: Boca Raton, FL, USA, 2009; ISBN 9781563273902. [Google Scholar]
  14. Yüksel, I.; Daǧdeviren, M. Using the fuzzy analytic network process (ANP) for Balanced Scorecard (BSC): A case study for a manufacturing firm. Expert Syst. Appl. 2010, 37, 1270–1278. [Google Scholar] [CrossRef]
  15. Franceschini, F.; Galetto, M.; Maiasano, D. Management by Measurement; Springer Science & Business Media: Berlin/Heidelberg, Germany, 2007. [Google Scholar]
  16. Varela, D.; Benedetto, G.; Sanchez-Santos, J.M. Editorial statement: Lessons from goodhart’s law for the management of the journal. Eur. J. Gov. Econ. 2014, 3, 100–103. [Google Scholar] [CrossRef] [Green Version]
  17. Campbell, D.T. Assessing the impact of planned social change. Eval. Program Plann. 1979, 2, 67–90. [Google Scholar] [CrossRef]
  18. Chrystal, A.; Mizen, P. Goodhart’s law: Its origins, meaning and implications for monetary policy. Cent. Bank. Monet. Theory Pract. Essays Honour Charles Goodhart 2003, 1, 221–243. [Google Scholar] [CrossRef] [Green Version]
  19. Goodhart, C.A.E. Problems of Monetary Management: The UK Experience. Monet. Theory Pract. 1984, 91–121. [Google Scholar] [CrossRef]
  20. Muller, J.Z. The perils of metric fixation. Med. Teach. 2020. [Google Scholar] [CrossRef]
  21. Aydiner, A.S.; Tatoglu, E.; Bayraktar, E.; Zaim, S.; Delen, D. Business analytics and firm performance: The mediating role of business process performance. J. Bus. Res. 2019, 96, 228–237. [Google Scholar] [CrossRef]
  22. Cosic, R.; Shanks, G.; Maynard, S. Towards a business analytics capability maturity model. In Proceedings of the ACIS 2012: 23rd Australasian Conference on Information Systems, Geelong, Australia, 3–5 December 2012. [Google Scholar]
  23. Killen, C.P.; Geraldi, J.; Kock, A. The role of decision makers’ use of visualizations in project portfolio decision making. Int. J. Proj. Manag. 2020, 38, 267–277. [Google Scholar] [CrossRef]
  24. Daradkeh, M.K. Determinants of visual analytics adoption in organizations: Knowledge discovery through content analysis of online evaluation reviews. Inf. Technol. People 2019, 32, 668–695. [Google Scholar] [CrossRef]
  25. Hannila, H.; Silvola, R.; Harkonen, J.; Haapasalo, H. Data-driven Begins with DATA; Potential of Data Assets. J. Comput. Inf. Syst. 2019, 1–10. [Google Scholar] [CrossRef]
  26. da Silva, C.G.; Meidanis, J.; Moura, A.V.; Souza, M.A.; Viadanna, P.; de Oliveira, M.R.; de Oliveira, M.R.; Jardim, L.H.; Costa Lima, G.A.; de Barros, R.S.V. An improved visualization-based approach for project portfolio selection. Comput. Hum. Behav. 2017, 73, 685–696. [Google Scholar] [CrossRef]
  27. Santiago Rivera, D.; Shanks, G. A Dashboard to Support Management of Business Analytics Capabilities. J. Decis. Syst. 2015, 24, 73–86. [Google Scholar] [CrossRef]
  28. Archetti, F.; Giordani, I.; Candelieri, A. Data science and environmental management in smart cities. Environ. Eng. Manag. J. 2015, 14, 2095–2102. [Google Scholar] [CrossRef]
  29. Wixom, B.; Watson, H. The BI-Based Organization. Int. J. Bus. Intell. Res. 2010, 1, 13–28. [Google Scholar] [CrossRef]
  30. Shanks, G.; Bekmamedova, N. Achieving benefits with business analytics systems: An evolutionary process perspective. J. Decis. Syst. 2012, 21, 231–244. [Google Scholar] [CrossRef]
  31. Patriarca, R.; Cioponea, R.; Di Gravio, G.; Licu, A. Managing Safety Data: The TOKAI Experience for the Air Navigation Service Providers. Transp. Res. Procedia 2018, 35, 148–157. [Google Scholar] [CrossRef]
  32. Nakhal, A.J.; Patriarca, R.; Di Gravio, G.; Antonioni, G.; Paltrinieri, N. Investigating occupational and operational industrial safety data through Business Intelligence and Machine Learning. J. Loss Prev. Process Ind. 2021, 73, 104608. [Google Scholar] [CrossRef]
  33. Jebraeily, M.; Valizade Hasanloei, M.A.; Rahimi, B.; Saeidi, S. Design of a Management Dashboard for the Intensive Care Unit: Determining Key Performance Indicators and their Required Capabilities. Appl. Med. Inform. 2019, 41, 111–121. [Google Scholar]
  34. Harkonen, J.; Mustonen, E.; Koskinen, J.; Hannila, H. Digitizing Company Analytics—Digitalization Concept for Valuable Insights. In Proceedings of the 2020 IEEE International Conference on Industrial Engineering and Engineering Management (IEEM), Singapore, 14–17 December 2020; pp. 1012–1016. [Google Scholar]
  35. Patriarca, R.; Di Gravio, G.; Cioponea, R.; Licu, A. Safety intelligence: Incremental proactive risk management for holistic aviation safety performance. Saf. Sci. 2019, 118, 551–567. [Google Scholar] [CrossRef]
  36. Muryjas, P.; Wawer, M. Business intelligence as a support in human resources strategies realization in contemporary organizations. Actual Probl. Econ. 2014, 152, 183–190. [Google Scholar]
  37. Lenz, J.; Wuest, T.; Westkämper, E. Holistic approach to machine tool data analytics. J. Manuf. Syst. 2018, 48, 180–191. [Google Scholar] [CrossRef]
  38. Eckartz, S.M.; Hofman, W.J.; Fleur, A.; Veenstra, V. LNCS 8653—A Decision Model for Data Sharing; Springer: Berlin/Heidelberg, Germany, 2014; Volume 8653. [Google Scholar]
  39. Visser, W.F. A Blueprint for Performance-Driven Operations Management. Mining, Metall. Explor. 2020, 37, 823–831. [Google Scholar] [CrossRef]
  40. Hofman, M.; Grela, G. Project portfolio risk categorization—Factor analysis results. Int. J. Inf. Syst. Proj. Manag. 2018, 6, 39–58. [Google Scholar] [CrossRef]
  41. Control, P.P.; Performance, P.M.; Contexts, D. Project Portfolio Control and Portfolio. Proj. Manag. J. 2008, 39, 28–42. [Google Scholar] [CrossRef]
  42. Silva, S.; Fernandes, G.; Lima, A.; Machado, R.J. IT Project Management Tool Requirements to Support Collaborative University-Industry R&D. In Proceedings of the 2018 International Conference on Intelligent Systems, Phuket, Thailand, 17–19 November 2018; pp. 917–925. [Google Scholar]
  43. Herrera-Reyes, A.T.; De los Ríos Carmenado, I.; Martínez-Almela, J. Project-based governance framework for an agri-food cooperative. Sustainability 2018, 10, 1881. [Google Scholar] [CrossRef] [Green Version]
  44. Brunet, M.; Aubry, M. The three dimensions of a governance framework for major public projects. Int. J. Proj. Manag. 2016, 34, 1596–1607. [Google Scholar] [CrossRef]
  45. Volden, G.H. Public project success as seen in a broad perspective: Lessons from a meta-evaluation of 20 infrastructure projects in Norway. Eval. Program Plann. 2018, 69, 109–117. [Google Scholar] [CrossRef] [PubMed]
  46. Badewi, A. The impact of project management (PM) and benefits management (BM) practices on project success: Towards developing a project benefits governance framework. Int. J. Proj. Manag. 2016, 34, 761–778. [Google Scholar] [CrossRef]
  47. Tolonen, A.; Shahmarichatghieh, M.; Harkonen, J.; Haapasalo, H. Product portfolio management—Targets and key performance indicators for product portfolio renewal over life cycle. Int. J. Prod. Econ. 2015, 170, 468–477. [Google Scholar] [CrossRef] [Green Version]
  48. Baker, M.; Bourne, M. A governance framework for the idea-to-launch process: Development and application of a governance framework for new product development. Res. Technol. Manag. 2014, 57, 42–48. [Google Scholar] [CrossRef]
  49. Tabi, M.T.; Verdon, D. New public service performance management tools and public water governance: The main lessons drawn from action research conducted in an urban environment1. Int. Rev. Adm. Sci. 2014, 80, 213–235. [Google Scholar] [CrossRef]
  50. Mainz, J.; Kristensen, S.; Bartels, P. Quality improvement and accountability in the Danish health care system. Int. J. Qual. Heal. Care 2015, 27, 523–527. [Google Scholar] [CrossRef] [Green Version]
  51. Mutamimah. Financial Technology and E-Corporate Governance Model for Small Medium Enterprises; Springer International Publishing: Berlin/Heidelberg, Germany, 2020; Volume 993, ISBN 9783030223533. [Google Scholar]
  52. Bank, M. Using Business Intelligence Capabilities to Improve the Quality of Decision-Making: A Case Study of Mellat Bank. Int. J. Econ. Manag. Eng. 2019, 13, 147–158. [Google Scholar]
  53. Cavalli, L. Conoscenza e Gestione. Come Valorizzare il Patrimonio Conoscitivo Aziendale; Ledizioni: Milan, Italy, 2008. [Google Scholar]
  54. Genero, M.; Poels, G.; Piattini, M. Defining and validating metrics for assessing the understandability of entity-relationship diagrams. Data Knowl. Eng. 2008, 64, 534–557. [Google Scholar] [CrossRef]
  55. Riis, E.; Hellström, M.M.; Wikström, K. Governance of Projects: Generating value by linking projects with their permanent organisation. Int. J. Proj. Manag. 2019, 37, 652–667. [Google Scholar] [CrossRef]
  56. ul Musawir, A.; Serra, C.E.M.; Zwikael, O.; Ali, I. Project governance, benefit management, and project success: Towards a framework for supporting organizational strategy implementation. Int. J. Proj. Manag. 2017, 35, 1658–1672. [Google Scholar] [CrossRef]
  57. ul Musawir, A.; Abd-Karim, S.B.; Mohd-Danuri, M.S. Project governance and its role in enabling organizational strategy implementation: A systematic literature review. Int. J. Proj. Manag. 2020, 38, 1–16. [Google Scholar] [CrossRef]
  58. Dedić, N.; Stanier, C. An evaluation of the challenges of multilingualism in data warehouse development. In Proceedings of the ICEIS 2016—18th International Conference on Enterprise Information Systems, Rome, Italy, 25–28 April 2016; Volume 1, pp. 196–206. [Google Scholar]
  59. Haizan, R.N.; Alinda, R.; Haizan, R.N.; Alinda, R. The Development of KPI for Measuring ICT Support Service Quality. In Proceedings of the International Conference on Information Systems, Milano, Italy, 15–18 December 2013; pp. 43–48. [Google Scholar]
  60. Kotarba, M. Measuring Digitalization-Key Metrics. Found. Manag. 2017, 9, 123–138. [Google Scholar] [CrossRef] [Green Version]
  61. Duarte, R.; Deschamps, F.; de Lima, E.P.; Pepino, A.; Clavijo, R.M.G. Performance management systems for project management offices: A case-based study. Procedia Manuf. 2019, 39, 923–931. [Google Scholar] [CrossRef]
  62. IT Key Metrics Data 2020: Industry Measures—Executive Summary; Gartner Research: Stamford, CT, USA, 2020; pp. 1–46.
  63. IT Key Metrics Data 2021: IT Security Measures—Analysis; Gartner Research: Stamford, CT, USA, 2021.
  64. Parmenter, D. Key Performance Indicators Developing, Implementing, and Using Winning KPIs; John Wiley & Sons: Hoboken, NJ, USA, 2020. [Google Scholar]
  65. Kaganski, S.; Majak, J.; Karjust, K.; Toompalu, S. Implementation of Key Performance Indicators Selection Model as Part of the Enterprise Analysis Model. Procedia CIRP 2017, 63, 283–288. [Google Scholar] [CrossRef]
  66. Marcondes, G.A.B.; Leme, R.C.; Carvalho, M.M. Framework for Integrated Project Portfolio Selection and Adjustment. IEEE Trans. Eng. Manag. 2019, 66, 677–688. [Google Scholar] [CrossRef]
  67. Lohman, C.; Fortuin, L.; Wouters, M. Designing a performance measurement system: A case study. Eur. J. Oper. Res. 2004, 156, 267–286. [Google Scholar] [CrossRef]
  68. Neirotti, P.; Pesce, D. ICT-based innovation and its competitive outcome: The role of information intensity. Eur. J. Innov. Manag. 2019, 22, 383–404. [Google Scholar] [CrossRef]
  69. Volden, G.H. Assessing public projects’ value for money: An empirical study of the usefulness of cost-benefit analyses in decision-making. Proj. Manag. J. 2018, 917–925. [Google Scholar] [CrossRef]
  70. Badewi, A.; Shehab, E. The impact of organizational project benefits management governance on ERP project success: Neo-institutional theory perspective. Int. J. Proj. Manag. 2016, 34, 412–428. [Google Scholar] [CrossRef]
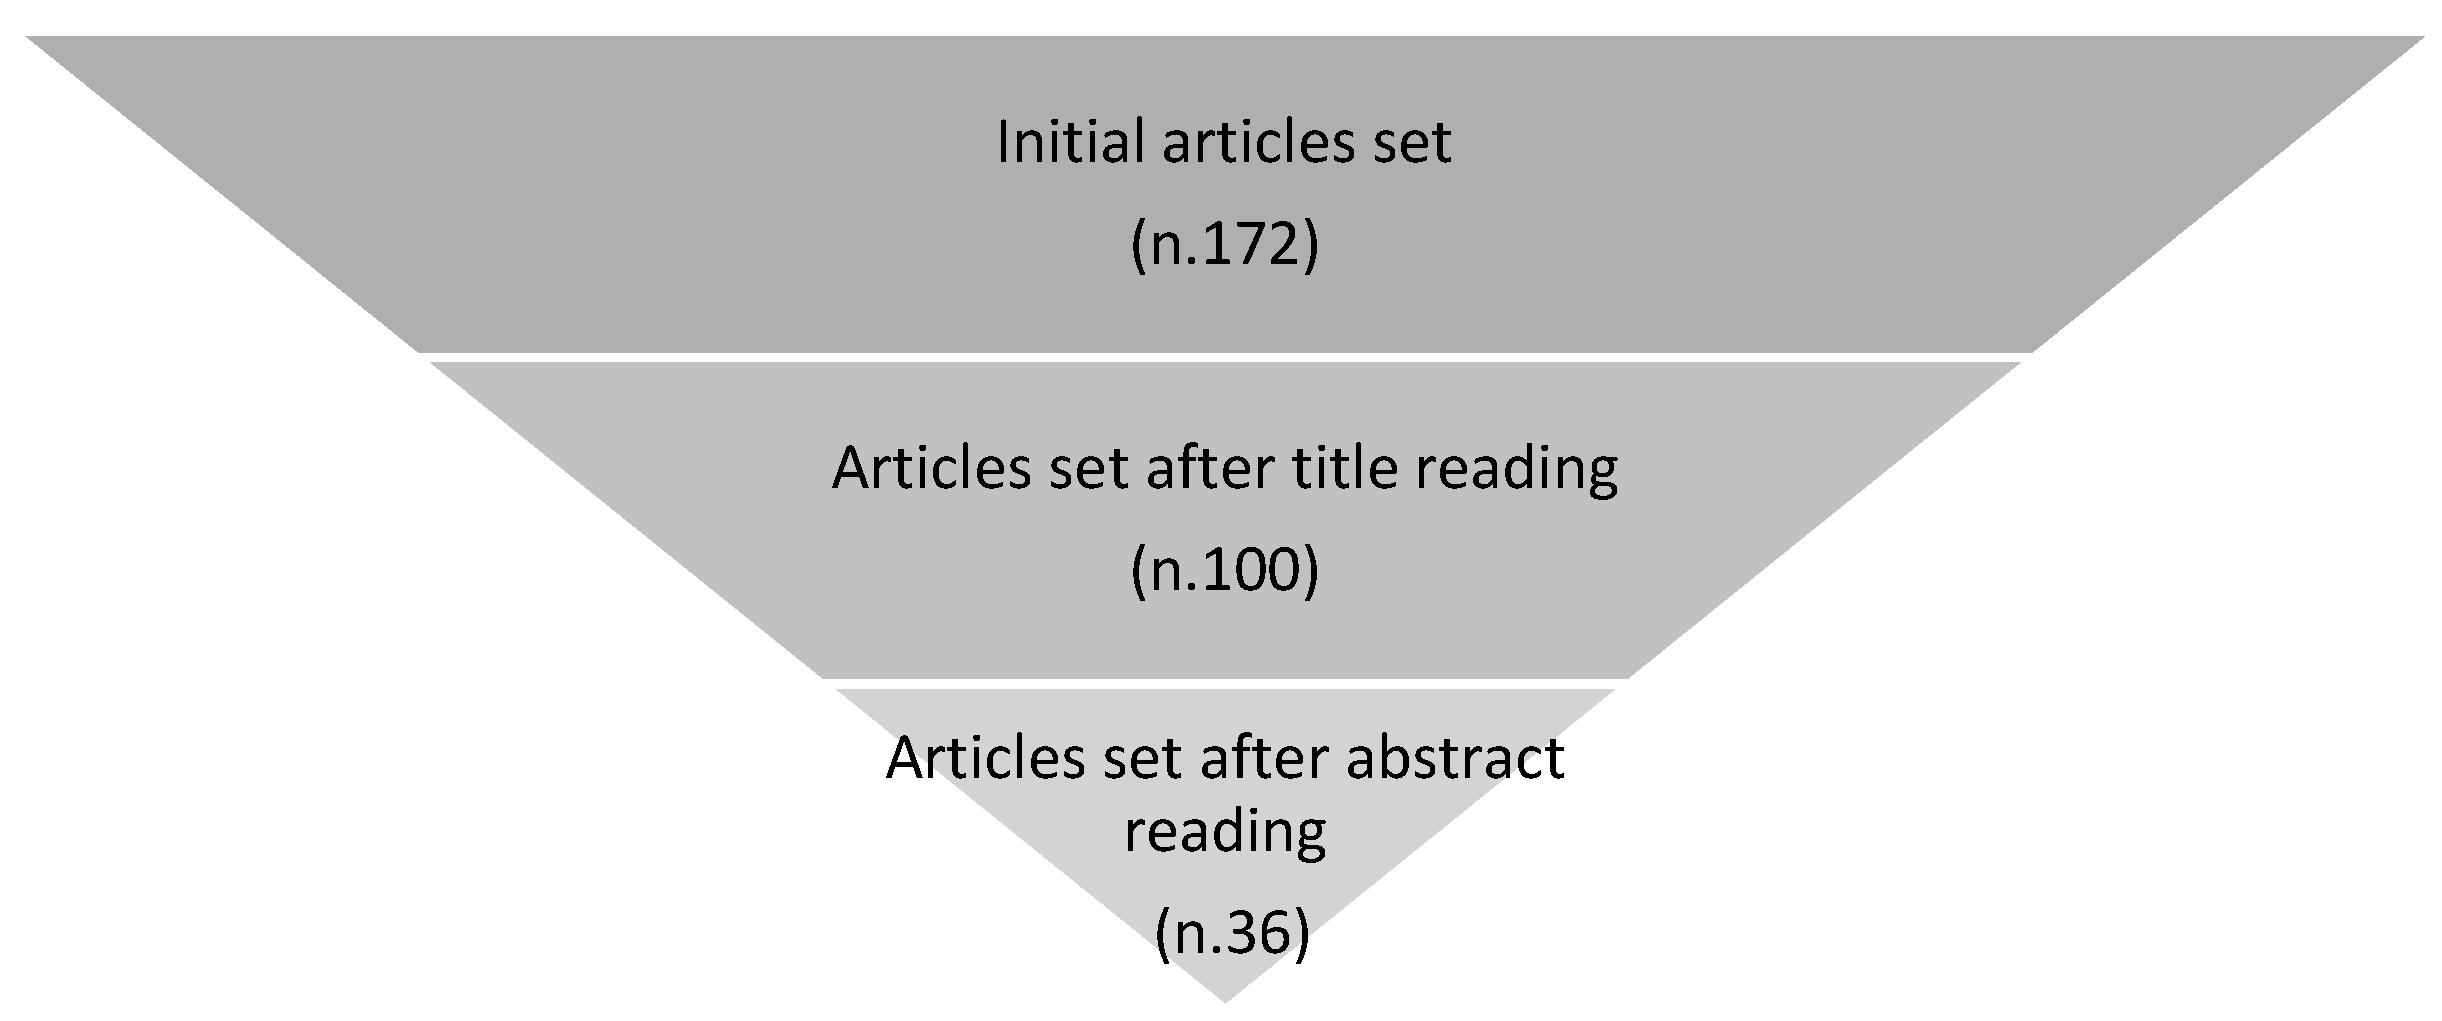
Figure 1. Overview of the screening process.
Data 07 00002 g001
Figure 2. Key elements of a governance BI model. The red rectangle represents the target structure of the model, while the rectangles in blue the areas influencing the final structure and the arrows show the elements’ relationships.
Data 07 00002 g002
Figure 3. Entity–Relation diagram for project portfolio management as part of the wider governance model. In this schema the entities are represented by rectangles; the optional relationships are depicted as dashed arrows and the mandatory ones by continuous arrows; the cardinality is shown by means of the following symbols: (1, N) … (N, M). The “pipeline” area highlights the needs (e.g., the necessity of a new system or an existing system/application enhancement) not yet approved; while the “budget” area refers to the approved initiatives. After a new request approval, the projects’ technical and economic monitoring starts. At the “additional information” stage, the information is collected when a new request comes in and after the project closure, i.e., at the end of the process to update the application’ information.
Data 07 00002 g003
Figure 4. Project plan. The figure on the left highlights the number of projects per status (“Running”, “Not Started”, “Suspended”, and “Closed”), whereas the area charts on the right show the trend over time of projects per starting year and closing year (quantitative data were manipulated in order not to reveal the intellectual property of the units involved).
Data 07 00002 g004
Figure 5. Project spending plan. These graphs show the deviation of forecast cost (I, II, and III as per their individual spending during each project’s lifecycle) versus budget (quantitative data were manipulated and the business unit de-identified in order not to reveal the intellectual property of the units involved).
Data 07 00002 g005
Table 1. Search keys used for the literature review.
Key(“Governance Framework” OR “Governance Model”) AND (“Contract Management “OR “Project Management” OR “Risk Management” OR “Performance Management” OR “Performance Monitoring”)
DatabaseScopus
LanguageEnglish
Year Of Publication>2007
Subject AreaAny
Table 2. Main results of the initial search and after screening.
Governance AreaNumber of Articles
(Initial Search)
Number of Analyzed Articles
(after Screening)
Project Management5116
Contract Management10
Risk Management9311
Performance Management238
Performance Monitoring41
Table 3. KPI mapping (excerpt for ICT Strategy & Governance, Program & Portfolio Management).
KPI DimensionKPI Sub-DimensionKPI 1.1KPI 1.2
ContextMain Investigated AreaICT Strategy & GovernanceICT Strategy & Governance
Sub Area/ProcessProgram & Project Portfolio ManagementProgram & Project Portfolio Management
KPINumbers of programs in a business unitNumbers of projects in a business unit per client
Typology-Lagging indicatorsLagging indicators
Description-This indicator counts the number of projects in each program in a business unit and the planned budget of the current year.Number of projects in each business unit per client
ObjectivesControl NeedTo which Cluster do the initiatives belong within a business unit?How is the Projects Portfolio of the company composed?
Elicitation
Method
Formula1 K P I   ( t ) = a t A t i t I t p a t i t ( t ) 2 K P I   ( t ) = a t A t c t C t p a t c t ( t )
ViewDashboardDashboard
SourceBusiness unitBusiness unit
Frequency of detection-Four times per yearFour times per year
Benefit-These indicators allow identification of possible synergies between different business unitsThis indicator allows mapping the business unit capacity per client
Target Value-X, depending on business unitX, depending on business unit
Publisher’s Note: MDPI stays neutral with regard to jurisdictional claims in published maps and institutional affiliations.