
Country-Specific Interests towards Fall Detection from 2004–2021: An Open Access Dataset and Research Questions


Abstract
:1. Background
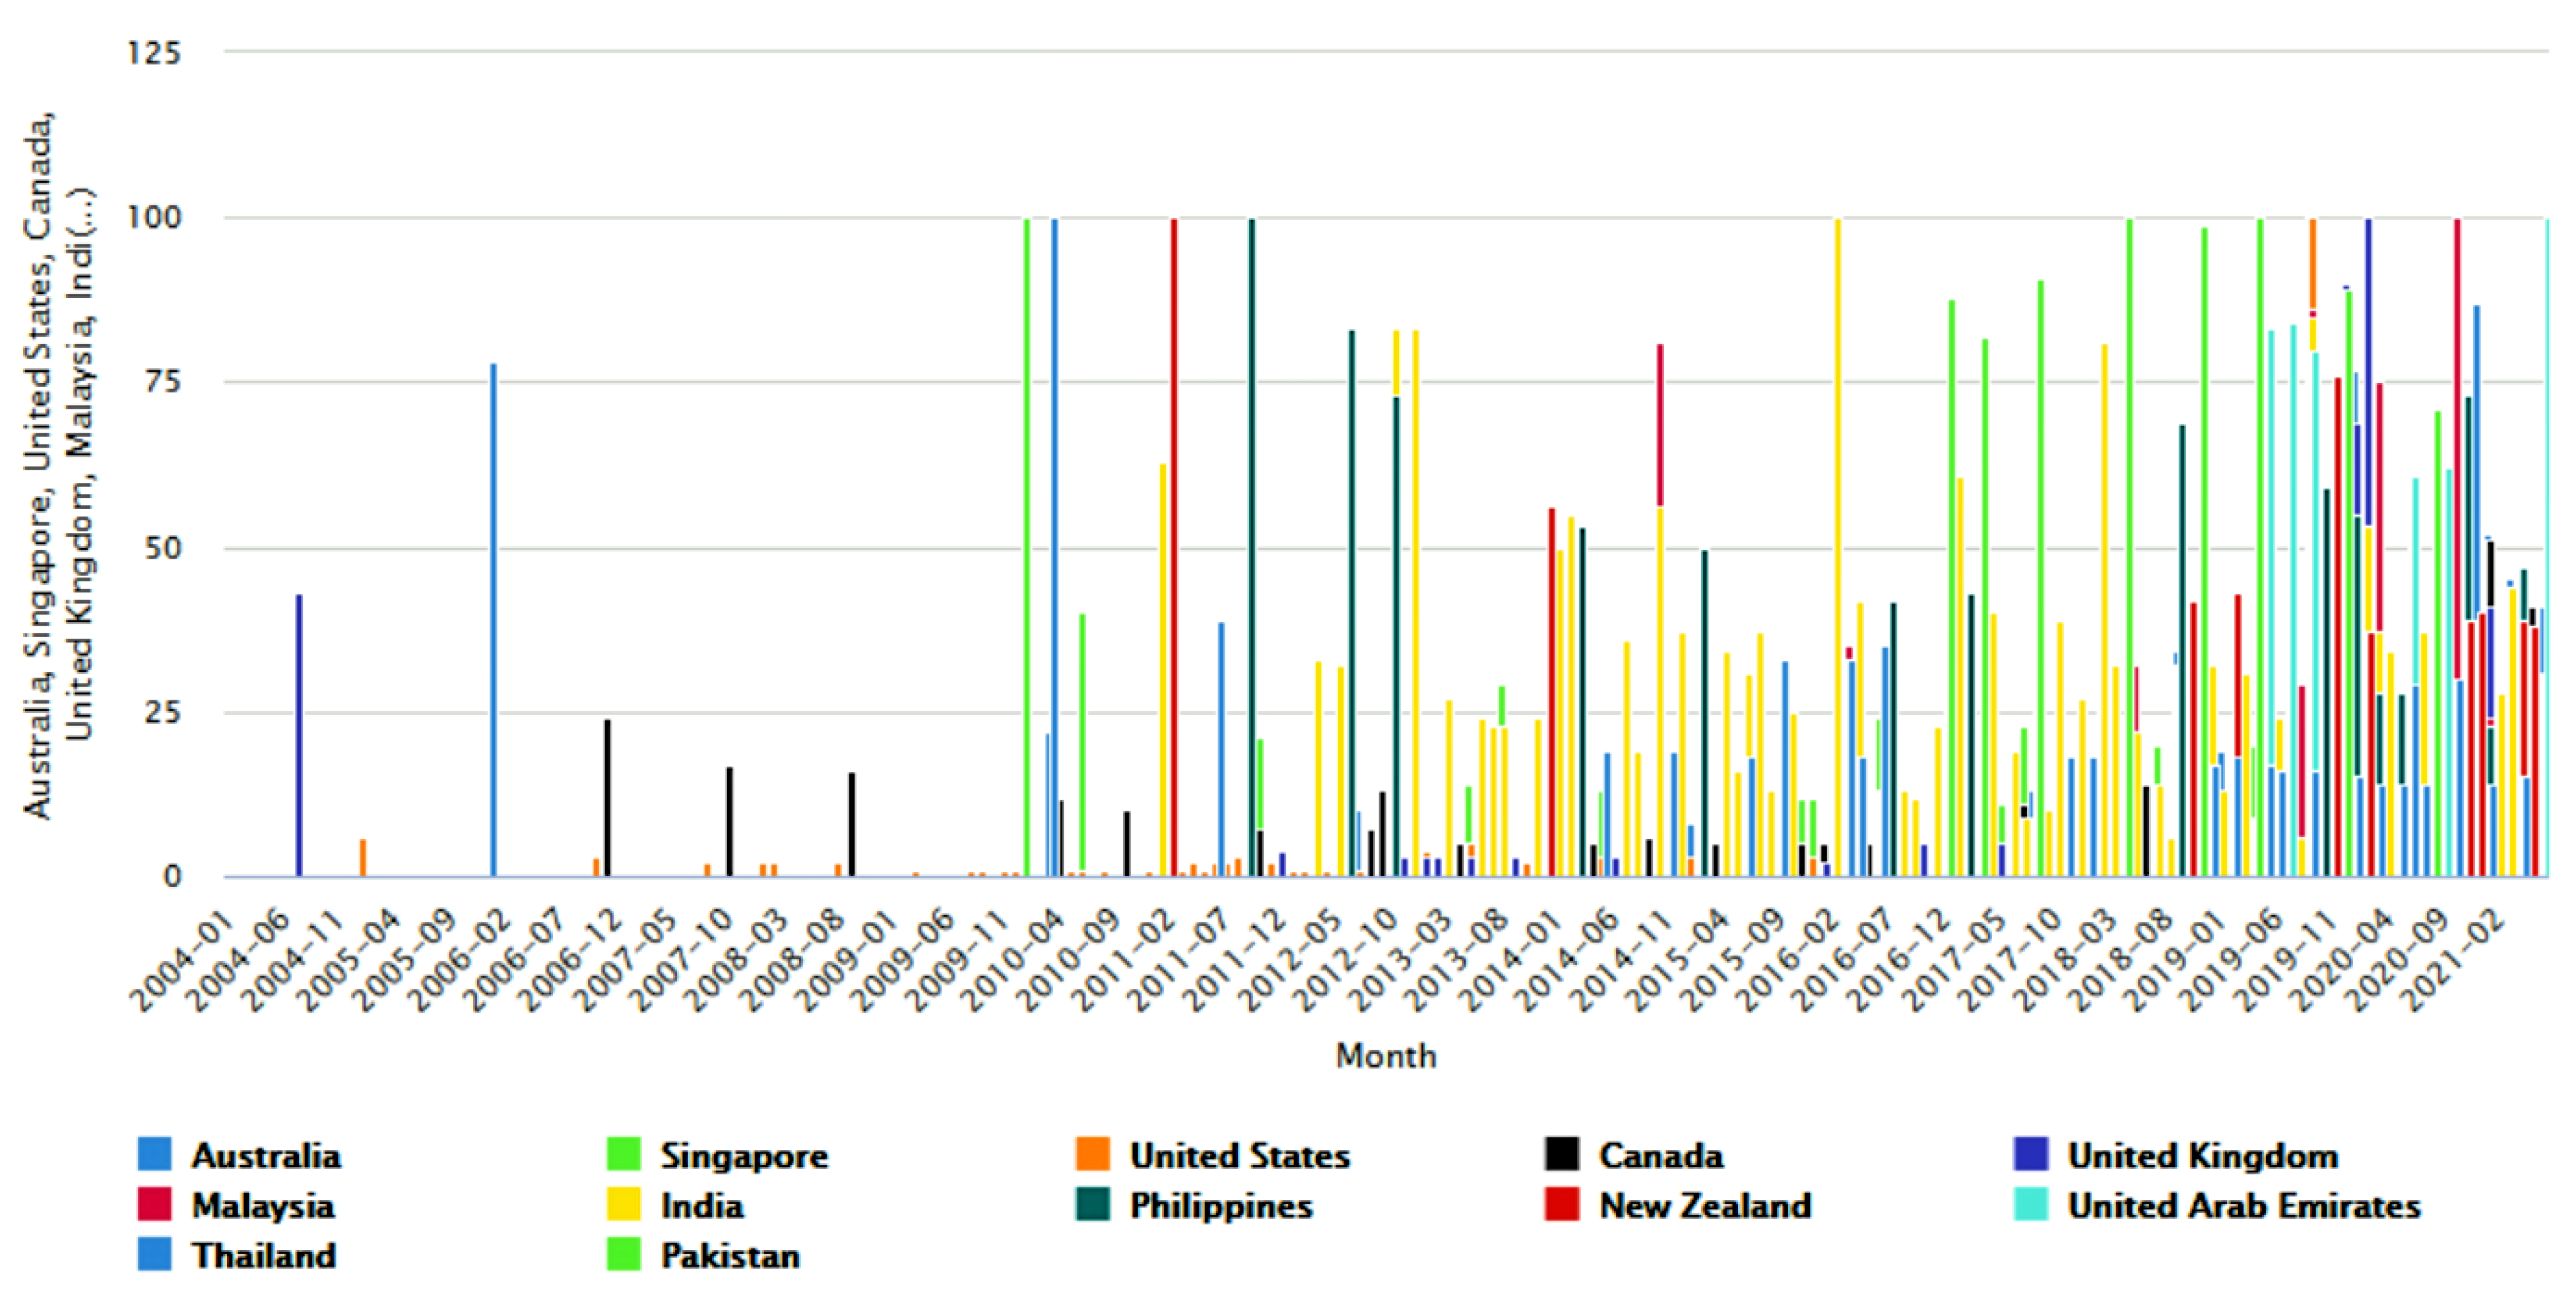
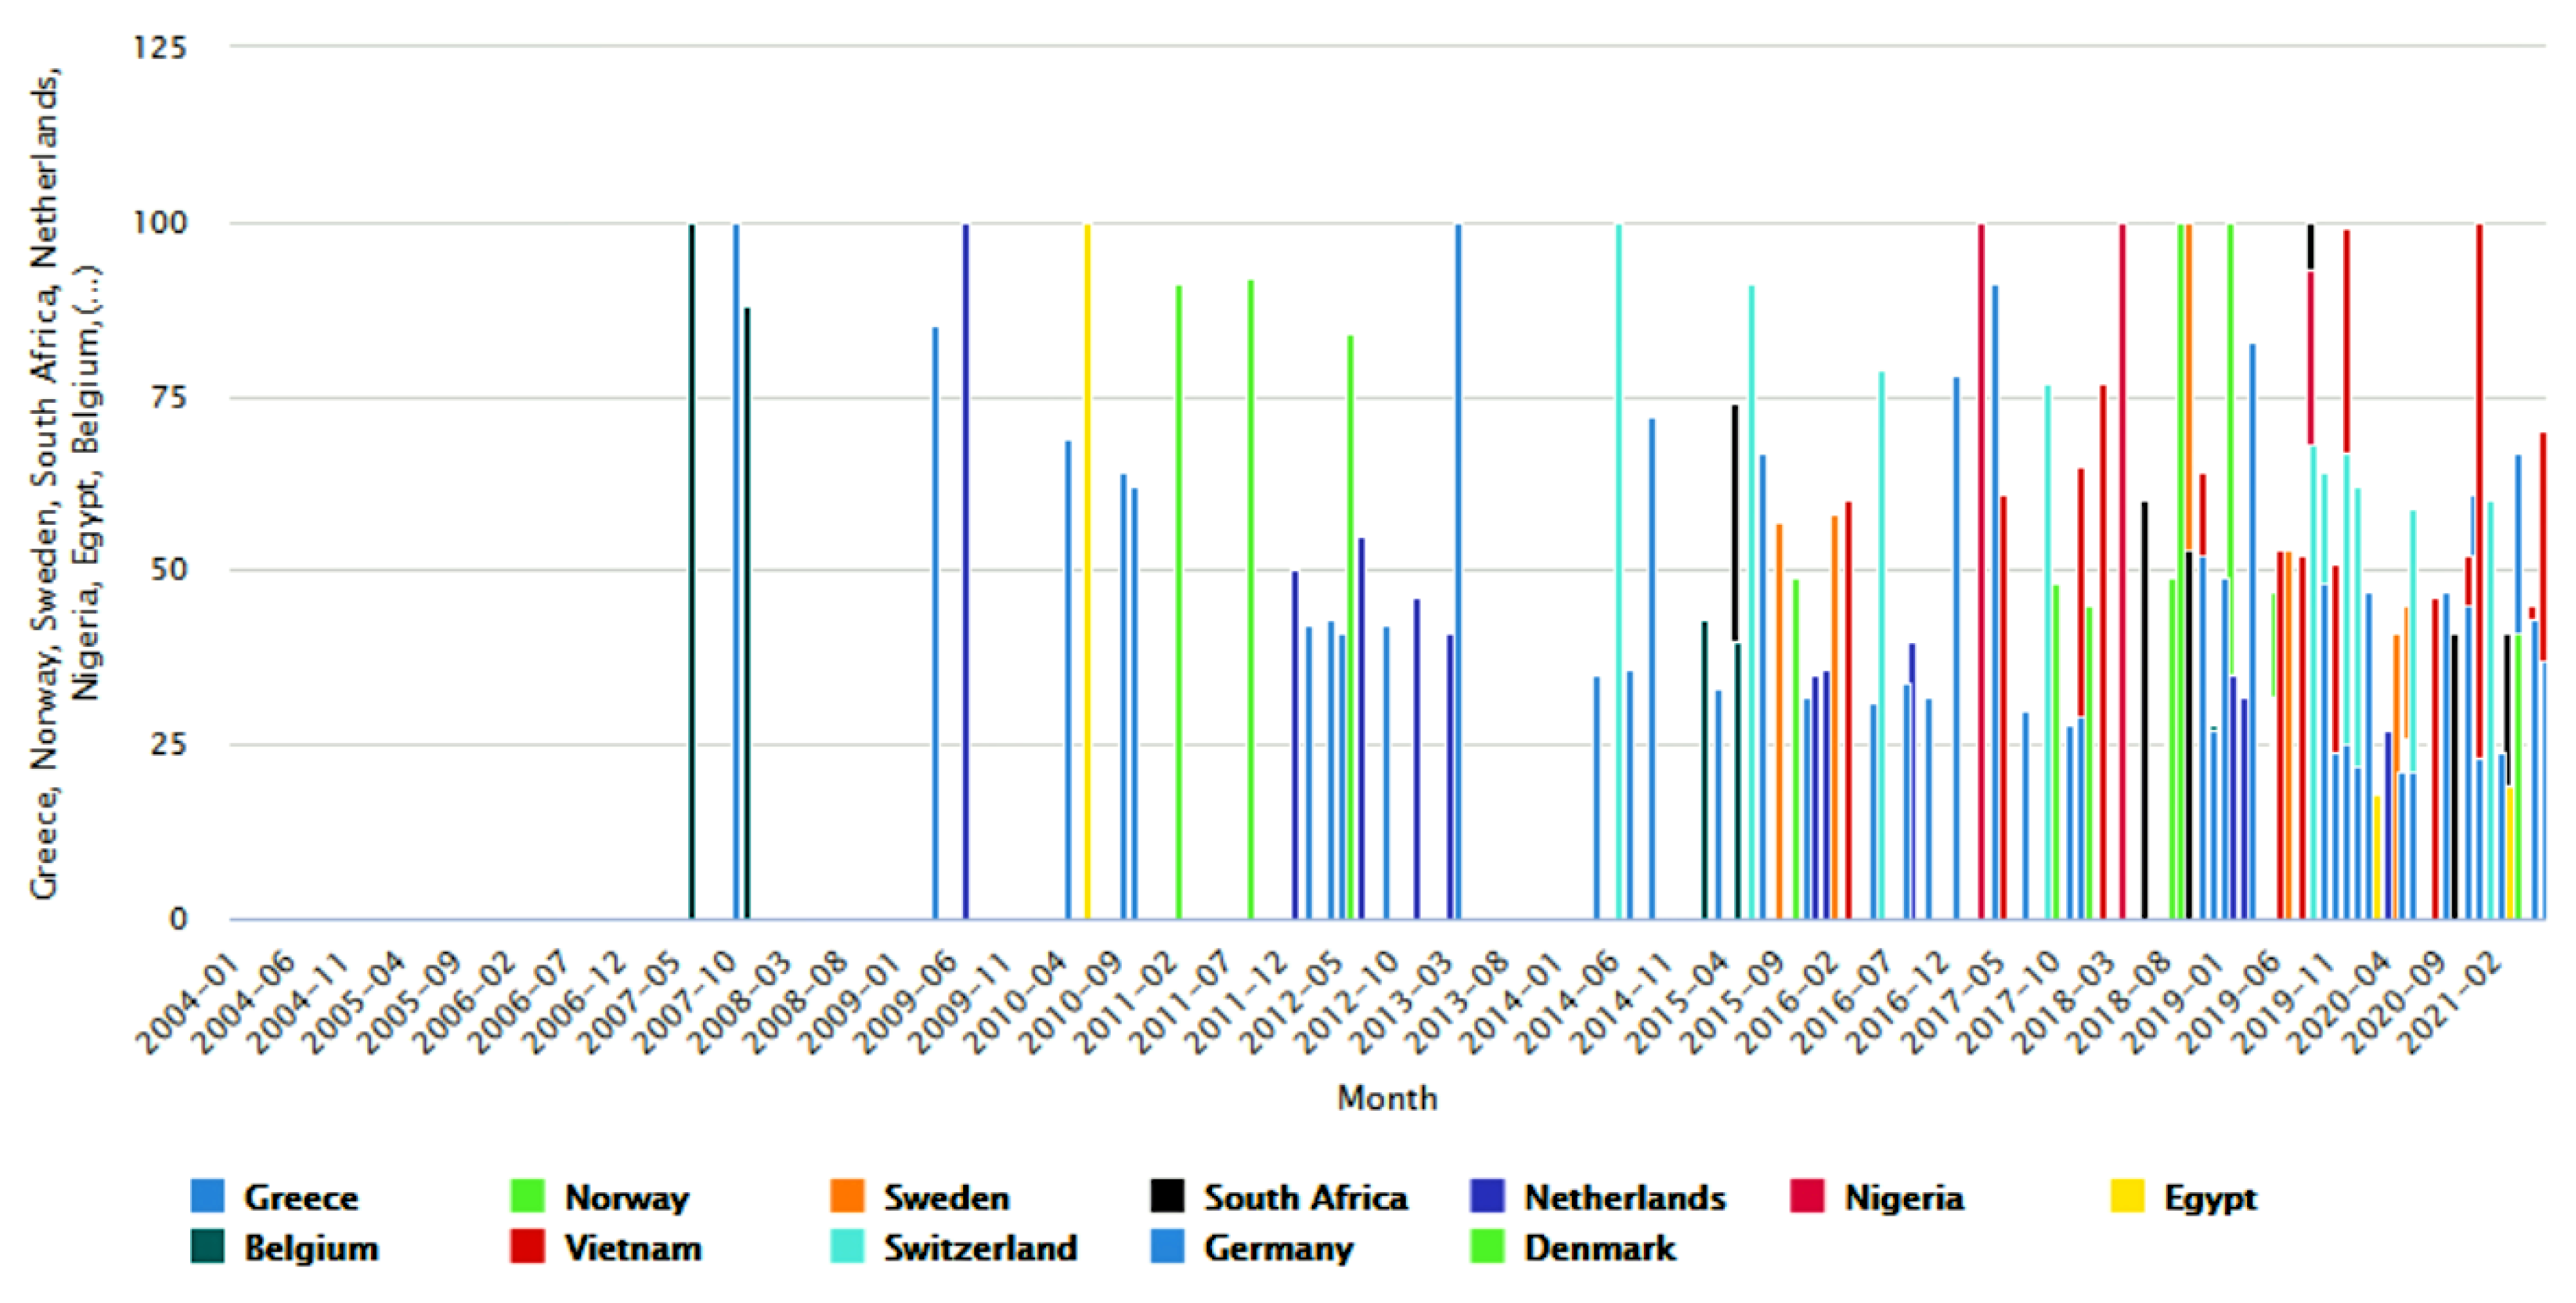
2. Data Description and Analysis
- i.
- Searches made by very few people: Trends only show data for popular terms, so search terms with low volume appear as “0”.
- ii.
- Duplicate searches: Trends eliminates repeated searches from the same person over a short period of time.
- iii.
- Special characters: Trends filters out queries with apostrophes and other special characters.
- i.
- It divides each data point by the total searches of the geography and time range it represents to compare relative popularity.
- ii.
- If the division cannot be performed due to insufficient data, places with greater search volumes are ranked higher.
- iii.
- It scales the resulting numbers on a range of 0 to 100 depending on the ratio of searches related to the topic under consideration as compared to the searches related to all other topics.
- iv.
- The search interest for two or more regions might not always reflect the total volume of searches coming from those regions.
3. Research Methods
4. Potential Applications
- RQ1.
- Is the rising interest in fall detection in any geographic region an indicator of the increase in falls in elderly people in that region?
- RQ2.
- Does the increasing trend in fall detection in a country have a positive correlation with its healthcare-related and medical expenses (hospitalizations, emergency treatments, caregivers, etc.) due to elderly falls [115]?
- RQ3.
- Is the interest in fall detection in a nation directly proportional to the fatalities related to falls in that nation?
- RQ4.
- Does the increasing trend in fall detection from a country represent more advances in research and development related to fall detection in that country?
- RQ5.
- Is the interest in fall detection directly proportional to the success or failure of fall detection-related awareness and prevention programs as well as initiatives by different geographic regions of the world?
- RQ6.
- Does the increasing trend in fall detection in a country reflect an increase in sales of fall detection systems, applications, and gadgets manufactured in that country?
- RQ7.
- Can the increase in interest related to fall detection be interpreted as an increase in the market potential of fall detection solutions both at a global and country-specific level?
- RQ8.
- Do the varying trends related to fall detection in a geographic region have any positive or negative correlation with the user acceptance and trust of existing fall detection-related solutions available in that region?
- RQ9.
- Is the increasing trend in fall detection from a specific geographic region an indicator of the increase in scientific and research inquiry and investigation (such as publications in the form of patents, papers, etc.) related to fall detection from that region?
- RQ10.
- Can the patterns in the trends of user interests related to fall detection be used to train a machine learning model to forecast any short-term or long-term changes in these trends?
- RQ11.
- Is there a correlation between the dynamic changes in trends in fall detection at a specific region and the social sentiment [116] related to fall detection technologies in that region?
- RQ12.
- Does the increasing trend in fall detection in a region indicate an increase in the number of elderly affected by Alzheimer’s and/or user interests towards Alzheimer’s in that region, as falls may be an early indicator of Alzheimer’s [117]?
- RQ13.
- As falls are an early sign of Parkinson’s disease [118], whether an increase in trends of falls in a region indicate an increase in Parkinson’s disease in the elderly and/or user interests towards Parkinson’s in that geographic region?
- RQ14.
- Is there any association between the strict to moderate stay-at-home guidelines on account of COVID-19 [119] in a specific region with user interests related to fall detection originating from that region?
- RQ15.
- Is there any positive correlation between the trends of falls in the elderly and loneliness in the elderly [120] at a specific time in a certain region, and can the study of one of these trends be helpful to predict the trends in the other?
- RQ16.
- Studies have shown that falls have an association with high-risk medication use [121], chronic diseases [122], lower urinary tract symptoms [123], schizophrenia [124], depression [125], visual impairment [126], anxiety [127], sarcopenic obesity [128], and cardiovascular diseases [129] in the elderly. Can the trends and patterns in fall detection in a specific geographic region be studied to predict one or more of these issues or challenges faced by the elderly in the same region?
- RQ17.
- Does the increasing or decreasing trend in interests related to fall detection relate to an increase or decrease in a specific sentiment (positive or negative) towards fall detection expressed in online communications, such as from social media?
- RQ18.
- Does the increase in search interest (inferred by a higher search interest value) at a given point of time indicate an increase in online communications and exchange of information related to falls, for instance, an increase in the number of Tweets or Facebook posts related to fall detection at that time?
- RQ19.
- What are the topics and online queries [130] on Google Trends that are related to fall detection, and is there any correlation in their trends with the trends of user interests associated with fall detection?
- RQ20.
- Does any correlation exist between trends in fall detection and trends in robot-assisted living or ambient assisted living as per the methodology of studying and comparing relative search volumes of topics described in [131]?
- RQ21.
- Do the trends in infodemic monikers, defined as a term, query, hashtag, or phrase that generates or feeds fake news, misinterpretations, or discriminatory phenomena [132], related to fall detection based on relevant google search data, help to determine the infodemic monikers related to fall detection on other online or social media platforms such as Twitter, Facebook, or Instagram?
- RQ22.
- Can the characteristics of trends in fall detection, the related topics, and online queries [130] for a specific month in a specific geographic region be an indicator of trending topics [133] related to fall detection on social media platforms such as Twitter, Facebook, or Instagram, in that timeframe in the same geographic region?
5. Conclusions
Author Contributions
Funding
Institutional Review Board Statement
Informed Consent Statement
Data Availability Statement
Conflicts of Interest
References
- Zhavoronkov, A.; Bischof, E.; Lee, K.-F. Artificial intelligence in longevity medicine. Nat. Aging. 2021, 1, 5–7. [Google Scholar] [CrossRef]
- Ageing and Health. Who.int. Available online: https://www.who.int/news-room/fact-sheets/detail/ageing-and-health (accessed on 29 June 2021).
- Beard, J.; Biggs, S.; Bloom, D.E.; Fried, L.P.; Hogan, P.R.; Kalache, A.; Olshansky, S.J. Global Population Ageing: Peril or Promise? Program on the Global Demography of Aging. PGDA Work. Pap. 2012. Available online: https://cdn1.sph.harvard.edu/wp-content/uploads/sites/1288/2013/10/PGDA_WP_89.pdf (accessed on 29 June 2021).
- Falls. Available online: https://www.who.int/news-room/fact-sheets/detail/falls. (accessed on 29 June 2021).
- Nahian, M.J.A.; Ghosh, T.; Banna, M.H.A.; Aseeri, M.A.; Uddin, M.N.; Ahmed, M.R.; Mahmud, M.; Kaiser, M.S. Towards an accelerometer-based elderly fall detection system using cross-disciplinary time series features. IEEE Access 2021, 9, 39413–39431. [Google Scholar] [CrossRef]
- GBD 2017 DALYs and HALE Collaborators. Global, regional, and national disability-adjusted life-years (DALYs) for 359 diseases and injuries and healthy life expectancy (HALE) for 195 countries and territories, 1990–2017: A systematic analysis for the Global Burden of Disease Study 2017. Lancet 2018, 392, 1859–1922. [Google Scholar] [CrossRef] [Green Version]
- World Health Organization. Injuries and Violence: The Facts. Available online: http://apps.who.int/iris/bitstream/handle/10665/149798/9789241508018_eng.pdf (accessed on 10 July 2021).
- Tinetti, M.E. Clinical practice. Preventing falls in elderly persons. N. Engl. J. Med. 2003, 348, 42–49. [Google Scholar] [CrossRef] [Green Version]
- Wang, X.; Ellul, J.; Azzopardi, G. Elderly fall detection systems: A literature survey. Front. Robot. AI 2020, 7, 71. [Google Scholar] [CrossRef]
- Lezzar, F.; Benmerzoug, D.; Kitouni, I. Camera-based fall detection system for the elderly with occlusion recognition. Appl. Med. Inform. 2020, 42, 169–179. [Google Scholar]
- Global Burden of Disease (GBD 2019). 2014. Available online: http://www.healthmetricsandevaluation.org/gbd (accessed on 10 July 2021).
- Murray, C.J.L.; Vos, T.; Lozano, R.; Naghavi, M.; Flaxman, A.D.; Michaud, C.; Ezzati, M.; Shibuya, K.; Salomon, J.A.; Abdalla, S.; et al. Disability-adjusted life years (DALYs) for 291 diseases and injuries in 21 regions, 1990–2010: A systematic analysis for the Global Burden of Disease Study 2010. Lancet 2012, 380, 2197–2223. [Google Scholar] [CrossRef]
- Thakur, N.; Han, C.Y. A study of fall detection in assisted living: Identifying and improving the optimal machine learning method. J. Sens Actuator Netw. 2021, 10, 39. [Google Scholar] [CrossRef]
- Cox, S.; Roggenkamp, R.; Bernard, S.; Smith, K. The epidemiology of elderly falls attended by emergency medical services in Victoria, Australia. Injury 2018, 49, 1712–1719. [Google Scholar] [CrossRef]
- Scuffham, P.; Chaplin, S.; Legood, R. Incidence and costs of unintentional falls in older people in the United Kingdom. J. Epidemiol Community Health 2003, 57, 740–744. [Google Scholar] [CrossRef] [Green Version]
- Silva Gama, Z.A.; da Gómez Conesa, A.; Sobral Ferreira, M. Epidemiología de caídas de ancianos en España: Una revisión sistemática, 2007. Rev. Esp. Salud Publica 2008, 82, 43–55. [Google Scholar] [CrossRef] [PubMed] [Green Version]
- Chan, K.M.; Pang, W.S.; Ee, C.H.; Ding, Y.Y.; Choo, P. Epidemiology of falls among the elderly community dwellers in Singapore. Singapore Med. J. 1997, 38, 427–431. [Google Scholar] [PubMed]
- Chastonay, P.; Weber, D.; Mattig, T. A nationally coordinated health promotion program for the elderly in a federal state, Switzerland. J. Popul. Ageing 2020, 13, 401–414. [Google Scholar] [CrossRef]
- Torres, M.J.; Féart, C.; Samieri, C.; Dorigny, B.; Luiking, Y.; Berr, C.; Barberger-Gateau, P.; Letenneur, L. Poor nutritional status is associated with a higher risk of falling and fracture in elderly people living at home in France: The Three-City cohort study. Osteoporos Int. 2015, 26, 2157–2164. [Google Scholar] [CrossRef] [PubMed]
- Langlois, J.A.; Smith, G.S.; Baker, S.P.; Langley, J.D. International comparisons of injury mortality in the elderly: Issues and differences between New Zealand and the United States. Int. J. Epidemiol. 1995, 24, 136–143. [Google Scholar] [CrossRef]
- Izumi, K.; Makimoto, K.; Kato, M.; Hiramatsu, T. Prospective study of fall risk assessment among institutionalized elderly in Japan. Nurs. Health Sci. 2002, 4, 141–147. [Google Scholar] [CrossRef]
- Wu, H.; Ouyang, P. Fall prevalence, time trend and its related risk factors among elderly people in China. Arch. Gerontol. Geriatr. 2017, 73, 294–299. [Google Scholar] [CrossRef]
- Yeong, U.Y.; Tan, S.Y.; Yap, J.F.; Choo, W.Y. Prevalence of falls among community-dwelling elderly and its associated factors: A cross-sectional study in Perak, Malaysia. Malays. Fam. Physician 2016, 11, 7–14. [Google Scholar]
- Siqueira, F.V.; Facchini, L.A.; Silveira DS da Piccini, R.X.; Tomasi, E.; Thumé, E.; Silva, S.M.; Dilélio, A. Prevalence of falls in elderly in Brazil: A countrywide analysis. Cad. Saude Publica. 2011, 27, 1819–1826. [Google Scholar] [CrossRef] [Green Version]
- Grigoryeva, I.; Vidiasova, L.; Dmitrieva, A.; Sergeyeva, O. Elderly Population in Modern Russia: Between Work, Education and Health, 1st ed.; Springer: Basel, Switzerland, 2019; Available online: https://play.google.com/store/books/details?id=WueCDwAAQBAJ (accessed on 10 July 2021).
- Orces, C.H. Prevalence and determinants of fall-related injuries among older adults in Ecuador. Curr. Gerontol. Geriatr. Res. 2014, 2014, 863473. [Google Scholar] [CrossRef] [Green Version]
- Worapanwisit, T.; Prabpai, S.; Rosenberg, E. Correlates of falls among community-dwelling elderly in Thailand. J. Aging Res. 2018, 2018, 8546085. [Google Scholar] [CrossRef]
- Del Mar Moreno Gómez, M.; Espitia, L.A.A.; Polanco, J.I.; Gutierrez, A.L.; Pérez, L.A. Implementation of a Fall Prevention Protocol in a Community with Older Adults in Bogotá, Colombia. Soc. Innov. J. 2021, 6. Available online: https://socialinnovationsjournal.com/index.php/sij/article/view/571 (accessed on 29 June 2021).
- Mitchell-Fearon, K.; James, K.; Waldron, N.; Holder-Nevins, D.; Willie-Tyndale, D.; Laws, H.; Eldemire-Shearer, D. Falls among community-dwelling older adults in Jamaica. SAGE Open 2014, 4, 1–9. [Google Scholar] [CrossRef]
- Amin, A.; Shawis, T.; Haines, R. Falls in older people: A perspective from Kurdistan of Iraq. Middle East J. Age Ageing 2014, 11, 20–22. [Google Scholar] [CrossRef]
- Sari, C.W.M.; Rahayu, U.; Fauziah, N. Overview of falling and risk factors of falling in the elderly in Bandung, west. Available online: http://www.jcreview.com/fulltext/197-1598094285.pdf (accessed on 29 June 2021).
- Gamage, N.; Rathnayake, N.; Alwis, G. Knowledge and perception of falls among community dwelling elderly: A study from southern Sri Lanka. Curr. Gerontol. Geriatr. Res. 2018, 2018, 7653469. [Google Scholar] [CrossRef] [PubMed]
- Amiri, J.S.; Zabihi, A.; Aziznejad Roshan, P.; Hosseini, S.R.; Bijani, A. Fall at home and its related factors among the elderly in Babol city Iran. J. Babol Univ. Med Sci. 2013, 15, 95–101. [Google Scholar]
- Joseph, A.; Kumar, D.; Bagavandas, M. A review of epidemiology of fall among elderly in India. Indian J. Community Med. 2019, 44, 166–168. [Google Scholar]
- Wadhwaniya, S.; Alonge, O.; Ul Baset, M.K.; Chowdhury, S.; Bhuiyan, A.-A.; Hyder, A.A. Epidemiology of fall injury in rural Bangladesh. Int. J. Environ. Res. Public Health 2017, 14, 900. [Google Scholar] [CrossRef] [PubMed] [Green Version]
- Jervas, E.; Onwukamuche, C.K.; Anyanwu, G.E.; Ugochukwu, A.I. Incidence of fall related hip fractures among the elderly persons in Owerri, Nigeria. Asian J. Med. Sci. 2011, 3, 110–114. [Google Scholar]
- Siddiqi, F.A.; Masood, T.; Osama, M.; Azim, M.E.; Babur, M.N. Common balance measures and fall risk scores among older adults in Pakistan: Normative values and correlation. J. Pak. Med. Assoc. 2019, 69, 246–249. [Google Scholar]
- Kamel, M.H.; Abdulmajeed, A.A.; Ismail, S.E.-S. Risk factors of falls among elderly living in Urban Suez—Egypt. Pan. Afr. Med. J. 2013, 14, 26. Available online: https://www.ajol.info/index.php/pamj/article/view/88152 (accessed on 29 June 2021). [CrossRef]
- Vo, T.H.M.; Nakamura, K.; Seino, K.; Nguyen, H.T.L.; Van Vo, T. Fear of falling and cognitive impairment in elderly with different social support levels: Findings from a community survey in Central Vietnam. BMC Geriatr. 2020, 20, 141. [Google Scholar] [CrossRef] [Green Version]
- Allain, T.J.; Mwambelo, M.; Mdolo, T.; Mfune, P. Falls and other geriatric syndromes in Blantyre, Malawi: A community survey of older adults. Malawi Med. J. 2014, 26, 105–1018. [Google Scholar]
- Gashaw, M.; Janakiraman, B.; Minyihun, A.; Jember, G.; Sany, K. Self-reported fall and associated factors among adult people with visual impairment in Gondar, Ethiopia: A cross-sectional study. BMC Public Health 2020, 20, 498. [Google Scholar] [CrossRef] [Green Version]
- Ntagungira, E.K. Epidemiology of and Risk Factors for Falls Among the Community-Dwelling Elderly People in Selected Districts of Umutara Province, Republic of Rwanda. Master’s Thesis, University of the Western Cape, Bellville, South Africa, 2005. [Google Scholar]
- Krishnaswamy, B.; Gnanasambandam, U. Falls in Older People: National/Regional Review of India. Chennai, Tamil Nadu, India: WHO Background Paper to the Global Report on Falls Among Older. Available online: https://www.who.int/ageing/projects/SEARO.pdf (accessed on 10 July 2021).
- Kwan, M.M.-S.; Close, J.C.T.; Wong, A.K.W.; Lord, S.R. Falls incidence, risk factors, and consequences in Chinese older people: A systematic review: Falls in Chinese older people. J. Am. Geriatr. Soc. 2011, 59, 536–543. [Google Scholar] [CrossRef]
- Kim, T.; Choi, S.D.; Xiong, S. Epidemiology of fall and its socioeconomic risk factors in community-dwelling Korean elderly. PLoS ONE 2020, 15, e0234787. [Google Scholar]
- World Health Organization. Who Global Report on Falls: Prevention in Older Age; WHO: Genève, Switzerland, 2007. [Google Scholar]
- de Ramirez, S.S.; Hyder, A.A.; Herbert, H.K.; Stevens, K. Unintentional injuries: Magnitude, prevention, and control. Annu. Rev. Public Health 2012, 33, 175–191. [Google Scholar] [CrossRef] [PubMed]
- Kalula, S.Z.; Scott, V.; Dowd, A.; Brodrick, K. Falls and fall prevention programmes in developing countries: Environmental scan for the adaptation of the Canadian Falls prevention curriculum for developing countries. J. Saf. Res. 2011, 42, 461–472. [Google Scholar] [CrossRef] [PubMed]
- Chandran, A.; Hyder, A.A.; Peek-Asa, C. The global burden of unintentional injuries and an agenda for progress. Epidemiol. Rev. 2010, 32, 110–120. [Google Scholar] [CrossRef] [PubMed] [Green Version]
- Norton, R.; Kobusingye, O. Injuries. N. Engl. J. Med. 2013, 368, 1723–1730. [Google Scholar] [CrossRef] [PubMed]
- Wikipedia Contributors. List of Countries by GNI (nominal) Per Capita, The Free Encyclopedia. Available online: https://en.wikipedia.org/w/index.php?title=List_of_countries_by_GNI_(nominal)_per_capita&oldid=1031303591 (accessed on 29 June 2021).
- United Nations. Member States|United Nations. Available online: https://www.un.org/en/about-us/member-states (accessed on 29 June 2021).
- Farias da Costa, V.C.; Oliveira, L.; de Souza, J. Internet of everything (IoE) taxonomies: A survey and a novel knowledge-based taxonomy. Sensors 2021, 21, 568. [Google Scholar] [CrossRef] [PubMed]
- Gorecky, D.; Schmitt, M.; Loskyll, M.; Zuhlke, D. Human-machine-interaction in the industry 4.0 era. In Proceedings of the 2014 12th IEEE International Conference on Industrial Informatics (INDIN), Porto Alegre RS, Brazil, 27–30 July 2014; IEEE: Manhattan, NY, USA, 2014; pp. 289–294. [Google Scholar]
- Google Search Statistics. Available online: https://www.internetlivestats.com/google-search-statistics/ (accessed on 29 June 2021).
- Search Engine Market Share Worldwide. Available online: https://www.statista.com/statistics/216573/worldwide-market-share-of-search-engines/ (accessed on 4 July 2021).
- Google Market Share Countries 2021. Available online: https://www.statista.com/statistics/220534/googles-share-of-search-market-in-selected-countries/ (accessed on 4 July 2021).
- Preis, T.; Moat, H.S.; Stanley, H.E.; Bishop, S.R. Quantifying the advantage of looking forward. Sci. Rep. 2012, 2, 350. [Google Scholar] [CrossRef] [Green Version]
- Preis, T.; Moat, H.S.; Stanley, H.E. Quantifying trading behavior in financial markets using Google Trends. Sci. Rep. 2013, 3, 1684. [Google Scholar] [CrossRef] [PubMed] [Green Version]
- Mavragani, A.; Ochoa, G.; Tsagarakis, K.P. Assessing the methods, tools, and statistical approaches in Google Trends research: Systematic review. J. Med. Internet Res. 2018, 20, e270. [Google Scholar] [CrossRef] [Green Version]
- Chen, Y.; Xie, J. Online consumer review: Word-of-mouth as a new element of marketing communication mix. Manag. Sci. 2008, 54, 477–491. [Google Scholar] [CrossRef] [Green Version]
- Kamiński, M.; Łoniewski, I.; Marlicz, W. “Dr. Google, I am in pain”-global Internet searches associated with pain: A retrospective analysis of Google Trends data. Int. J. Environ. Res. Public Health. 2020, 17, 954. [Google Scholar] [CrossRef] [Green Version]
- Jun, S.-P.; Yoo, H.S.; Choi, S. Ten years of research change using Google Trends: From the perspective of big data utilizations and applications. Technol. Forecast. Soc. Chang. 2018, 130, 69–87. [Google Scholar] [CrossRef]
- Shim, S.; Eastlick, M.A.; Lotz, S.L.; Warrington, P. An online prepurchase intentions model. J. Retail. 2001, 77, 397–416. [Google Scholar] [CrossRef]
- To, P.-L.; Liao, C.; Lin, T.-H. Shopping motivations on Internet: A study based on utilitarian and hedonic value. Technovation 2007, 27, 774–787. [Google Scholar] [CrossRef]
- Weaver, J. More People Search for Health. Available online: https://www.nbcnews.com/id/wbna3077086. (accessed on 4 July 2021).
- Internet & Technology. Available online: https://www.pewresearch.org/topic/internet-technology/ (accessed on 4 July 2021).
- Google Trends. Available online: https://trends.google.com/trends/ (accessed on 21 June 2021).
- Mellon, J. Where and when can we use Google Trends to measure issue salience? PS Polit. Sci. Polit. 2013, 46, 280–290. [Google Scholar] [CrossRef]
- Holle, R.; Hochadel, M.; Reitmeir, P.; Meisinger, C.; Wichmann, H.E.; KORA Group. Prolonged recruitment efforts in health surveys: Effects on response, costs, and potential bias: Effects on response, costs, and potential bias. Epidemiology 2006, 17, 639–643. [Google Scholar] [CrossRef]
- Ginsberg, J.; Mohebbi, M.H.; Patel, R.S.; Brammer, L.; Smolinski, M.S.; Brilliant, L. Detecting influenza epidemics using search engine query data. Nature 2009, 457, 1012–1014. [Google Scholar] [CrossRef]
- Kapitány-Fövény, M.; Ferenci, T.; Sulyok, Z.; Kegele, J.; Richter, H.; Vályi-Nagy, I.; Mihály, S. Can Google Trends data improve forecasting of Lyme disease incidence? Zoonoses Public Health 2019, 66, 101–107. [Google Scholar] [CrossRef] [Green Version]
- Verma, M.; Kishore, K.; Kumar, M.; Sondh, A.R.; Aggarwal, G.; Kathirvel, S. Google search trends predicting disease outbreaks: An analysis from India. Healthc Inform. Res. 2018, 24, 300–308. [Google Scholar] [CrossRef]
- Young, S.D.; Torrone, E.A.; Urata, J.; Aral, S.O. Using search engine data as a tool to predict Syphilis. Epidemiology 2018, 29, 574–578. [Google Scholar] [CrossRef]
- Young, S.D.; Zhang, Q. Using search engine big data for predicting new HIV diagnoses. PLoS ONE 2018, 13, e0199527. [Google Scholar] [CrossRef] [Green Version]
- Morsy, S.; Dang, T.N.; Kamel, M.G.; Zayan, A.H.; Makram, O.M.; Elhady, M.; Hirayama, K.; Huy, N. Prediction of Zika-confirmed cases in Brazil and Colombia using Google Trends. Epidemiol Infect. 2018, 146, 1625–1627. [Google Scholar] [CrossRef] [Green Version]
- Choi, H.; Varian, H. Predicting the present with Google trends: Predicting the present with Google trends. Econ. Rec. 2012, 88, 2–9. [Google Scholar] [CrossRef]
- Fan, M.H.; Chen, M.Y.; Liao, E.C. A deep learning approach for financial market prediction: Utilization of Google trends and keywords. Granular Comput. 2021, 6, 207–216. [Google Scholar] [CrossRef]
- Carneiro, H.A.; Mylonakis, E. Google trends: A web-based tool for real-time surveillance of disease outbreaks. Clin. Infect Dis. 2009, 49, 1557–1564. [Google Scholar] [CrossRef] [PubMed]
- Troumbis, A.Y. Declining Google Trends of public interest in biodiversity: Semantics, statistics or traceability of changing priorities? Biodivers. Conserv. 2017, 26, 1495–1505. [Google Scholar] [CrossRef]
- FAQ about Google Trends Data—Trends Help. Available online: https://support.google.com/trends/answer/4365533?hl=en (accessed on 12 August 2021).
- Mierswa, I.; Wurst, M.; Klinkenberg, R.; Scholz, M.; Euler, T. YALE: Rapid Prototyping for Complex Data Mining Tasks. In Proceedings of the 12th ACM SIGKDD International Conference on Knowledge Discovery and Data Mining—KDD ‘06, Philadelphia, PA, USA, 20–23 August 2006; ACM Press: New York, NY, USA, 2006. [Google Scholar]
- Liu, C.-L.; Lee, C.-H.; Lin, P.-M. A fall detection system using k-nearest neighbor classifier. Expert Syst. Appl. 2010, 37, 7174–7181. [Google Scholar] [CrossRef]
- Sun, J.; Wang, Z.; Chen, L.; Wang, B.; Ji, C.; Tao, S. A plantar inclinometer based approach to fall detection in open environments. In Emerging Trends and Advanced Technologies for Computational Intelligence; Springer: Berlin/Heidelberg, Germany, 2016; pp. 1–13. [Google Scholar]
- Rafferty, J.; Synnott, J.; Nugent, C.; Morrison, G.; Tamburini, E. Fall detection through thermal vision sensing. In Ubiquitous Computing and Ambient Intelligence; Springer: Berlin/Heidelberg, Germany, 2016; pp. 84–90. [Google Scholar]
- Castillo, J.C.; Carneiro, D.; Serrano-Cuerda, J.; Novais, P.; Fernández-Caballero, A.; Neves, J. A multi-modal approach for activity classification and fall detection. Int. J. Syst. Sci. 2014, 45, 810–824. [Google Scholar] [CrossRef] [Green Version]
- Zhengming Fu Delbruck, T.; Lichtsteiner, P.; Culurciello, E. An address-event fall detector for assisted living applications. IEEE Trans. Biomed. Circuits Syst. 2008, 2, 88–96. [Google Scholar]
- Willems, J.; Debard, G.; Vanrumste, B.; Goedemé, T. A video-based algorithm for elderly fall detection. In IFMBE Proceedings; Springer: Berlin/Heidelberg, Germany, 2009; pp. 312–315. [Google Scholar]
- Feng, P.; Yu, M.; Naqvi, S.M.; Chambers, J.A. Deep learning for posture analysis in fall detection. In Proceedings of the 2014 19th International Conference on Digital Signal Processing, Hong Kong, 20–23 August 2014; IEEE: Manhattan, NY, USA, 2014; pp. 12–17. [Google Scholar]
- Jokanovic, B.; Amin, M.; Ahmad, F.; Boashash, B. Radar fall detection using principal component analysis. In Radar Sensor Technology XX; Ranney, K.I., Doerry, A., Eds.; SPIE: Bellingham, DC, USA, 2016. [Google Scholar]
- Bian, Z.-P.; Hou, J.; Chau, L.-P.; Magnenat-Thalmann, N. Fall detection based on body part tracking using a depth camera. IEEE J. Biomed. Health Inform. 2015, 19, 430–439. [Google Scholar] [CrossRef]
- Ozcan, K.; Velipasalar, S.; Varshney, P.K. Autonomous fall detection with wearable cameras by using relative entropy distance measure. IEEE Trans. Hum. Mach. Syst. 2016, 47, 1–9. [Google Scholar] [CrossRef]
- Lai, C.-F.; Chang, S.-Y.; Chao, H.-C.; Huang, Y.-M. Detection of cognitive injured body region using multiple triaxial accelerometers for elderly falling. IEEE Sens. J. 2011, 11, 763–770. [Google Scholar] [CrossRef]
- Hakim, A.; Huq, M.S.; Shanta, S.; Ibrahim, B.S.K.K. Smartphone based data mining for fall detection: Analysis and design. Procedia Comput. Sci. 2017, 105, 46–51. [Google Scholar] [CrossRef]
- Tomii, S.; Ohtsuki, T. Falling detection using multiple doppler sensors. In Proceedings of the 2012 IEEE 14th International Conference on e-Health Networking, Applications and Services (Healthcom), Beijing, China, 10–13 October 2012; IEEE: Manhattan, NY, USA, 2012; pp. 196–201. [Google Scholar]
- Espinosa, R.; Ponce, H.; Gutiérrez, S.; Martínez-Villaseñor, L.; Brieva, J.; Moya-Albor, E. A vision-based approach for fall detection using multiple cameras and convolutional neural networks: A case study using the UP-Fall detection dataset. Comput. Biol. Med. 2019, 115, 103520. [Google Scholar] [CrossRef]
- Nakamura, T.; Bouazizi, M.; Yamamoto, K.; Ohtsuki, T. Wi-fi-CSI-based fall detection by spectrogram analysis with CNN. In Proceedings of the GLOBECOM 2020-2020 IEEE Global Communications Conference, Taipei, Taiwan, 7–11 December 2020; IEEE: Manhattan, NY, USA, 2020; pp. 1–6. [Google Scholar]
- Balli, S.; Sağbaş, E.A.; Peker, M. Human activity recognition from smart watch sensor data using a hybrid of principal component analysis and random forest algorithm. Meas. Control. 2019, 52, 37–45. [Google Scholar] [CrossRef] [Green Version]
- Dhole, S.R.; Kashyap, A.; Dangwal, A.N.; Mohan, R. A novel helmet design and implementation for drowsiness and fall detection of workers on-site using EEG and Random-Forest Classifier. Procedia Comput. Sci. 2019, 151, 947–952. [Google Scholar] [CrossRef]
- Ramirez, H.; Velastin, S.A.; Fabregas, E.; Meza, I.; Makris, D.; Farias, G. Fall detection using human skeleton features. In Proceedings of the 11th International Conference on Pattern Recognition Systems—ICPRS-21, Curico, Chile, 17–19 March 2021; Available online: https://eprints.kingston.ac.uk/id/eprint/48516/ (accessed on 4 July 2021).
- Tahir, A.; Ahmad, J.; Morison, G.; Larijani, H.; Gibson, R.M.; Skelton, D.A. Hrnn4f: Hybrid deep random neural network for multi-channel fall activity detection. Probab. Eng. Inf. Sci. 2021, 35, 37–50. [Google Scholar] [CrossRef] [Green Version]
- Sarabia-Jácome, D.; Usach, R.; Palau, C.E.; Esteve, M. Highly-efficient fog-based deep learning AAL fall detection system. Internet Things 2020, 11, 100185. [Google Scholar] [CrossRef]
- Dhiraj Manekar, R.; Saurav, S.; Maiti, S.; Singh, S.; Chaudhury, S. Activity recognition for indoor fall detection in 360-degree videos using deep learning techniques. In Proceedings of the 3rd International Conference on Computer Vision and Image Processing, Jabalpur, India, 29 September–1 October 2018; Springer: Singapore, 2020; pp. 417–429. [Google Scholar]
- Ngu, A.H.; Tseng, P.-T.; Paliwal, M.; Carpenter, C.; Stipe, W. Smartwatch-based IoT fall detection application. Open J. Internet Things 2018, 4, 87–98. [Google Scholar]
- Khan, S.; Qamar, R.; Zaheen, R.; Al-Ali, A.R.; Al Nabulsi, A.; Al-Nashash, H. Internet of things based multi-sensor patient fall detection system. Heal. Technol. Lett. 2019, 6, 132–137. [Google Scholar] [CrossRef]
- Ning, Y.; Zhang, S.; Nie, X.; Li, G.; Zhao, G. Fall detection algorithm based on gradient boosting decision tree. In Proceedings of the 2019 IEEE International Conference on Signal Processing, Communications and Computing (ICSPCC), Dalian, China, 20–23 September 2019; IEEE: Manhattan, NY, USA, 2019; pp. 1–4. [Google Scholar]
- Cahoolessur, D.K.; Rajkumarsingh, B. Fall Detection System Using XGBoost and IoT. R&D J. 2020, 36. Available online: http://dx.doi.org/10.17159/2309-8988/2020/v36a2 (accessed on 28 June 2021).
- Cai, W.; Qiu, L.; Li, W.; Yu, J.; Wang, L. Practical Fall Detection Algorithm based on Adaboost. In Proceedings of the 2019 4th International Conference on Biomedical Signal and Image Processing (ICBIP 2019)—ICBIP ’19, Chengdu, China, 13–15 August 2019; ACM Press: New York, New York, USA, 2019. [Google Scholar]
- Lee, J.-S.; Tseng, H.-H. Development of an enhanced threshold-based fall detection system using smartphones with built-in accelerometers. IEEE Sens. J. 2019, 19, 8293–8302. [Google Scholar] [CrossRef]
- Van Thanh, P.; Tran, D.-T.; Nguyen, D.-C.; Duc Anh, N.; Nhu Dinh, D.; El-Rabaie, S.; Sandrasegaran, K. Development of a real-time, simple and high-accuracy fall detection system for elderly using 3-DOF accelerometers. Arab. J. Sci. Eng. 2019, 44, 3329–3342. [Google Scholar] [CrossRef] [Green Version]
- Pham, V.T.; Le, Q.B.; Nguyen, D.A.; Dang, N.D.; Huynh, H.T.; Tran, D.T. Multi-sensor data fusion in A real-time support system for on-duty firefighters. Sensors 2019, 19, 4746. [Google Scholar] [CrossRef] [Green Version]
- Hardeniya, N.; Perkins, J.; Chopra, D.; Joshi, N.; Mathur, I. Natural Language Processing: Python and NLTK; Packt Publishing: Birmingham, England, 2016; Available online: https://play.google.com/store/books/details?id=0J_cDgAAQBAJ (accessed on 4 July 2021).
- Wikipedia Contributors. Tag Cloud. Available online: https://en.wikipedia.org/w/index.php?title=Tag_cloud&oldid=1021808324 (accessed on 12 August 2021).
- Free Word Cloud Generator—MonkeyLearn. Available online: https://monkeylearn.com/word-cloud/result. (accessed on 4 July 2021).
- Su, F.-Y.; Fu, M.-L.; Zhao, Q.-H.; Huang, H.-H.; Luo, D.; Xiao, M.-Z. Analysis of hospitalization costs related to fall injuries in elderly patients. World J. Clin. Cases 2021, 9, 1271–1283. [Google Scholar] [CrossRef]
- Lei, X.; Qian, X.; Zhao, G. Rating prediction based on social sentiment from textual reviews. IEEE Trans Multimed. 2016, 18, 1910–1921. [Google Scholar] [CrossRef]
- Falls an Early Clue to Alzheimer’s. Available online: https://www.webmd.com/alzheimers/news/20110718/falls-an-early-clue-to-alzheimers (accessed on 12 August 2021).
- Koziorowski, D.; Figura, M.; Milanowski, Ł.M.; Szlufik, S.; Alster, P.; Madetko, N.; Friedman, A. Mechanisms of neurodegeneration in various forms of parkinsonism-similarities and differences. Cells 2021, 10, 656. [Google Scholar] [CrossRef]
- Tull, M.T.; Edmonds, K.A.; Scamaldo, K.M.; Richmond, J.R.; Rose, J.P.; Gratz, K.L. Psychological outcomes associated with stay-at-home orders and the perceived impact of COVID-19 on daily life. Psychiatry Res. 2020, 289, 113098. [Google Scholar] [CrossRef]
- Hajek, A.; König, H.-H. The association of falls with loneliness and social exclusion: Evidence from the DEAS German Ageing Survey. BMC Geriatr. 2017, 17, 204. [Google Scholar] [CrossRef]
- Mamun, K.; Lim, J.K.H. Association between falls and high-risk medication use in hospitalized Asian elderly patients. Geriatr. Gerontol. Int. 2009, 9, 276–281. [Google Scholar] [CrossRef] [PubMed]
- Lawlor, D.A.; Patel, R.; Ebrahim, S. Association between falls in elderly women and chronic diseases and drug use: Cross sectional study. BMJ 2003, 327, 712–717. [Google Scholar] [CrossRef] [Green Version]
- Gibson, W.; Hunter, K.F.; Camicioli, R.; Booth, J.; Skelton, D.A.; Dumoulin, C.; Paul, L.; Wagg, A. The association between lower urinary tract symptoms and falls: Forming a theoretical model for a research agenda. Neurourol Urodyn. 2018, 37, 501–509. [Google Scholar] [CrossRef]
- Aso, K.; Okamura, H. Association between falls and balance among inpatients with schizophrenia: A preliminary prospective cohort study. Psychiatr Q. 2019, 90, 111–116. [Google Scholar] [CrossRef] [Green Version]
- Iaboni, A.; Flint, A.J. The complex interplay of depression and falls in older adults: A clinical review. Am. J. Geriatr. Psychiatry 2013, 21, 484–492. [Google Scholar] [CrossRef] [PubMed] [Green Version]
- Kojima, R.; Ukawa, S.; Ando, M.; Kawamura, T.; Wakai, K.; Tsushita, K.; Tamakoshi, A. Association between falls and depressive symptoms or visual impairment among Japanese young-old adults. Geriatr. Gerontol. Int. 2016, 16, 384–391. [Google Scholar] [CrossRef] [PubMed] [Green Version]
- Hallford, D.J.; Nicholson, G.; Sanders, K.; McCabe, M.P. The association between anxiety and falls: A meta-analysis. J. Gerontol. B Psychol. Sci. Soc. Sci. 2017, 72, 729–741. [Google Scholar] [CrossRef] [PubMed] [Green Version]
- Follis, S.; Cook, A.; Bea, J.W.; Going, S.B.; Laddu, D.; Cauley, J.A.; Shadyab, A.H.; Stefanick, M.L.; Chen, Z. Association between sarcopenic obesity and falls in a multiethnic cohort of postmenopausal women. J. Am. Geriatr. Soc. 2018, 66, 2314–2320. [Google Scholar] [CrossRef] [PubMed] [Green Version]
- Rivera-Chávez, J.G.; Torres-Gutiérrez, J.L.; Regalado-Villalobos, A.; Moreno-Cervantes, C.A.; Luna-Torres, S. Association between falls and cardiovascular diseases in the geriatric population. Arch. Cardiol. Mex. 2021, 91, 66–72. [Google Scholar] [PubMed]
- Find Related Searches—Trends Help. Available online: https://support.google.com/trends/answer/4355000?hl=en (accessed on 12 August 2021).
- Walker, A.; Hopkins, C.; Surda, P. Use of Google Trends to investigate loss-of-smell-related searches during the COVID-19 outbreak: Loss-of-smell web search in COVID-19 outbreak. Int. Forum. Allergy Rhinol. 2020, 10, 839–847. [Google Scholar] [CrossRef] [Green Version]
- Rovetta, A.; Bhagavathula, A.S. Global infodemiology of COVID-19: Analysis of Google web searches and Instagram hashtags. J. Med. Internet Res. 2020, 22, e20673. [Google Scholar] [CrossRef]
- Sasaki, K.; Yoshikawa, T.; Furuhashi, T. Online topic model for Twitter considering dynamics of user interests and topic trends. In Natural Language Processing (EMNLP), Proceedings of the 2014 Conference on Empirical Methods, Doha, Qatar, 25–29 October 2014; Association for Computational Linguistics: Stroudsburg, PA, USA, 2014. [Google Scholar]


| Attribute Name | Characteristics | Range | Datatype |
|---|---|---|---|
| Month | Each month from 2004 to 2021 | January 2004–June 2021 | Date |
| Afghanistan | Represents Search Interest data for Afghanistan | 0–100 | Numerical |
| Albania | Represents Search Interest data for Albania | 0–100 | Numerical |
| Algeria | Represents Search Interest data for Algeria | 0–100 | Numerical |
| . | . | . | . |
| . | . | . | . |
| . | . | . | . |
| Vietnam | Represents Search Interest data for Vietnam | 0–100 | Numerical |
| Yemen | Represents Search Interest data for Yemen | 0–100 | Numerical |
| Zambia | Represents Search Interest data for Zambia | 0–100 | Numerical |
| Zimbabwe | Represents Search Interest data for Zimbabwe | 0–100 | Numerical |
| List of Countries as per United Nations | |||
|---|---|---|---|
| Afghanistan | Djibouti | Libya | Saint Vincent and the Grenadines |
| Albania | Dominica | Liechtenstein | Samoa |
| Algeria | Dominican Republic | Lithuania | San Marino |
| Andorra | Ecuador | Luxembourg | Sao Tome and Principe |
| Angola | Egypt | Madagascar | Saudi Arabia |
| Antigua and Barbuda | El Salvador | Malawi | Senegal |
| Argentina | Equatorial Guinea | Malaysia | Serbia |
| Armenia | Eritrea | Maldives | Seychelles |
| Australia | Estonia | Mali | Sierra Leone |
| Austria | Ethiopia | Malta | Singapore |
| Azerbaijan | Fiji | Marshall Islands | Slovakia |
| Bahamas | Finland | Mauritania | Slovenia |
| Bahrain | France | Mauritius | Solomon Islands |
| Bangladesh | Gabon | Mexico | Somalia |
| Barbados | The Gambia | Micronesia (the Federated States of) | South Africa |
| Belarus | Georgia | Monaco | South Sudan |
| Belgium | Germany | Mongolia | Spain |
| Belize | Ghana | Montenegro | Sri Lanka |
| Benin | Greece | Morocco | Sudan |
| Bhutan | Grenada | Mozambique | Suriname |
| Bolivia | Guatemala | Myanmar | Swaziland |
| Bosnia and Herzegovina | Guinea | Namibia | Switzerland |
| Botswana | Guinea-Bissau | Nauru | Sweden |
| Brazil | Guyana | Nepal | Syria |
| Brunei Darussalam | Haiti | Netherlands | Tajikistan |
| Bulgaria | Honduras | New Zealand | Thailand |
| Burkina Faso | Hungary | Nicaragua | The former Yugoslav Republic of Macedonia |
| Burundi | Iceland | Niger | Timor Leste |
| Cambodia | India | Nigeria | Togo |
| Cameroon | Indonesia | Norway | Tonga |
| Canada | Iran | Oman | Trinidad and Tobago |
| Cape Verde | Iraq | Pakistan | Tunisia |
| Central African Republic | Ireland | Palau | Turkey |
| Chad | Israel | Panama | Turkmenistan |
| Chile | Italy | Papua New Guinea | Tuvalu |
| China | Jamaica | Paraguay | Uganda |
| Colombia | Japan | Peru | Ukraine |
| Comoros | Jordan | Philippines | United Arab Emirates |
| Congo (Republic of the) | Kazakhstan | Poland | United Kingdom |
| Costa Rica | Kenya | Portugal | United of Republic of Tanzania |
| Côte d’Ivoire | Kiribati | Qatar | United States |
| Croatia | Kuwait | Republic of Korea | Uruguay |
| Cuba | Kyrgyzstan | Republic of Moldova | Uzbekistan |
| Cyprus | Lao People’s Democratic Republic | Romania | Vanuatu |
| Czech Republic | Latvia | Russian Federation | Venezuela |
| Democratic People’s Republic of Korea | Lebanon | Rwanda | Vietnam |
| Democratic Republic of the Congo | Lesotho | Saint Kitts and Nevis | Yemen |
| Denmark | Liberia | Saint Lucia | Zambia |
| Bag of Words | |
|---|---|
| fall detection system | falls among community-dwelling |
| Inclinometer Based Approach to Fall Detection | falls in elderly in Brazil |
| Fall Detection through Thermal Vision Sensing | fall-related injuries among older adults |
| activity classification and fall detection | falls among community-dwelling |
| Address-Event Fall Detector | fall prevention protocol |
| Algorithm for Elderly Fall Detection | Falls among community-dwelling |
| Posture Analysis in Fall Detection | Falls in older people |
| Fall Detection Using Principal Component Analysis | falling and risk factors of falling |
| Fall Detection Based on Body Part Tracking | Knowledge and perception of falls |
| Fall Detection with Wearable Cameras | Fall at home |
| Triaxial Accelerometers for Elderly Falling | epidemiology of fall |
| Smartphone-Based Data Mining for Fall Detection | fall injury |
| Falling Detection Using Multiple Doppler Sensors | fall-related hip fractures |
| vision-based approach for fall detection | fall risk scores |
| Wi-Fi-CSI-Based Fall Detection | Risk factors of falls |
| helmet design for drowsiness and fall detection | Fear of falling and cognitive impairment |
| Fall Detection using Human Skeleton Features | Falls and other geriatric syndromes |
| AAL fall detection system | Self-reported fall |
| Indoor Fall Detection in Videos | risk factors for falls |
| Smartwatch-Based IoT Fall Detection Application | Wearable sensors for reliable fall detection |
| multi-sensor patient fall detection system | accelerometry-based parameters for fall detection |
| Fall Detection Algorithm Based on Gradient Boosting | smartphone-based fall detection system |
| Fall Detection System using XGBoost | wearable system for pre-impact fall detection |
| Practical Fall Detection Algorithm | fall detection in a supportive home environment |
| Fall Detection System Using Smartphones | depth data for fall detection |
| fall detection in assisted living | pervasive fall detection system |
| elderly fall | tri-axial accelerometer fall detection algorithm |
| falls in older people | vision-based fall detection |
| falls among the elderly | microphone array system for automatic fall detection |
| health promotion program | camera-based fall detection system |
| falling and fracture in elderly people | Device-free fall detection |
| injury mortality in the elderly | Fall detection from human shape |
| fall risk assessment | viewpoint-independent statistical method for fall detection |
| Fall prevalence | wearable-sensor-based fall detection system |
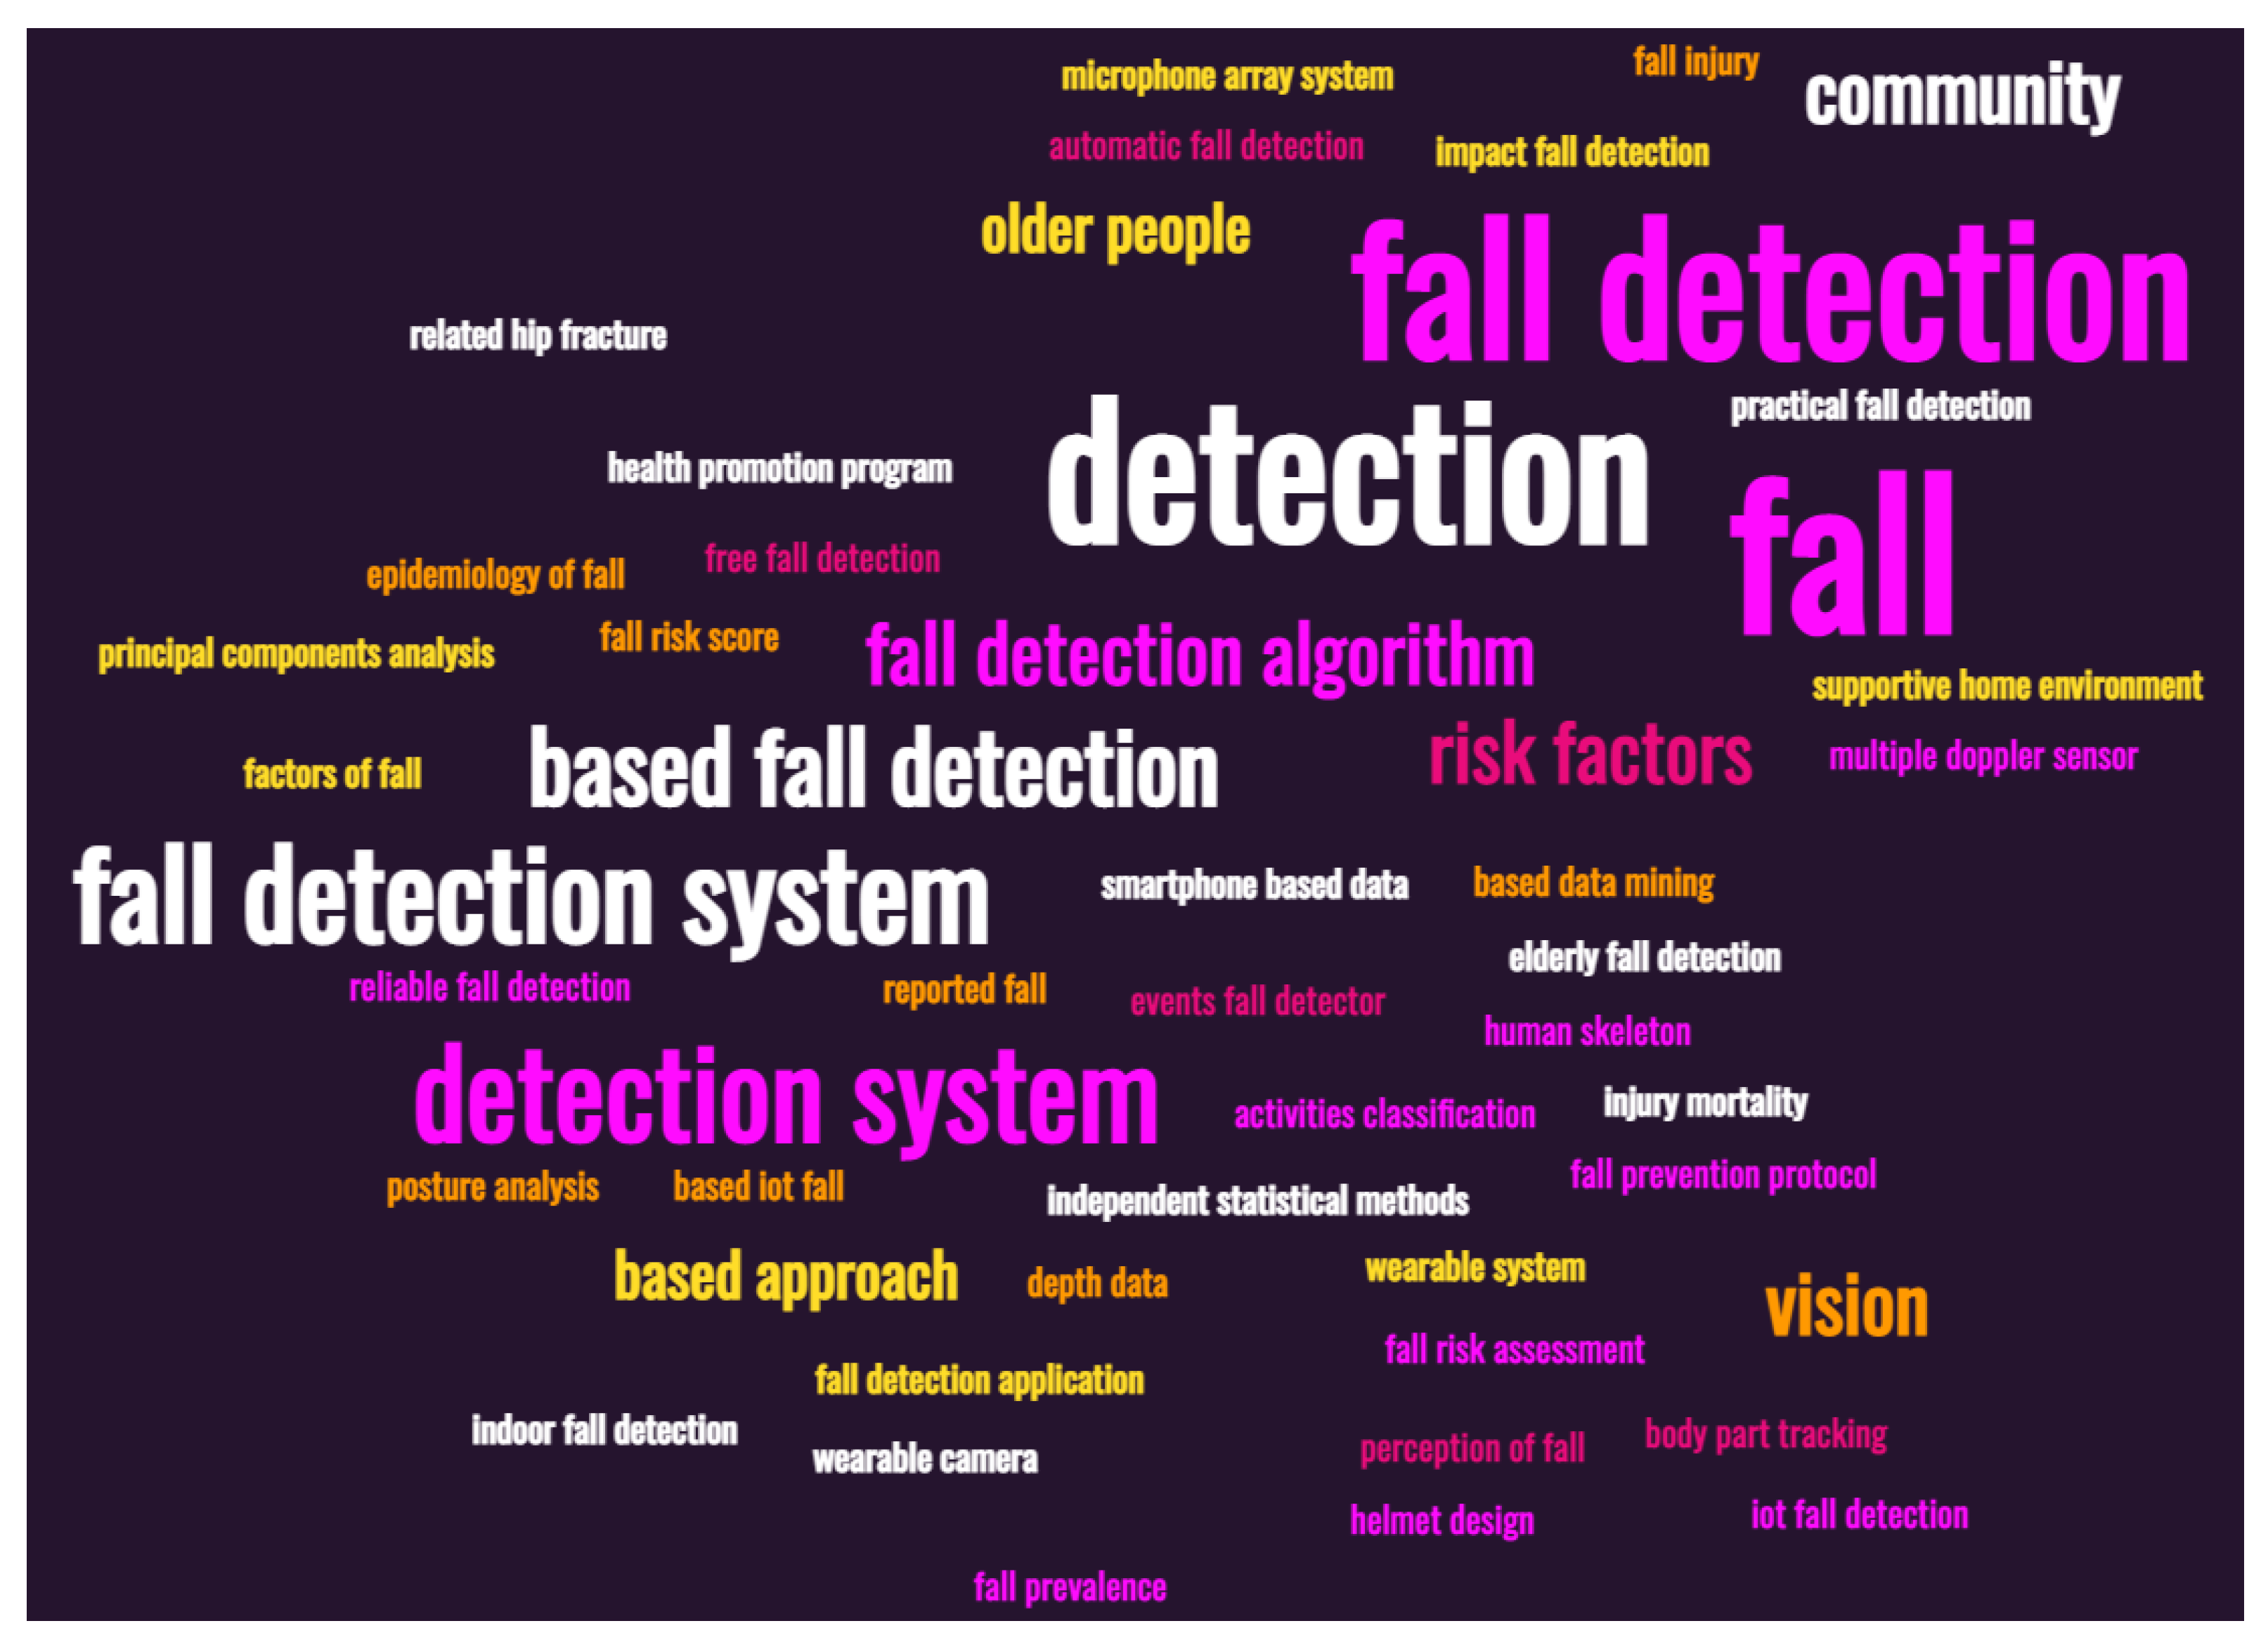
| Word or Phrase | Frequency | Relevance |
|---|---|---|
| fall | 61 | 0.427 |
| detection | 39 | 0.284 |
| fall detection | 38 | 0.379 |
| fall detection system | 9 | 0.995 |
| detection system | 9 | 0.19 |
| based fall detection | 5 | 0.569 |
| fall detection algorithm | 3 | 0.427 |
| risk factors | 3 | 0.284 |
| community | 3 | 0.142 |
| vision | 3 | 0.095 |
| based approach | 2 | 0.190 |
| older people | 2 | 0.190 |
| events fall detector | 1 | 0.142 |
| based data mining | 1 | 0.142 |
| smartphone-based data | 1 | 0.142 |
| impact fall detection | 1 | 0.142 |
| indoor fall detection | 1 | 0.142 |
| reliable fall detection | 1 | 0.142 |
| fall risk assessment | 1 | 0.142 |
| fall detection application | 1 | 0.142 |
| body part tracking | 1 | 0.142 |
| practical fall detection | 1 | 0.142 |
| fall prevention protocol | 1 | 0.142 |
| related hip fracture | 1 | 0.142 |
| elderly fall detection | 1 | 0.142 |
| free fall detection | 1 | 0.142 |
| automatic fall detection | 1 | 0.142 |
| health promotion program | 1 | 0.142 |
| fall risk score | 1 | 0.142 |
| perception of fall | 1 | 0.142 |
| supportive home environment | 1 | 0.142 |
| independent statistical methods | 1 | 0.142 |
| factors of fall | 1 | 0.142 |
| microphone array system | 1 | 0.142 |
| epidemiology of fall | 1 | 0.142 |
| IoT fall detection | 1 | 0.142 |
| based iot fall | 1 | 0.142 |
| principal components analysis | 1 | 0.142 |
| multiple doppler sensor | 1 | 0.142 |
| helmet design | 1 | 0.095 |
| wearable system | 1 | 0.095 |
| activities classification | 1 | 0.095 |
| posture analysis | 1 | 0.095 |
| human skeleton | 1 | 0.095 |
| reported fall | 1 | 0.095 |
| fall prevalence | 1 | 0.095 |
| depth data | 1 | 0.095 |
| fall injury | 1 | 0.095 |
| injury mortality | 1 | 0.095 |
| wearable camera | 1 | 0.095 |
Publisher’s Note: MDPI stays neutral with regard to jurisdictional claims in published maps and institutional affiliations. |
© 2021 by the authors. Licensee MDPI, Basel, Switzerland. This article is an open access article distributed under the terms and conditions of the Creative Commons Attribution (CC BY) license (https://creativecommons.org/licenses/by/4.0/).
Share and Cite
Thakur, N.; Han, C.Y. Country-Specific Interests towards Fall Detection from 2004–2021: An Open Access Dataset and Research Questions. Data 2021, 6, 92. https://doi.org/10.3390/data6080092
Thakur N, Han CY. Country-Specific Interests towards Fall Detection from 2004–2021: An Open Access Dataset and Research Questions. Data. 2021; 6(8):92. https://doi.org/10.3390/data6080092
Chicago/Turabian StyleThakur, Nirmalya, and Chia Y. Han. 2021. "Country-Specific Interests towards Fall Detection from 2004–2021: An Open Access Dataset and Research Questions" Data 6, no. 8: 92. https://doi.org/10.3390/data6080092
APA StyleThakur, N., & Han, C. Y. (2021). Country-Specific Interests towards Fall Detection from 2004–2021: An Open Access Dataset and Research Questions. Data, 6(8), 92. https://doi.org/10.3390/data6080092