1. Background and Summary
Documenting the diffusion of improved cultivars has long been a preoccupation of the broad development community [
1]. While monitoring progress made in the dissemination of improved cultivars is important, assessing the impacts of adoption, for example, on agricultural productivity or farmers’ livelihoods, constitutes an equally crucial accomplishment. Such evidence can provide valuable insights for the research process to move forward.
Varietal adoption surveys have been carried out using a range of methods—eliciting information from farmers through household surveys, gathering expert opinions, and conducting seed-sales inquiries—that all possess inherent flaws [
2]. DNA fingerprinting, originally deployed for seed regulations in developed countries, has been introduced in recent years for crop variety identification. Using the method as a benchmark, multiple empirical studies have shown that varietal types (landrace vs. improved) and varietal names are commonly mismeasured [
3,
4,
5,
6]. DNA fingerprinting has now been accepted as the method of choice for collecting rigorous data, and efforts are made to identify best practices among multiple methodological options [
7].
Crop germplasm development is a major activity of agricultural research centers. In collaboration with national partners, the CGIAR—a global partnership of research centers engaged in research for a food secure future—has supported the development and release of hundreds of cultivars. The data contained herein were used to document the reach of CGIAR-related germplasms in Ethiopia [
8].
Data were collected within the framework of a large-scale nationally representative survey, the Ethiopian Socioeconomic Survey (ESS 2018/19). In the regions of Amhara, Dire Dawa, Harar, Oromia, SNNP, and Tigray, crop cuts of barley, maize, and sorghum were conducted in 197 Enumeration Areas (EAs). In each EA, plots grown by the ESS households during the agricultural season were first listed by enumerators who randomly selected up to ten plots per crop. On each selected plot, 200 g of grains were collected from a random 4 × 4 m quadrant.
This data can shed light on several research questions. While measurement errors have the potential to be harmful at the micro and macro levels, limited work has yet investigated its implications [
9]. Mismeasurement mechanisms need to be diagnosed to identify in which cases mismeasurement matters: the magnitude of the bias, its source and associated correlates. The search for solutions for detecting and minimizing the consequences of mismeasurements is also a promising research path.
Crop variety mismeasurements are important because farmers make planting and input allocation decisions based on their information about the type of crop variety they think they have. This variety misclassification might lead to sub-optimal outcomes.
The third set of questions relates to the success of breeding research efforts: how traits selected by breeders under research stations generalize to farmers’ fields is a key question. Some widespread crop traits are measured in the ESS: yield, maturity length, and crop damage. Questions related to the seed system functioning and delivery can also be investigated, using available metrics such as farmers’ recycling practices and grain purity.
2. Data Description
The data are available as separate .csv files and can be opened by any statistical software. All data are stored in the OpenICPSR Repository [
10] and accessible through the OpenICPSR online portal. The data consist of DArTseq reports from each crop (
Table 1). The merging with the ESS datasets can be performed using the variables Genotype (from DArTseq reports) and sccq05 (in Section 9a of the post-harvest questionnaire). The genetic distance between samples is also provided as a matrix for each of the three crops.
In the case of barley, the reference material composing the reference library could not be uniquely distinguished. Some reference library samples are, thus, grouped into bins, and caution should be exerted when using the varietal-level data for these samples.
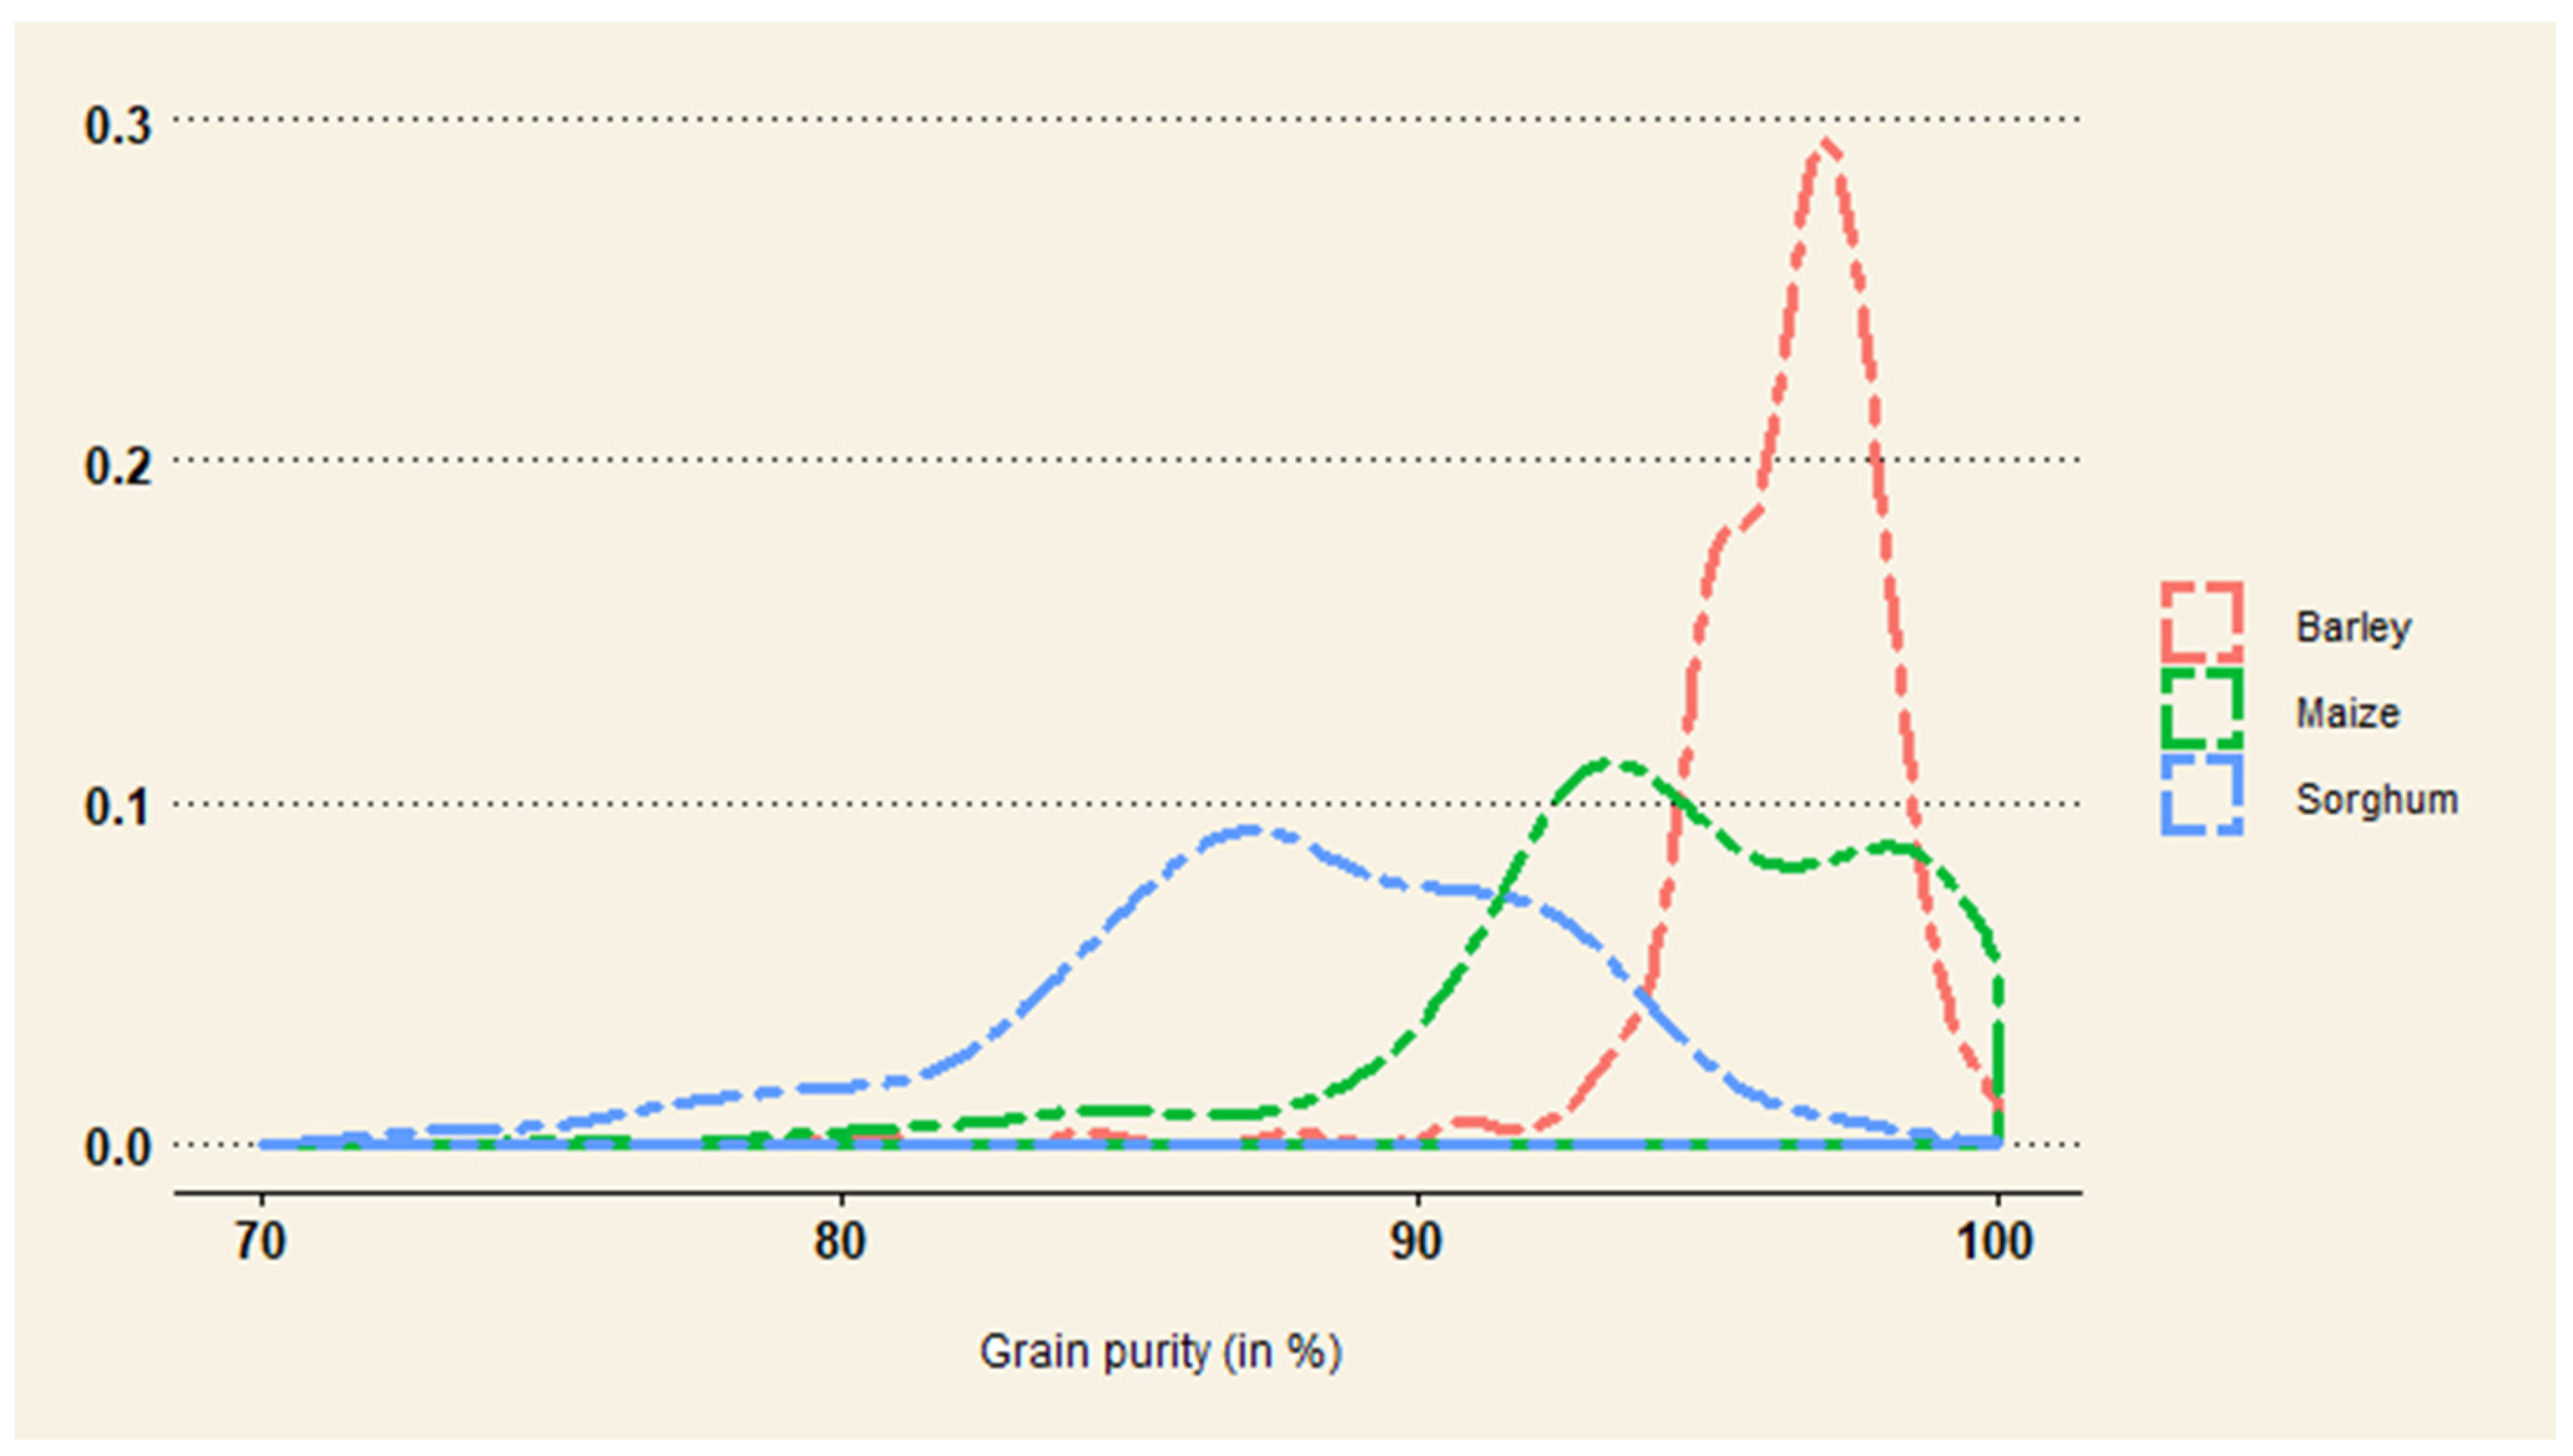
Figure 1 displays the density of purity metrics for each crop and
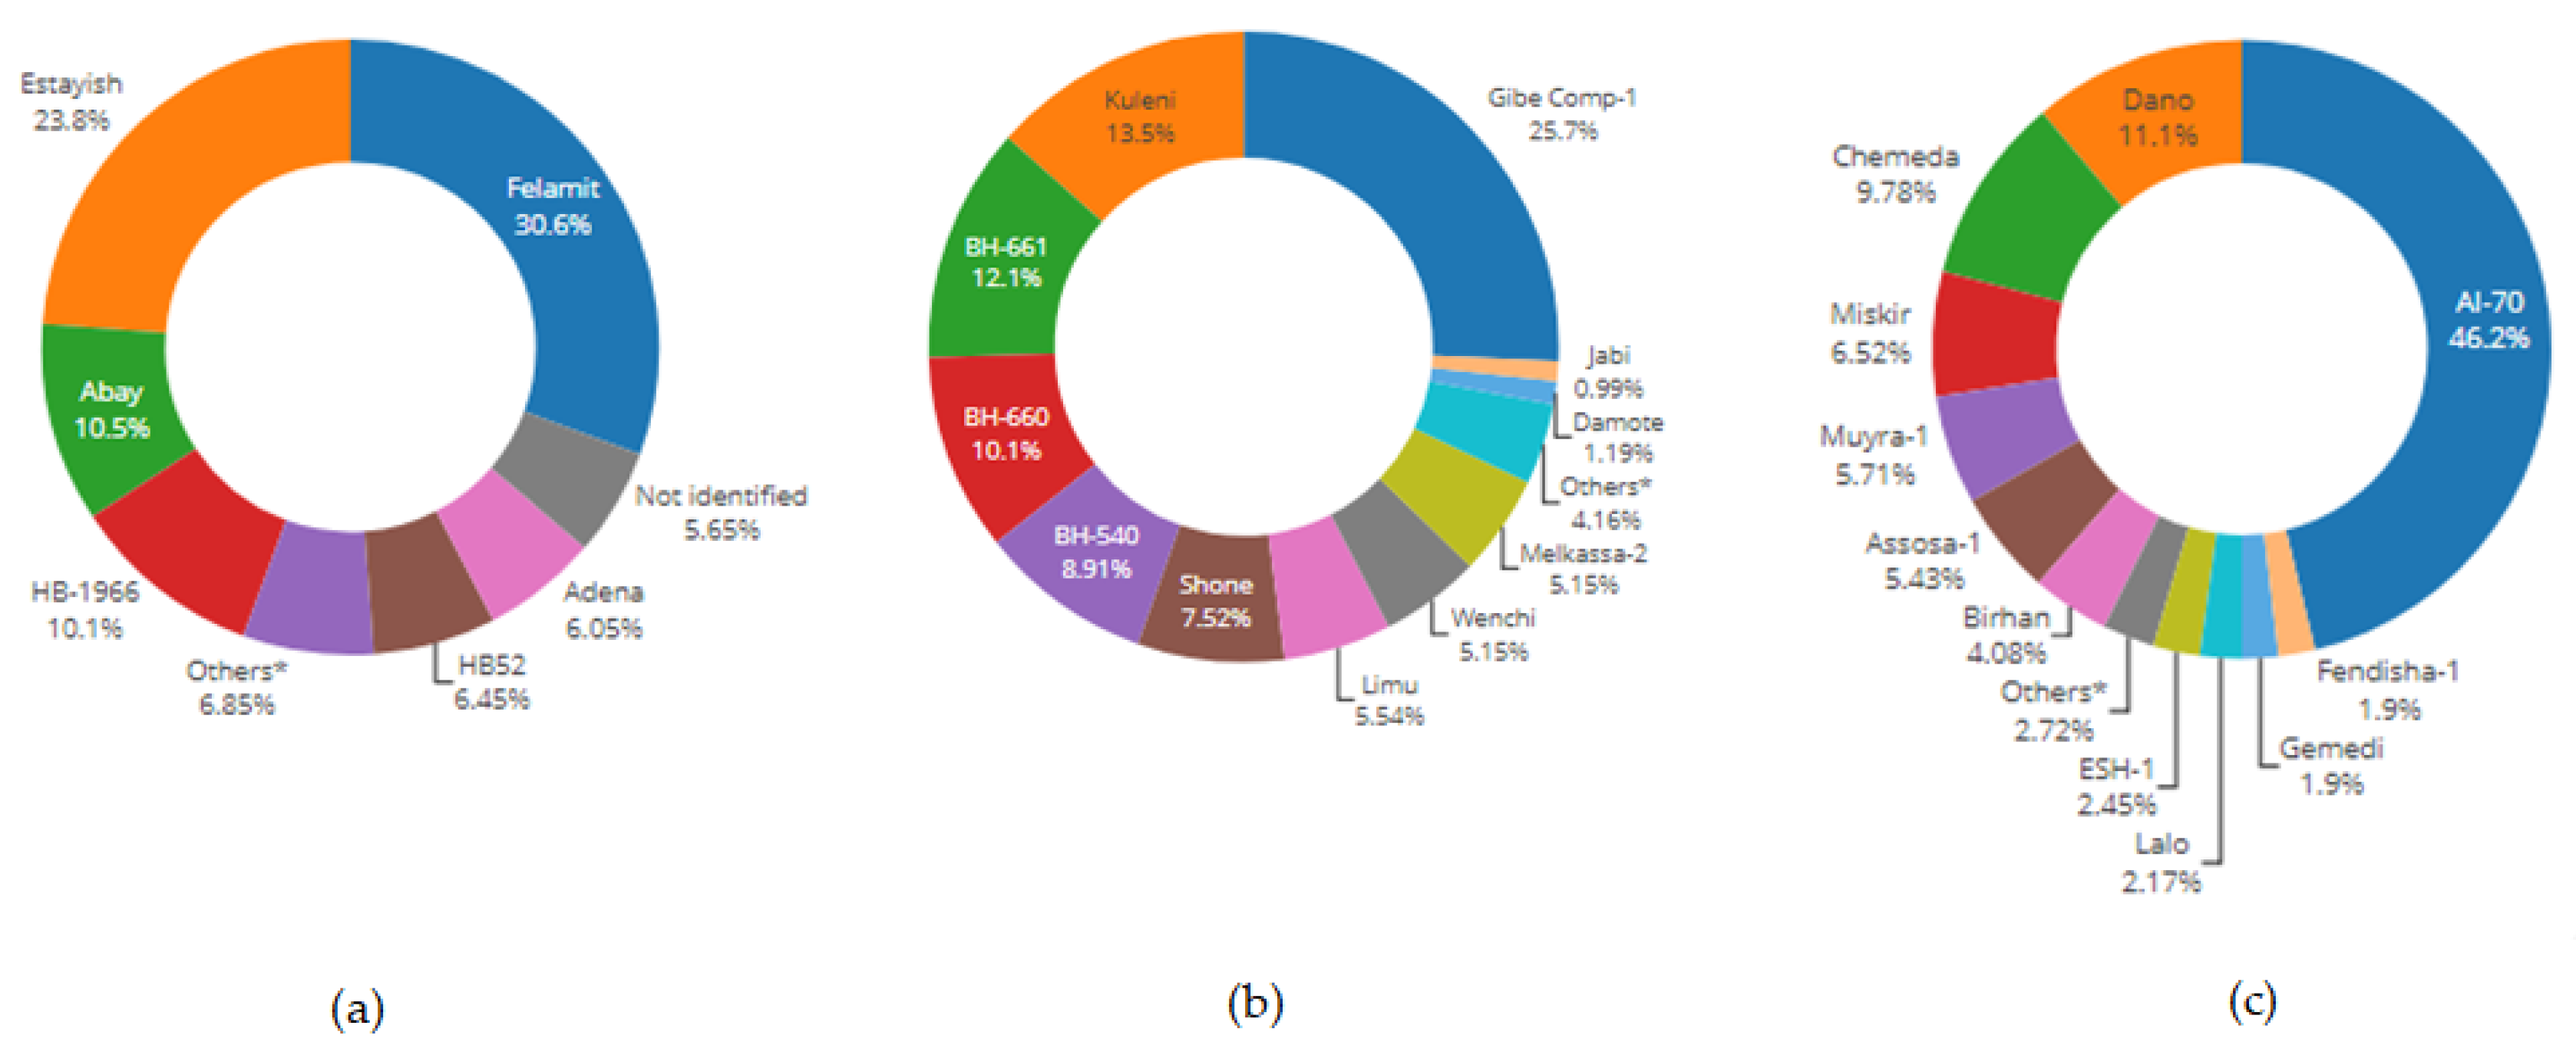
Figure 2 provides the distribution of varieties identified per crop.
The ESS survey questionnaires collected along the DNA fingerprinting data are available in open access [
11]. The post-planting questionnaire collected plot and crop-level data such as area measurements, inputs, and farming management practices. The post-harvest questionnaire captured harvest, crop damage, post-harvest management and utilization. Household, community and geospatial datasets are also available. It is, finally, worth noting that the ESS dataset is georeferenced at the EA level and additional data sources can be merged by location.
3. Methods
3.1. The Ethiopian Socioeconomic Survey (ESS)
The Ethiopian Socioeconomic Survey (ESS) is a household panel survey integrated with the CSA’s Annual Agricultural Sample Survey (Central Statistics Agency, 2017). The ESS uses a two-stage probability sample: the first stage entails selecting primary sampling units, or CSA enumeration areas (EAs), from the AgSS sample of 1600 EAs. The ESS 2018/19 data were collected in 565 EAs, of which 316 are rural and 219 are urban. In the second stage, 12 households were selected randomly in each rural EA from a complete listing of households. The data are representative, at the regional level, for the most populous regions of the country. A more detailed description of the ESS4 is available in the basic information document [
11]. The ESS surveys datasets are in the global public domain [
12].
3.2. Crop Sampling
The ESS performs crop-cuts on 21 annual crops such as cereals, legumes and oilseeds. In each EA, plots grown by the ESS households during the agricultural season are listed. Crop-cut plots are then randomly selected for up to ten plots per crop. The selection of crop plots gives priority to pure stand fields: mixed stands (or intercropped) plots will not be selected if there are at least ten pure stand plots available in the listing. When the farmer is ready to harvest, enumerators implement the crop-cut procedure. Following measurements of the plot boundaries with a meter, a 4 × 4 m quadrant was randomly selected within the plot [
13]. All crops located within the 16 m
2 quadrant were harvested with the fresh weight recorded with scale. The crop dry weight was recorded after two weeks.
For the purpose of identifying crop varieties with DNA fingerprinting, the ESS 2018/19 included an additional crop sampling protocol for barley, maize and sorghum plots in the regions of Amhara, Dire Dawa, Harar, Oromia, SNNP, and Tigray. In 197 selected EAs, enumerators were provided with barcoded cotton bags to collect 200 g of grains from the quadrant. Enumerators undertook training sessions that lasted approximately three weeks in August 2018. The procedure for crop sampling and barcode scanning was demonstrated to supervisors and enumerators during this training.
Because crop sampling needed to be performed when the farmer harvested the crop, enumerators lived in the EA for the entire survey period from September 2018 to May 2019. Crop cuts were conducted from September to December 2018. The ESS section on harvest amount (Section 9a) was fielded with either the post-planting (September to December 2018) or post-harvest agriculture questionnaires (January to March 2019), depending on harvest timing. The ESS 2018/19 was entirely collected in CAPI (Computer Assisted Personal Interviewing) using Survey Solutions [
14]. The crop sample barcode ID was scanned and recorded in the ESS section on harvest amount (Section 9a) to allow matching with the ESS dataset.
The data were collected with resident enumerators who were fluent in both English, Amharic and other local languages. One enumerator was assigned for each EA. The enumerator conducted the interviews, measured the land, conducted crop cutting and collected crop samples. Field supervisors provided field-level coordination and supervision. One field supervisor was assigned to monitor the work of up to three enumerators. The crop samples data collection was also remotely supervised with data continuously uploaded to the server. Data collection resulted in a total of n = 1122 samples obtained (n = 249 barley, n = 505 maize and n = 368 sorghum), representative at the household level across major growing areas (
Table 2).
3.3. Reference Library
Crop variety DNA fingerprinting consists of matching the genetic material extracted from a collected sample with its closest genetic profile in a reference library. To reliably identify improved varieties, the reference library must be constituted from released improved varieties that can conceivably be found in the landscape surveyed.
For maize, the reference library for Ethiopia was previously compiled under a previous CIMMYT/EIAR DNA fingerprinting research project [
15]. All improved maize varieties released in Ethiopia were included in the reference library. As there were no readily available reference libraries for barley and sorghum, we compiled collections of breeders’ seed from the Ethiopian Institute of Agricultural Research (EIAR) and its regional centers. The reference library comprised 41 of the 46 food barley varieties released and 17 of the 19 malt barley varieties released in Ethiopia since 1990. The maize reference library was sourced from an ongoing EIAR-CIMMYT project and comprised 40 improved varieties and 14 maize parental lines. For sorghum, a total of 29 varieties were included in the reference library including all varieties that are still under production by EIAR. A list of varieties is available in
Supplementary File for the three crops.
3.4. DNA Extraction and Genotyping
Grain samples were ground to flour (50 mg) and DNA was extracted in ILRI’s laboratory in Addis Ababa. The task was completed in three months using Qiagen DNeasy plant mini kits (250) according the manufacturer’s instruction. The concentration of the extracted DNA was adjusted to 50–100 ng/µL and 30 µL was loaded onto 96-well plates and shipped to Australia for genotyping using the DArTseq platform sequencing technologies (Diversity Array Technology). The DArTseq platforms use a combination of proprietary complexity reduction methods and next-generation sequencing platforms [
16,
17]. For each sample, approximately 200,000 fragments of DNA are sequenced while matching relies on approximately 50,000 DArTseq markers. The following DArTseq services were used for DNA fingerprinting: Barley Varietal ID and Purity (1.0), Sorghum DArTseq PH (1.0) and Maize DArTseq PN (1.0).
4. Technical Validation
Data were collected by resident enumerators. The listing and random selection of crop-cut plots were recorded on Survey Solutions to ensure that the survey procedure was adhered to. Enumerators were extensively trained in determining the location of the random 4 × 4 m quadrant in the field selected for crop-cutting. Constraints were embedded in the Survey Solution questionnaire to guarantee sample collection in the selected EAs.
Ensuring sample traceability along the chain is an important requirement. Using the survey architecture provided by Survey Solution, barcodes were tracked along the chain, from EAs to CSA field offices in the regions, and then to the CSA headquarters in Addis. Only a few samples (n = 12) went missing and could not be recovered. Improved materials used for the reference library were similarly recorded with the origin and date of sample collection.
Grain samples were grounded using a grinding machine. To avoid cross contamination, between samples, the grinding machine and the bench were cleaned using brush and tissue and, finally, with 70% ethanol. The quality and the concentration of the extracted DNA samples was checked using gel electrophoresis and Nanodrop spectrophotometry (DeNonix DS-11 FX model), and was adjusted to 50–100 ng/µL before shipment. After adjusting the concentration, 30 µL of each sample was aliquoted into 96 well semi-skirted plates and shipped along with the sample tracking file, which indicated each sample position on the plate well. Once they arrived in Australia, all genomic DNA samples were tested by 0.8% gel electrophoresis in TAE buffer and genotyping was conducted only when the samples met the minimum standard. Libraries generated with the methods of complexity reduction as per the DArT PL product definition were also quality controlled on agarose gels (1.2%), and all those matching the expected fragment size distribution were pooled for sequencing on Hiseq2500 (Illumina). Sequencing data quality was tested using DArT PL’s proprietary script and final data quality was evaluated by the use of technical replication of approximately 10% of the samples in analysis.
Data were collected by resident enumerators. The listing and random selection of crop-cut plots were recorded on Survey Solutions to ensure that the survey procedure was adhered to. Enumerators were extensively trained in determining the location of the random 4 × 4 m quadrant in the field selected for crop-cutting. Constraints were embedded in the Survey Solution questionnaire to guarantee sample collection in the selected EAs.
Author Contributions
F.K. supported the survey conception, training, data collection, processing, and quality control of the DNA fingerprinting data documented here. F.K. wrote the data paper. A.A. and A.H.T. supervised the design, data collection and quality control of the Ethiopian Socioeconomic survey 2018/19, and edited the data paper. A.T.N. supervised DNA extraction and edited the data paper. J.C. led varietal identification analysis and A.K. performed DNA quality control and supervised genotyping with DArTseq platforms. The Central Statistics Agency designed the sampling frame, implemented data collection and performed quality control. All authors have read and agreed to the published version of the manuscript.
Funding
This research was funded by CGIAR SPIA and the Bill & Melinda Gates Foundation through the Strengthening Impact Assessment in the CGIAR (SIAC) program (grant number OPP1009472).
Institutional Review Board Statement
Not applicable.
Informed Consent Statement
Not applicable.
Data Availability Statement
Acknowledgments
The authors are grateful for the perseverance of the management and data collection teams from the Central Statistics Agency of Ethiopia, in particular, Biratu Yigezu, Amare Legesse, Habekiristos Beyene, and Abdulaziz Shiffa. We thank Tigist Getachew and Nebiyat Woldeyohannis for performing DNA extraction. We also express our appreciation to Kindie Tesfaye, Berhane Lakew, Abay Fetien, and Taye Tadesse, for providing access to reference library materials. We thank two anonymous reviewers for helping improve the manuscript.
Conflicts of Interest
The authors declare no conflict of interest.
References
- Evenson, R.E.; Gollin, D. Assessing the impact of the Green Revolution, 1960 to 2000. Science 2003, 300, 758–762. [Google Scholar] [CrossRef] [PubMed]
- Walker, T.S. Validating adoption estimates generated by expert opinion and assessing the reliability of adoption estimates with different methods. In Crop Improvement, Adoption, and Impact of Improved Varieties in Food Crops in Sub-Saharan Africa; CGIAR Consortium of International Agricultural Research Centers and CAB International: Montpellier, France, 2015; pp. 406–419. [Google Scholar] [CrossRef]
- Kretzschmar, T.; Mbanjo, E.G.N.; Magalit, G.A.; Dwiyanti, M.S.; Habib, M.A.; Diaz, M.G.; Hernandez, J.; Huelgas, Z.; Malabayabas, M.L.; Das, S.K.; et al. DNA fingerprinting at farm level maps rice biodiversity across Bangladesh and reveals regional varietal preferences. Sci. Rep. 2018, 8, 14920. [Google Scholar] [CrossRef] [PubMed]
- Kosmowski, F.; Aragaw, A.; Kilian, A.; Ambel, A.; Ilukor, J.; Yigezu, B.; Stevenson, J. Varietal identification in household surveys: Results from three household-based methods against the benchmark of DNA fingerprinting in southern Ethiopia. Exp. Agric. 2019, 55, 371–385. [Google Scholar] [CrossRef]
- Wineman, A.; Njagi, T.; Anderson, C.L.; Reynolds, T.W.; Alia, D.Y.; Wainaina, P.; Njue, E.; Biscaye, P.; Ayieko, M.W. A Case of Mistaken Identity? Measuring Rates of Improved Seed Adoption in Tanzania Using DNA Fingerprinting. J. Agric. Econ. 2020, 71, 719–741. [Google Scholar] [CrossRef]
- Hodson, D.P.; Jaleta, M.; Tesfaye, K.; Yirga, C.; Beyene, H.; Kilian, A.; Carling, J.; Disasa, T.; Alemu, S.K.; Daba, T.; et al. Ethiopia’s transforming wheat landscape: Tracking variety use through DNA fingerprinting. Sci. Rep. 2020, 10, 18532. [Google Scholar] [CrossRef]
- Poets, A.; Silverstein, K.; Pardey, P.; Hearne, S.; Stevenson, J. DNA Fingerprinting for Crop Varietal Identification: Fit-for-Purpose Protocols and Their Cost and Analytical Implications; Standing Panel on Impact Assessment (SPIA): Rome, Italy, 2020. [Google Scholar]
- Kosmowski, F.; Alemu, S.; Mallia, P.; Stevenson, J.; Macours, K. Shining a Brighter Light: Comprehensive Evidence on Adoption and Diffusion of CGIAR-Related Innovations in Ethiopia; CGIAR: Montpellier, France, 2020. [Google Scholar]
- Abay, K.; Bevis, L.E.M.; Barrett, C.B. Measurement Error Mechanisms Matter: Agricultural intensification with farmer misperceptions and misreporting. Am. J. Agric. Econ. 2019, 103, 498–522. [Google Scholar] [CrossRef]
- Kosmowski, F.; Alemu, S.; Mallia, P.; Stevenson, J.; Macours, K. Supplementary Materials for Report “Shining a Brighter Light: Comprehensive Evidence on Adoption and Diffusion of CGIAR-Related Innovations in Ethiopia.”; Inter-University Consortium for Political and Social Research: Ann Arbor, MI, USA, 2020. [Google Scholar] [CrossRef]
- Central Statistics Agency; World Bank. Ethiopia Socioeconomic Survey (ESS) Wave Four (2018/2019) Basic Information Document Ministry of Agriculture National Strategy for the Development of Statistics; Central Statistics Agency & Living Standards Measurement Study (LSMS): Addis Ababa, Ethiopia; World Bank: Washington, DC, USA, 2020.
- World Bank. The Ethiopian Socioeconomic Survey. 2020. Available online: https://www.worldbank.org/en/programs/lsms/initiatives/lsms-ISA#2 (accessed on 15 March 2021).
- Central Statistics Agency; World Bank. Crop Cutting Manual; Central Statistics Agency: Addis Ababa, Ethiopia; World Bank: Washington, DC, USA, 2013.
- World Bank. Survey Solutions CAPI/CAWI Platform: Release 4 January 2020; World Bank: Washington, DC, USA, 2018. [Google Scholar]
- BMGF. BMGF Grant. 2015. Available online: https://www.gatesfoundation.org/How-We-Work/Quick-Links/Grants-Database/Grants/2015/11/OPP1118996 (accessed on 11 January 2021).
- Kilian, A.; Wenzl, P.; Huttner, E.; Carling, J.; Xia, L.; Blois, H.; Caig, V.; Heller-Uszynska, K.; Jaccoud, D.; Hopper, C.; et al. Diversity Arrays Technology: A Generic Genome Profiling Technology on Open Platforms. In Data Production and Analysis in Population Genomics; Humana, P., Ed.; Humana Press: Totowa, NJ, USA, 2012; pp. 67–89. [Google Scholar]
- Sánchez-Sevilla, J.F.; Horvath, A.; Botella, M.A.; Gaston, A.; Folta, K.; Kilian, A.; Denoyes, B.; Amaya, I. Diversity arrays technology (DArT) marker platforms for diversity analysis and linkage mapping in a complex crop, the octoploid cultivated strawberry (Fragaria × ananassa). PLoS ONE 2015, 10, e0144960. [Google Scholar] [CrossRef] [PubMed]
| Publisher’s Note: MDPI stays neutral with regard to jurisdictional claims in published maps and institutional affiliations. |
© 2021 by the authors. Licensee MDPI, Basel, Switzerland. This article is an open access article distributed under the terms and conditions of the Creative Commons Attribution (CC BY) license (https://creativecommons.org/licenses/by/4.0/).


 ,
, 

