1. Introduction
Industry 4.0 is changing business models in manufacturing. These technologies can support manufacturing flexibility, efficiency, and productivity through various emerging communication, information, and intelligence technologies [
1]. Industry 4.0 (I4.0) technologies include additive manufacturing, artificial intelligence, Big Data and analytics, blockchain, cloud, industrial internet of things, and simulation [
2].
In both research and industry, it is not yet entirely clear what I4.0 applications as a whole look like and how they might work. For most working in this field, digital transformation and its impact on operational processes remain a big black box. The transformation of manufacturing through technological and paradigmatic drivers is leading to fundamental changes in organizations and processes [
3] as well as in human work [
4]. Technological change also has far-reaching organizational implications and offers the opportunity to develop new business and corporate models and enable greater employee engagement. I4.0 enables continuous productivity and efficient use of resources across the value network. It allows work to be organized in a way that takes into account demographic change and social factors. In this context, the human factor has received particularly little attention to date, even though it plays a central role in four of the eight I4.0 development focus areas (i.e., management of complex systems, safety and security, work organization and design, and training and professional development), as outlined in the seminal I4.0 report by Kagermann, Walster, and Helbig [
5].
I4.0 and technological change are rapidly transforming almost all areas of human life, work, and interaction. These changes are acutely evident in the way human work is organized and performed. The results of the content analysis by Neumann, Winkelhaus, Grosse, and Glock [
6] illustrate the lack of attention paid to the human factor in current I.40 research, which seems to be strongly technology-oriented and only sporadically pays attention to the interaction between humans and systems. To make better and more optimal decisions regarding human resource management in healthcare, we can draw several parallels with manufacturing from a process perspective; organizations collect and process information about employees, their internal policies regarding human resource management, compensation, systematization, performance appraisals, skills, and more [
7].
A common speculation about the future is that machines will take over our jobs and make life more convenient and attractive. Today’s situation shows the exact opposite: people have never been busier than they are today, and much of the credit for this can be attributed to technology. Through information and communication technology, the world has become interconnected. For the economy, this means a significant breakthrough, which is also linked to the automation of production processes.
Automation of production processes is generally expected to reduce the need for direct human involvement in production work [
8]. The risk of automation is mainly in physical activities that are predictable and in cognitive activities such as data collection and processing. In these cases, humans are placed in the role of substituting automation activities to enable the full implementation of these procedures [
9]. Many researchers have addressed the question of what risks individual jobs face with respect to the possibility of automation or the replacement of humans by machines. Frey and Osborne [
10] concluded in their study that 47% of jobs in the US are at high risk of automation in the next two decades. However, a separate survey of workers for these job types found, somewhat more optimistically, that only 9% of jobs in the US are at risk [
11]. Although we could replace mundane and routine tasks originally performed by humans with machines, Autor [
12] points out that operational and work requiring less training and skills are not necessarily the ones most at risk of automation. In this regard, Autor points to various service jobs such as catering, maintenance, health care and security where there is a high level of human interaction and usually a high need for flexibility; such jobs are very difficult or impossible to automate. Chui, Manyika, and Miremadi [
9] found that the main characteristic that makes individual tasks or jobs more susceptible to automation is predictability, which makes manufacturing one of the most vulnerable areas. A study conducted on a sample of more than 800 occupations in the US showed that in manufacturing alone, up to 59% of the jobs currently performed by workers could be automated [
9]. Accordingly, further research shows that the smallest job losses were in retail, at 7%, while the largest losses occurred in manufacturing, where the number of jobs fell by a third [
13].
Although there has been a manufacturing trend in the last century to introduce factories with complete process automation, most are only partially automated, i.e., combinations of automated and manual tasks [
14]. Complete automation of work processes is the degree to which, for example, robots, intelligent manufacturing cells, automated material control systems, and computer control mechanisms are recognized to produce products without human supervision and intervention [
15]. Stevenson [
16] and Satchell [
17] define automation as the replacement of human activities with activities performed by a machine, and Rozman [
18] adds that machines also take control of activities. Automation is when a production system, process, or device or tool performs tasks autonomously and controls itself [
19]. Thurman, Brann, and Mitchell [
20] divide automation into two areas: Mechanization, which refers to the automation of physical tasks, and Computerization, which refers to the automation of cognitive tasks. Automation has the potential to restructure the vast majority of existing jobs and therefore entire work processes [
9]. Advances in technology and process automation are responsible for the trend of disappearance of undemanding, medium paying jobs and the emergence of new, more demanding and better-paying jobs [
21]. The use of Big Data now enables organizations to collect and combine a large amount of data from various sources, organize and store those data, and then analyze them to make the most optimal decisions [
22]. The use of Big Data solutions is not universal and depends on the variability and complexity of the production systems [
23].
To distinguish between more and less automated factories, systems, processes, tasks, and the like, the term “level of automation” (LoA) is used. It is the distribution of physical and cognitive tasks between humans and technology, characterized on a continuum from complete non-automation to complete automation [
24]. Research has only recently begun to focus extensively on measuring the level of automation in production systems. The development of a method for measuring the degree of automation in production systems was pioneered in Sweden in 2004–2007 and was named DYNAMO (Dynamic Levels of Automation) methodology, which proceeds in eight steps [
25].
While the literature mostly mentions only three levels of automation with the two extremes and one intermediate level, partial automation, there are also more detailed levels, e.g., ten levels of automation by Sheridan and Verplanck [
26], who define as the lowest level not the complete absence of automation but a certain degree of human–computer cooperation. Different authors have defined their view of the level of automation. For example, Satchell [
17] defined the level of automation as the cooperation between humans and machines with varying degrees of human involvement. Amber and Amber [
27] defined the level of automation as the degree to which machines replace human influence and control over production processes. Parasuraman and Riley [
28] asserted that it is a scale from manual to completely automated processes. Additionally, Groover [
29] defined automation level as the extent of human control over a machine, which can be completely manual, semi-automated, or completely automated. Ruff, Narayanan, and Draper [
30] also defined three levels of automation. Milgram, Rastogi, and Grodski [
31] defined five levels of automation related to the control of technology and machines in the field of telerobotics. Frohm and colleagues [
32] also proposed two separate LoA scales: the seven-level scale for mechanization tasks and the seven-level scale for computerization tasks. Based on the above taxonomies, we note that authors disagree on the number and descriptions of each automation level. The suspected reason for this is that the authors come from different backgrounds, and the classification of automation levels was done for different reasons (some did not even give a specific definition), taking into account different aspects.
In connection with the automation of production, the term lights-out automation or lights-out production is also mentioned in the literature. Parallel to the general definition of automation, it is a technology that performs certain tasks instead of a worker [
33]. The advantage of lights-out production systems is said to be the ability to produce at night without human presence, which means savings in energy and labor costs, and that workers can focus on more complex tasks during the day [
34]. Due to the savings, Wolfgang et al. [
35] highlighted the potential of night shift automation as a strategic innovation in manufacturing and proposed splitting production into two shifts: a day shift for employees and a night shift for robots only. Löfving et al. [
36] stated that due to the desire to automate evening and night shifts to improve productivity, there is an increasing demand in manufacturing companies for technological solutions that enable a continuous production process without human intervention for at least one whole shift.
Night work is most common in healthcare, industrial manufacturing, mining, transportation, communications, hospitality, and tourism [
37]. Despite the financial and other benefits and special protections that employers are legally obligated to provide, these legal obligations often do not outweigh the reasons for implementing a night shift. These reasons can be divided into three groups: organizational, technical, and economic. In many cases, night work is necessary, especially when the health and safety of the public is at stake (e.g., emergency and health services; hospitals, homes, and similar institutions; firefighters, police, security, and other related services). In these activities, it can be said that there are organizational reasons for night work. Here, services have to be provided continuously, which cannot be solved otherwise than by being on call at the workplace all the time. Technical reasons for the introduction of night work occur most often in manufacturing, metallurgy, and chemical and food industries [
38], where it is usually impossible to stop the operation of equipment or machinery, interrupt a particular process, or perform a particular activity. Economic reasons for introducing night work include any reason that improves the financial situation of the employer. These reasons range from increasing customer orders to maximizing the use of new, more expensive devices or equipment with which to gain a competitive edge. Economic reasons, combined with the negative effects of night work on the health and lives of individuals, are often strongly condemned and described as unjustifiable reasons for introducing such work [
38,
39].
Shift work, especially night shift work, is often associated with various health problems. Numerous studies have shown a strong association between shift work and the occurrence of various diseases and health disorders [
40] and reproductive issues [
41]. This type of work is also associated with the occurrence of occupational accidents [
42]. Night work is a more demanding type of work; therefore, the worker is entitled to special rights and benefits [
43]. Thierry [
44] found that instead of compensation for shift work, it makes more sense to limit or eliminate shift work.
Based on the review of literature and findings, we formulated the following hypotheses:
Hypothesis 1. There is a negative correlation between the level of automation of production processes and the proportion of hours worked by production workers during the night shift (the higher the level of automation, the less night work).
Hypothesis 2. Reducing the amount of night work does not appear to be a key motivator for introducing automation of production processes.
After reviewing the theoretical starting points on automation of production processes and its impact on human night work, we found that the topic is current and deserves the attention of theorists and researchers worldwide. Although the relationship between automation and night work reduction is apparent, this relationship has not yet been empirically investigated. We found no studies on the relationship between the level of automation and the reduction of night work hours, which is an identified research gap. The objective of our study was to determine whether the degree of automation of production processes affects the proportion of night hours worked by production workers and whether employers are willing to automate production processes to achieve a lower proportion of night work.
3. Results
3.1. Demographic Information
Questionnaires were distributed to all companies that met the inclusion criteria, and a response rate of 23.1% (n = 116 companies) was obtained.
Table 1 shows the demographic information of the surveyed companies on night shifts, number of employees in production, and activity by SKD classification.
More than two-thirds of all respondents (n = 79) answered that they had a night shift in production.
It is possible that the invitation to participate in the survey contributed to a slight increase in the number of companies with night shifts. This is because the topic (i.e., automation of production processes associated with night work) was already mentioned in the subject of the email when addressing the participants. In this respect, it is possible that a slightly larger number of companies with night shifts responded to the invitation, even though we invited everyone to participate. We cannot determine whether the sample is significantly different from the population because there are no publicly available databases with data on night work in firms that meet the criteria of our population.
The surveyed firms had an average of 185.6 employees in their production systems, with the firm with the highest number having 1305 employees. If we exclude from the calculation 37 companies from which we did not receive a response, most of the companies, i.e., 77.22%, rank first by the number of employees—namely, from 0 to 249 employees. In second place, 15.19% rank up to and including 499 employees, and only 7.59% of the companies rank up to 1500 employees.
The first five activities that most companies in the sample were engaged in (37 respondents did not answer) were:
C25 manufacture of fabricated metal products, except machinery and equipment;
C22 manufacture of rubber and plastic products;
C23 manufacture of non-metallic mineral products;
C10 food production;
C27 manufacture of electrical equipment.
The remaining ten manufacturing activities that the respondents noted represented 26% of the total structure, while for 13% of the responses, activities could not be defined according to SKD due to overly general responses (e.g., “production”, “assembly”).
3.2. Hypotheses Testing
Hypothesis 1. There is a negative correlation between the level of automation of production processes and the proportion of hours worked by production workers during the night shift (the higher the level of automation, the less night work).
For this purpose, two data elements were analyzed at the level of the individual production system:
the level of automation of the production processes;
the percentage of human/hours worked during the night shift in the production system, relative to the volume of human/hours worked during the entire workday (all 24 h).
The relationship between these two factors was analyzed using Pearson’s correlation coefficient. For each production system, we calculated the level of automation from 1 (fully manual) to 5 (fully automated) and the proportion of night work as a percentage. To do this, for each production system, we collected and evaluated estimates of levels of automation for five or six groups of activities and the proportion of human labor during the day and night shifts for each of these activities.
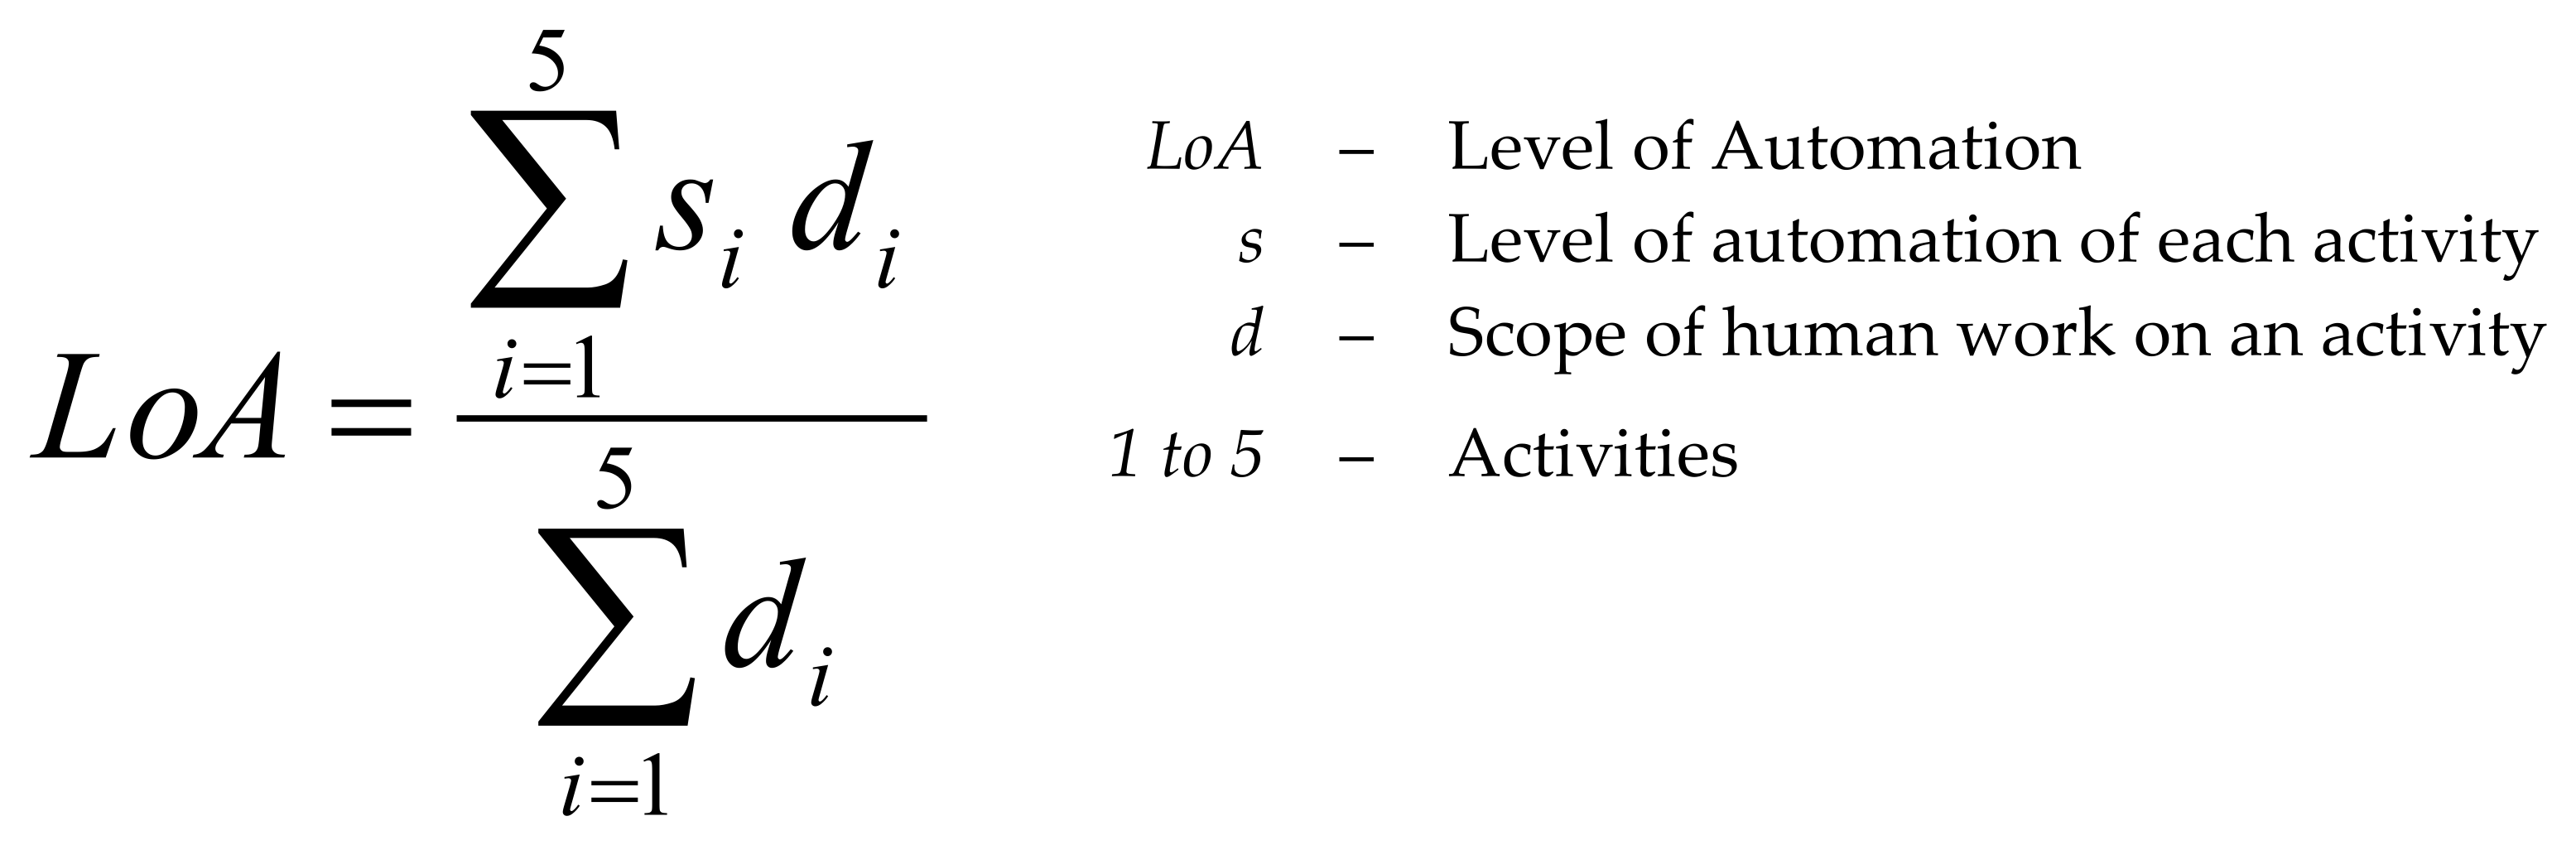
To obtain an overall estimate of the level of automation of production processes in a single system, we could have added the estimates for each activity and divided the obtained number by the number of activities. Such a calculation would give equal weight to all estimates. Consequently, we would have neglected one of the critical arguments we discussed earlier—namely, the very definition of automation, which, in summary, is the replacement of human tasks by tasks performed by a machine. Therefore, we weighted activities that require more human labor higher than those that require less. The reason for this is that it is logical to assume that achieving a certain level of automation with a currently larger volume of human labor requires a more extensive introduction of automation than achieving the same level with a currently smaller volume of labor. Therefore, the individual values at the activity level were weighted by the coefficient of the ratio of human labor in that activity to human labor in the entire production system, and only then was the total value calculated. We formulated this as an equation (see
Figure 1), where LoA is the calculated level of automation, s is the estimated level of automation of each activity, d is the scope of human labor or the number of human/hours worked for a single activity, and the numbers from 1 to 5 denote the individual activities.
We could apply this equation only in cases where we obtained all data for all five activities. None of the estimated levels of automation for a given activity was given a score of 5—fully automated—because for truly fully automated activities, the need for human labor should not occur frequently. Therefore, these ratings were assigned a uniform weighting according to the total number of activities.
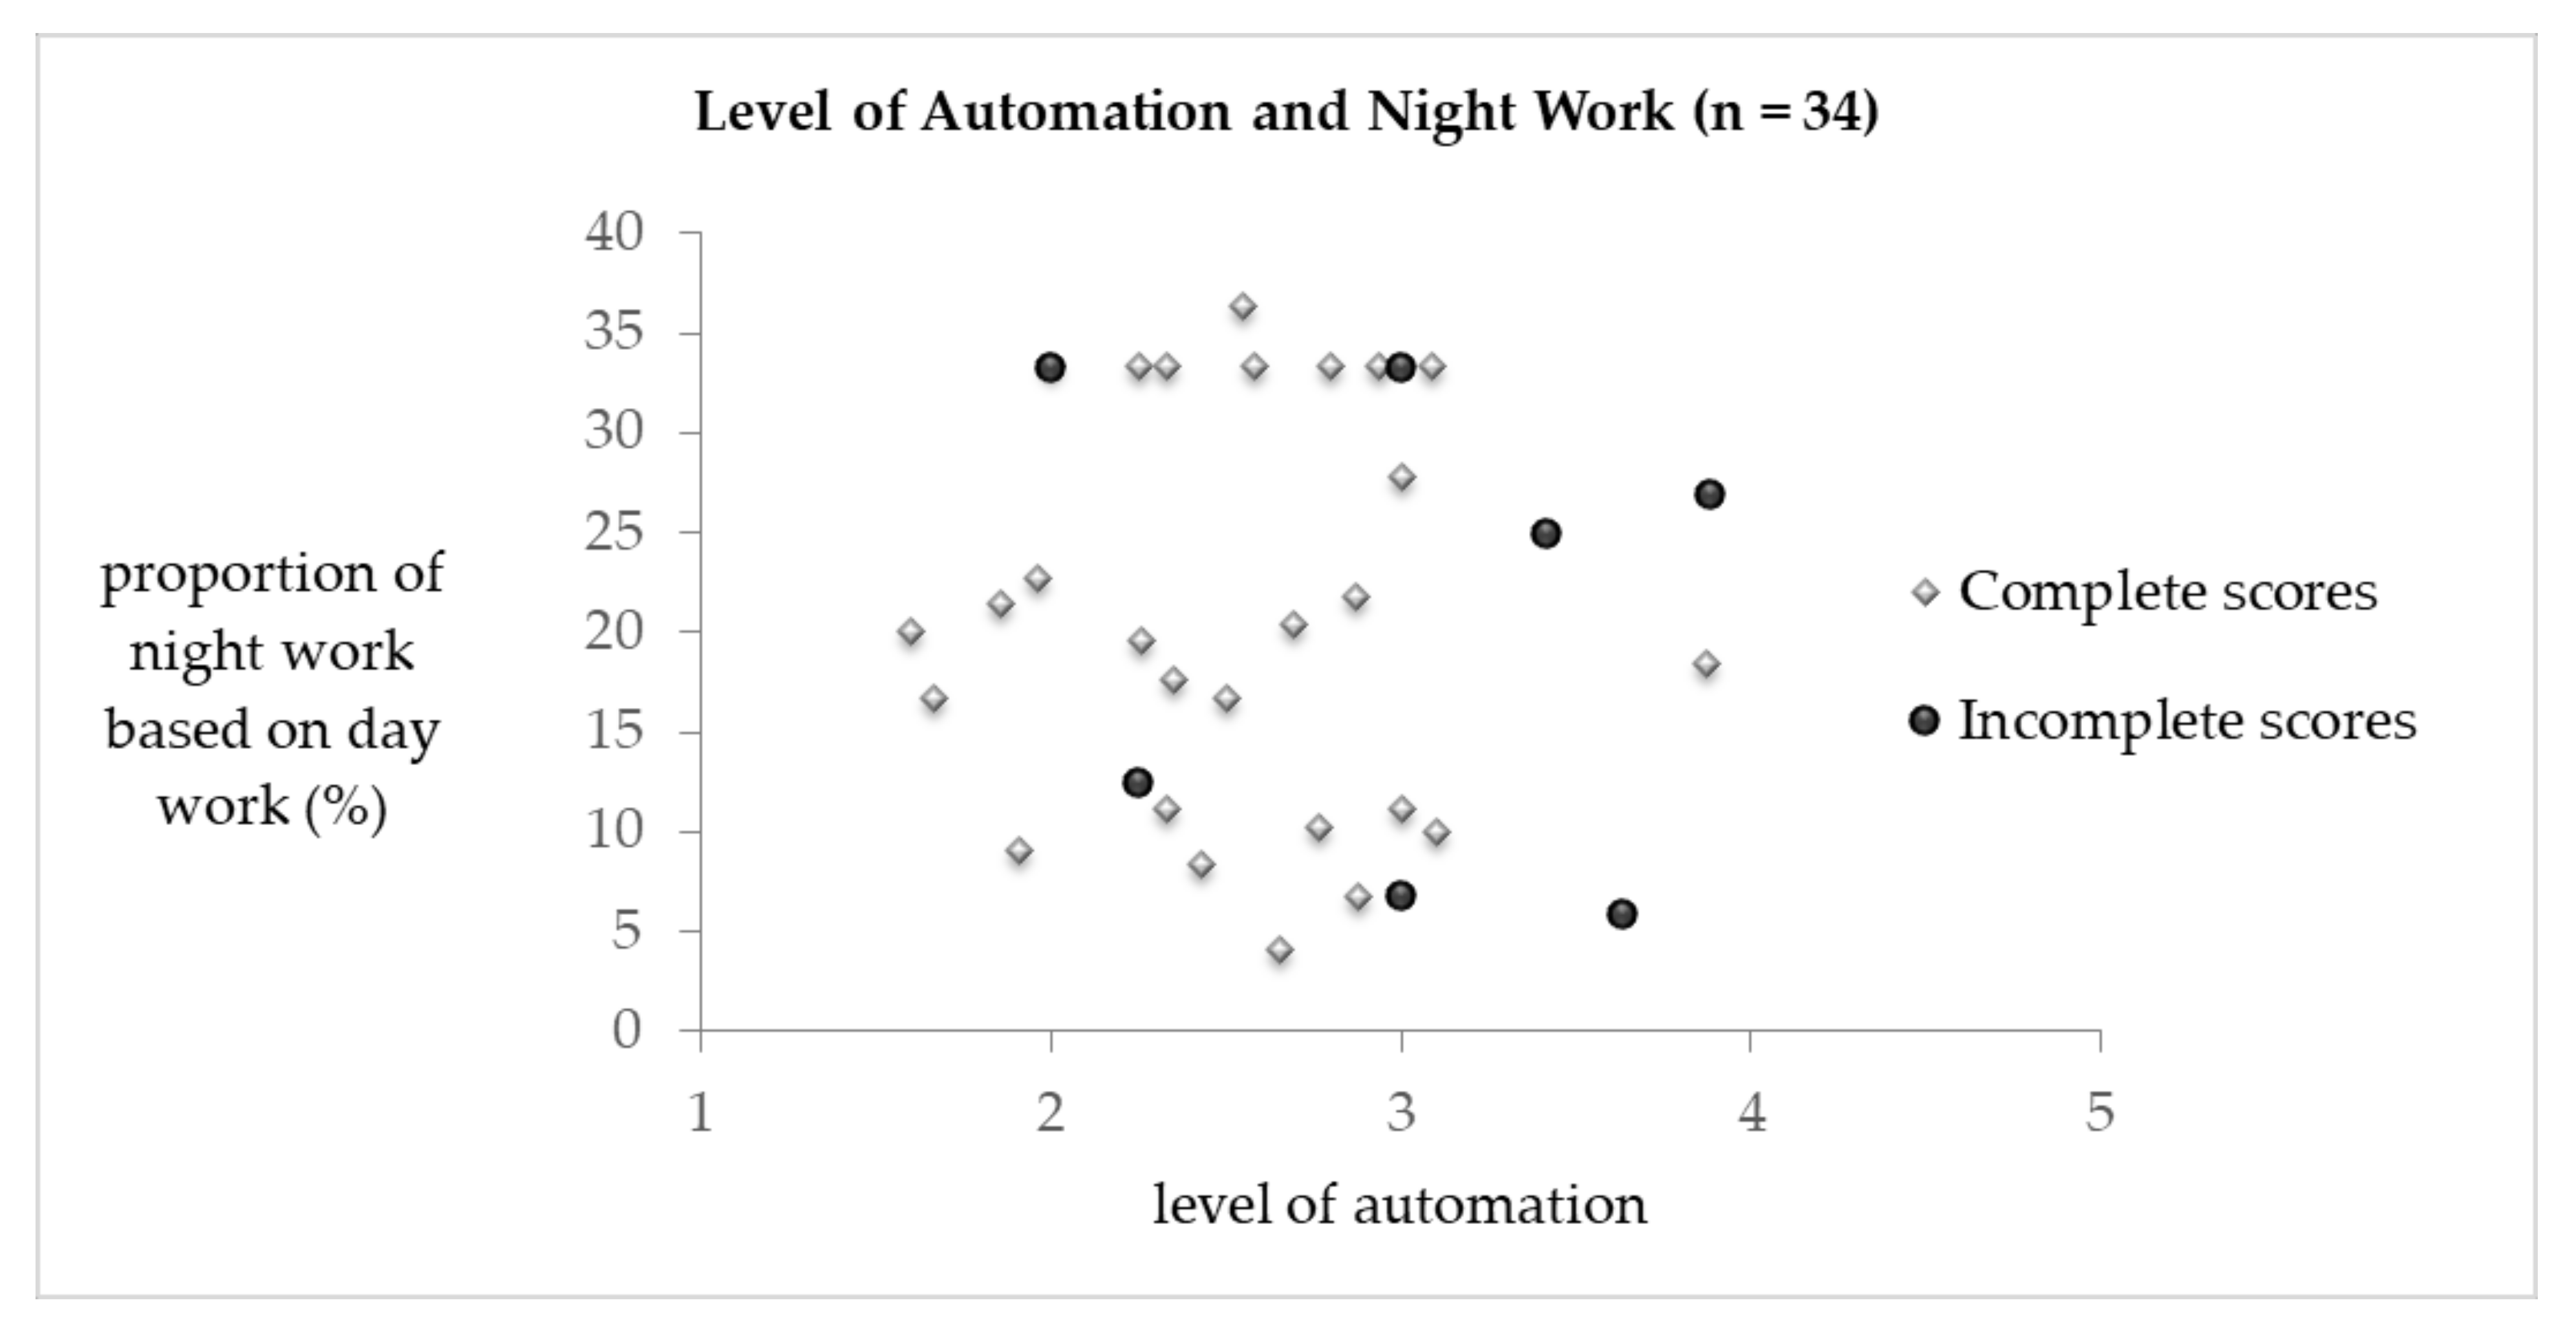
To graph the data and calculate Pearson’s correlation coefficient, we obtained the “complete” scores based on the units in the sample where all required fields were filled in, while we also included “incomplete” scores. The latter were based on items in the questionnaires that were not fully completed (e.g., missing rate information despite the number of hours worked, or vice versa—these activities were excluded from the calculation of the total score) or on certain combinations of answers that were illogical (e.g., indicating a certain amount of human labor despite the assessment that it was full automation). For example, for a score of 5 indicating the amount of human labor, we considered 4.5 instead of 5 because we assumed that respondents wanted to indicate that there was an extremely high level of automation despite human labor, for which a score of 4 (mostly automated) would be too low. Among the incomplete scores, we also included the only case in which one of the activities was rated as fully automated. As described above, we used a slightly adjusted method to calculate the total score.
The following graph (
Figure 2) shows the overall score of the level of automation of each production system relative to the amount of night work for both complete and incomplete scores. Even after a brief observation, it can be assumed that there is no correlation between the factors considered, as the data are scattered throughout the field and a direction of movement is not apparent.
To confirm our assumption, we also calculated Pearson’s correlation coefficient (
r) for both complete and for all scores (i.e., complete and incomplete; see
Table 2).
Both coefficient values have a negative sign, which indicates that it is a negative correlation, and based on our hypothesis, the higher the level of automation, the less night work can be confirmed, but the value of the coefficient needs to be considered with Pearson’s correlation coefficient. In both cases, these are extremely low absolute values, which means a slight correlation. As such, we rejected the hypothesis.
Hypothesis 2. Reducing the amount of night work does not appear to be a key motivator for introducing automation of production processes.
To confirm this hypothesis, two conditions must be met: (1) the motive for limiting shift or night work should not appear as the predominant motive for automating production processes with the remaining responses from the respondents, and (2) the motive of limiting shift or night work should not appear by any of the respondents as the only motive for automating the production processes.
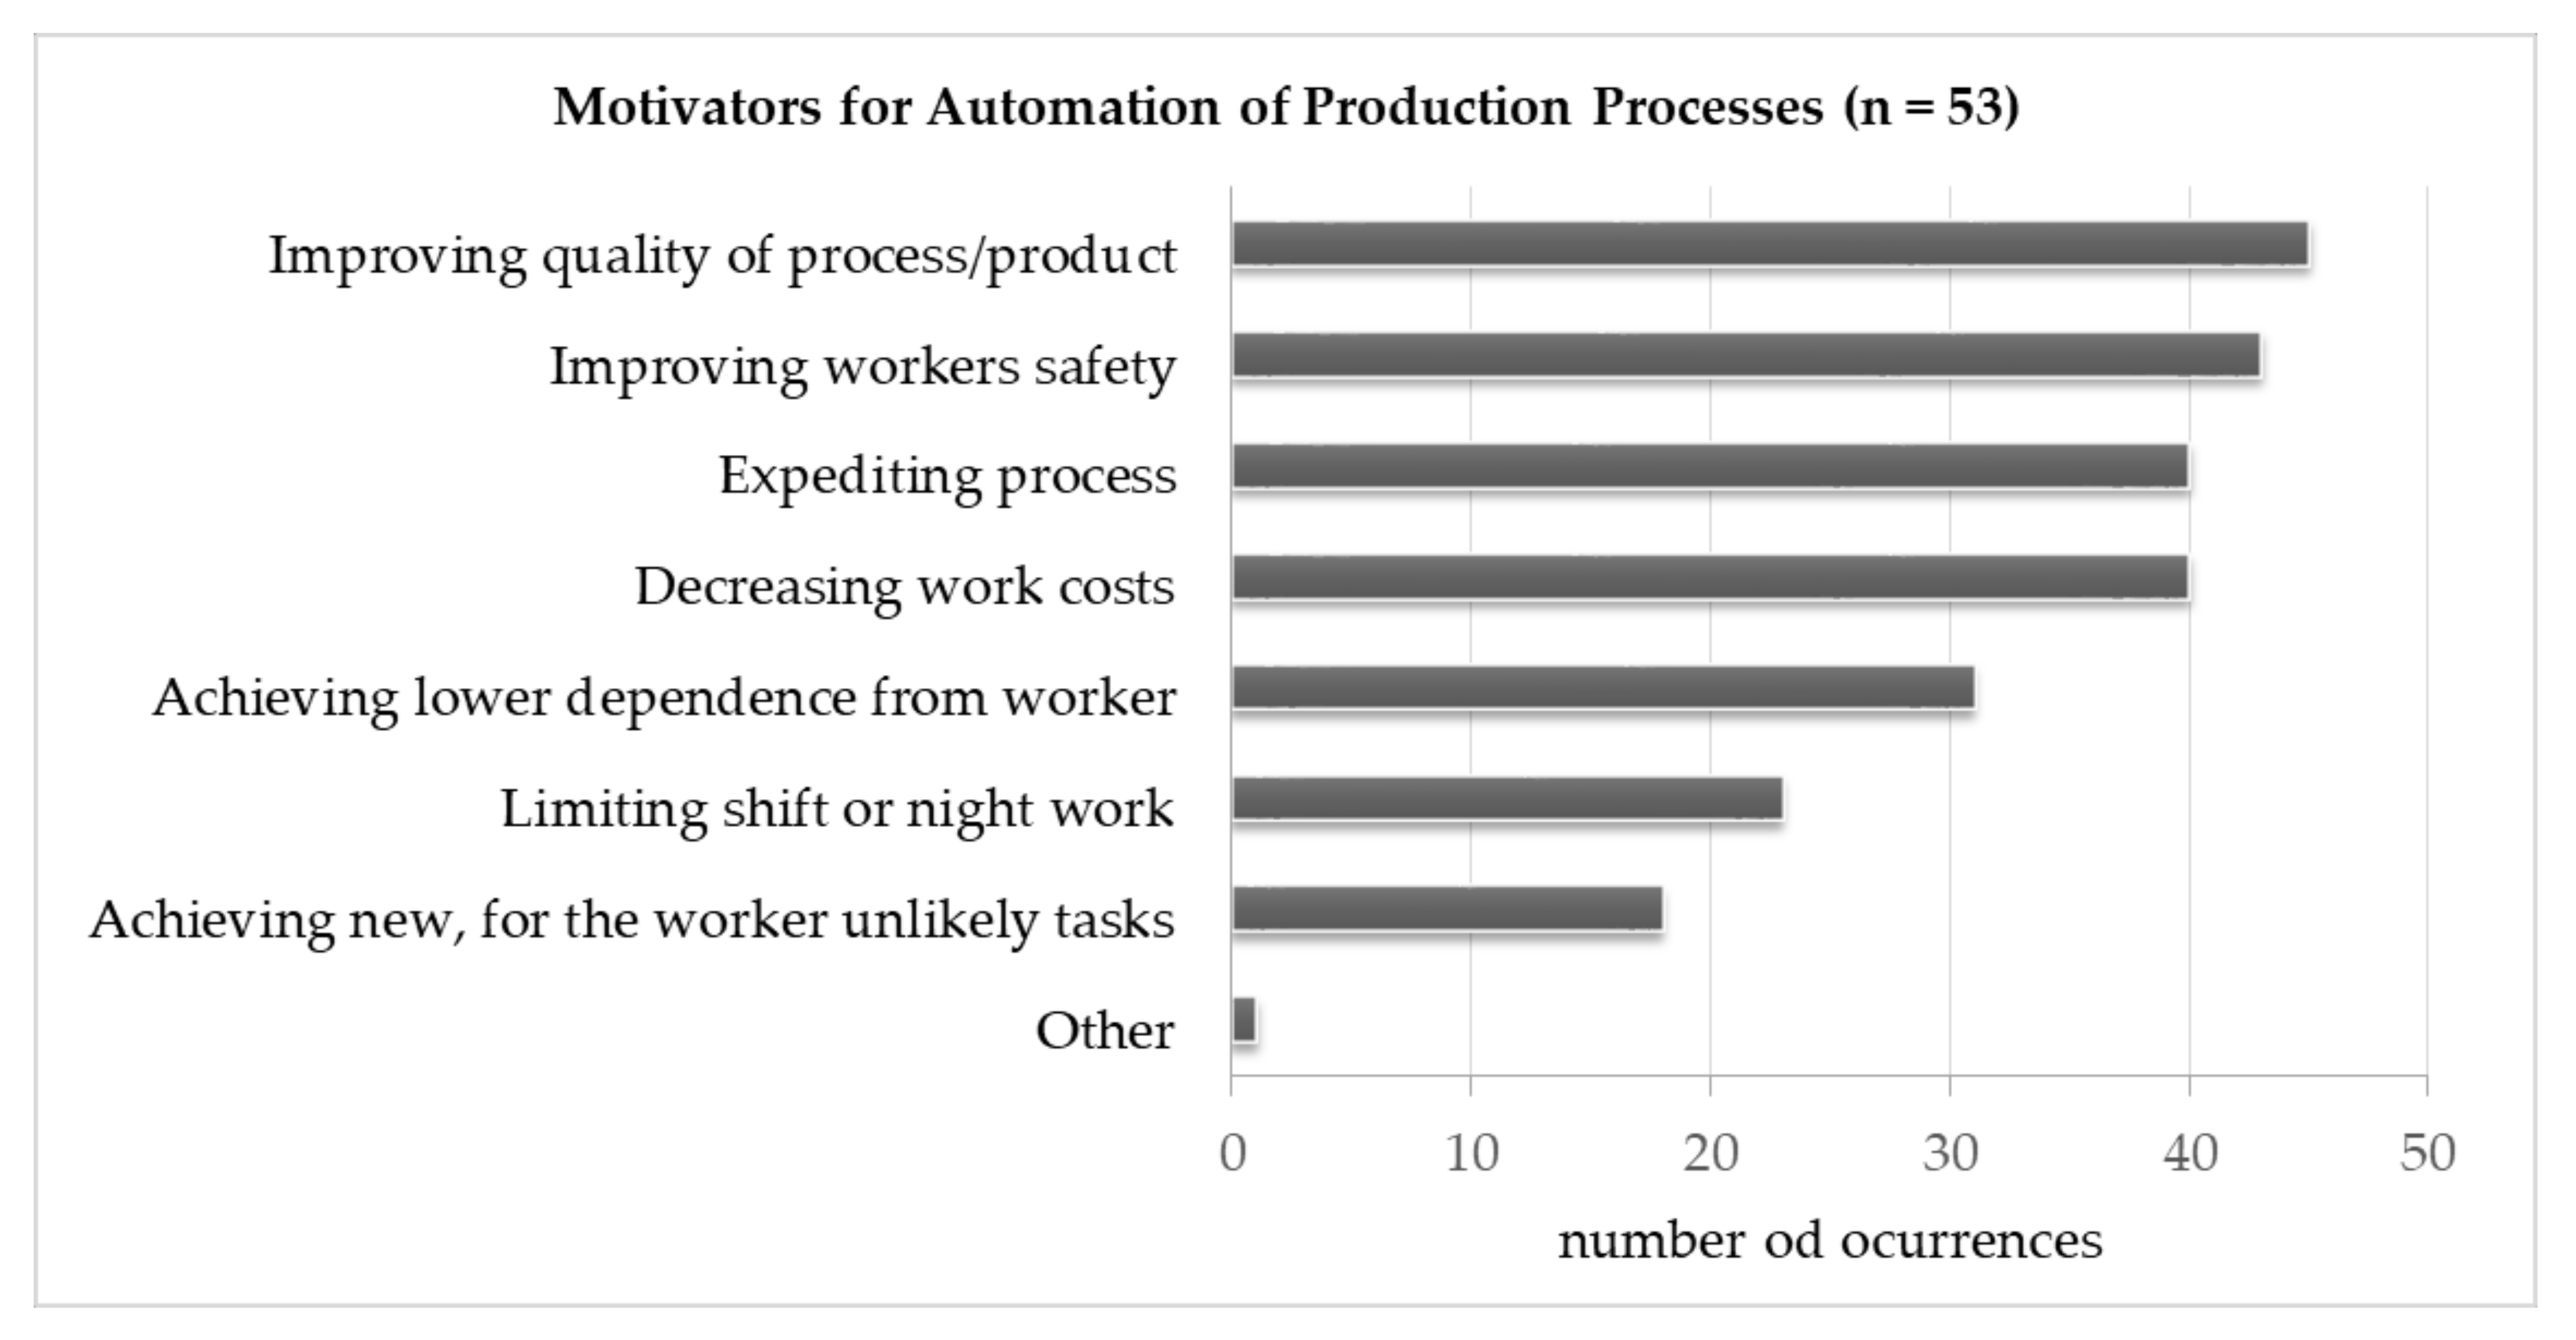
To test this hypothesis, we used the data only from those respondents who answered “Yes” to whether they were currently running a night shift. To the question, where respondents could offer multiple responses or by adding responses, we measured the frequency of motives for the automation of production processes, or in other words, the purposes and goals for which organizations would be willing to invest (or have invested) in automation. The incidence of individual responses is shown in
Figure 3 (where
n is equal to the number of companies responding to this question).
From the results in
Figure 3, we see that the highest frequency of responses regarding top priority or motives for introducing automation in the production system were for improving the quality of the process or product and improving workers safety. These were followed by expediting the process and decreasing labor costs. The motive that interested us the most was limiting shift or night work. According to
Figure 3, limiting night or shift work is a motive that occurs less frequently compared with others, coming almost second to last from “Achieving new, for the worker unlikely tasks”. The motivators on limiting shift or night work in relation to the frequency of indications, therefore, occurred less frequently, thus fulfilling the first condition:
By reviewing individual questionnaires, we also found that the motivator for limiting shift or night work always appears in combination with other motivators or that none of the respondents chose this motivator as the only motivator for automating production processes, thus fulfilling the second condition:
- 2.
A motivator for limiting shift or night work does not appear by any of the respondents as the only motivator for automating production processes.
We can accept the second hypothesis and conclude that the motivator for reducing night work does not appear as a key motivator for automating production processes in Slovenian manufacturing companies.
4. Discussion and Conclusions
The purpose of our study was to determine whether the level of automation of production processes affects the proportion of night hours performed by production workers and whether employers are willing to automate production processes to achieve a lower proportion of night work. A total of 116 companies, or 23.1% of all the companies we contacted, participated in our survey.
To measure the level of automation of production processes, it was first necessary to identify the type of implementation. So far, no attempts have been made to measure the level of automation of production processes, which would lead to a joint assessment of the automation of the production system that could be applied directly. To this end, we developed a method for measuring the level of automation based on five general groups of activities in the production system, estimates of the levels of automation of these activities by production managers, and the amount of human labor. To calculate the overall estimate of the level of automation of production processes in each company or production system, we collected data on the level of automation and the scope of human labor at the level of each group of activities. In addition, we examined another variable, night work, for which we also collected data on the volume at the level of each group of activities.
We could not accept the first hypothesis, which found a negative correlation between the level of automation of production processes and the proportion of night work. Although the calculated correlation coefficient is negative and could confirm the hypothesis, it is too low to indicate a significant relationship. We therefore concluded that the two factors were not related. The second hypothesis was confirmed: Reducing the volume of night work does not seem to be among the main motivators for adopting automated production processes. Thus, we rejected one hypothesis and confirmed the other. If there was, or is, a combination of factors that, to some extent, successfully reduce the volume of night work with the automation of production processes, this would most likely indicate that employers are aware of the potential of automation to limit night work and are using it for this purpose. Thus, limiting night work could emerge as one of the main motivators for automation in manufacturing. This would also mean that in this case, one hypothesis is accepted and the other rejected, which further means that we have placed a slightly contradictory hypothesis at the beginning. Overall, no research has been found by the authors on the impact of automation on reducing night shift work and therefore the issue was determined to be a research gap. However, the results of this study differ from and are similar to the results of published studies that have examined the effects of work process automation and night work. The results of our study are related to the findings of Wang and colleagues [
50] in their study on the effects of information and communication technology (ICT) on individuals. They evaluated 83 empirical studies and identified two categories of factors that moderate the impact of ICT use on work design—namely, (1) user–technology fit factors and (2) social–technology fit factors. Both are critical factors in work design processes in which night work and the role of automation play an integral part. The results of our study also support the findings previously published by Proper et al. [
51], who found that approximately one-fifth of employees in industrialized countries work some form of shift schedule that negatively affects health and increases the risk of illness, and that individuals who are forced to work at a non-standard time (e.g., night shift) that does not coincide with their personal internal clock tend to develop “social jet lag”. On the other hand, Kaasinena [
52] notes that the night shift was less hectic than other shifts and that this was because the lighter work tended to be scheduled at night. The findings of this study are also consistent with findings from other industries such as construction [
53], agriculture [
54], and healthcare [
55], all of which are difficult to automate to reduce night work. Folkard and Tucker [
39] advocated the abandonment of night work and suggested that all the advantages and disadvantages of this form of work should be examined. Weaknesses in health are noticeable, e.g., sleep disorders, cardiovascular disease, metabolic disorders, fatigue [
56], and increased incidence of breast cancer in women [
57]. Nevertheless, based on publicly available statistics, which are briefly presented below, we can conclude that Slovenia cannot expect a significant decrease in night work in the near future. According to the latest Eurostat data from 2020 [
58], 6.8% of workers in the 27 countries of the European Union (EU 27) are occasionally assigned to a night shift, which is 0.8 percentage points less than the average of the previous decade (2010–2019), during which the trend did not change significantly. For workers regularly assigned to night shifts in the EU 27, the data show a slow but somewhat more even decline in night work, from 6.8% in 2010 to 4.5% in 2020. According to the 2020 data, the share of Slovenian workers who occasionally work night shifts is 10.7%, while the share of workers who regularly work night shifts is 7.9%. In the group of workers who occasionally work night shifts, there was a slightly larger decrease in the share of night shift workers in the last year compared with the previous year, similar to the EU 27 by 1.3 percentage points. In the long term, there has been a slight decrease in occasional night work. In the group of employees who regularly work at night in Slovenia, the trend of night work continues to increase slowly on a longitudinal basis, despite the decrease in night work in 2020, in contrast to the EU 27. We have gained new knowledge through empirical research that did not exist before and that is a novelty in this field. With the original findings from the conducted survey, we rejected the assumption that automation of production processes has a direct impact on the proportion of night work.
It would also be useful to investigate why employers do not include the reduction of night shift work among the main motivators for the adoption of production process automation. We have found in this study that these two factors are not related at all. Are employers aware of this, and if so, is the prevalence of this motivator lower? It would be useful for further research to investigate the benefits or positive effects of automation in the opinion and experience of employers.
By reviewing the relevant theory and conducting the study, we concluded that night work is a subjective variable that depends on several other variables that vary from company to company. To gain better insight into possible solutions for limiting night work, it would be useful to design any further research as a qualitative research approach, with the individual production system as the primary research unit.
At the same time, interviews with employers could explore their views on the delegation of night work. Only in this way can we better understand the field of night work as well as where and how it makes the most sense to look for solutions—are they technical (e.g., process automation, as we have assumed in our research), organizational, or managerial priorities and values in terms of financial and non-financial effects.
Research on automated production processes and night work would also help other non-production activities. Nevertheless, this type of work is necessary and unavoidable, such as in health care, trade and commerce, the police, the media, and the military.


