Data Descriptor

Exploring Inner-City Residents’ and Foreigners’ Commitment to Improving Air Pollution: Evidence from a Field Survey in Hanoi, Vietnam

1
Centre for Interdisciplinary Social Research, Phenikaa University, Hanoi 100000, Vietnam
2
Faculty of Economics and Business, Phenikaa University, Hanoi 12116, Vietnam
3
School of Science and the Environment, Grenfell Campus, Corner Brook, Memorial University of Newfoundland, St. John’s, NL A2H 5G4, Canada
4
Forestry Economics Research Centre, Vietnamese Academy of Forest Sciences, Duc Thang, Bac Tu Liem, Hanoi 11910, Vietnam
*
Author to whom correspondence should be addressed.
Submission received: 21 March 2021 / Revised: 5 April 2021 / Accepted: 8 April 2021 / Published: 10 April 2021

Abstract

:
Solutions for mitigating and reducing environmental pollution are important priorities for many developed and developing countries. This study was conducted to better understand the degree to which inner-city citizens and foreigners perceive air pollution and respond to it, particularly how much they willingly contribute to improving air quality in Vietnam, a lower-middle-income nation in Southeast Asia. During mid-December 2019, a stratified random sampling technique and a contingent valuation method (CVM) were employed to survey 199 inhabitants and 75 foreigners who reside and travel within the inner-city of Hanoi. The data comprises four major groups of information on: (1) perception of air pollution and its impacts, (2) preventive measures used to mitigate polluted air, (3) commitments on willingness-to-pay (WTP) for reducing air pollution alongside reasons for the yes-or-no-WTP decision, and (4) demographic information of interviewees. The findings and data of this study could offer many policy implications for better environmental management in the study area and beyond.
Dataset: doi:10.17632/8sv4j2r9wk.2
Dataset License: CC BY 4.0

1. Summary

Air pollution is regarded as a significant public health concern. In 2016, data from the World Health Organization (WHO) showed that 91% of the world’s population resided in places where the air contained dangerous levels of pollutants, exceeding the WHO guideline limits [1]. It is also estimated that roughly seven million people die because of air pollution every year [1]. Strikingly, as noted by [2,3], this number is even higher than the number of deaths caused by the world’s major infectious diseases, such as malaria, AIDS, and tuberculosis.
Not only a dangerous health risk, air pollution is also an economic burden. There is concrete evidence that air pollution reduces labor productivity [4,5] and adversely impacts the tourism industry [6,7]. For instance, He and colleagues used data from 12 manufacturing firms in four Chinese provinces to test the linkages between workers’ output and air pollution levels. They estimated out that daily output decreased by 1% when workers were exposed to a substantial +10 micrograms per cubic meter (μg/m3) of PM2.5 (particulate matter with a diameter of 2.5 micrometers or below), sustained for more than 25 days [5]. The World Bank regards air pollution as “a threat to sustainable prosperity.” The organization estimates that exposure to polluted air caused a loss of $5.11 trillion to the global economy in 2013, an increase of 93.6% from the 1990 level [3]. This loss accounted for roughly 7% of the world GDP, and was equivalent to the combined GDP of India, Mexico, and Canada.
While air quality differs from region to region, citizens in developing countries are more likely to experience severe air pollution than their fellows in advanced nations due to rapid urbanization and industrial economic activities. Brauer and colleagues found that most European and American countries had an average level of PM2.5 below 15 µg/m3, well within the limits recommended by WHO [3,8]. Conversely, the South Asia and East Asia areas recorded disproportionately high PM2.5 levels of 46 µg/m3 and 42 µg/m3, respectively [8]. Consequently, deaths caused by air pollution in East Asia (2.3 million) and South Asia (1.8 million) far exceeded the numbers in other more developed areas such as Latin America (0.18 million) and North America (0.1 million). At the national level, typical East and South Asian countries such as China, Pakistan, India, and Bangladesh all reported a PM2.5 concentration three times higher than the WHO’s limits [8]. Among those four economies, the problem in China was worst (a level of PM2.5 of 54.3), following by Bangladesh (48.3), India (46.7), and Pakistan (46.2).
Vietnam, a Southeast Asian nation, has recently emerged as one of the most dynamic economies in the world. In the 2010–2019 period, Vietnam recorded an average growth rate of 6.31%, among the top 20 fastest-growing economies globally. Accompanying the industrialization and modernization of the economy, Vietnam has faced substantial environmental challenges, as the country has witnessed a quick deterioration of environmental quality. Air pollution is one of the most severe problems; the quality of air in Vietnam has worsened dramatically in recent years. In 2013, the World Bank estimated that the PM2.5 level in Vietnam was 25.5 µg/m3, causing a total of 66,314 deaths and a loss of $23.83 billion to the country’s economy [3]. Five years later, in 2018, IQAir, a Swiss-based company that monitors air quality, ranked Vietnam 17 out of 73 economies in a list of the world’s most polluted countries [9]. The average concentration of PM2.5 in Vietnam reached 32.9 µg/m3 that year, a level at which sensitive individuals could have respiratory symptoms if exposed to polluted air. The downtrend of air quality continued in the following year as Vietnam dropped to 15th place out of 98 countries with the PM2.5 level increased to 34.1 µg/m3 [10].
The air quality in Hanoi, the capital of Vietnam and the country’s second-largest city, is much worse than at the national level due to the high volume of vehicles, construction, energy consumption, and heavy factories located there. In 2018, Hanoi had an average PM2.5 concentration of 40.8 µg/m3, a dangerous level for the general public and especially unhealthy for sensitive groups. IQAir ranked Hanoi 12 out of 62 cities in a list of the world’s most polluted capital regions [9]. The air quality quickly deteriorated further in the following year (2019) to a PM2.5 level of 46.9 µg/m3, making Hanoi the world’s 7th most polluted capital city (out of 85 places) [10]. Another estimation showed that Hanoi had only eight days in 2019 with a PM2.5 concentration lower than 50 µg/m3—the country’s environmental standard [11].
This worsening air quality has progressively become a serious problem affecting Hanoian citizens’ health and well-being. Luong and colleagues studied the relationship between air pollution exposure and respiratory-related hospital admissions among Hanoian children. They found a strong link between the daily admission number and the PM2.5 concentration in the atmosphere: an increase of 10 μg/m3 PM2.5 could lead to a 2.2% rise in hospital admissions [12]. A similar pattern was observed in an earlier study examining the linkages between monthly hospital visits of Hanoi inhabitants aged below 15 or above 60 and the concentration of pollutants in the atmosphere. In the research, Trinh and colleagues determined that the number of visits to the National Geriatric Hospital and National Otorhinolaryngology Hospital (both located in Hanoi) significantly increased in months when the level of pollutants went up [13]. Strikingly, in the last four months of 2019, when the air pollution in Hanoi reached an unprecedented level, the Ministry of Natural Resources and Environment of Vietnam had to warn the general public, and especially sensitive groups, including children, pregnant women, the elderly, and people with respiratory diseases, to restrict outdoor activities and reduce transportations to mitigate the risk from polluted air exposure.
Due to the risk to personal health and the economic loss caused by air pollution, international bodies, environmentalists, and researchers have called for stronger actions to mitigate the negative impacts of polluted air. For instance, the World Bank strongly urged countries to adopt viable plans to reduce air pollution [3]. Hoang and colleagues also advocated more green growth initiatives after showing the high effectiveness of the eco-friendly policies implemented in Kitakyushu, Japan [14]. Some have responded. For instance, China formally declared “war against pollution” in 2014 and released a National Air Quality Action Plan to improve its air quality. Since then, the country has achieved remarkable improvements in air quality as the air pollution in its biggest cities has fallen by between 21% and 42% [15].
In the Vietnamese context, short-term solutions to reduce air pollution have also been proposed, including raising emission standards for new vehicles, banning charcoal stoves, enhancing the monitoring of industrial emissions, and better controlling traffic. With the hope of providing more scientific evidence and useful information for future air pollution reduction initiatives and plans, we conducted this work to learn about inhabitant’s and foreigners’ commitments to improving Hanoi’s air quality.
During mid-December 2019, we surveyed a total of 199 inhabitants and 75 foreigners who lived and traveled within four central districts in Hanoi through a questionnaire-based face-to-face approach. The findings revealed that most inner-city residents and foreigners surveyed are worried about air pollution. Many preventive strategies, such as air purifiers and living at home, are used to reduce the harmful effects of contaminated air, and a large proportion of respondents willingly endorse air safety activities. The level of willingness to pay for air pollution reduction varies between domestic and international respondents. The outcomes of the study offer many insightful implications for a better environmental policy in Vietnam and similar places in the world.
The results presented in this paper are relevant to another data article about Hanoi air pollution [16]. Although both datasets examine Hanoi’s air pollution issue, our dataset differs [16] in three main points. First, the sample frame focuses on the inner-city area while the previous one specialized in suburban districts. Given the different degrees of economic concentration and population density between the two regions, divergent perspectives on air quality are expected. Second, in this outcome, we primarily concentrate on studying commitments and willingness to pay to reduce air pollution by employing a contingent valuation method. This WTP element is not present in [16], where the authors’ main objective was to examine public perceptions and awareness regarding air pollutions. Third, we interviewed foreigners as well as inhabitants to examine how non-residents with short-term living periods and higher financial status perceived and responded to the air pollution issue.

2. Data Description

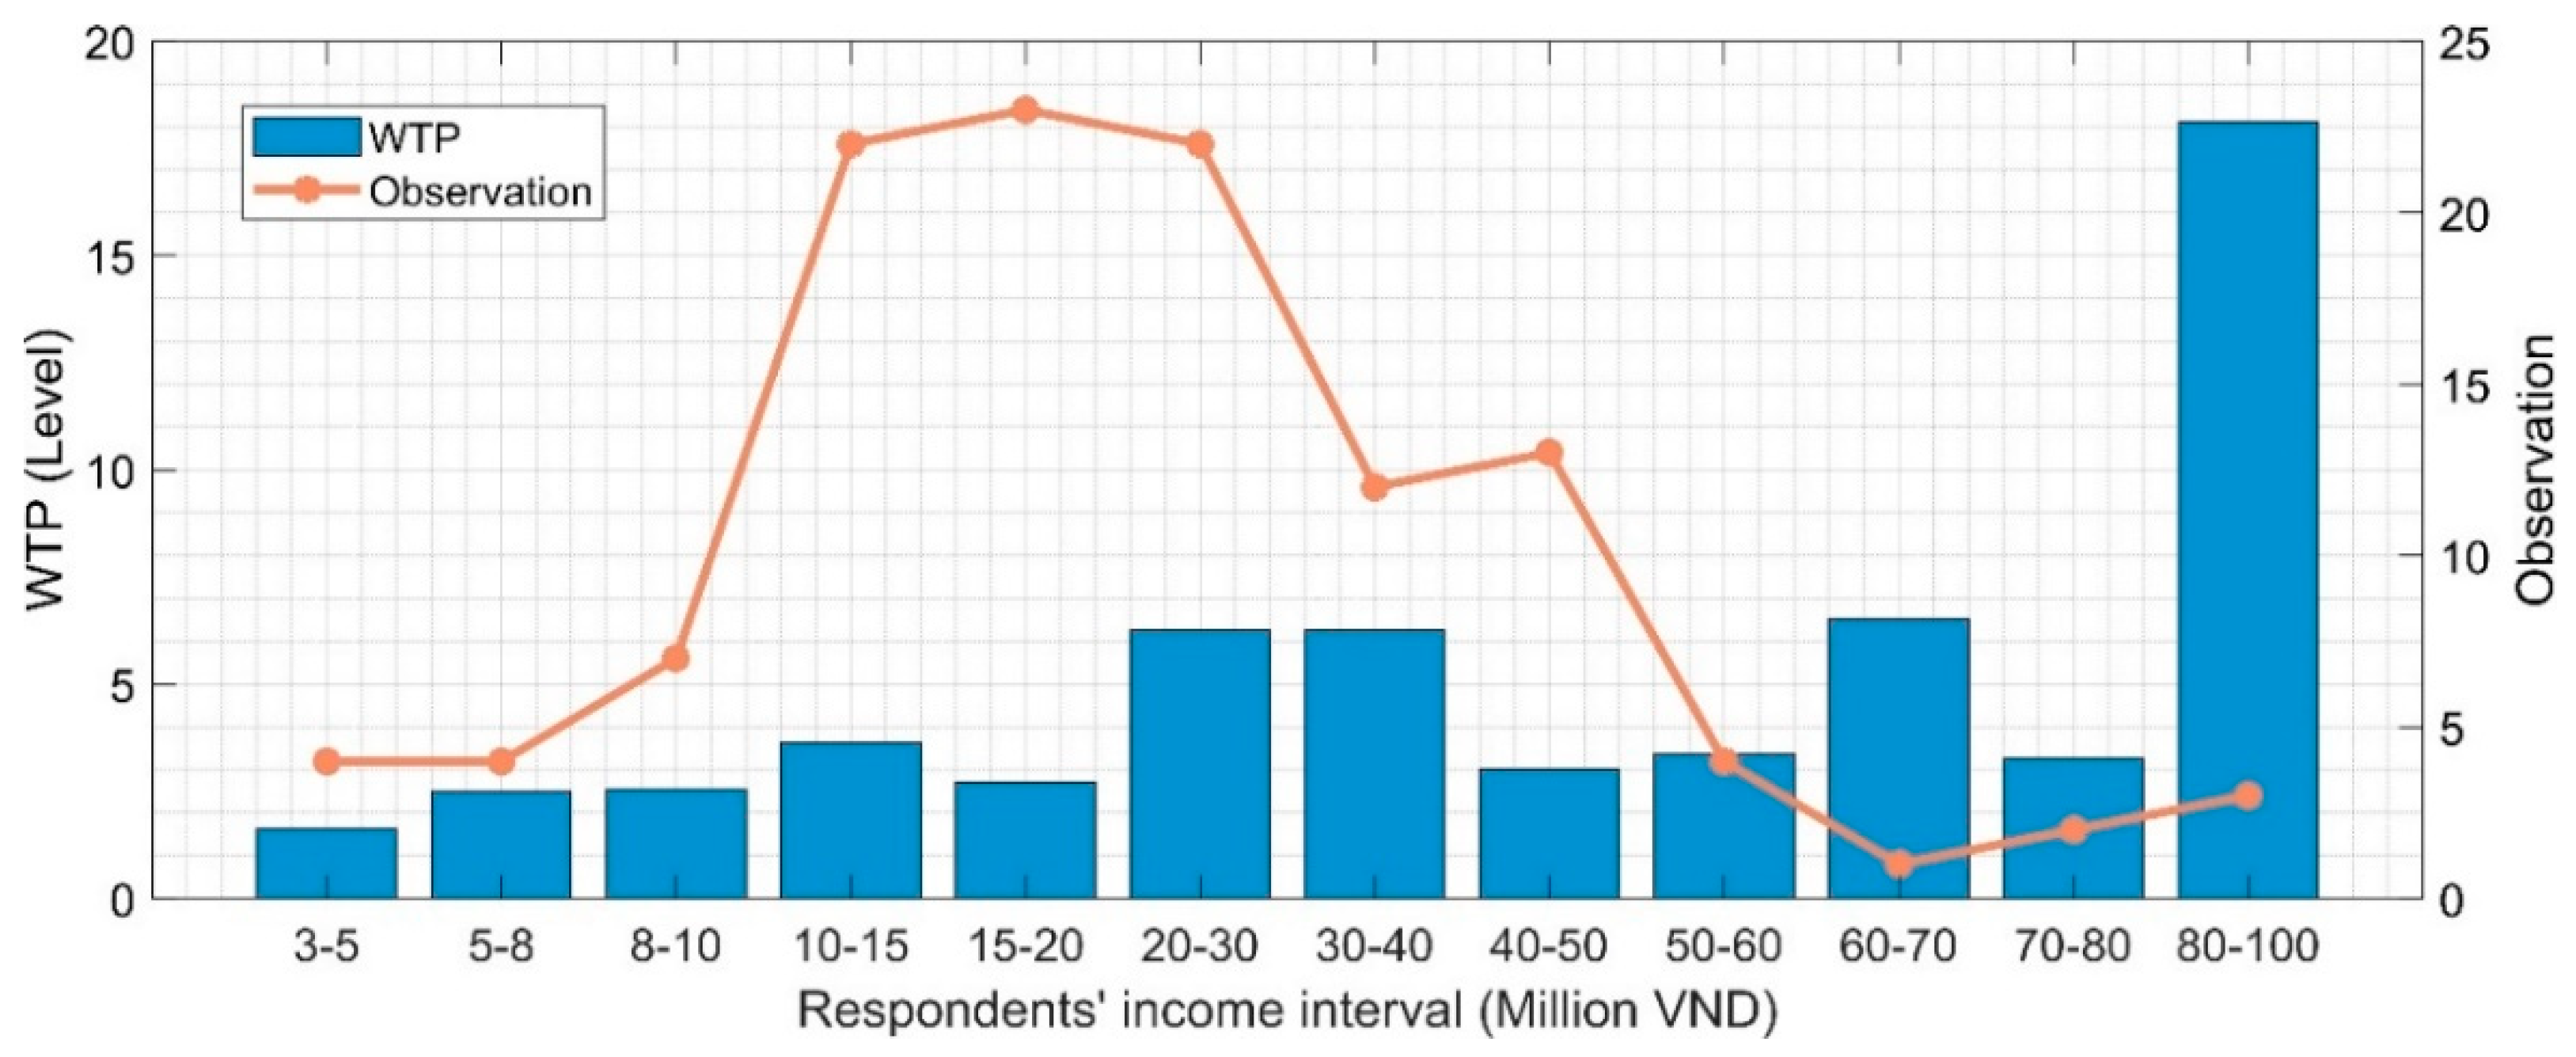
2.1. Willingness to Pay for Air Pollution Reduction among Hanoi’s Residents.

Among the 199 inhabitants surveyed, 49 people were unwilling to pay for air pollution reduction. Among those, 41 provided us a coherent reason that clearly explained their zero WTPs. The remaining nine people who refused did not provide an explanation or ambiguously stated their motivations. For the sake of analysis, we excluded those nine respondents from Table 1 below, which presents a set of reasons for which the inhabitants are unwilling to contribute to the air protection fund.
While numerous previous studies have treated zero WTP responses identically [17], stresses the importance of understanding the underlying motivations behind these responses and differentiating them accordingly. We follow [17] in dividing zero WTP responses into two separate groups: genuine zero motivation group and protest responses group. In the former group, a zero WTP response reflects the respondent’s genuine indifference preferences about air protection activities. In the latter group, the respondent’s decision not to support the fund is simply a reflection of protest behavior. Results from Table 1 show that a large majority exhibited protest behavior, which can be ascribed to various reasons. Among those, the largest number doubted the effectiveness or practice of the fund as they showed strong concerns about government-run funds that can lead to corruption and prodigality (12.1%). Genuine zero WTP responses only accounted for a tiny fraction. Surprisingly, contrary to findings in [17], the financial matter is not stated as a significant obstacle preventing respondents from contributing to the fund.
The next four tables (Table 2, Table 3, Table 4 and Table 5) present the statistics descriptions of willingness-to-pay for air pollution reduction values associated with five major dimensions, including demographic information (Table 2), inhabitants’ perception of air quality (Table 3), severity and impacts of polluted air (Table 4), and respondent’s preventive measures for reducing exposure to air pollution (Table 5). In these tables, we only include inhabitants who were willing to offer a positive contribution to the air protection fund. We also excluded one interviewee who was willing to contribute “more than 1 million VND” per month because this response is an extreme outlier. Consequently, the number of observations in the four tables is frequently 149, but occasionally it is one or two points lower due to a missing data. Furthermore, by using a payment card method to elicit a respondent’s willingness to pay for air pollution reduction, the true WTP values will fall between the respondent’s reported number and the next higher number that appeared on the payment card. Therefore, for the sake of analysis, unless stated otherwise, we reported the lower-bound WTP values in all four tables.
Table 2, below, portrays the relationship between willingness to pay for air pollution reduction and respondents’ demographic factors. The common pattern is that inhabitants who are diverse in age, gender, education, and workplace would support the fund differently. For instance, the financial commitments of males to reducing air pollution are much greater than that of females. This is different from [18] but consistent with [19]. From a household hierarchy perspective, it might be explained by the fact that males normally hold the role of a head of Vietnamese families, which gives them a more decisive voice in financial decisions [20,21].
Regarding correlations between age, education, and WTP values, we observed non-linear relationships since the willingness to pay for air pollution reduction fluctuates across age groups and the highest educational level attained. Still, it seems that relatively old respondents offered fewer financial commitments than their younger counterparts. The finding is in line with earlier studies [22,23,24]. Nevertheless, unlike [23], which found a positive association between family size and respondents’ WTP numbers, we did not find a linear relationship between the size of inhabitants’ families and their willingness to pay for air pollution control since WTP values vary as the number of family members increases.
The relationship between WTP values and respondents’ perceptions of air quality is illustrated in Table 3. The results from Table 3 show that most inhabitants surveyed felt badly about the air quality in their home district and the entire city. On the willingness to voluntarily make financial contributions to reduce air pollution, people with a negative perception of air quality showed a strong tendency to contribute more than those who perceived the normality or positivity of the situation. Additionally, the WTP of interviewees who did experience the deterioration of air quality is much higher than those who did not. Our findings are in line with earlier studies that found that perception of severe environmental pollution in general, and air pollution in particular, is positively correlated with higher willingness to pay to reduce the pollution [24,25,26].
When asked about the satisfaction level of air quality and air protection activities, most people responded with a high degree of dissatisfaction. Additionally, respondents tended to have stronger support for air protection funds when they felt more dissatisfied. Regarding the expectation of air quality in the future, all interviewees hope to see the air quality reach beyond the average threshold, i.e., above 50 points on a 0- (worst) to 100- (best) point scale.
Table 4 depicts the severity of air pollution and illustrates how polluted air has impacted inhabitants’ lives. Since many respondents felt that air quality was bad and was getting worse, as shown in Table 3, it is not surprising that many of them expressed concern or vial concern about the issue. Their willingness to pay for air pollution control is significantly higher than for those without any concern about or interest in solving the problem. A similar pattern is observed when it comes to the impacts of air pollution on respondents’ lives. Many said that the air pollution impacted their lives, and those people were also willing to contribute more to improving air quality. Regarding the level of urgency required to tackle the air pollution problem, a positive relationship exists between the perceived urgency level and voluntary contributions to improve air quality.
When it comes to the impact of air pollution on personal health, respondents whose family members suffered from health problems caused by exposure to polluted air tended to make larger financial contributions to improving the situation, though the difference with the no-health-problem group is not large. A similar result is also documented in [24], where mental health issues were found to be positively associated with higher WTP values.
A list of several preventive measures that respondents have used to reduce air pollution exposure is shown in Table 5. In general, simple but effective methods to avoid air pollution such as buying an air purifier, staying at home more often, or traveling on the weekend are widely adopted by interviewees. Respondents are not ready for more extreme methods such as resettling in a less polluted city or a less polluted country, which is understandable given the difficulties of resettlement plans. Regarding the willingness to pay for air pollution control, there is a common pattern: respondents who adopted preventive measures to protect their health are those who likely have higher WTP numbers. The larger WTP values among respondents who adopted preventive measures to avoid air pollution can be explained by the fact that those people are likely to be more aware of potential harm from air pollution on personal health, thus displaying some types of pro-environment behavior. In this sense, our findings are consistent with those of earlier research, as stronger environmental awareness and pro-environmental attitudes were found to be positively associated with a higher willingness to pay to reduce air pollution [24,25,27].
Concerning the relationship between residents’ financial status and contribution levels, Figure 1 illustrates the willingness to pay associated with the income intervals of 117 inhabitants who explicitly expressed their positive contributions to the air protection fund and were willing to share information about their disposable income. The literature shows that there is a positive correlation between income and WTP [22,23,24]. Our results are no exception. Figure 1 describes that higher-income groups generally tend to offer larger financial commitments to improve air quality than the lower-income groups. In fact, the three groups with the smallest WTP values are those with the lowest monthly income.

2.2. Willingness to Pay for Air Pollution Reduction by Foreigners in Hanoi

We interviewed a total of 75 foreigners in the main tourist attraction districts in Hanoi. Among these 75, 37 people were willing to offer positive financial contributions to improve air quality, while the remaining 38 (50.7%) refused to do so. The rate of zero WTP observations among foreigners is twice as high as that among domestic respondents (24.6%), which seems reasonable given the short periods foreigners tend to spend in the city.
Among the 37 foreigners who expressed a willingness to pay for air pollution reduction in Hanoi, eight people did not provide us hypothetical commitment figures. Therefore, we only have WTP values of the remaining 29. Table 6 presents the stated willingness to pay for air pollution control of these 29 foreigners integrating with five dimensions and or questions, including purpose in Hanoi, perception of air quality, travel again even if Hanoi is in the top 10 of most polluted cities, age, and occupation.
Overall, foreigners’ WTP is much higher than that of domestic respondents, which seems plausible given their relatively higher disposable income. Notably, foreigners who came to Hanoi for work tended to voluntarily contribute more than traveling foreigners. Though this huge difference in WTP values could be subjected to a size bias due to the small number of foreigners who came for work, it likely indicates that those who came to Hanoi to work might care more about the air quality than their visiting counterparts. Additionally, consistent with earlier findings among domestic respondents, no foreigner willing to offer a financial commitment to improve air quality in Hanoi believed the air quality was “very good”. Furthermore, foreigners who thought the air quality was bad were willing to support the air protection fund more generously. Most foreign respondents were in the 19–30 age group, yet their voluntary contributions were lower than those of foreigners aged 31–40. As expected, respondents with jobs were willing to make larger contributions to improve air quality than those without jobs. Surprisingly, 62.07% of respondents (18/29) expressed an uncertainty or refusal to return to Hanoi if the destination belonged to the top 10 most polluted cities despite their relatively strong willingness to offer positive financial contributions to reduce air pollution in the city.

3. Methods

3.1. Experimental Design and Methods

We surveyed inhabitants and foreigners who lived/traveled in Hanoi, which is one of the most dynamic cities in Vietnam, it is also one of the world’s most polluted capital cities [10]. Following methods recommended in [28], which is used in another data article about Hanoi air pollution [16], we designed our work in three steps. First, we recruited five groups of business school as the project’s interviewers. We paid them quite generously compared to the minimum wage in Vietnam to incentivize them to try their best in working for us. We also organized two four-hour seminars to help them understand the project’s goals and the questionnaire as well as to provide them with the necessary skills and techniques to extract information from respondents. In addition to several simulation interviews conducted during the seminars, we performed two pilot studies to test how well interviewees and interviewers understand the questionnaires. We carefully revised our questionnaires based on feedback received from interviewees. We arrived at final versions of questions that are straightforward, not confusing, and easy to understand and follow between interviewers and interviewees.
In the last step, we employed a contingent valuation method coupled with a stratified random sampling technique [28] and a face-to-face approach. We interviewed 199 inhabitants and 75 foreigners who live and travel in four central districts, including Dong Da, Ba Dinh, Hoan Kiem, and Hai Ba Trung. These four areas are the heart of the Hanoi metropolis [29]. They also have the highest land price according to the adjustment coefficients regulated by the Hanoi People’s Committee [30]. During the interview process, the data-collecting teams maintained mutual interaction and continuous communication to correct issues or questions that might arise during the survey [16].

3.2. Sample Size Justification

To improve and ensure the validity and reliability of the study’s dataset, we carefully controlled sample size and data frame, and representativeness [31]. First, it is widely acknowledged that a bigger sample would produce a better result, and sample sizes larger than 30 and fewer than 500 are appropriate for most research [32]. Second, since there is no common consensus on the sample size determination methods, we employed different well-vetted references to determine our study’s sample size. For example, following the sample size determination method based on a confidence level of 90%, a 0.5 standard deviation and a 5% maximum error, the recommended sample size should be at least 271 [16,33]. Still, some researchers have cited the widely used Yamane formula [34] and believe that a sample size threshold of 100 or above is sufficient [35,36,37]. Recently, Ain and colleagues [38] adopted the contingent valuation approach and used regression methods to study the WTP for air pollution reduction in Faisalabad, Pakistan. The sample size in their study was 120. VanVoorhis and Morgan [32] even believe that a reasonable sample size of 50 or above is sufficient for regression purposes. With 199 resident observations and 75 foreign ones, our sample size is in line with previous studies [32,38].
Second, we guaranteed our data’s highest representativeness by balancing a relative number of observations in the four central districts mentioned earlier. We randomly surveyed 54, 53, 49, 43 inhabitants in the Dong Da, Ba Dinh, Hoan Kiem, and Hai Ba Trung districts, respectively. For foreigners, we chose the districts of Ba Dinh, Tay Ho, and Hoan Kiem for the survey, because they are the most commonly visited sites in Hanoi.

3.3. Questionnaire Design and Contingent Valuation Question Format

Two versions of the questionnaire were used in our work: one for domestic residents and another for foreigners. The one targeted at inner-city residents was designed to obtain four sorts of data and included 46 questions. The first three parts of this questionnaire followed [16] and examined the interviewees’ understanding of air pollution and preventive measures to either avoid or mitigate its negative impacts of polluted air. Personal information about the socio-economic features of respondents’ households was also included. The remaining section contained six questions aimed at gathering information on inner-city residents’ willingness to pay for the air protection reduction. In interviewing foreigners, we tried to obtain similar data, but we shortened the survey to only 14 questions by focusing on the most crucial information due to a time-restricted issue. Firstly, due to the different nature of the two types of respondents, many questions used for domestic interviewees were not appropriate for foreigners, especially those that require an understanding of Hanoi’s past air quality. Secondly, since the availability of foreign respondents is much more restricted, shortening the questionnaire was more practical and implementable.
Payment card WTP question. Because of its high effectiveness and convenience, the payment card questionnaire was used and designed to gather information on WTP from Vietnamese respondents for air environment protection projects [16,39]. Lists of values on the payment card range from 0 Vietnam Dong (VND) to greater than 1 million VND. The respondent was asked to select the highest amount that they would pay for the project of air environment protection project.
Open-ended WTP question. For foreigners who are mostly tourists and often stay in Vietnam for a short time, we wanted to explore their air pollution reduction responses. The open-ended questionnaire was designed and used to gather information on WTP from foreign respondents for the air environment protection project. This open-ended WTP question was worded as follows.
We fully acknowledge that our study has certain limitations. The first drawback is related to the study area and sample size. Due to the budget, we could only interview domestic inhabitants and foreigners in Hanoi. More data and larger sample sizes, especially in the case of foreign respondents, are needed to generalize our findings and provide a better understanding of the topic. Future research can expand the study area to other populous cities in Vietnam. Second, we applied the contingent valuation method through the payment card approach to design our questionnaire in order to elicit the respondent’s willingness to pay for air pollution reduction. The payment card, although it has some strengths, as mentioned above, appears to have unavoidable weaknesses. One is the influence of bid amounts in the card on the value responses [39]. To reduce the possible bias of a specific method in respondents’ answers, future contingent valuation studies can design different questionnaires using multiple methods (payment card, open-ended, dichotomous-choice, bidding) and compare results in each design to verify and test the differences, if any.

4. Conclusions

This study is one of the first attempts to better understand the perceptions and commitments from inhabitants and foreigners to reduce air pollution in order to improve the environment in Vietnam’s cities. Using the contingent valuation approach coupled with the face-to-face interview method, during mid-December 2019, a total of 199 urban inhabitants residing in four central districts and a total of 75 foreigners staying in the three main tourist districts in Hanoi were randomly surveyed. The results revealed that the majority of those surveyed were disappointed with the city’s air quality and voiced their displeasure. To discuss alleviating the harmful effects of air pollution, interviewees used different preventive measures, including defensive investments (buying air purifiers) or low-cost solutions (staying at home or traveling on weekends). Additionally, we found that a large portion of respondents were willing to make financial contributions to improve air quality, especially among domestic respondents (75.4%). The number of foreign interviewees was lower (49.3%). There are various variables associated with the WTP tendency and magnitude for reducing contaminated air, such as gender, sense of need, and some concern about or involvement in solving the problem. Notably, foreigners’ WTP was significantly higher than that of domestic respondents, and their job intention was also a powerful factor.
Despite some inherent limitations acknowledged, with the data obtained, the study reveals many policy implications and practical contributions. Firstly, the findings and data could be used to advance the understanding of how well urban citizens and foreigners perceive air pollution and adopt preventive measures to mitigate it. Furthermore, the scholars can use the dataset to measure the extent to which urban citizens and foreigners-commit to contributing to reducing polluted air. More importantly, the data could be used to conduct comparative studies on air pollution in Hanoi, Vietnam, and different cities or different countries in the world. Finally, the data could be beneficial to environmentalists and policymakers who want to seek more practical solutions and devise stronger policies for mitigating the undesirable impacts of polluted air. Notably, the study was conducted in Hanoi only; thus, a follow-up study with more observations in the same city and or in Ho Chi Minh city, the country’s most populous city, is highly encouraged to advance the topic in Vietnam and beyond.

Author Contributions

Conceptualization: Q.-H.V., Q.V.K. and T.V.P.; Data curation: Q.V.K., T.V.P., T.-A.T.L.; Formal analysis: Q.V.K., T.V.P.; Investigation: Q.V.K., T.V.P.; Methodology: Q.V.K., T.V.P.; Supervision: Q.-H.V., Q.V.K.; Writing—original draft: Q.-H.V., Q.V.K., T.V.P., T.-A.T.L.; Writing—review and editing: Q.-H.V., Q.V.K., T.V.P., T.-A.T.L. All authors have read and agreed to the published version of the manuscript.

Funding

This research received no external funding.

Institutional Review Board Statement

Not applicable.

Informed Consent Statement

The authors declare that this study is conducted with the willingness and approval of in- formed consent of all participants.

Data Availability Statement

The data presented in this study are openly available in Mendeley platform at https://data.mendeley.com/datasets/8sv4j2r9wk/2 (accessed on 8 April 2021). The data are available under the CC BY 4.0 license.

Acknowledgments

We are deeply thankful to all the people who supported and or participated in this work.

Conflicts of Interest

The authors declare that they have no known competing financial interests or personal relationships that could have appeared to influence the work reported in this paper.

References

  1. WHO Air Pollution Statistics. Available online: https://www.who.int/health-topics/air-pollution#tab=tab_1 (accessed on 8 April 2021).
  2. Yang, G.; Wang, Y.; Zeng, Y.; Gao, G.F.; Liang, X.; Zhou, M.; Wan, X.; Yu, S.; Jiang, Y.; Naghavi, M.; et al. Rapid health transition in China, 1990-2010: Findings from the Global Burden of disease study 2010. Lancet 2013, 381, 1987–2015. [Google Scholar] [CrossRef]
  3. World Bank. The Cost of Air Pollution Strengthening the Economic Case for Action; World Bank: Washington, DC, USA, 2016. [Google Scholar]
  4. Lichter, A.; Pestel, N.; Sommer, E. Productivity effects of air pollution: Evidence from professional soccer. Labour Econ. 2017, 48, 54–66. [Google Scholar] [CrossRef] [Green Version]
  5. He, J.; Liu, H.; Salvo, A. Severe air pollution and labor productivity: Evidence from industrial towns in China. Am. Econ. J. Appl. Econ. 2019, 11, 173–201. [Google Scholar] [CrossRef] [Green Version]
  6. Deng, T.; Li, X.; Ma, M. Evaluating impact of air pollution on China’s inbound tourism industry: A spatial econometric approach. Asia Pac. J. Tour. Res. 2017, 22, 771–780. [Google Scholar] [CrossRef]
  7. Zhou, B.; Qu, H.; Du, X.; Yang, B.; Liu, F. Air quality and inbound tourism in China. Tour. Anal. 2018, 23, 159–164. [Google Scholar] [CrossRef]
  8. Brauer, M.; Freedman, G.; Frostad, J.; Van Donkelaar, A.; Martin, R.V.; Dentener, F.; Van Dingenen, R.; Estep, K.; Amini, H.; Apte, J.S.; et al. Ambient Air Pollution Exposure Estimation for the Global Burden of Disease 2013. Environ. Sci. Technol. 2016, 50, 79–88. [Google Scholar] [CrossRef] [PubMed]
  9. IQAir. 2018 World Air Quality Report; IQAir: Godard Hector, Switzerland, 2018. [Google Scholar]
  10. IQAir. 2019 World Air Quality Report; IQAir: Godard Hector, Switzerland, 2019. [Google Scholar]
  11. Thang Nam, D. Bold Action Needed to Address Vietnam’s Air Pollution. Available online: https://www.eastasiaforum.org/2020/03/25/bold-action-needed-to-address-vietnams-air-pollution/ (accessed on 8 April 2021).
  12. Luong, L.M.T.; Phung, D.; Sly, P.D.; Morawska, L.; Thai, P.K. The association between particulate air pollution and respiratory admissions among young children in Hanoi, Vietnam. Sci. Total Environ. 2017, 578, 249–255. [Google Scholar] [CrossRef] [PubMed] [Green Version]
  13. Trinh, T.T.; Trinh, T.T.; Le, T.T.; Nguyen, T.D.H.; Tu, B.M. Temperature inversion and air pollution relationship, and its effects on human health in Hanoi City, Vietnam. Environ. Geochem. Health 2019, 41, 929–937. [Google Scholar] [CrossRef] [PubMed]
  14. Vuong, Q.H.; Ho, M.T.; Nguyen, H.K.T.; Nguyen, M.H. The trilemma of sustainable industrial growth: Evidence from a piloting OECD’s Green city. Palgrave Commun. 2019, 5, 1–14. [Google Scholar] [CrossRef]
  15. Greenstone, M.; Schwarz, P. Is China Winning its War on Pollution? Energy Policy Institute at the University of Chicago: Chicago, IL, USA, 2018. [Google Scholar]
  16. Van Khuc, Q.; Phu, T.V.; Luu, P. Dataset on the Hanoian suburbanites’ perception and mitigation strategies towards air pollution. Data Br. 2020, 33, 106414. [Google Scholar] [CrossRef]
  17. Sun, C.; Yuan, X.; Yao, X. Social acceptance towards the air pollution in China: Evidence from public’s willingness to pay for smog mitigation. Energy Policy 2016, 92, 313–324. [Google Scholar] [CrossRef]
  18. Pu, S.; Shao, Z.; Yang, L.; Liu, R.; Bi, J.; Ma, Z. How much will the Chinese public pay for air pollution mitigation? A nationwide empirical study based on a willingness-to-pay scenario and air purifier costs. J. Clean. Prod. 2019, 218, 51–60. [Google Scholar] [CrossRef]
  19. Dong, K.; Zeng, X. Public willingness to pay for urban smog mitigation and its determinants: A case study of Beijing, China. Atmos. Environ. 2018, 173, 355–363. [Google Scholar] [CrossRef]
  20. Becker, G. A Treatise on the Family; Havard University Press: Havard, MA, USA, 1981. [Google Scholar]
  21. Dauphin, A.; El Lahga, A.; Fortin, B.; Lacroix, G. Are Children Decision-Makers within the Household? Econ. J. 2011, 121, 871–903. [Google Scholar] [CrossRef]
  22. Istamto, T.; Houthuijs, D.; Lebret, E. Willingness to pay to avoid health risks from road-traffic-related air pollution and noise across five countries. Sci. Total Environ. 2014, 497–498, 420–429. [Google Scholar] [CrossRef] [PubMed] [Green Version]
  23. Wang, H.; Mullahy, J. Willingness to pay for reducing fatal risk by improving air quality: A contingent valuation study in Chongqing, China. Sci. Total Environ. 2006, 367, 50–57. [Google Scholar] [CrossRef]
  24. Shao, S.; Tian, Z.; Fan, M. Do the rich have stronger willingness to pay for environmental protection? New evidence from a survey in China. World Dev. 2018, 105, 83–94. [Google Scholar] [CrossRef]
  25. Givens, J.E.; Jorgenson, A.K. The Effects of Affluence, Economic Development, and Environmental Degradation on Environmental Concern: A Multilevel Analysis. Organ. Environ. 2011, 24, 74–91. [Google Scholar] [CrossRef]
  26. Wang, B.; Hong, G.; Qin, T.; Fan, W.R.; Yuan, X.C. Factors governing the willingness to pay for air pollution treatment: A case study in the Beijing-Tianjin-Hebei region. J. Clean. Prod. 2019, 235, 1304–1314. [Google Scholar] [CrossRef]
  27. Ito, K.; Zhang, S. Willingness to pay for clean air: Evidence from air purifier markets in China. J. Polit. Econ. 2020, 128, 1627–1672. [Google Scholar] [CrossRef] [Green Version]
  28. Kenneth, D. Bailey Methods of Social Research, 4th ed.; The Free Press: New York, NY, USA, 1994. [Google Scholar]
  29. The Government of Vietnam, Decision No. 78-CP, dated 31 May 1961. Available online: https://thuvienphapluat.vn/van-ban/bo-may-hanh-chinh/Quyet-dinh-78-CP-chia-khu-vuc-noi-ngoai-thanh-thanh-pho-Ha-Noi-20286.aspx (accessed on 30 August 2020).
  30. Hanoi People’s Committee, Decision No. 03/2020/QĐ-UBND, dated 2 March 2020. Available online: https://vanban.hanoi.gov.vn/documents/10182/2518750/QDPQ-03-2020.pdf (accessed on 30 August 2020).
  31. Faber, J.; Fonseca, L.M. How sample size influences research outcomes. Dental Press J. Orthod. 2014, 19, 27–29. [Google Scholar] [CrossRef] [PubMed]
  32. VanVoorhis, C.R.W.; Morgan, B.L. Understanding Power and Rules of Thumb for Determining Sample Sizes. Tutor. Quant. Methods Psychol. 2007, 3, 43–50. [Google Scholar] [CrossRef]
  33. Taherdoost, H. Determining Sample Size; How to Calculate Survey Sample Size. Int. J. Econ. Manag. Syst. 2020, 2, 237–239. [Google Scholar]
  34. Yamane, T. Statistics An Introductory Analysis, 2nd ed. Available online: https://www.gbv.de/dms/zbw/252560191.pdf (accessed on 8 April 2021).
  35. Hussain, A.; Thapa, G.B. Smallholders’ access to agricultural credit in Pakistan. Food Secur. 2012, 4, 73–85. [Google Scholar] [CrossRef]
  36. Zulfiqar, F.; Ullah, R.; Abid, M.; Hussain, A. Cotton production under risk: A simultaneous adoption of risk coping tools. Nat. Hazards 2016, 84, 959–974. [Google Scholar] [CrossRef]
  37. Ullah, R.; Jourdain, D.; Shivakoti, G.P.; Dhakal, S. Managing catastrophic risks in agriculture: Simultaneous adoption of diversification and precautionary savings. Int. J. Disaster Risk Reduct. 2015, 12, 268–277. [Google Scholar] [CrossRef]
  38. Ain, Q.; Ullah, R.; Kamran, M.A.; Zulfiqar, F. Air pollution and its economic impacts at household level: Willingness to pay for environmental services in Pakistan. Environ. Sci. Pollut. Res. 2021, 28, 6611–6618. [Google Scholar] [CrossRef] [PubMed]
  39. Champ, P.A.; Boyle, K.J.; Brown, T.C. A Primer on Nonmarket Valuation; Springer: Berlin/Heidelberg, Germany, 2017; Volume 13, ISBN 9789400771031. [Google Scholar]
Figure 1. The domestic respondents’ WTP for air pollution reduction and their income. Notes: WTP is per month and measured in $US using the USD/VND exchange rate of 23,000. Similar to the reporting method in Table 2, Table 3, Table 4 and Table 5, the lower-bound WTP is reported. Income interval is in millions VND for convenience. As mentioned earlier, 150 inhabitants expressed a positive willingness to pay for air pollution reduction. However, 31 of them were unwilling to share information about their income. We also eliminated two extreme outliers with an income of more than 100 million VND per month. Therefore, the number of observations in Figure 1 is 117.
Data 06 00039 g001
Table 1. Domestic respondents’ reasons for being unwilling to contribute to the air protection fund.
MotivesReasonsNPercentages
Genuine zero motivationThe fund is not necessary since either the air protection activities in the living area are already good enough or the air quality in the living area is already good enough.31.5%
I do not have money/My family is in a financially difficult situation, so I could not contribute.10.5%
Protest responsesThe fund is either ineffective or not practical.2412.1%
I think the government has to do more work. This is not my responsibility.52.5%
I do not care about that kind of air protection activities.52.5%
I need more information about the fund and its activities before deciding.21.0%
I think consciousness is more important.10.5%
Notes: The percentages presented in the fourth column are over the total domestic inhabitants surveyed (199). For instance, there are 24 respondents who were unwilling to pay for air pollution reduction because they believed “the fund is either ineffective or not practical.” Therefore, the corresponding percentage is equal to 24/199 = 12.1%.
Table 2. Domestic respondents’ WTP for air pollution reduction and their demographic factors.
Demographic Factors NMean
WTP
S.D.S.E.MinMax
GenderFemale782.42.40.30.213.0
Male725.28.41.00.243.5
Age10–1864.02.51.02.28.7
19–30473.65.40.80.221.7
31–40363.02.40.40.210.9
41–50228.112.42.60.443.5
51–60151.91.10.30.44.3
Above 60242.14.30.90.321.7
Highest education level achievedSecondary school or below133.55.61.60.421.7
Highschool463.13.80.60.421.7
Technical school112.71.90.60.26.5
Bachelor’s Degree744.38.00.90.243.5
Master’s Degree63.01.50.61.34.3
Doctoral Degree------
Work placeOutdoor263.54.40.90.421.7
Indoor1223.86.60.60.243.5
Total number of family members1–2184.56.51.50.421.7
3–51023.14.00.40.221.7
6–8285.511.12.10.343.5
More than 823.31.51.12.24.3
D. Other Factors
Contribution periodsLess than one year233.13.60.80.413.0
1–2 years------
3–5 years76.07.52.80.221.7
More than 5 years123.55.81.70.421.7
Do not know when will stop contributing884.27.20.80.243.5
Certainty degree on WTP decisions (1-lowest level; 10-highest level)1–552.32.00.90.44.3
6–101453.86.30.50.243.5
Notes: WTP is per month and measured in $US using the USD/VND exchange rate of 23,000. One hundred fifty observations have data on WTP. We excluded one observation with an individual who was willing to contribute “more than 1 million VND” per month (an extreme outlier).
Table 3. Domestic respondents’ WTP for air pollution reduction and their perception on air quality.
Aspects on Air QualityNMean
WTP
S.D.S.E.MinMax
Air quality at living districtsVery good------
Good72.51.80.70.44.3
Normal604.38.31.10.443.5
Bad683.54.80.60.221.7
Very bad153.12.80.70.28.7
Air quality of the whole cityVery good------
Good222.030.421.50.443.5
Normal233.54.30.90.421.7
Bad1023.55.70.60.243.5
Very bad233.24.60.90.221.7
Air quality of the living district compared to the pastBetter72.21.60.60.44.3
Unchanged92.72.00.70.46.5
Worse1343.96.50.60.243.5
Hanoi’s air quality is getting more pollutedNo419.617.58.76.543.5
Yes1463.35.10.40.243.5
Air quality satisfaction levelVery dissatisfied235.29.52.00.243.5
Dissatisfied762.83.70.40.221.7
Normal464.47.51.10.243.5
Satisfied54.73.91.80.48.7
Very satisfied------
Air protection satisfaction levelVery dissatisfied145.27.32.00.421.7
Dissatisfied544.38.11.10.243.5
Normal603.24.70.60.421.7
Satisfied212.32.30.50.28.7
Very satisfied------
Evaluation of air quality at the moment (0-worst; 100-best)0–25233.14.50.90.221.7
26–50903.45.60.60.243.5
51–75365.18.31.40.443.5
76–10010.40.00.00.40.4
Wish of air quality score in the future (0-worst; 100-best)0–25------
26–50------
51–75442.83.60.50.221.7
76–1001064.17.00.70.243.5
Notes: WTP is per month and measured in $US using the USD/VND exchange rate of 23,000. One hundred fifty observations have data on WTP. We excluded one observation with an individual who was willing to contribute “more than 1 million VND” per month (an outlier). S.D. and S.E. stand for standard deviation and standard error, respectively.
Table 4. Domestic respondents’ attitudes regarding the severity and impact of air pollution.
Severity and Impact of Air PollutionNMean
WTP
S.D.S.E.MinMax
Concerns regarding air pollutionVery concerned 544.38.51.20.243.5
Concerned763.64.90.60.221.7
Normal172.52.20.50.28.7
Not concerned23.31.51.12.24.3
Do not care11.30.00.01.31.3
Impacted degree of air pollutionVery impacted524.28.21.10.243.5
Impacted853.24.60.50.221.7
Normal115.86.82.00.421.7
Not impacted22.42.82.00.44.3
Level of urgency to solve air pollution problemVery urgent674.88.31.00.243.5
Urgent723.03.80.50.221.7
Normal102.12.40.80.48.7
Not urgent11.30.00.01.31.3
Health disease related to air pollutionNo703.24.20.50.221.7
Yes613.96.90.90.243.5
Do not know195.19.62.20.443.5
Notes: WTP is per month and measured in $US using the USD/VND exchange rate of 23,000. One hundred and fifty observations have data on WTP. We excluded one observation with an individual who was willing to contribute “more than 1 million VND” per month (an extreme outlier). S.D. and S.E. stand for standard deviation and standard error, respectively.
Table 5. Domestic respondents’ WTP for air pollution reduction and air pollution preventive measures.
Preventive Measures NMean
WTP
S.D.S.E.MinMax
Own an air purifier No 1223.56.40.60.243.5
Yes274.65.21.01.321.7
Travel to avoid air pollutionNo 1173.25.30.50.243.5
Yes325.88.61.50.243.5
Stay at home to avoid air pollutionNo 943.45.50.60.243.5
Yes564.37.31.00.243.5
Thinking of moving to another cityNo 1333.76.40.60.243.5
Yes163.95.21.30.421.7
Thinking of moving to another country No 1343.76.50.60.243.5
Yes163.52.80.71.310.9
Notes: WTP is per month and measured in $US using the USD/VND exchange rate of 23,000. One hundred fifty observations have data on WTP. We excluded one observation with an individual who was willing to contribute “more than 1 million VND” per month (an extreme outlier). S.D. and S.E. stand for standard deviation and standard error, respectively.
Table 6. Foreigners’ WTP for air pollution reduction in Hanoi.
Willingness to Pay (WTP)NMean
WTP
S.D.S.E.MinMax
Purpose in HanoiTravelling275.79.51.81.050.0
Working226.533.223.53.050.0
Living------
Air quality in HanoiVery good------
Good33.71.20.73.05.0
Normal166.111.83.01.050.0
Bad910.815.75.22.050.0
Very bad12.0--2.02.0
Travel again even if Hanoi is in top 10 most polluted citiesNo212.510.67.55.020.0
Yes117.914.04.22.050.0
Do not know165.911.83.01.050.0
Age10–18------
19–30144.44.71.31.020.0
31–4089.316.55.82.050.0
41–5013.0--3.03.0
51–6043.51.70.92.05.0
Above 60227.531.822.55.050.0
OccupationStudying32.72.11.21.05.0
Working247.413.22.71.050.0
Retired12.0--2.02.0
Studying and Working120.0--20.020.0
Notes: The WTP is in $US and per day. Mean of WTP among 29 foreigners: $7.14. S.D. and S.E. stand for standard deviation and standard error, respectively.
Publisher’s Note: MDPI stays neutral with regard to jurisdictional claims in published maps and institutional affiliations.

