Intracranial Hemorrhage Segmentation Using a Deep Convolutional Model

 , ,
, ,  ,
,
Abstract
1. Introduction
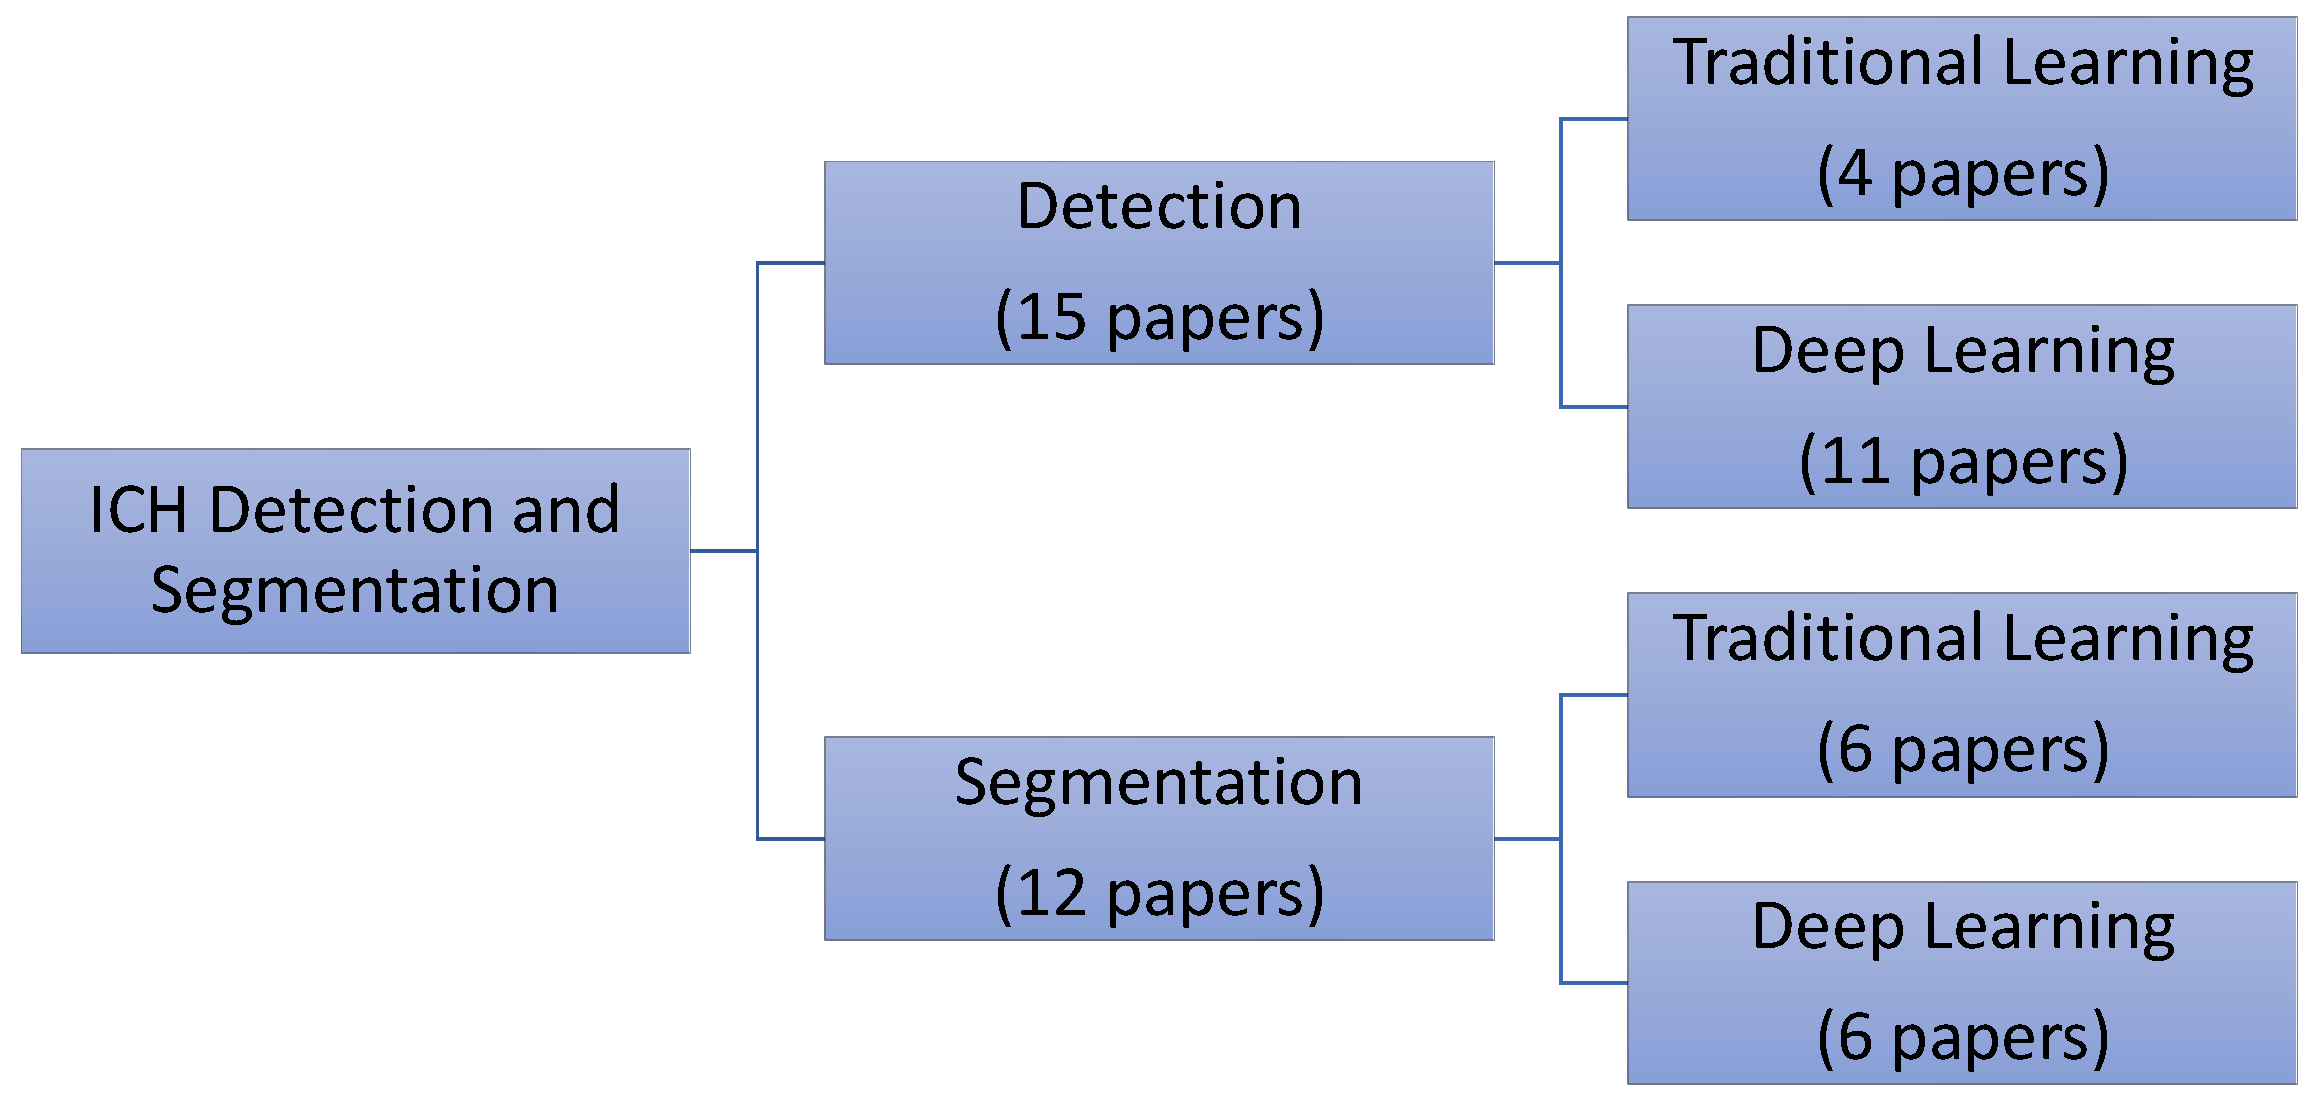
2. Related Work
2.1. Intracranial Hemorrhage Detection and Classification
2.2. Intracranial Hemorrhage Segmentation
3. Methods
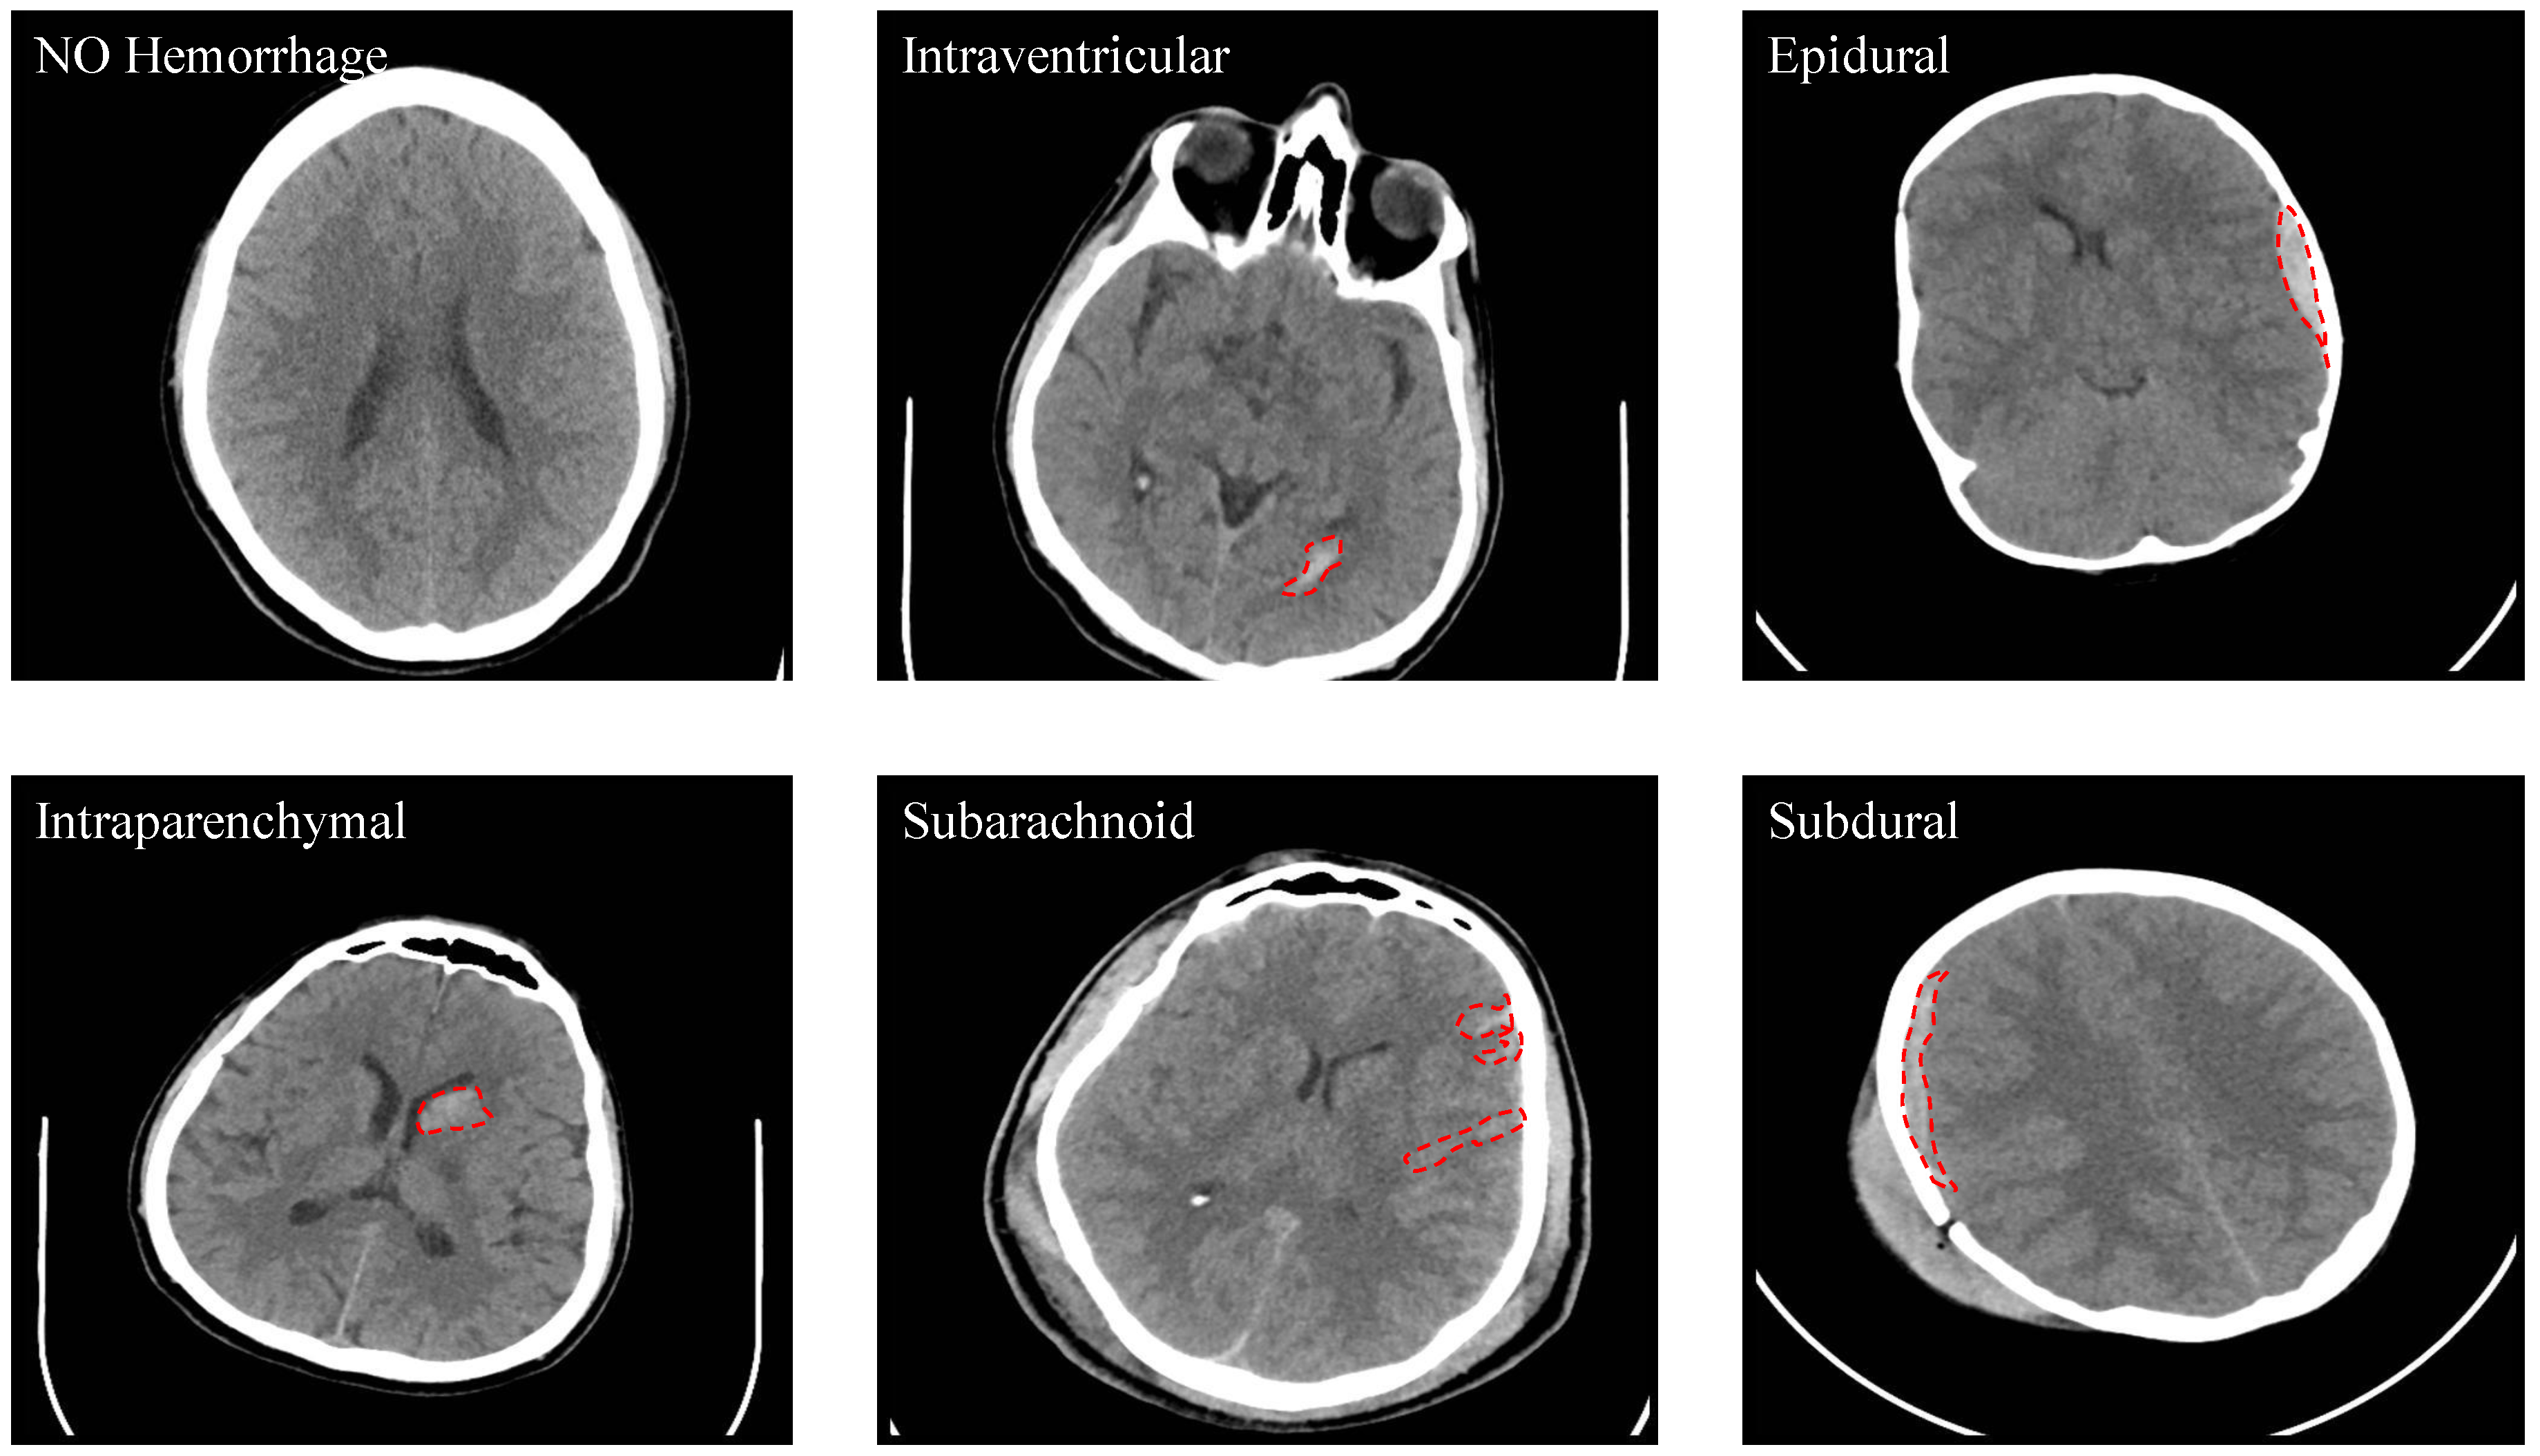
3.1. Dataset
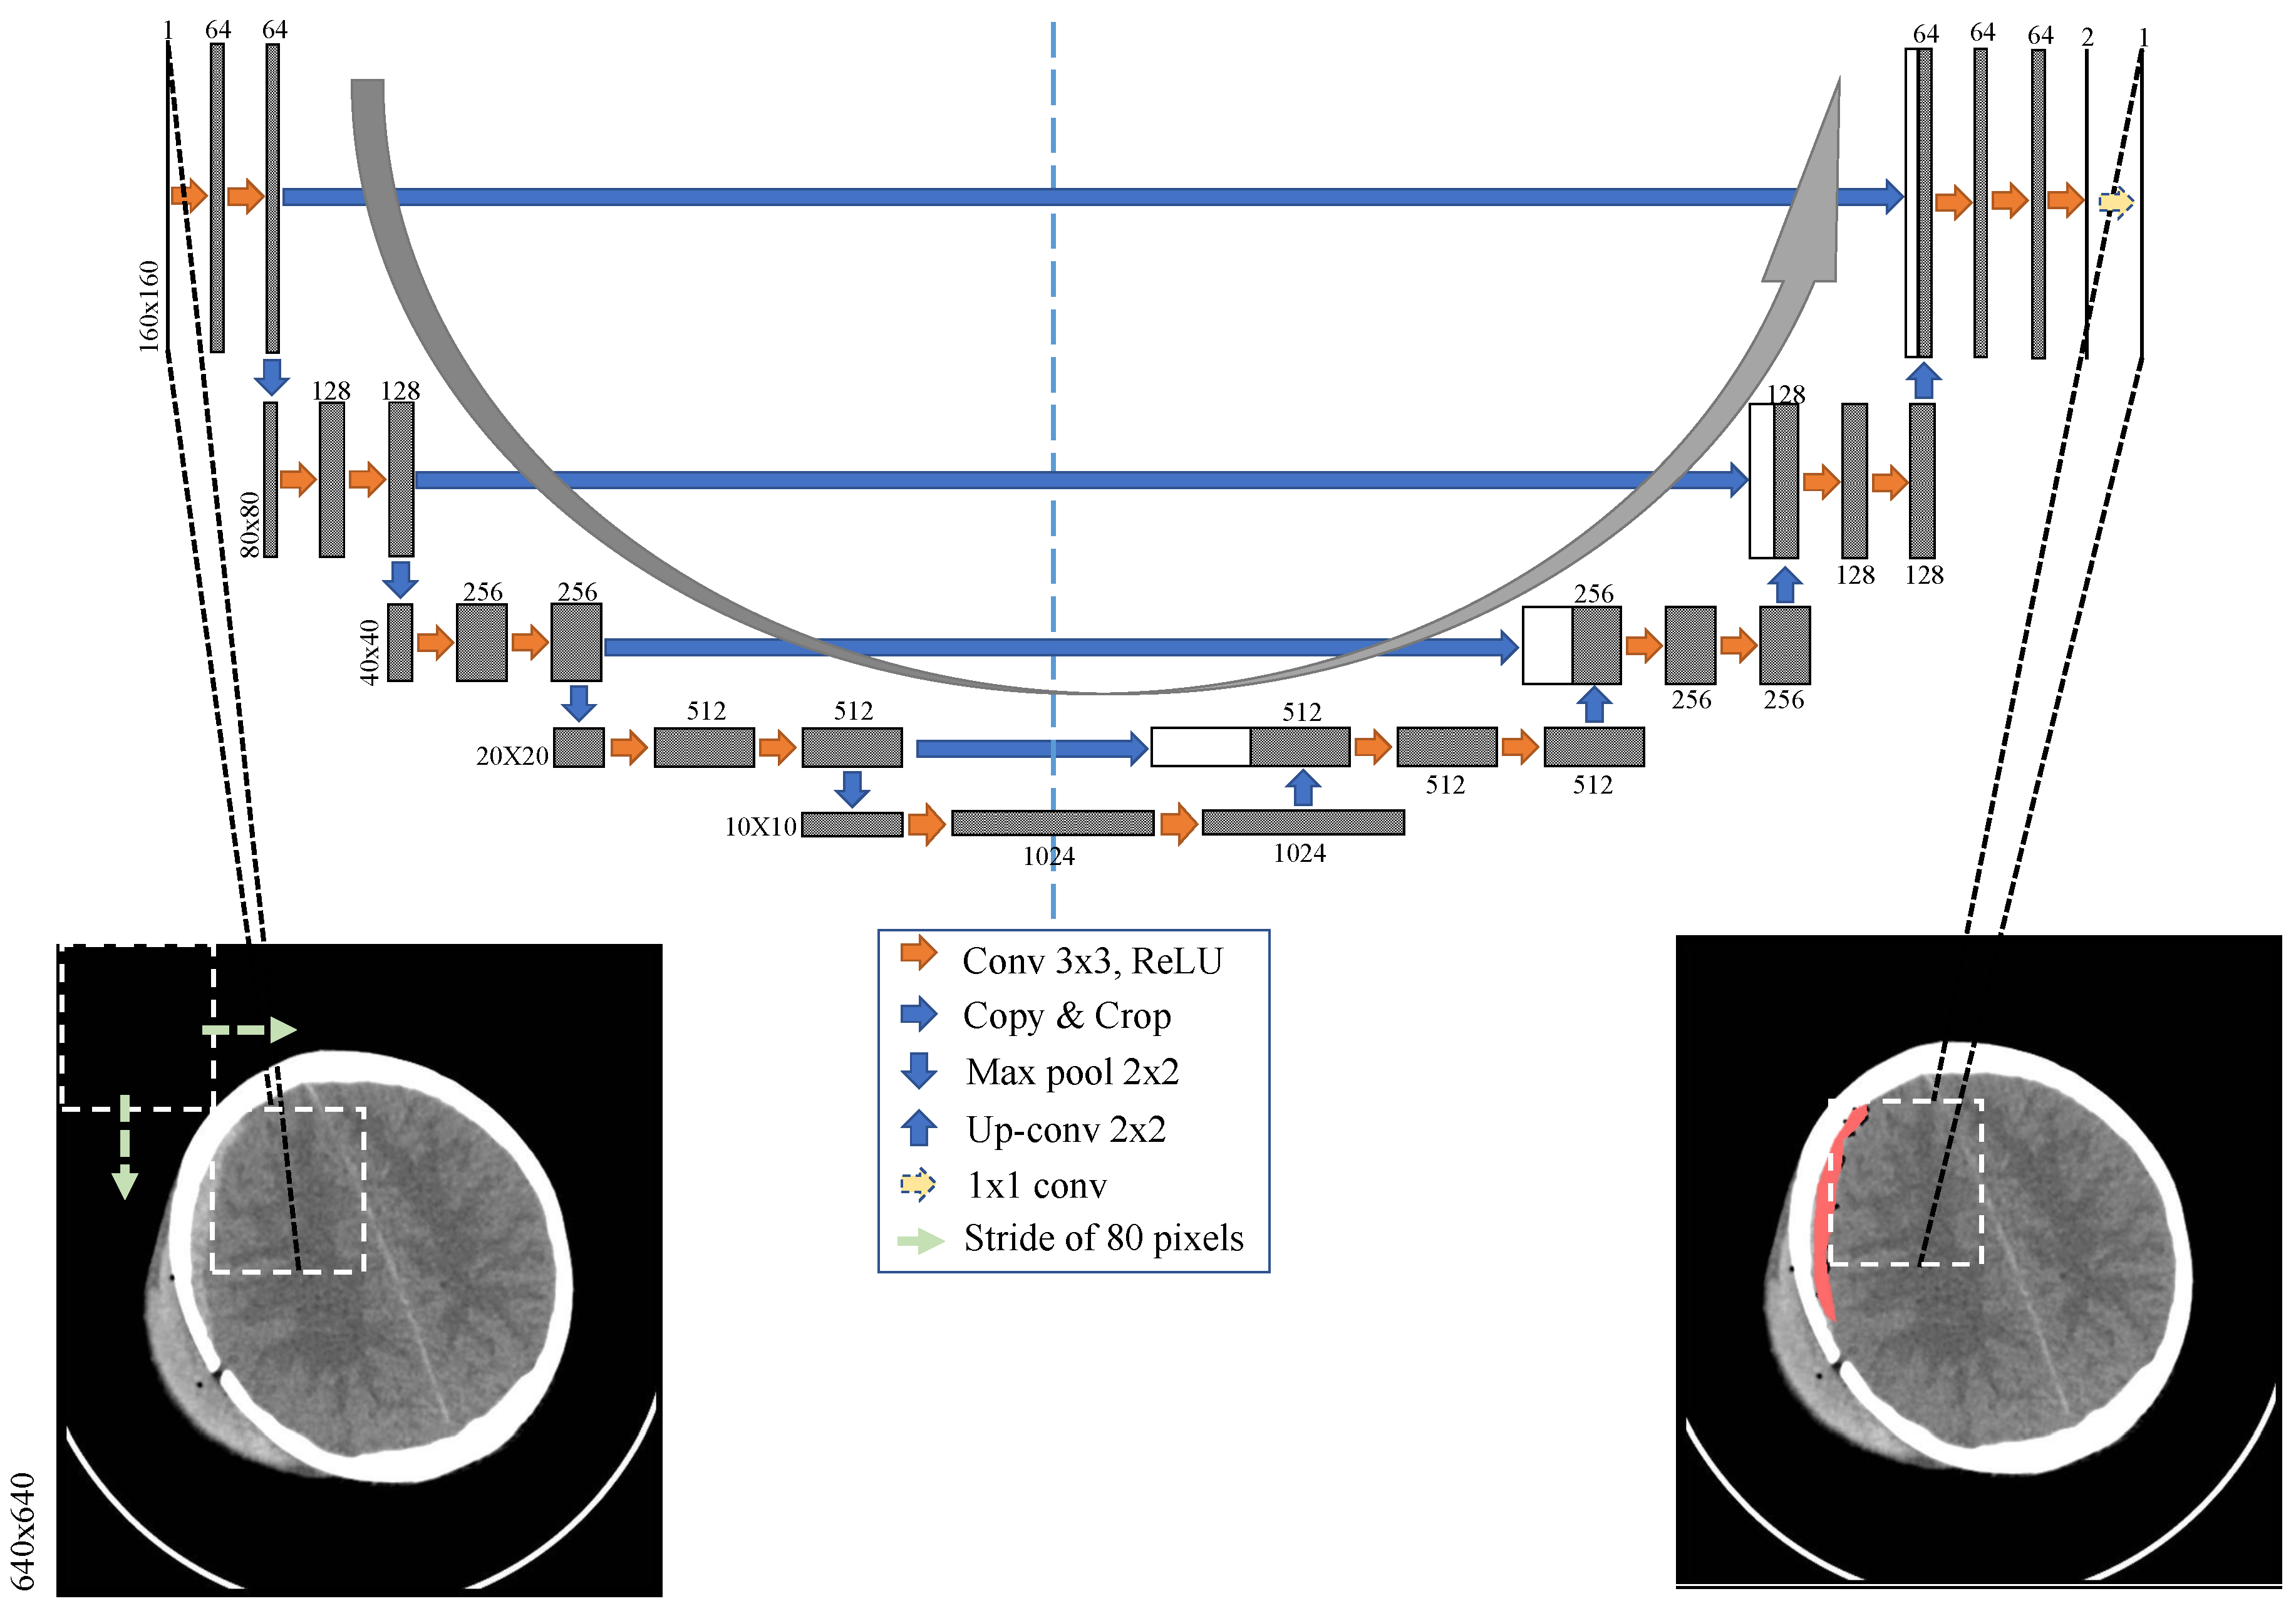
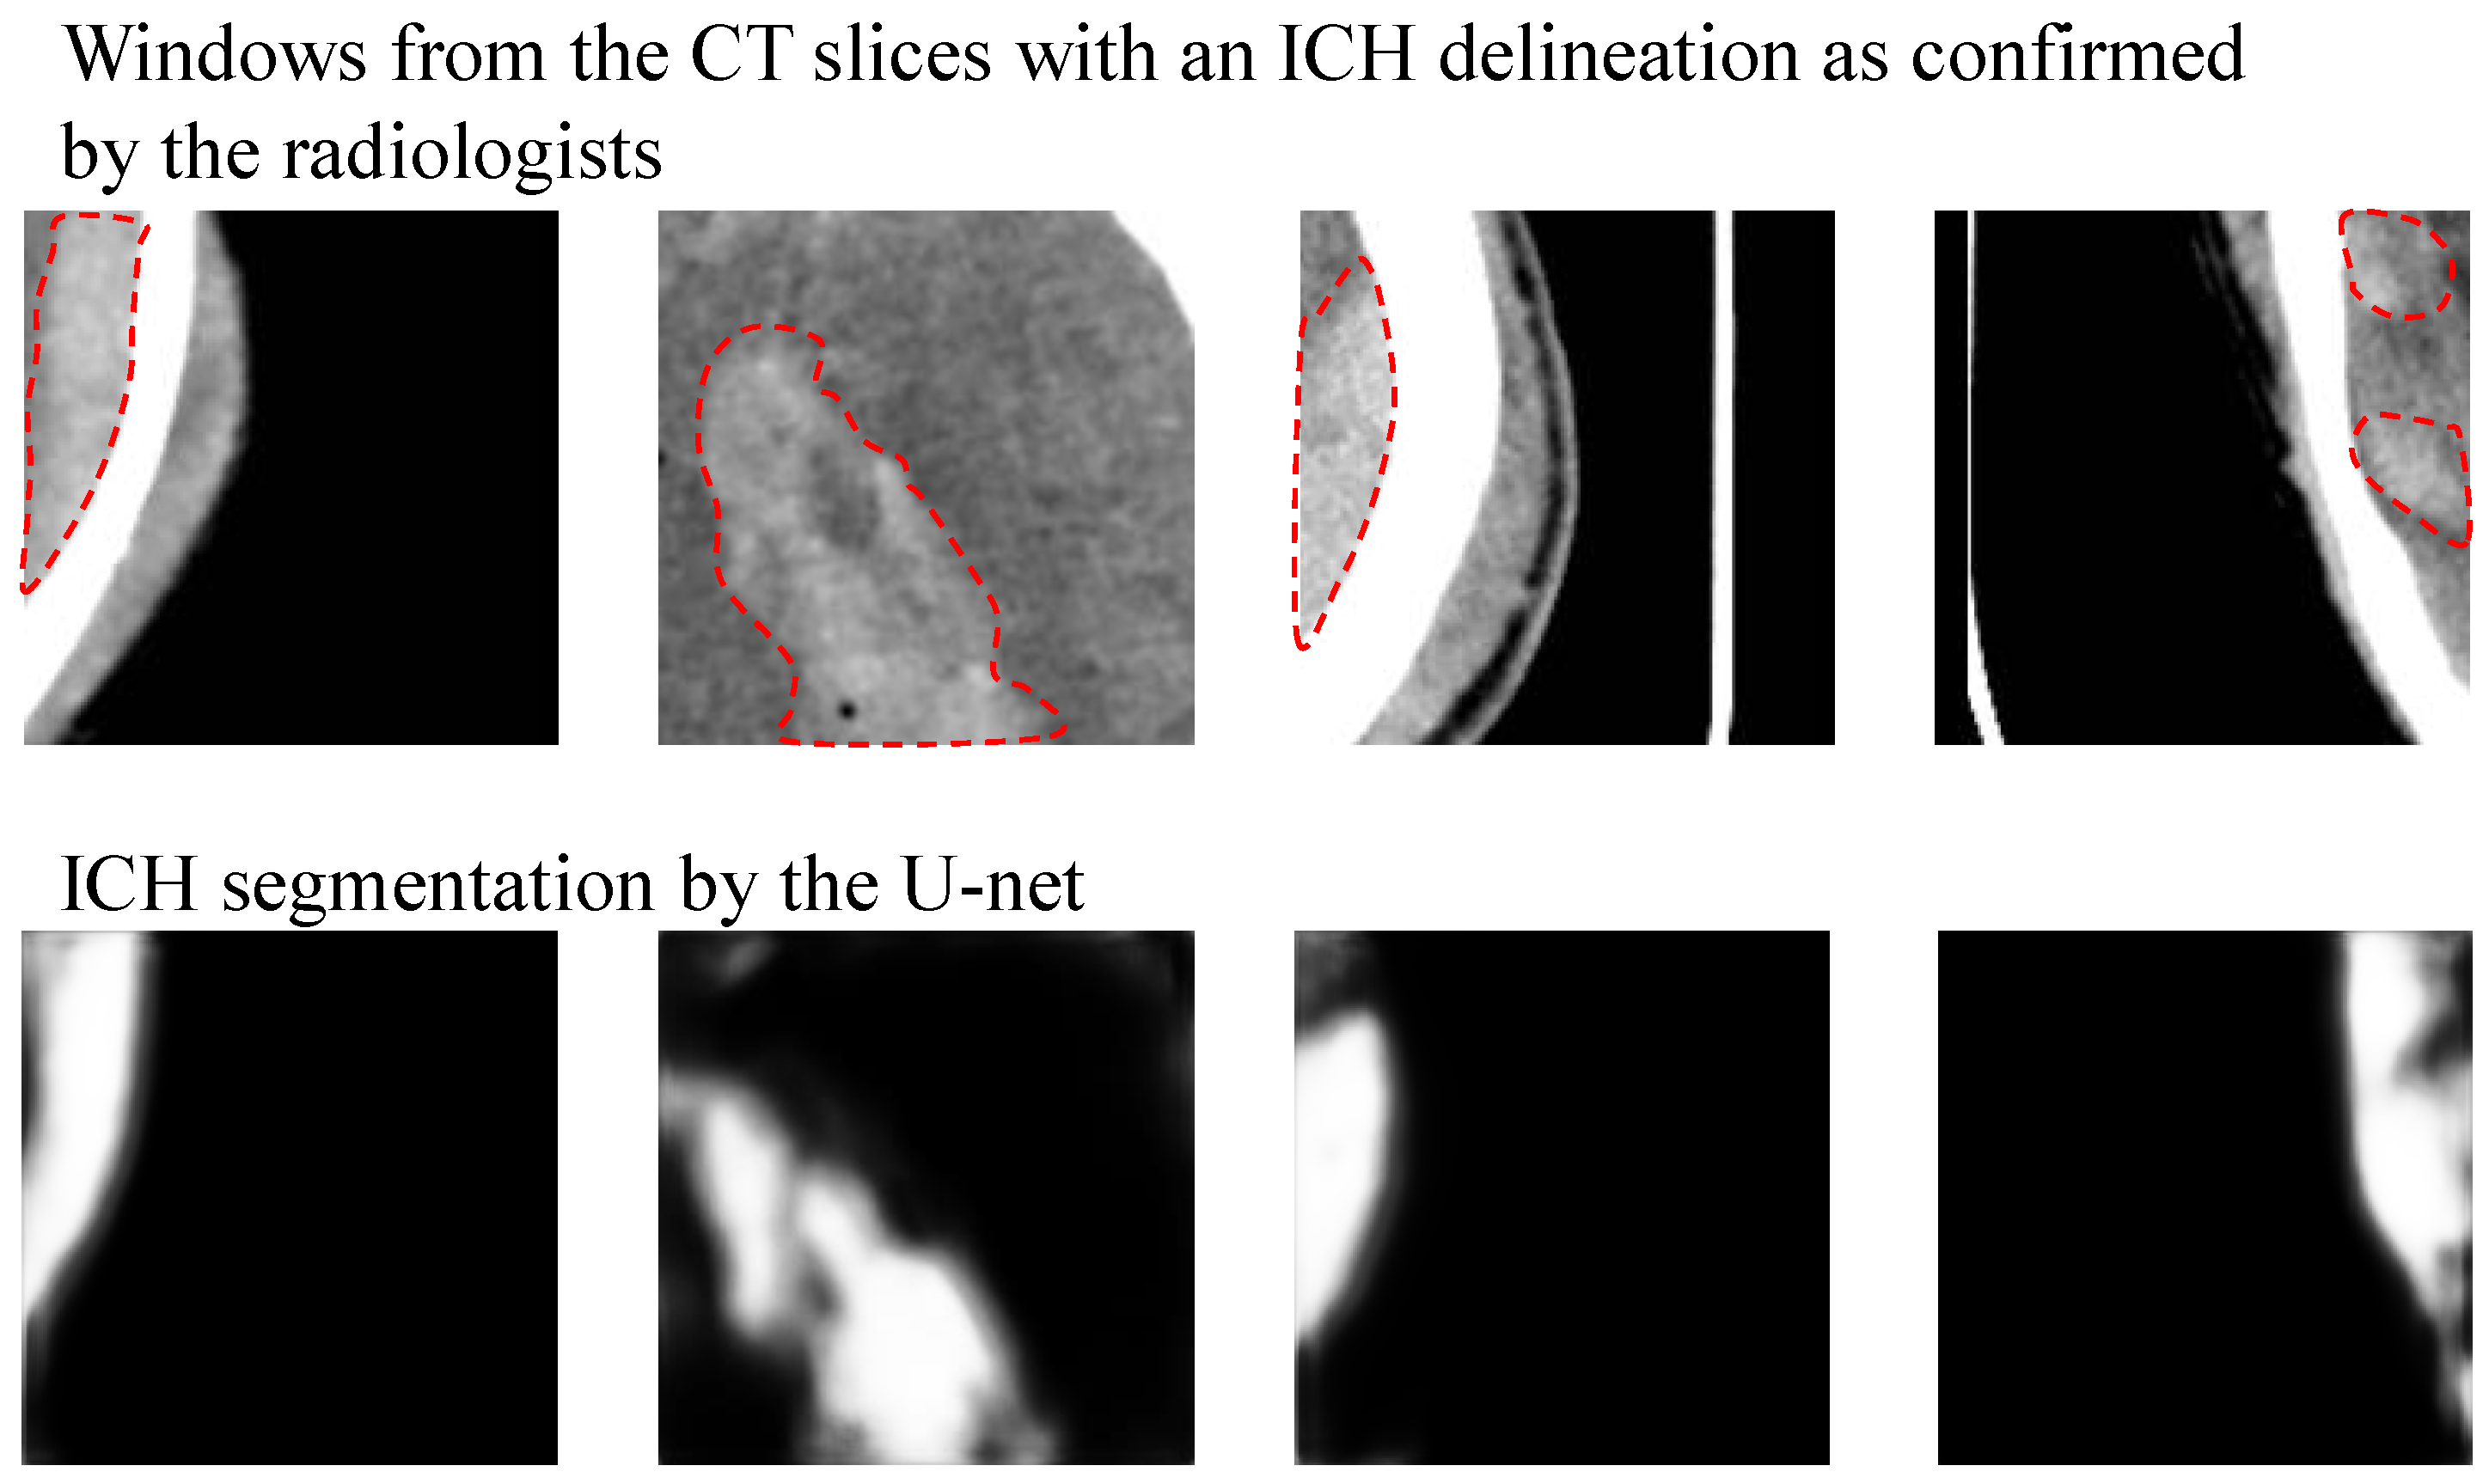
3.2. ICH Segmentation Using U-Net
4. Results
- Rotation with a maximum of 20 degrees
- Width shift with a maximum of 10% of the image width
- Height shift with a maximum of 10% of the image height
- Shear with a maximum intensity of 0.1
- Zoom with a maximum range of 0.2
5. Discussion
6. Conclusions
Supplementary Materials
Author Contributions
Funding
Acknowledgments
Conflicts of Interest
Abbreviations
| CT | Computerized Tomography |
| TBI | Traumatic brain injury |
| ICH | Intracranial hemorrhage |
| IVH | Intraventricular hemorrhage |
| IPH | Intraparenchymal hemorrhage |
| SAH | Subarachnoid hemorrhage |
| EDH | Epidural hemorrhage |
| SDH | Subdural hemorrhage |
| CNN | Convolutional neural networks |
| RNN | Recurrent neural network |
| FCN | Fully convolutional networks |
| LSTM | Long short-term memory network |
| AUC | Area under the ROC curve |
References
- Taylor, C.A.; Bell, J.M.; Breiding, M.J.; Xu, L. Traumatic brain injury-related emergency department visits, hospitalizations, and deaths-United States, 2007 and 2013. Morb. Mortal. Wkly. Rep. Surveill. Summ. 2017, 66, 1–16. [Google Scholar] [CrossRef] [PubMed]
- van Asch, C.J.; Luitse, M.J.; Rinkel, G.J.; van der Tweel, I.; Algra, A.; Klijn, C.J. Incidence, case fatality, and functional outcome of intracerebral haemorrhage over time, according to age, sex, and ethnic origin: A systematic review and meta-analysis. Lancet Neurol. 2010, 9, 167–176. [Google Scholar] [CrossRef]
- Currie, S.; Saleem, N.; Straiton, J.A.; Macmullen-Price, J.; Warren, D.J.; Craven, I.J. Imaging assessment of traumatic brain injury. Postgrad. Med. 2016, 92, 41–50. [Google Scholar] [CrossRef] [PubMed]
- Xue, Z.; Antani, S.; Long, L.R.; Demner-Fushman, D.; Thoma, G.R. Window classification of brain CT images in biomedical articles. In AMIA Annual Symposium Proceedings; American Medical Informatics Association: Bethesda, MD, USA, 2012; Volume 2012, p. 1023. [Google Scholar]
- Litjens, G.; Kooi, T.; Bejnordi, B.E.; Setio, A.A.A.; Ciompi, F.; Ghafoorian, M.; Van Der Laak, J.A.; Van Ginneken, B.; Sánchez, C.I. A survey on deep learning in medical image analysis. Med. Image Anal. 2017, 42, 60–88. [Google Scholar] [CrossRef]
- Ronneberger, O.; Fischer, P.; Brox, T. U-net: Convolutional networks for biomedical image segmentation. In Proceedings of the 18th International Conference, Munich, Germany, 5–9 October 2015; pp. 234–241. [Google Scholar]
- Chilamkurthy, S.; Ghosh, R.; Tanamala, S.; Biviji, M.; Campeau, N.G.; Venugopal, V.K.; Mahajan, V.; Rao, P.; Warier, P. Deep learning algorithms for detection of critical findings in head CT scans: A retrospective study. Lancet 2018, 392, 2388–2396. [Google Scholar] [CrossRef]
- Arbabshirani, M.R.; Fornwalt, B.K.; Mongelluzzo, G.J.; Suever, J.D.; Geise, B.D.; Patel, A.A.; Moore, G.J. Advanced machine learning in action: Identification of intracranial hemorrhage on computed tomography scans of the head with clinical workflow integration. NPJ Digit. Med. 2018, 1, 9. [Google Scholar] [CrossRef]
- Lee, H.; Yune, S.; Mansouri, M.; Kim, M.; Tajmir, S.H.; Guerrier, C.E.; Ebert, S.A.; Pomerantz, S.R.; Romero, J.M.; Kamalian, S.; et al. An explainable deep-learning algorithm for the detection of acute intracranial haemorrhage from small datasets. Nat. Biomed. Eng. 2019, 3, 173. [Google Scholar] [CrossRef]
- Yuh, E.L.; Gean, A.D.; Manley, G.T.; Callen, A.L.; Wintermark, M. Computer-aided assessment of head computed tomography (CT) studies in patients with suspected traumatic brain injury. J. Neurotrauma 2008, 25, 1163–1172. [Google Scholar] [CrossRef]
- Li, Y.; Wu, J.; Li, H.; Li, D.; Du, X.; Chen, Z.; Jia, F.; Hu, Q. Automatic detection of the existence of subarachnoid hemorrhage from clinical CT images. J. Med. Syst. 2012, 36, 1259–1270. [Google Scholar] [CrossRef]
- Li, Y.H.; Zhang, L.; Hu, Q.M.; Li, H.W.; Jia, F.C.; Wu, J.H. Automatic subarachnoid space segmentation and hemorrhage detection in clinical head CT scans. Int. J. Comput. Assist. Radiol. Surg. 2012, 7, 507–516. [Google Scholar] [CrossRef]
- Chilamkurthy, S.; Ghosh, R.; Tanamala, S.; Biviji, M.; Campeau, N.G.; Venugopal, V.K.; Mahajan, V.; Rao, P.; Warier, P. Development and validation of deep learning algorithms for detection of critical findings in head CT scans. arXiv 2018, arXiv:1803.05854. [Google Scholar]
- Ye, H.; Gao, F.; Yin, Y.; Guo, D.; Zhao, P.; Lu, Y.; Wang, X.; Bai, J.; Cao, K.; Song, Q.; et al. Precise diagnosis of intracranial hemorrhage and subtypes using a three-dimensional joint convolutional and recurrent neural network. Eur. Radiol. 2019, 29, 6191–6201. [Google Scholar] [CrossRef] [PubMed]
- Chan, T. Computer aided detection of small acute intracranial hemorrhage on computer tomography of brain. Comput. Med. Imaging Graph. 2007, 31, 285–298. [Google Scholar] [CrossRef] [PubMed]
- Prakash, K.B.; Zhou, S.; Morgan, T.C.; Hanley, D.F.; Nowinski, W.L. Segmentation and quantification of intra-ventricular/cerebral hemorrhage in CT scans by modified distance regularized level set evolution technique. Int. J. Comput. Assist. Radiol. Surg. 2012, 7, 785–798. [Google Scholar] [CrossRef] [PubMed]
- Bhadauria, H.; Dewal, M. Intracranial hemorrhage detection using spatial fuzzy c-mean and region-based active contour on brain CT imaging. Signal Image Video Process. 2014, 8, 357–364. [Google Scholar] [CrossRef]
- Shahangian, B.; Pourghassem, H. Automatic brain hemorrhage segmentation and classification algorithm based on weighted grayscale histogram feature in a hierarchical classification structure. Biocybern. Biomed. Eng. 2016, 36, 217–232. [Google Scholar] [CrossRef]
- Muschelli, J.; Sweeney, E.M.; Ullman, N.L.; Vespa, P.; Hanley, D.F.; Crainiceanu, C.M. PItcHPERFeCT: Primary intracranial hemorrhage probability estimation using random forests on CT. NeuroImage Clin. 2017, 14, 379–390. [Google Scholar] [CrossRef]
- Kuo, W.; Häne, C.; Yuh, E.; Mukherjee, P.; Malik, J. Cost-Sensitive active learning for intracranial hemorrhage detection. In Medical Image Computing and Computer Assisted Intervention—MICCAI 2018; Frangi, A.F., Schnabel, J.A., Davatzikos, C., Alberola-López, C., Fichtinger, G., Eds.; Springer International Publishing: Cham, Switzerland, 2018; pp. 715–723. [Google Scholar]
- Chang, P.; Kuoy, E.; Grinband, J.; Weinberg, B.; Thompson, M.; Homo, R.; Chen, J.; Abcede, H.; Shafie, M.; Sugrue, L.; et al. Hybrid 3D/2D convolutional neural network for hemorrhage evaluation on head CT. Am. J. Neuroradiol. 2018, 39, 1609–1616. [Google Scholar] [CrossRef]
- Nag, M.K.; Chatterjee, S.; Sadhu, A.K.; Chatterjee, J.; Ghosh, N. Computer-assisted delineation of hematoma from CT volume using autoencoder and Chan Vese model. Int. J. Comput. Assist. Radiol. Surg. 2018, 14, 259–269. [Google Scholar] [CrossRef]
- Kuang, H.; Menon, B.K.; Qiu, W. Segmenting Hemorrhagic and Ischemic Infarct Simultaneously From Follow-Up Non-Contrast CT Images in Patients With Acute Ischemic Stroke. IEEE Access 2019, 7, 39842–39851. [Google Scholar] [CrossRef]
- Cho, J.; Park, K.S.; Karki, M.; Lee, E.; Ko, S.; Kim, J.K.; Lee, D.; Choe, J.; Son, J.; Kim, M.; et al. Improving sensitivity on identification and delineation of intracranial hemorrhage lesion Using cascaded deep learning models. J. Digit. Imaging 2019, 32, 450–461. [Google Scholar] [CrossRef] [PubMed]
- Gautam, A.; Raman, B. Automatic segmentation of intracerebral hemorrhage from brain CT images. In Machine Intelligence and Signal Analysis; Springer: Singapore, 2019; pp. 753–764. [Google Scholar]
- Hssayeni, M.D. Computed Tomography Images for Intracranial Hemorrhage Detection and Segmentation. 2019. Available online: https://physionet.org/content/ct-ich/1.3.0/ (accessed on 25 December 2019).
- Goldberger, A.L.; Amaral, L.A.N.; Glass, L.; Hausdorff, J.M.; Ivanov, P.C.; Mark, R.G.; Mietus, J.E.; Moody, G.B.; Peng, C.K.; Stanley, H.E. PhysioBank, PhysioToolkit, and PhysioNet: Components of a New Research Resource for Complex Physiologic Signals. Circulation 2000, 101, e215–e220. [Google Scholar] [CrossRef] [PubMed]
- Prevedello, L.M.; Erdal, B.S.; Ryu, J.L.; Little, K.J.; Demirer, M.; Qian, S.; White, R.D. Automated critical test findings identification and online notification system using artificial intelligence in imaging. Radiology 2017, 285, 923–931. [Google Scholar] [CrossRef] [PubMed]
- Grewal, M.; Srivastava, M.M.; Kumar, P.; Varadarajan, S. RADnet: Radiologist level accuracy using deep learning for hemorrhage detection in CT scans. In Proceedings of the 2018 IEEE 15th International Symposium on Biomedical Imaging (ISBI 2018), Washington, DC, USA, 4–7 April 2018; pp. 281–284. [Google Scholar]
- Jnawali, K.; Arbabshirani, M.R.; Rao, N.; Patel, A.A. Deep 3D convolution neural network for CT brain hemorrhage classification. In Medical Imaging 2018: Computer-Aided Diagnosis; International Society for Optics and Photonics: Washington, DC, USA, 2018; Volume 10575, p. 105751C. [Google Scholar]
- Chi, F.L.; Lang, T.C.; Sun, S.J.; Tang, X.J.; Xu, S.Y.; Zheng, H.B.; Zhao, H.S. Relationship between different surgical methods, hemorrhage position, hemorrhage volume, surgical timing, and treatment outcome of hypertensive intracerebral hemorrhage. World J. Emerg. Med. 2014, 5, 203. [Google Scholar] [CrossRef]
- Strub, W.; Leach, J.; Tomsick, T.; Vagal, A. Overnight preliminary head CT interpretations provided by residents: Locations of misidentified intracranial hemorrhage. Am. J. Neuroradiol. 2007, 28, 1679–1682. [Google Scholar] [CrossRef]
- Chollet, F. Keras. 2015. Available online: https://keras.io (accessed on 1 March 2019).


| Gap in Knowledge | Our Contribution |
|---|---|
| Publicly available dataset for ICH segmentation. | We collected a new ICH dataset and made it publicly available at the Physionet repository [26,27]. |
| Precise ICH segmentation method. | We developed a proof-of- concept ICH segmentation based on U-Net. |
| Literature review. | We reviewed 27 papers in the ICH detection, classification, and segmentation. |
| References | Dataset (# of CT Scans) | ICH Detection/Classification Method | Results | ICH Segmentation Method | Results | ||||
|---|---|---|---|---|---|---|---|---|---|
| Training | Testing | ||||||||
| With ICH | Without ICH | With ICH | Without ICH | ICH | ICH Sub-Types | ICH Segmentation | |||
| Yuh et al. [10] | 27 | 5 | 52 | 158 | Threshold-based | 98% sensitivity 59% specificity | Threshold-based | - | |
| Li et al. [11,12] | 30 | 30 | 30 | 39 | Support Vector Machine | - | 100% sensitivity 92% specificity (SAS detection) | Distance transform features and a Bayesian classifier | - |
| Prevedello et al. [28] | 100 | 124 | 50 | 35 | Convolutional Neural Networks | 90% sensitivity 85% specificity AUC of 0.91 | - | - | - |
| Grewal et al. [29] | 252 | 77 | Convolutional Neural Networks (DenseNet) + RNN | 88% sensitivity 81% precision 81% accuracy | - | Auxiliary tasks to DenseNet | - | ||
| Jnawali et al. [30] | 8465 | 26,383 | 1891 | 3618 | Convolutional Neural Networks (ensemble) | 77% sensitivity 80% precision AUC of 0.87 | - | - | - |
| Chilamkurthy et al. [7] | 290,055 | 2,494 +205 | 18,601 +286 | Convolutional Neural Networks (ResNet18) and Random Forest | 92% sensitivity 70% specificity Average AUC of 0.93 (All types) | - | - | ||
| Arbabshirani et al. [8] | 9938 | 27,146 | 9499+347 | 3D CNN | AUC of 0.846 71.5% sensitivity 83.5% specificity | - | - | - | |
| Ye et al. [14] | 1642 | 895 | 194 | 105 | 3D joint CNN-RNN | 98% sensitivity 99% specificity AUC of 1 | 80 % sensitivity 93.2 % specificity AUC of 0.93 (All types) | Attention maps of CNN using Grad-CAM method | - |
| Chan [15] | 40 | 124 | 22 | 0 | Knowledge-based classifier | 100% sensitivity 84.1% specificity | - | Knowledge-based classifier | 82.6% sensitivity |
| Shahangian et al. [18] | 627 slices | 0 | 0 | Support Vector Machine | 92.46% accuracy | 94.13% accuracy | Distance regularized level set evolution | Dice coefficient of 58.5 82.5% sensitivity 90.5% specificity | |
| Chang et al. [21] | 901 | 9258 | 82 | 780 | ROI-based Convolutional Neural Networks | 95% sensitivity 97% specificity AUC of 0.97 (All types except intraventricular) | - | ROI-based Convolutional Neural Networks | Average Dice score of 0.85 |
| Lee et al. [9] | 625 | 279 | 100 + 107 | 100 + 130 | Convolutional Neural Networks (ensemble) | 95.2% sensitivity 94.9% specificity AUC of 0.975 | 78.3% sensitivity 92.9% specificity AUC of 95.9 (All types) | Attention maps of CNN | 78.1% overlap between the model and neuroradiologists maps of bleeding points |
| Kuo et al. [20] | 934 | 313+120 | Fully Convolutional Neural Network (FCN) | 92.8% average precision | - | Fully Convolutional Neural Network (FCN) | 77.9% average precision | ||
| Cho et al. [24] | 2647 | 3055 | 0 | 0 | Cascade of convolutional neural networks (CNNs) and dual fully convolutional networks (FCNs) | 97.91% sensitivity 98.76% specificity | Accuracy ranging from 70% to 90% | Dual fully convolutional networks (FCNs) | 80.19% precision 82.15% recall |
| References | Dataset (# of CT Scans) | ICH Segmentation Method | Results | |||
|---|---|---|---|---|---|---|
| Training | Testing | |||||
| With ICH | Without ICH | With ICH | Without ICH | ICH Segmentation | ||
| Bhadauria et al. [17] | 0 | 0 | 20 | 0 | Fuzzy c-mean clustering and region-based active contour method | 79.4% sensitivity 99.4% specificity Jaccard index of 0.78 Dice coefficient of 0.87 |
| Nag et al. [22] | 24 | 0 | 48 | 0 | Autoencoder and active contour Chan-Vese model | 71% sensitivity 73% positive predictive Jaccard index of 0.55 |
| Muschelli et al. [19] | 10 | 0 | 102 | 0 | Logistic regression, logistic regression with LASSO, Generalized additive model, and random forest classifier | Dice coefficient of 0.89 ICH volume correlation of 0.93 |
| Kuang et al. [23] | 180 | 0 | 30 | 0 | U-Net and multi-region contour evolution | Dice coefficient of 0.72 |
| Gautam et al. [25] | 20 | 0 | 0 | 0 | Fuzzy c-Mean clustering with wavelet based thresholding technique | Dice coefficient of 0.82 |
| Prakash et al. [16] | 150 | 0 | 50 | 0 | Distance regularized level set evolution | AUC of 0.88 79.6% sensitivity 99.9% specificity |
| Total number of subjects | 82 | Sex (Male, Female) | 46 M, 36 F |
| Age (yr) | 27.8 ± 19.5 | Age range | 1 day–72 years |
| Number of subjects (age<18 years, age≥18 years) | 27,55 | Number of subjects with ICH | 36 |
| Number of subjects with IVH, IPH, SAH, EDH, and SDH | 5,16,7,21,4 | Number of subjects with skull fracture | 22 |
| # slices | # slices | ||
|---|---|---|---|
| Intraventricular | 24 | Epidural | 182 |
| Intraparenchymal | 73 | Subdural | 56 |
| Subarachnoid | 18 | No Hemorrhage | 2173 |
| Jaccard Index | Dice Coefficient | Sensitivity (%) | Specificity (%) | |
|---|---|---|---|---|
| Min | 0.00 | 0.00 | 50 | 0 |
| Max | 0.528 | 0.677 | 100 | 100 |
| STD | 0.163 | 0.211 | 9.9 | 29.9 |
| Average | 0.218 | 0.315 | 97.28 | 50.4 |
| Threshold | Sensitivity (%) | Specificity (%) | Accuracy (%) |
|---|---|---|---|
| 0.5 | 97.2 | 50.4 | 56.6 |
| 0.6 | 88.7 | 62.2 | 65.9 |
| 0.7 | 77.6 | 74.5 | 76 |
| 0.8 | 73.7 | 82.4 | 82.5 |
| 0.9 | 63.1 | 88.6 | 87 |
© 2020 by the authors. Licensee MDPI, Basel, Switzerland. This article is an open access article distributed under the terms and conditions of the Creative Commons Attribution (CC BY) license (http://creativecommons.org/licenses/by/4.0/).
Share and Cite
Hssayeni, M.D.; Croock, M.S.; Salman, A.D.; Al-khafaji, H.F.; Yahya, Z.A.; Ghoraani, B. Intracranial Hemorrhage Segmentation Using a Deep Convolutional Model. Data 2020, 5, 14. https://doi.org/10.3390/data5010014
Hssayeni MD, Croock MS, Salman AD, Al-khafaji HF, Yahya ZA, Ghoraani B. Intracranial Hemorrhage Segmentation Using a Deep Convolutional Model. Data. 2020; 5(1):14. https://doi.org/10.3390/data5010014
Chicago/Turabian StyleHssayeni, Murtadha D., Muayad S. Croock, Aymen D. Salman, Hassan Falah Al-khafaji, Zakaria A. Yahya, and Behnaz Ghoraani. 2020. "Intracranial Hemorrhage Segmentation Using a Deep Convolutional Model" Data 5, no. 1: 14. https://doi.org/10.3390/data5010014
APA StyleHssayeni, M. D., Croock, M. S., Salman, A. D., Al-khafaji, H. F., Yahya, Z. A., & Ghoraani, B. (2020). Intracranial Hemorrhage Segmentation Using a Deep Convolutional Model. Data, 5(1), 14. https://doi.org/10.3390/data5010014