Data Descriptor

Carbon Sequestration Rate Estimates in Delaware Bay and Barnegat Bay Tidal Wetlands Using Interpolation Mapping

1
Department of Biodiversity, Earth and Environmental Science, Drexel University and The Academy of Natural Science, Philadelphia, PA 19103, USA
2
University of Delaware, Newark, DE 19716, USA
3
Partnership for the Delaware Estuary, Wilmington, DE 19801, USA
4
Delaware National Estuarine Research Reserve, Dover, DE 19734, USA
*
Author to whom correspondence should be addressed.
§
Deceased
Submission received: 19 December 2019 / Revised: 17 January 2020 / Accepted: 23 January 2020 / Published: 25 January 2020

Abstract

:
Quantifying carbon sequestration by tidal wetlands is important for the management of carbon stocks as part of climate change mitigation. This data publication includes a spatial analysis of carbon accumulation rates in Barnegat and Delaware Bay tidal wetlands. One method calculated long-term organic carbon accumulation rates from radioisotope-dated (Cs-137) sediment cores. The second method measured organic carbon density of sediment accumulated above feldspar marker beds. Carbon accumulation rates generated by these two methods were interpolated across emergent wetland areas, using kriging, with uncertainty estimated by leave-one-out cross validation. This spatial analysis revealed greater carbon sequestration within Delaware, compared to Barnegat Bay. Sequestration rates were found to be more variable within Delaware Bay, and rates were greatest in the tidal freshwater area of the upper bay.
Dataset License: CC0

1. Summary

Because tidal wetland ecosystems sequester significant amounts of carbon, developing accurate methods for measuring carbon accumulation rates in these ecosystems over time is important. Although tidal wetlands cover only a small area of the globe [1], they accumulate large amounts of organic carbon in belowground sediments, often referred to as “blue carbon” [2]. A review estimated that United States tidal wetlands store 0.72 Pg of organic carbon [3]. The position of marshes at the freshwater–saltwater interface makes them nutrient and sediment sinks, fostering high primary productivity and nutrient burial [4]. Marshes trap allochthonous sediments, as well as locally generated carbon from primary production. Carbon is sequestered in sediments because anoxic conditions limit remineralization; it is stored as marshes aggrade with sea level rise [5]. Blue carbon stored in marshes is threatened by anthropogenic disturbances, such as land-use change and the accelerated local rate of sea level rise [6]. The threats of climate change from greenhouse gases underscore the importance of understanding carbon stocks in marshes, rates of carbon sequestration, and methods to maintain blue carbon storage. Therefore, the states of New Jersey and Delaware have signed the US Climate Alliance (https://www.usclimatealliance.org/), including the agreement to make an effort to utilize tidal wetlands to help meet greenhouse gas emission goals.
Previous studies have shown decreased sediment deposition rates with an increasing time interval of measurement [7]. This phenomenon is known as the “Sadler effect”. This effect has been demonstrated by a review of previous studies that measured sediment accumulation rates and observed the Saddler effect in over 25,000 measured sediment deposition rates [8]. Thus, it has been established that accumulation rates decrease exponentially with increasing measurement interval. This effect may be due to longer time intervals, capturing periods of episodic deposition [9].
The dataset used in this study includes carbon accumulation data in the extensive tidal wetlands of the Mid-Atlantic Region. Carbon accumulation data were compiled from several projects conducted by the authors. These projects include the Mid-Atlantic Coastal Wetland Assessment (MACWA), monitoring by the Delaware National Estuarine Research Reserve (DNERR), and the Academy of Natural Sciences of Drexel University (ANS). References to source data, calculations of carbon accumulation, and other analyses utilizing parts of these data can be found in [10,11,12,13,14]. These citations provide significant background information about the source of the data and larger context for this paper.
Spatial and temporal variations in carbon sequestration in Barnegat Bay and Delaware Bay marshes were calculated from annual field measurement techniques, as well as from sediment cores spanning decades. Though both datasets are present as per-year rates for comparison, the interval of measurement is either “annual” for short-term or “decadal” for long-term. Point locations of carbon accumulation measurements were interpolated to the spatial extent of emergent tidal wetlands. This geospatial analysis was used to (1) compare trends within and between Delaware Bay and Barnegat Bay and (2) compare sequestration rates between annual and decadal measurement intervals.
The novel contribution of the study is made through the comparison of two datasets, which represent two different methods of measuring accumulation (the annual and decadal methods). The presentation of this comparison in spatial form has not been previously done and is applicable to management efforts that apply these two different methods, to estimate carbon sequestration by wetlands. The purpose of publication of this compiled dataset is to make the data available for utilization by researchers and land managers in the region, to further analyze the differences between these two methods of measuring carbon accumulation and consider local variability of carbon accumulation when managing tidal marshes.

1.1. Spatial Results

Based on the raster statistics in ArcGIS (version 10.2.2, ESRI, Redlands, CA, USA) of the interpolation maps created, carbon accumulation rates in the Delaware Bay and Barnegat Bay range from 60 to 500 g C m−2 yr−1. The mean value for Delaware Bay (± standard error) was 182 ± 42 g C m−2 yr−1, while the mean for Barnegat Bay was 136 ± 16 g C m−2 yr−1. A previous review of 154 marsh sites around the globe found that the mean rate of carbon burial was 210 g C m−2 yr−1 [15], which is similar to the values found in Delaware Bay and slightly higher than Barnegat Bay. As CO2 gas equivalents, Delaware Bay sequesters an average of 667 g CO2 m−2 yr−1, and Barnegat Bay sequesters 499 g CO2 m−2 yr−1.
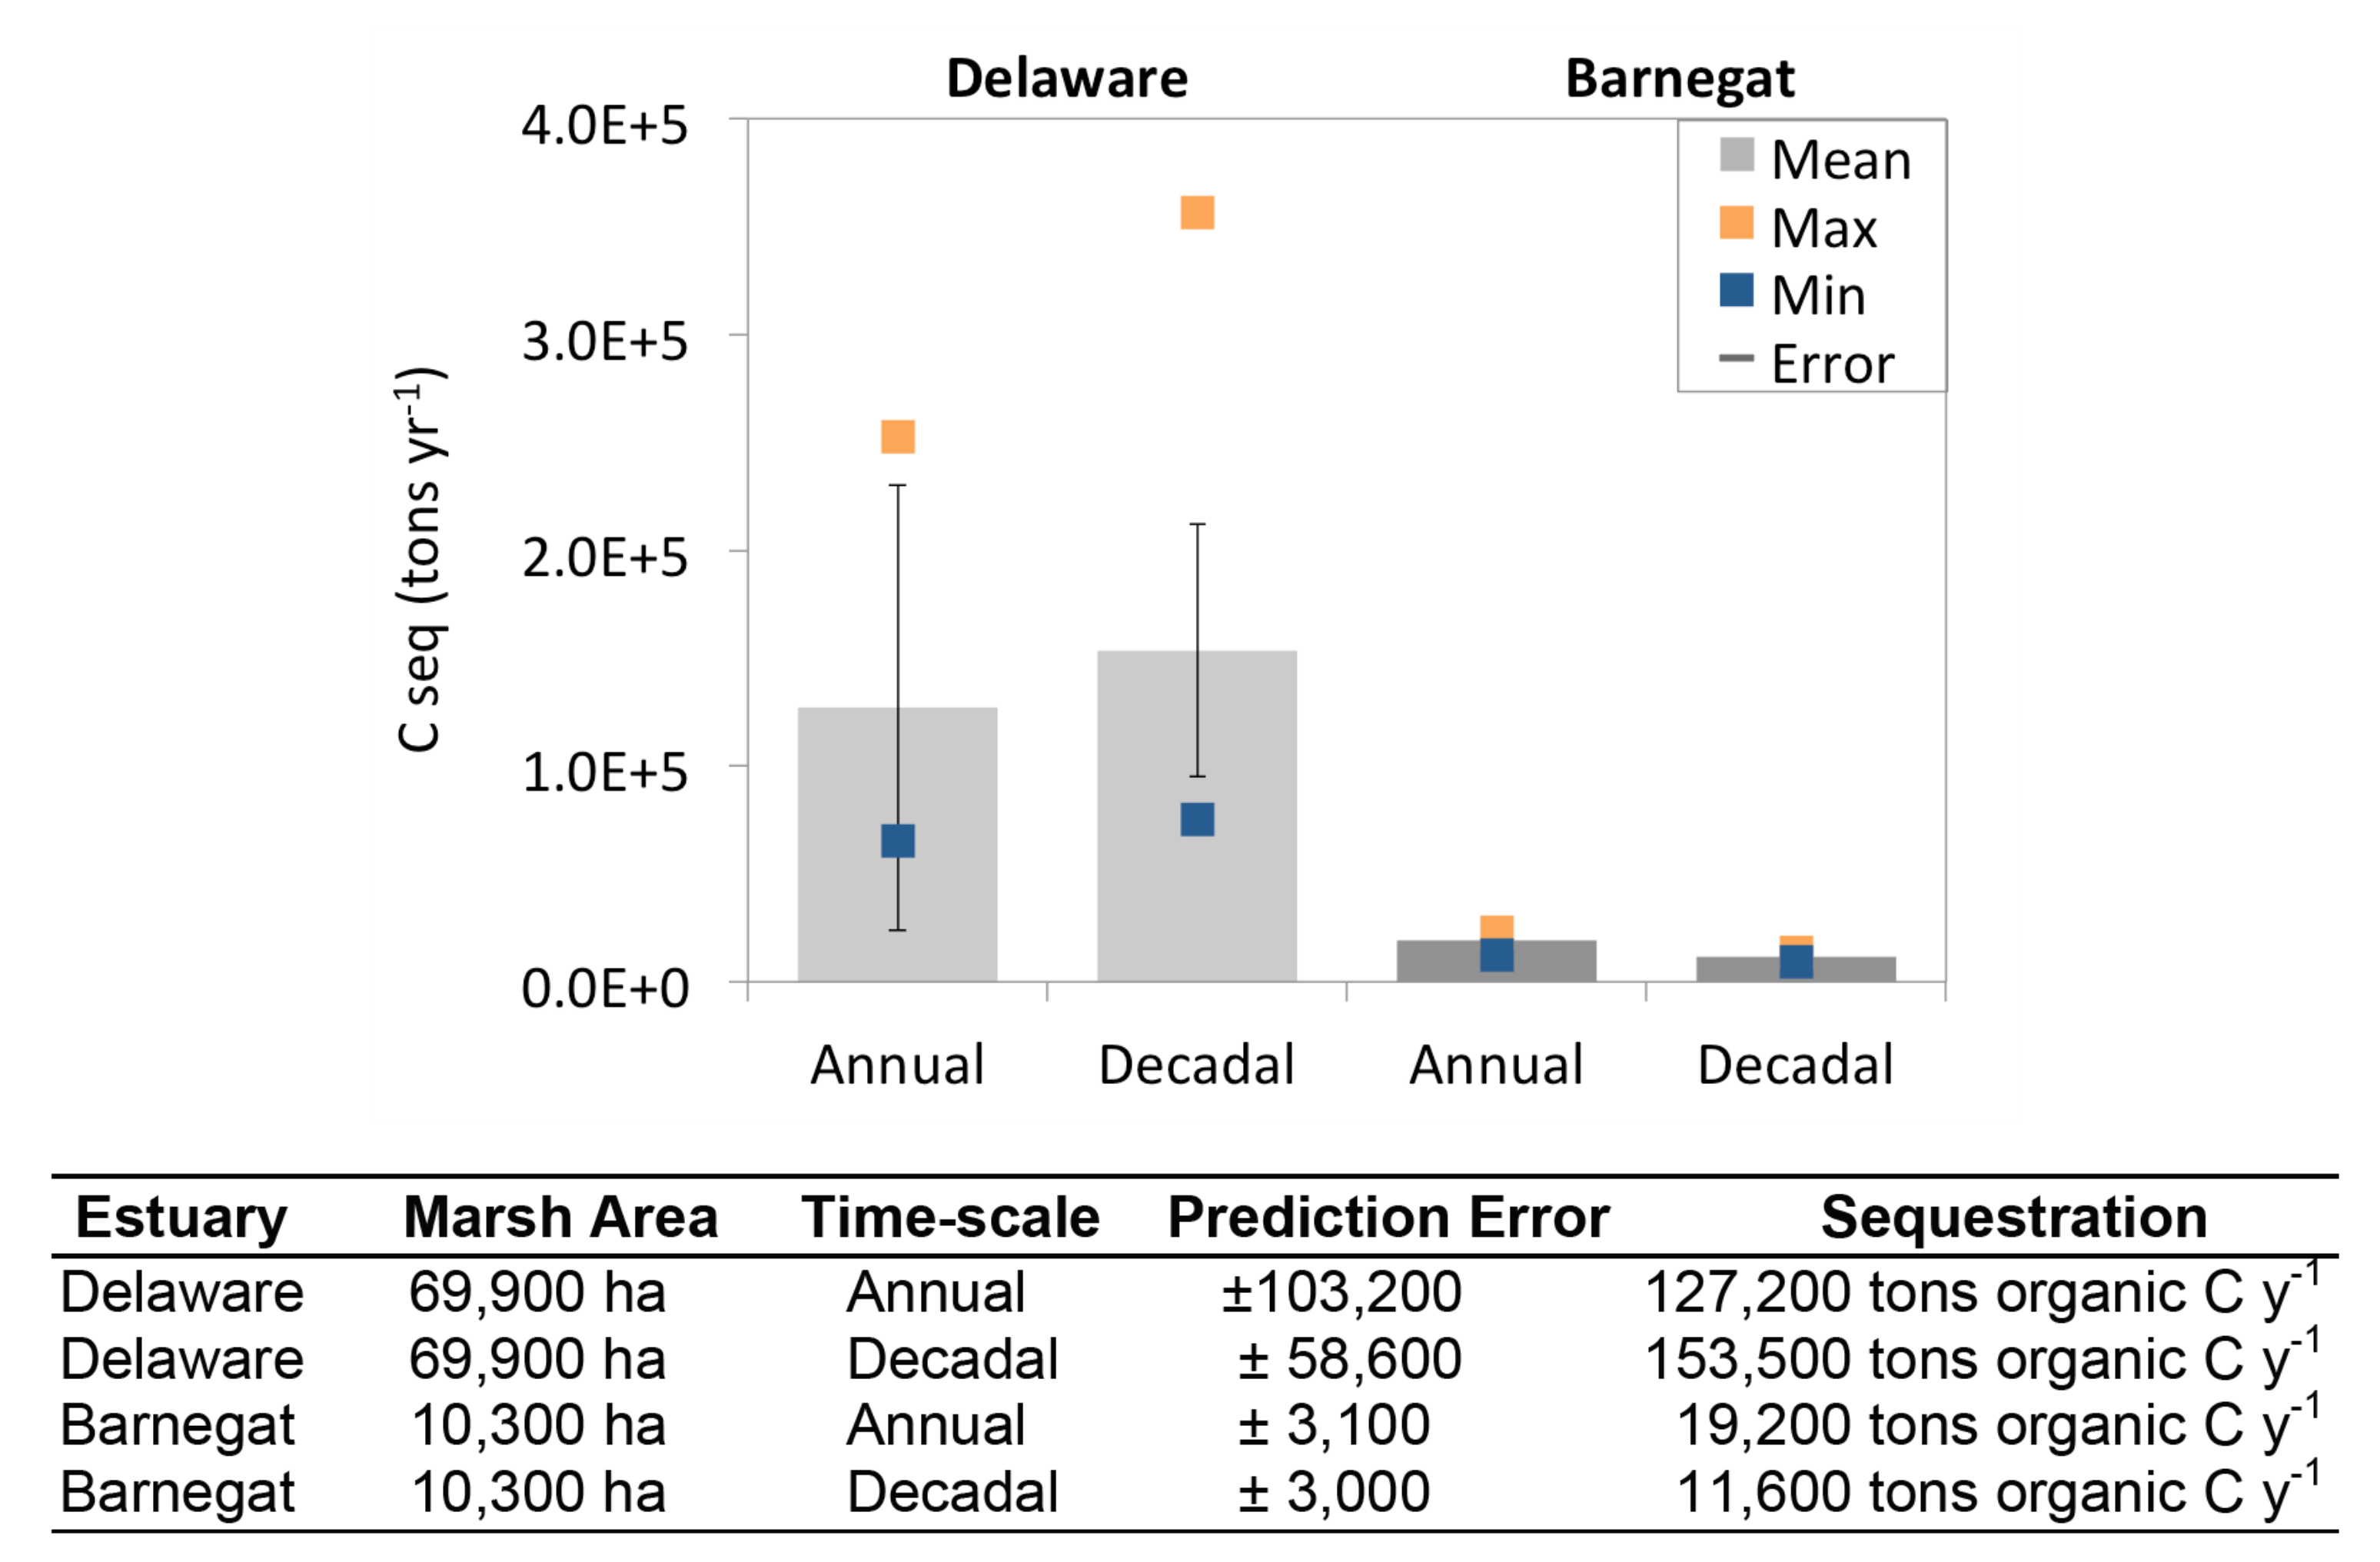
Spatial interpolation (Figure 1) revealed geographic trends in organic carbon accumulation in Delaware Bay. Carbon accumulation was found to be greatest in the Upper Delaware Bay and lowest at the mouth of the bay. In Barnegat Bay, carbon accumulation was found to be more consistent throughout the bay, but slightly higher rates were observed in the southern side of the bay, in the analysis generated using the annual method. The total area of tidal wetlands in Barnegat Bay and Delaware Bay and the area-weighted rates were used to estimate the total carbon sequestration per year for each bay (Figure 2). Statistically significant differences in organic carbon accumulation rates were observed between the two bays. Delaware Bay had a greater area of tidal wetlands, greater carbon burial rates, and higher uncertainty than Barnegat Bay. An Analysis of Variance (ANOVA) of the mean accumulation rate in Barnegat Bay compared to Delaware Bay revealed that the carbon accumulation rate is significantly greater in Delaware Bay, compared to Barnegat Bay (F1,47 = 5.46; p = 0.02).
The spatial variability of carbon accumulation between the marsh sites is likely partially explained by natural variability. Some causes of observed variations of accumulation could be different levels of sediment availability at different sites, productivity, and health of the marshes. The higher rates of carbon sequestration in Delaware Bay may be a result of higher productivity, higher suspended sediment availability, and/or a larger tide range [16]. Primary productivity of marshes is a large contribution to the source of carbon that is stored in marsh sediments, as well as allochthonous sediments from other sources. This study of marsh sediments integrates both primary productivity and other sediment sources as total carbon accumulation. Therefore, spatial variability may be caused by either or both allochthonous and autochthonous production of carbon.

1.2. Temporal Patterns

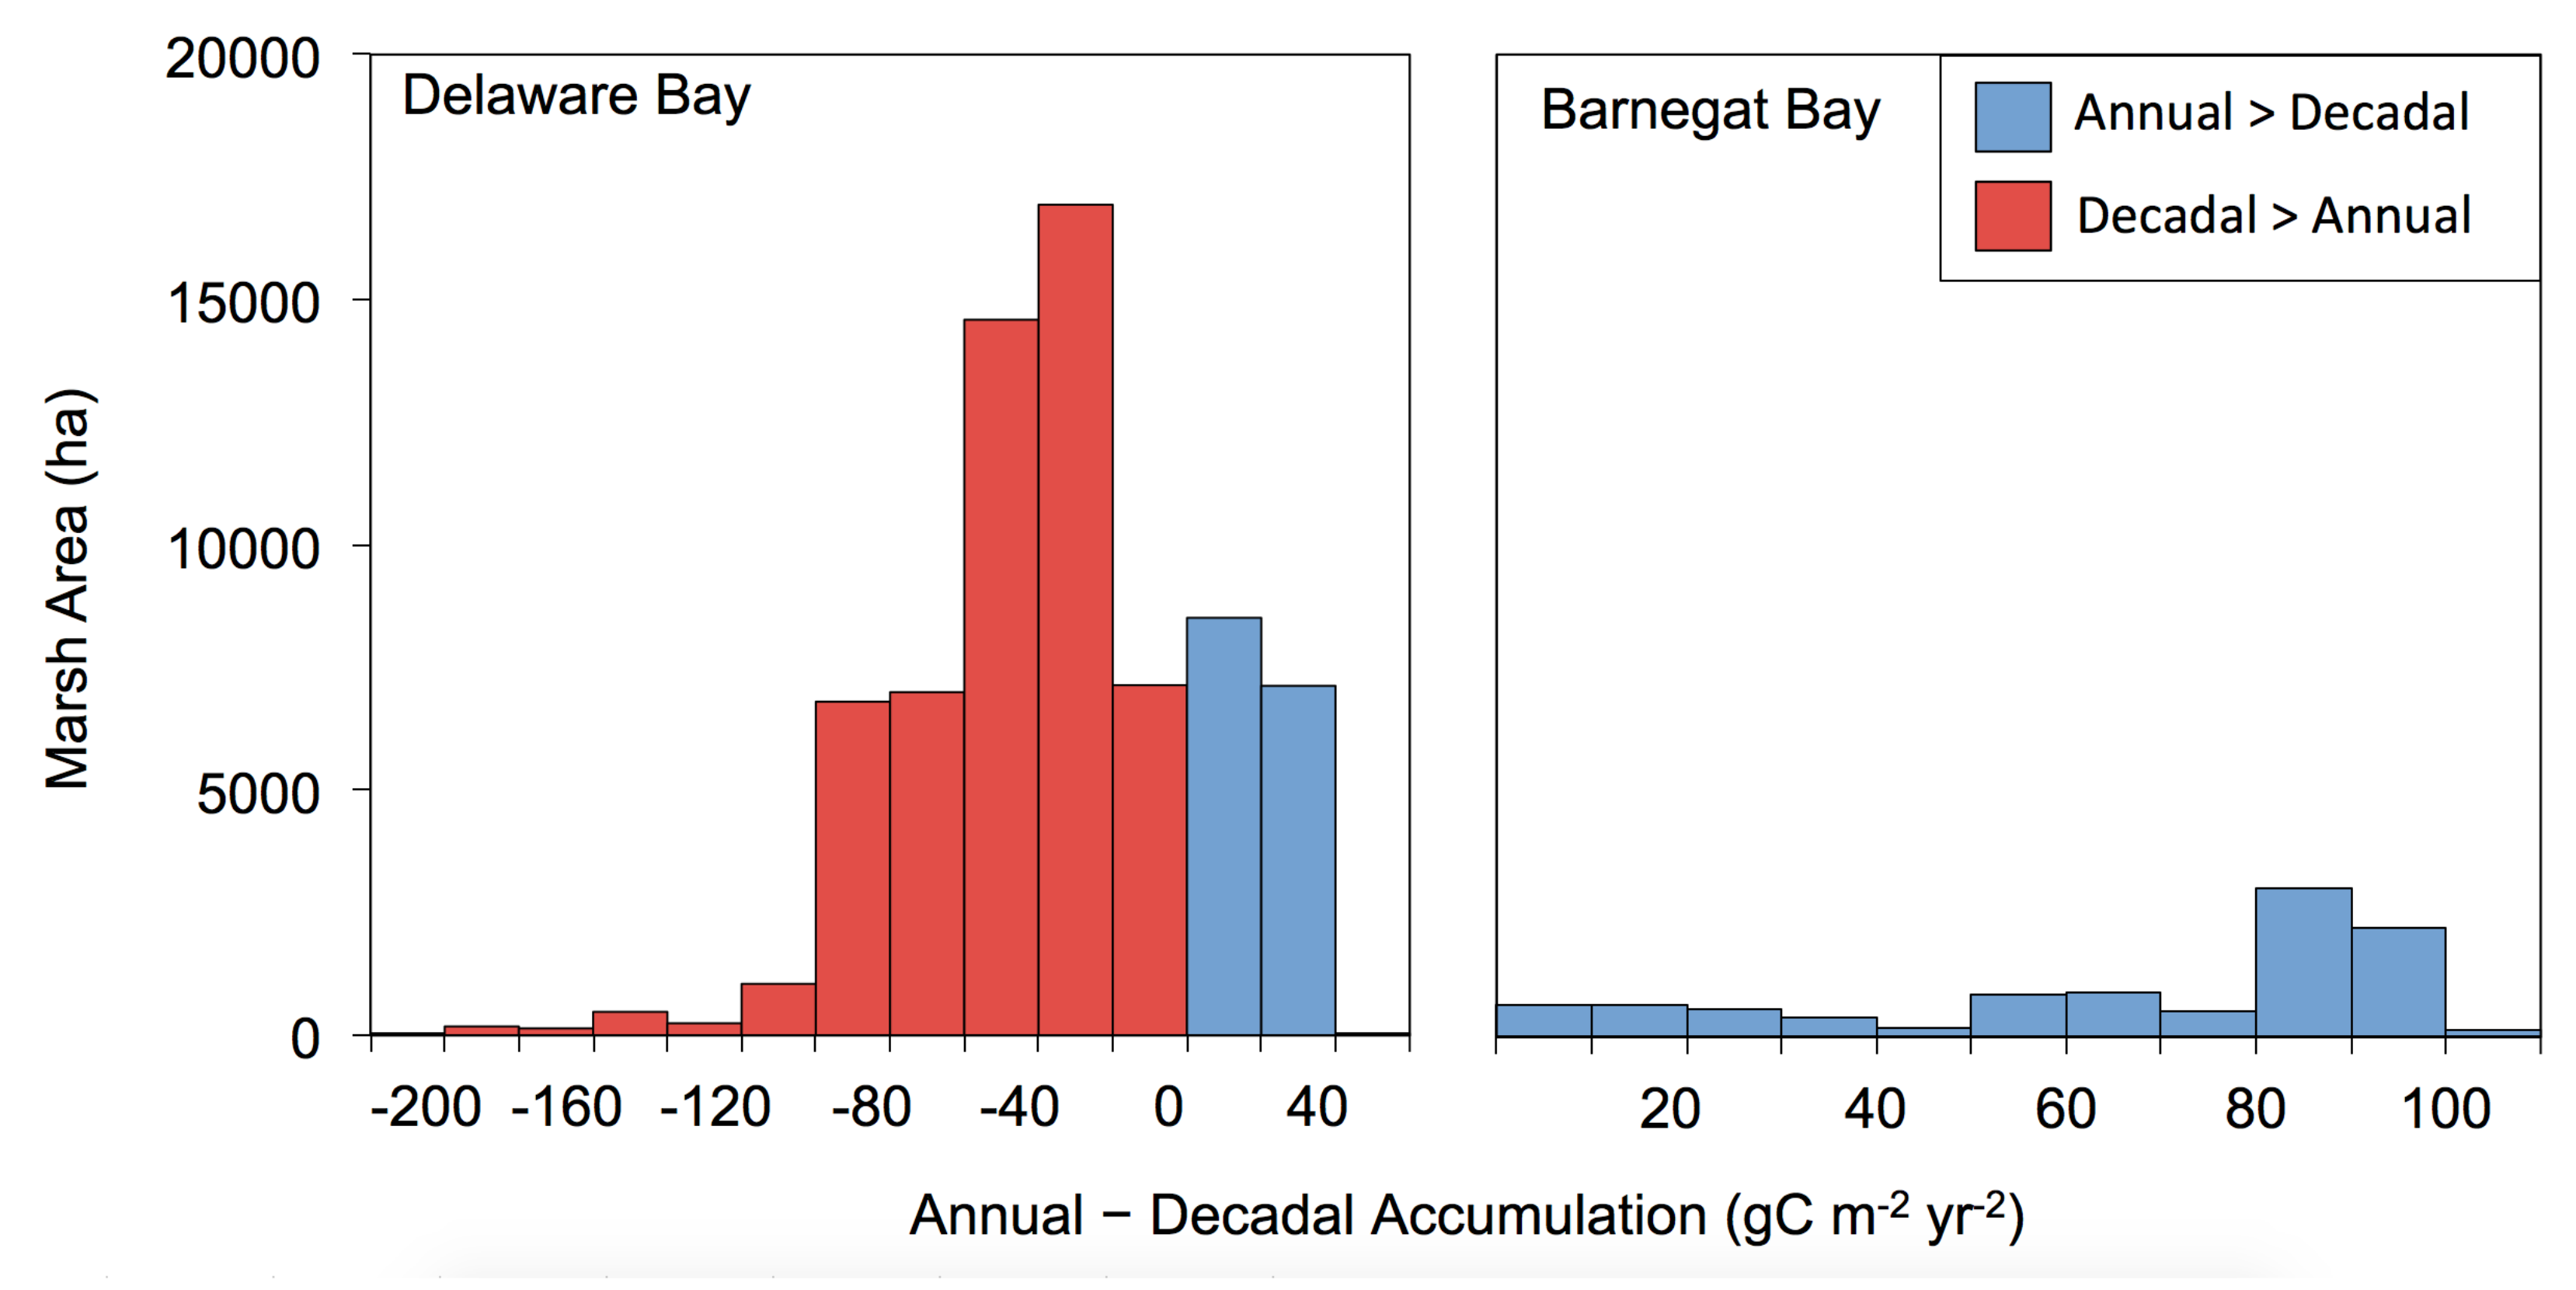
The carbon accumulation values in Barnegat Bay were greater for those calculated based on annual- rather than decadal-scale carbon accumulation measures. In contrast, for Delaware Bay, many of the decadal-scale measurements were greater (Figure 3). The decadal-scale method may incorporate more periods of erosion, while the annual-scale method records accumulation over a short time period, so it likely observes fewer episodes of erosion. Therefore, the observed differences of carbon accumulation values between the two methods likely partially depend on how they account for erosion. Previous studies also found that temporal scaling altered the apparent rate of sedimentation [8]. This effect causes higher apparent rates for shorter measurement intervals, which is consistent with the results of greater short-term rates in Barnegat Bay. However, certain areas in Delaware Bay had much larger decadal rates, which cannot be explained by time-scaling. This lower measured accumulation in the annual data potentially indicates lower modern sediment deposition from degrading marshes or reduced sedimentation.
In conclusion, for Barnegat Bay, the annual-scale method yielded higher carbon accumulation values than the decadal-scale, but in contrast, for Delaware Bay, the annual-scale method mostly yielded lower accumulation compared to the decadal-scale. A potential future application of this dataset could be to model carbon accumulation in tidal marshes, based on multiple parameters such as elevation, sediment source, and tidal regime, to indicate what variables control spatial patterns of carbon sequestration. In addition, future research related to these data may examine how carbon sequestration by tidal wetlands compares to emissions of other greenhouse gases, such as methane, investigate where carbon sequestration has declined over recent decades, and suggest target locations for tidal wetland restoration projects. The goal of sharing these data is to make wetland carbon sequestration data available to guide local wetland restoration efforts.

2. Data Description

2.1. Shapefiles of Carbon Accumulation

The four shapefiles include point locations of carbon accumulation (g C m−2 yr−1) measurements. Two files are for each of the two locations in Barnegat Bay and Delaware Bay. The sites contain a shapefile for both the short-term and long-term method of measuring carbon accumulation. The short-term measurement is the average accumulation over several years, and the long-term measurement is the yearly average accumulation over several decades. Annual measurements were collected at six sites in Barnegat Bay and 14 sites in Delaware Bay (Table 1, see Methods for more details). Decadal measurements were collected at four sites in Barnegat Bay and 43 sites in Delaware Bay (Table 2). Each shapefile contains metadata describing the data and attributes within ArcCatalog.

2.2. Interpolation Maps of Carbon Accumulation

The four raster format files are interpolation maps of the carbon accumulation data. Carbon accumulation values from the above shapefiles were interpolated throughout coastal wetland areas, for better visualization and spatial analysis. Pixel values are annual carbon accumulation rate in g C m−2 yr−1. Each raster also contains metadata. A saved layer file is also included, called “classification.lyr”, that saves the symbology of the interpolation maps as a proposed classification of the carbon accumulation values for visualization.

3. Methods

3.1. Annual Accumulation Measurement above Marker Beds

Annual carbon accumulation rates were measured at 10 locations (Table 1) in the Delaware Estuary and Barnegat Bay (two sites at each location), monitored as part of MACWA, as well as three locations monitored by DNERR.
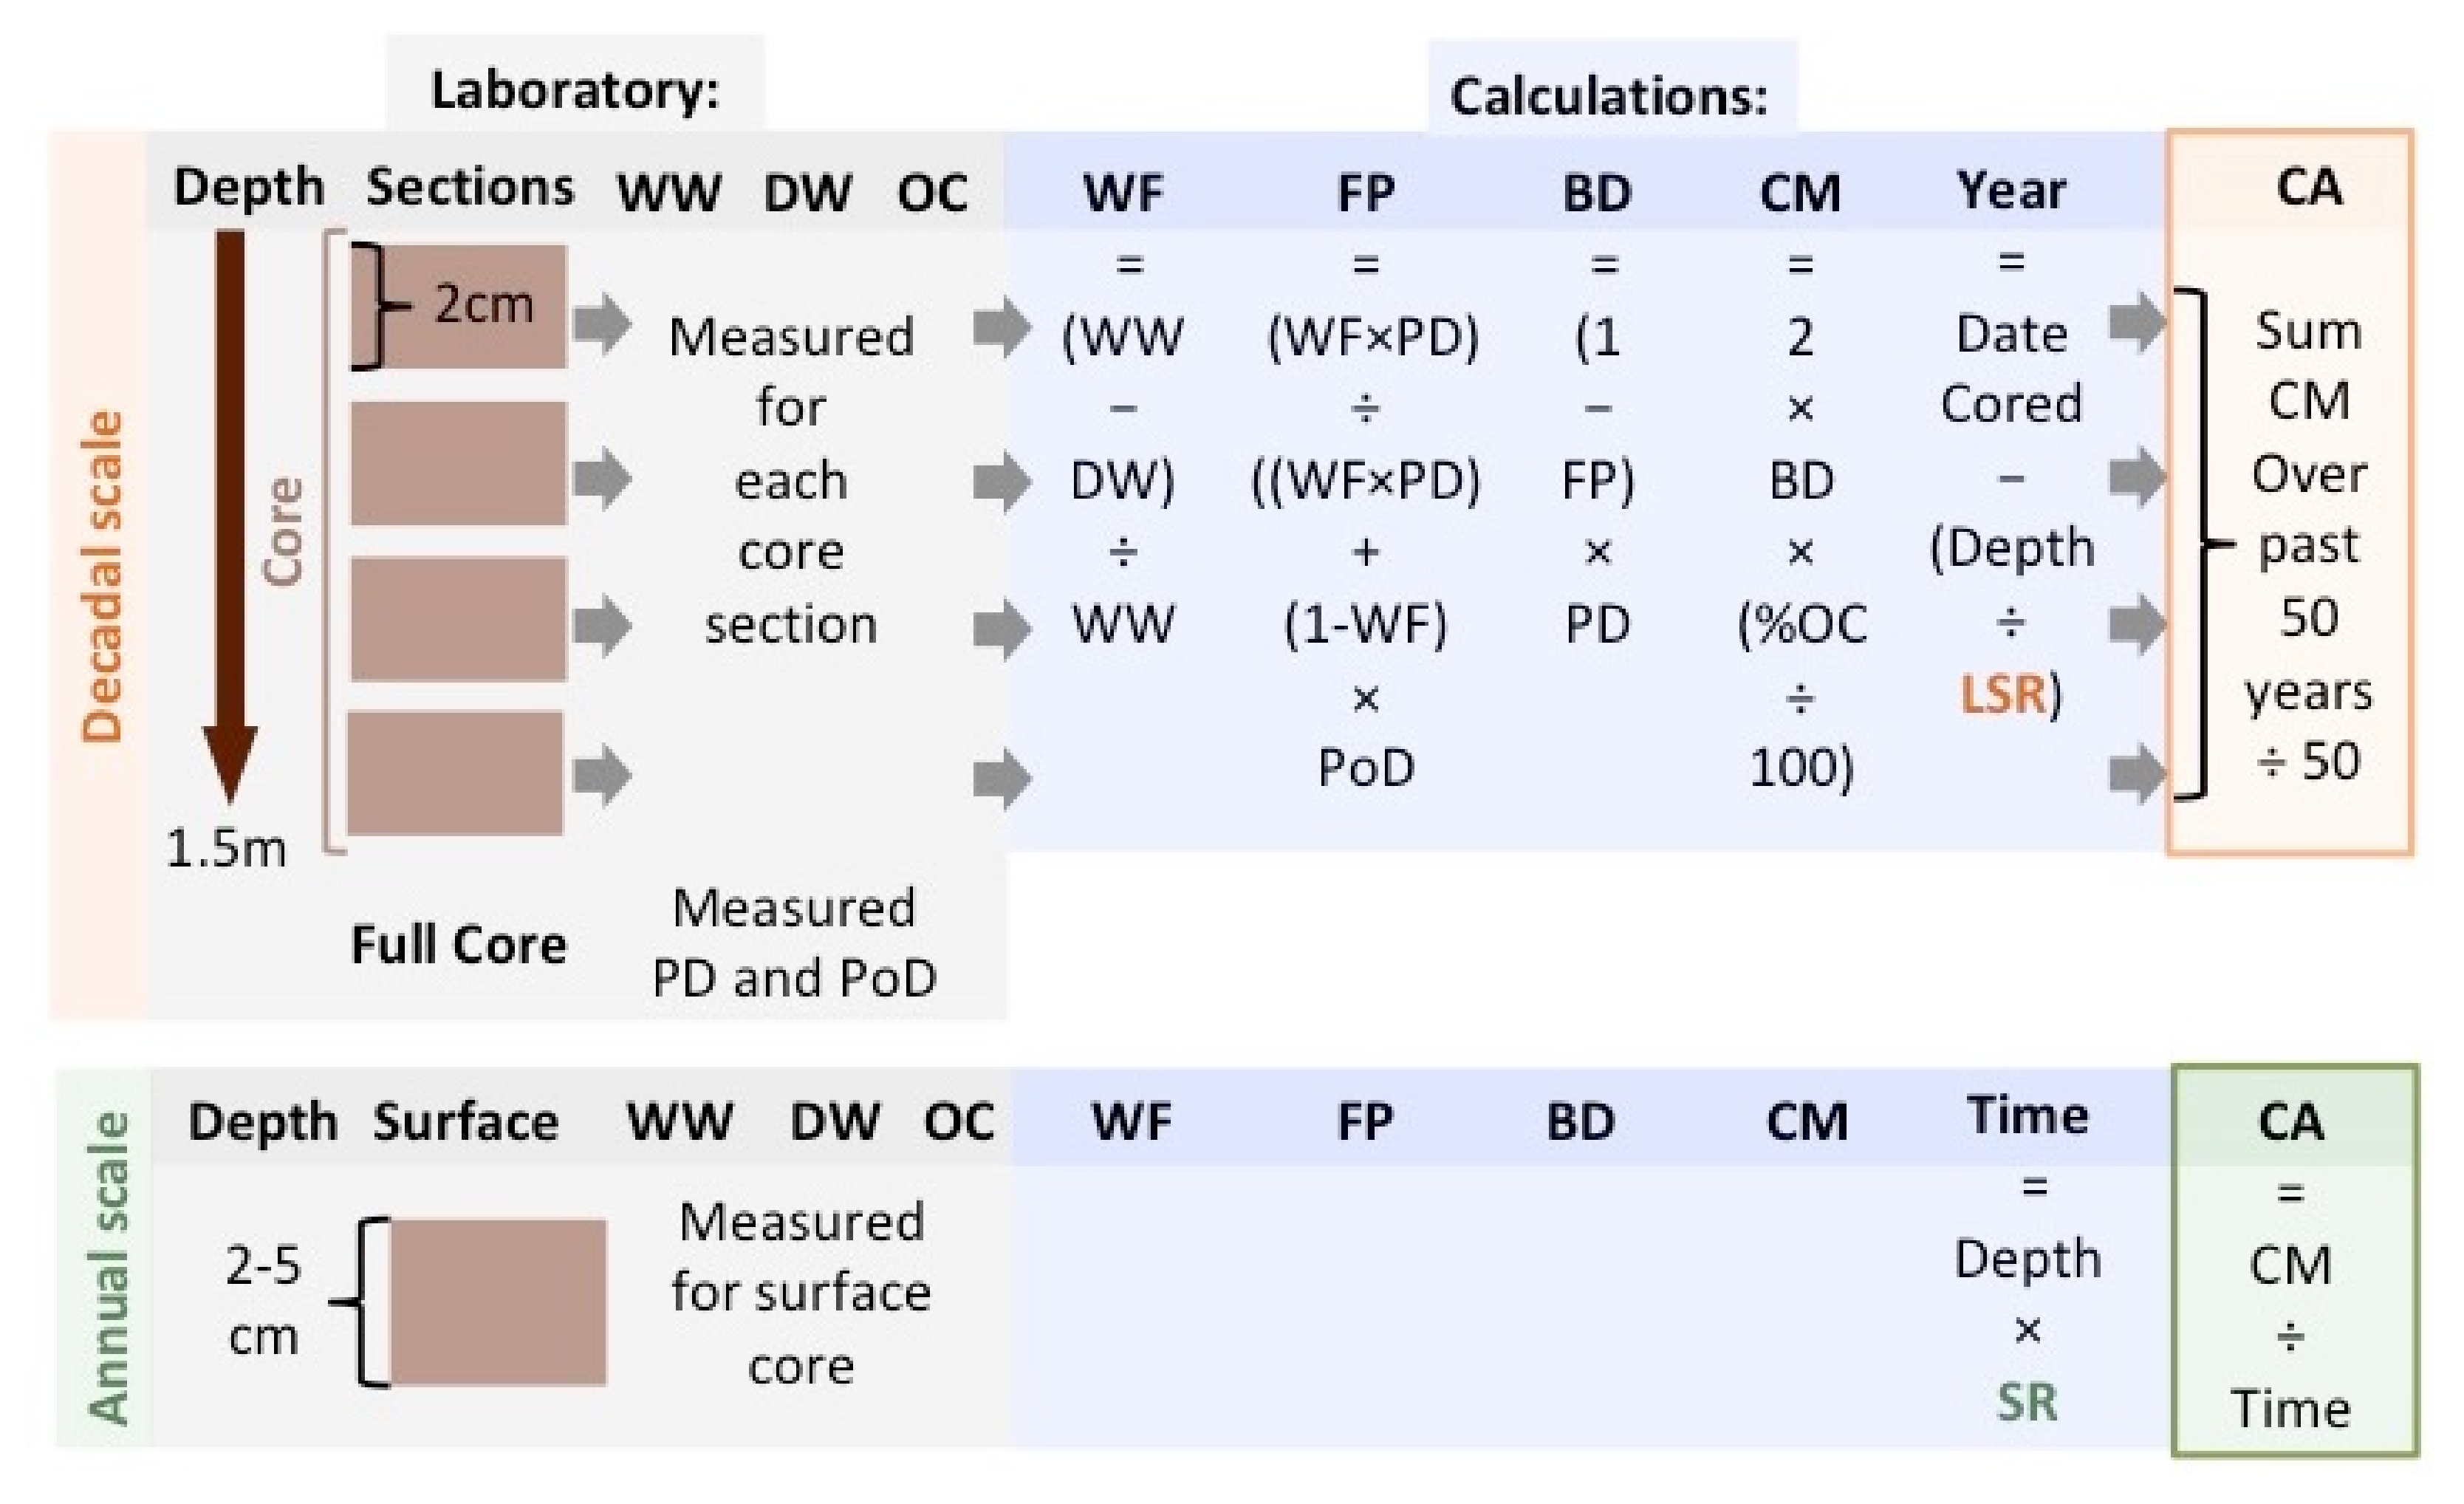
Accumulation rates were calculated based on seasonal or annual accretion measurements above feldspar marker beds associated with surface elevation tables (SET). SETs are benchmarks kept at a constant elevation by deep rods inserted into the marsh until they hit resistance. Three feldspar marker beds were created at each SET table site and were 50 cm × 50 cm wide, and approximately 3.5 kg of feldspar was added to each plot. SETs and feldspar beds were measured annually, from 2010 to 2016. Several short sediment cores were also collected to measure bulk density and organic carbon. Dry bulk density was measured by weighing samples and drying to a constant mass. Percent organic carbon of homogenized and pulverized samples was measured by using Flash 112 EA from the top two to five centimeters of sediment cores collected and averaged from 2010 to 2016. Field methods and calculations of accumulation are represented in Figure 4.
Potential sources of error in these methods include spatial variation of sedimentation throughout the marsh compared to the point locations sampled, loss of visibility of a feldspar layer or alternation of the sediment depth at a SET location, loss of mass during laboratory procedures, or weighing and other laboratory instrumentation errors (0.01–6.81% uncertainty from organic carbon measurement and 6.2% uncertainty from dry bulk density measurement [13]).

3.2. Decadal Measurement from Sediment Cores

Decadal-scale carbon accumulation rates were based on collection, analysis, and dating of four cores from Barnegat Bay and 43 cores from Delaware Bay (from 17 marshes with one to six cores per marsh, Table 2). The long cores were collected between 2007 and 2012 [10,11,12,13,14]. In addition, 24 short cores were collected from Delaware Bay in 2014 [13].
Piston cores (1–1.5 m length) were collected, and dry bulk density and organic carbon percent were analyzed on 2 cm intervals. Profiles of both 210Pbxs and 137Cs were measured by using gamma spectroscopy, using the 46.5 and 661.7 keV photopeaks and count times of 24–48 hours, on a Canberra Model 2020 low-energy geranium detector. The chronologies created using the two radioisotope dating methods (210Pbxs and 137Cs) had good agreement and yielded similar dates. Further information about dating methods and calculation errors is available for Delaware Bay [13] (Table 3) and for Barnegat Bay [14] (Figure 2 and Figure 3). Carbon accumulation rates were calculated by using the 137Cs chronology, assuming that the activity peak is at 1963 and using a simple constant flux-constant sedimentation rate model [17]. Decadal-scale measurements of accretion rate span nearly 50 years. Calculations of carbon accumulation from the sediment cores are represented in Figure 4.
Potential sources of error in these methods include spatial variation of sedimentation throughout the marsh compared to the point locations of cores, uncertainty in dating techniques (5–8% uncertainty from 137Cs detection [13]), and laboratory instrumentation errors (0.01–6.81% uncertainty from organic carbon measurement and 6.2% uncertainty from dry bulk density measurement [13]).

3.3. Interpolation Mapping

Point measurements of carbon sequestration were converted to a shapefile in ArcGIS (version 10.2.2, ESRI, Redlands, CA, USA). The extent of the domain was based on estuarine and palustrine emergent wetlands in Barnegat Bay and Delaware Bay, from 2010 NOAA C-CAP land cover data. This NOAA land cover classification was generated by using automated and manual approaches, with a classification and regression tree (CART) analysis of 30 m Landsat imagery. The two wetland classes selected for this analysis include marsh vegetation, defined as erect, rooted, herbaceous hydrophytes in both fresh water (salinity below 0.5 ppt) of palustrine wetlands and saline water of estuarine wetlands. All tidal water regimes were included in these marsh classes, except subtidal and irregularly exposed areas [18].
The data were interpolated to the spatial extent of wetlands by using kriging in ArcGIS. Kriging was selected for this analysis because other research studies have implemented kriging for spatial interpolation of carbon and other nutrients in wetland sediments [19,20,21]. In addition, statistical analyses of the data indicate that the assumptions of kriging are met. The data appear normally distributed in a histogram and fit a Normal Q–Q Plot. They have statistically significant spatial autocorrelation based on a Global Moran’s I test in ArcGIS (z-score 1.92; p-value 0.05). The number of data points is sufficient because the points are normally distributed and show statistical autocorrelation, meeting the assumptions of kriging. The kriging Spatial Analyst tool was selected for analysis because of its capabilities to constrain the processing extent within tidal marsh areas. Ordinary kriging and a spherical model semivariogram were selected. The lag parameter of the semivariogram was based on the output raster cell size, and other parameters were computed internally.
Accuracy of the kriging interpolation was estimated by using leave-one-out cross validation, where each sampling point was left out, and the interpolated value was compared to the sample point. Prediction errors, using the root mean square error, were 27 and 26 g C m−2 y−1 for the annual and decadal measurements in Barnegat and 76 g C m−2 y−1 for the decadal measurements in Delaware Bay. The greatest prediction error of 134 g C m−2 y−1 was calculated for the annual data in Delaware Bay, indicating the most uncertainty.
The field locations of the site broadly cover the tidal marsh areas, so the majority of the map areas are interpolated data. At the ends of the maps, small areas are extrapolated to the edges of the marsh extent. Extrapolation adds more error to analysis and is accounted for by the leave-one-out cross validation. Values were extrapolated to the marsh edges because the applicability of the datasets to wetland research is improved by visualization of data across the full marsh extent.
Prior to analysis with kriging, the dataset was checked for outliers [22]. Because the distribution of the dataset is normal, the mathematical definition of an outlier (greater than the 3rd quartile plus 1.5 times the interquartile range) was utilized to identify a few outliers in the carbon accumulation data. These outliers are at sites in the Delaware Bay, including Crosswicks in the annual data and Rancocas and St. Georges Site 3 in the decadal data. Since these sites represent the only points with in the upper marshes of the Delaware River, exclusion of them would remove a large portion of data in the upper bay. The limited coverage of the upper Delaware Bay is primarily a consequence of fewer tidal wetlands in this area. Because there is also no methodological error to justify excluding these outlier measurements, they were not removed from the datasets, but interpolation error is great in the Upper Delaware Bay. Further studies should include more measurements of carbon accumulation in these areas of the Upper Delaware Bay.

Supplementary Materials

Wetland Carbon Dataset. The following are available online at https://www.mdpi.com/2306-5729/5/1/11/s1.

Author Contributions

E.W. and L.C. conceived of and carried out the study; D.V., C.S., K.T. and K.S.L. provided and curated data; E.W. acquired funding; and L.C. wrote the data descriptor. All authors have read and agreed to the published version of the manuscript.

Funding

This work was supported by the US Environmental Protection Agency, under award #CE98212312.

Acknowledgments

We acknowledge fieldwork support and project management from K. Raper, L. Haaf, and T. Elsey-Quirk.

Conflicts of Interest

The authors declare no conflicts of interest. The funders had no role in the design of the study; in the collection, analyses, or interpretation of data; in the writing of the manuscript; or in the decision to publish the results.

References

  1. Mcleod, E.; Chmura, G.L.; Bouillon, S.; Salm, R.; Björk, M.; Duarte, C.M.; Lovelock, C.E.; Schlesinger, W.H.; Silliman, B.R. A blueprint for blue carbon: Toward an improved understanding of the role of vegetated coastal habitats in sequestering CO2. Front. Ecol. Environ. 2011, 9, 552–560. [Google Scholar] [CrossRef] [Green Version]
  2. Murray, B.; Pendleton, L.; Jenkins, A.; Sifleet, S. Green Payments for Blue Carbon: Economic Incentives for Protecting Threatened Coastal Habitats; Nicholas Institute for Environmental Policy Solutions: Durham, NC, USA, 2011; p. 42. [Google Scholar]
  3. Holmquist, J.R.; Windham-Myers, L.; Bliss, N.; Crooks, S.; Morris, J.T.; Megonigal, J.P.; Troxler, T.; Weller, D.; Callaway, J.; Drexler, J.; et al. Accuracy and Precision of Tidal Wetland Soil Carbon Mapping in the Conterminous United States. Sci. Rep. 2018, 8. [Google Scholar] [CrossRef] [PubMed] [Green Version]
  4. Schelske, C.L.; Odum, E.P. Mechanisms Maintaining High Productivity in Georgia Estuaries; University of Georgia Marine Institute: Darien, GA, USA, 1961; pp. 75–80. [Google Scholar]
  5. Watson, E.B. Changing elevation, accretion, and tidal marsh plant assemblages in a South San Francisco Bay tidal marsh. Estuaries 2004, 27, 684–698. [Google Scholar] [CrossRef]
  6. Couwenberg, J.; Dommain, R.; Joosten, H. Greenhouse gas fluxes from tropical peatlands in south-east Asia. Glob. Change Biol. 2010, 16, 1715–1732. [Google Scholar] [CrossRef]
  7. Singh, A.; Fienberg, K.; Jerolmack, D.J.; Marr, J.; Foufoula-Georgiou, E. Experimental evidence for statistical scaling and intermittency in sediment transport rates. J. Geophys. Res. Earth Surf. 2009, 114, F01025. [Google Scholar] [CrossRef] [Green Version]
  8. Sadler, P.M. The influence of hiatuses on sediment accumulation rates. GeoRes. Forum. 1999, 5, 15–40. [Google Scholar]
  9. Schumer, R.; Jerolmack, D.J. Real and apparent changes in sediment deposition rates through time. J. Geophys. Res. Earth Surf. 2009, 114, F00A06. [Google Scholar] [CrossRef] [Green Version]
  10. Boyd, B.M.; Sommerfield, C.K.; Elsey-Quirk, T. Hydrogeomorphic influences on salt marsh sediment accumulation and accretion in two estuaries of the US Mid-Atlantic coast. Mar. Geol. 2017, 383, 132–145. [Google Scholar] [CrossRef] [Green Version]
  11. Church, T.M.; Sommerfield, C.K.; Velinsky, D.J.; Point, D.; Benoit, C.; Amouroux, D.; Plaa, D.; Donard, O.F.X. Marsh sediments as records of sedimentation, eutrophication and metal pollution in the urban Delaware Estuary. Mar. Chem. 2006, 102, 72–95. [Google Scholar] [CrossRef]
  12. Velinsky, D.J.; Sommerfield, C.K.; Charles, D. Vertical Profiles of Radioisotopes, Nutrients and Diatoms in Sediment Cores from the Tidal Murderkill River Basin: A Historical Analysis of Ecological Change and Sediment Accretion. Final Report submitted to Dr. Mirsajadi Hassan (DNREC, Watershed Assessment Section, Division of Water Resources, Dover, DE). Available online: http://www.dnrec.delaware.gov/swc/wa/Documents/WAS/Murderkill%20River%20Reports/New%20Murderkill%20Page/5.%20%20Study%20of%20Sediment%20Nutrients%20and%20Ecological%20History.pdf (accessed on 25 January 2020).
  13. Tucker, K.J. Variability of Organic Carbon Accumulation on a Tidal Wetland Coast. Master’s Thesis, University of Delaware, Newark, DE, USA, 2016. [Google Scholar]
  14. Velinsky, D.J.; Paudel, B.; Belton, T.J.; Sommerfield, C.K. Tidal marsh record of nutrient loadings in Barnegat Bay, New Jersey. J. Coast. Res. 2017, 78, 79–88. [Google Scholar] [CrossRef]
  15. Chmura, G.L.; Anisfeld, S.C.; Cahoon, D.R.; Lynch, J.C. Global Carbon Sequestration in Tidal, Saline Wetland Soils. Glob. Biogeochem. Cycle. 2003, 17, 4. [Google Scholar] [CrossRef]
  16. Unger, V.; Elsey-Quirk, T.; Sommerfield, C.; Velinsky, D.J. Stability of organic carbon accumulating in Spartina alterniflora-dominated salt marshes of the Mid-Atlantic US. Estuar. Coast. Shelf Sci. 2016, 182, 179–189. [Google Scholar] [CrossRef]
  17. Appleby, P.G.; Oldfield, F. Applications of lead-210 to sedimentation studies. In Uranium-Series Disequilibrium: Applications to Earth, Marine, and Environmental Sciences, 2nd ed.; Clarendon Press: Oxford, UK, 1992. [Google Scholar]
  18. National Oceanic and Atmospheric Administration, Office for Coastal Management. National Oceanic and Atmospheric Administration, Office for Coastal Management. “Pennsylvania 2010”, “New Jersey 2010”, “Delaware 2010.” Coastal Change Analysis Program (C-CAP) Regional Land Cover. Charleston, SC: NOAA Office for Coastal Management. Available online: https://www.coast.noaa.gov/ccapftp/#/ (accessed on 25 January 2020).
  19. Grunwald, S.; Reddy, K.R.; Newman, S.; DeBusk, W.F. Spatial variability, distribution and uncertainty assessment of soil phosphorus in a south Florida wetland. Environmetrics 2004, 15, 811–825. [Google Scholar] [CrossRef]
  20. Mishra, U.; Lal, R.; Slater, B.; Calhoun, F.; Liu, D.; Van Meirvenne, M. Predicting Soil Organic Carbon Stock Using Profile Depth Distribution Functions and Ordinary Kriging. Soil Sci. Soc. Am. J. 2009, 73, 614–621. [Google Scholar] [CrossRef] [Green Version]
  21. Kral, F.; Corstanje, R.; White, J.R.; Veronesi, F. A Geostatistical Analysis of Soil Properties in the Davis Pond Mississippi Freshwater Diversion. Soil Sci. Soc. Am. J. 2012, 76, 1107–1118. [Google Scholar] [CrossRef]
  22. Armstrong, M.; Boufassa, A. Comparing the robustness of ordinary kriging and lognormal kriging: Outlier resistance. Math. Geol. 1988, 20, 447–457. [Google Scholar] [CrossRef]
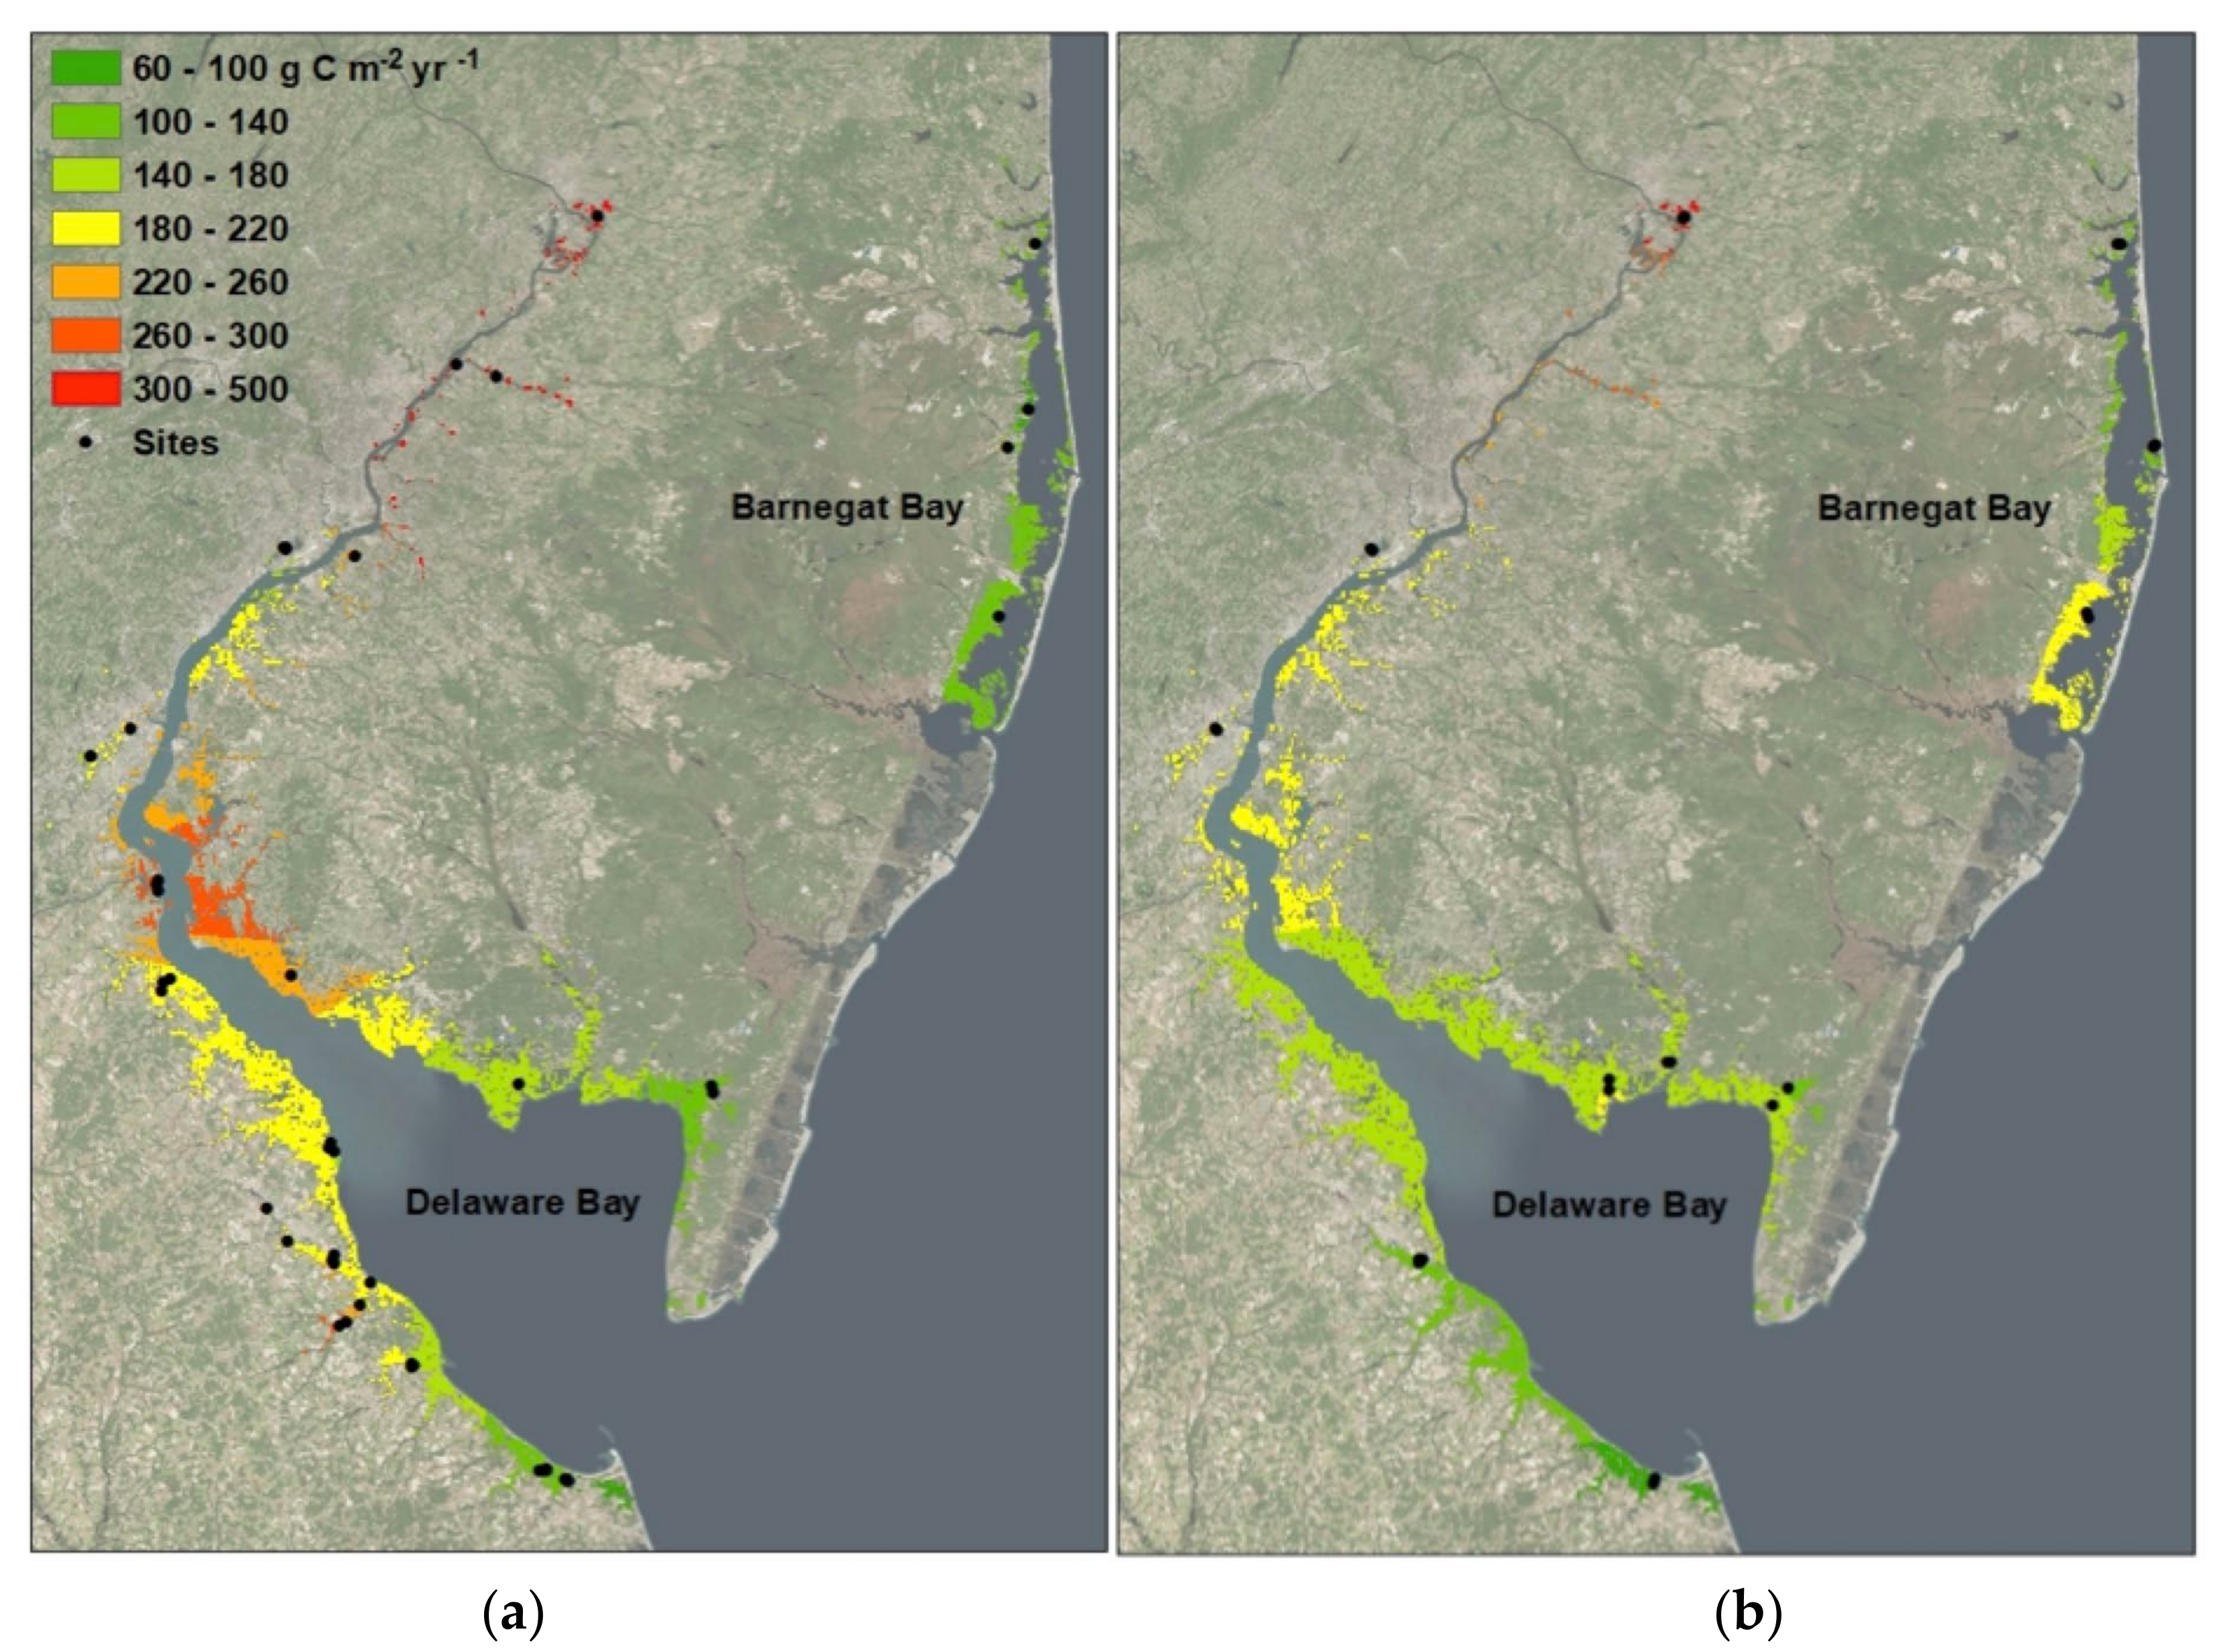
Figure 1. Interpolation maps of yearly carbon accumulation in Delaware Bay and Barnegat Bay, based on accumulation rates estimated by using (a) 137Cs dating and (b) from marker bed measures.
Data 05 00011 g001
Figure 2. Estimates of total yearly organic carbon sequestration by wetlands in Delaware Bay and Barnegat Bay from area-weighted averages. Prediction error was calculated as the root mean square error from leave-one-out cross validation and is also shown as the error bars on the graph.
Data 05 00011 g002
Figure 3. This figure shows the area of marshes that had different values of carbon accumulation between the two methods of measuring accumulation, both annual and decadal. These histograms were calculated by subtracting the decadal interpolation map from the annual map, using the ArcGIS raster calculator. The values were multiplied by the pixel size of the raster, to estimate the area with higher or lower accumulation between the two maps. Histogram values at zero on the x axis indicate that the annual and decadal maps predicted the same values of carbon accumulation. The red bars of the graph show the marsh area where carbon accumulation was greater in the decadal maps, while the blue bars indicate that accumulation rates measured using the annual method were greater than rates measured on the decadal timescale. The majority of marsh area in Delaware Bay had greater rates for the decadal method (red), while all areas of Barnegat Bay had greater values with the annual method (blue). This figure indicates that there are differences between the two methods of calculating accumulation.
Data 05 00011 g003
Figure 4. This figure shows the difference between the “annual” and “decadal” methods of calculating carbon accumulation. All steps of field, laboratory, and calculations are detailed in this figure.
Data 05 00011 g004aData 05 00011 g004b
Table 1. Research sites of annual measurements of carbon accumulation above marker layers. Each line of the table corresponds to the location of one SET table and three averaged feldspar marker horizons that were measured annually, from 2010 to 2016.
SiteEstuaryLocation
(Coordinates)
Site IDC Seq
(g C m−2y−1)
Crosswicks CreeksDelaware BayBordentown, NJ (40°9.76′ N, 74°42.51′ W)SET 1
SET 3
479
164
Tinicum MarshDelaware BayPhiladelphia, PA (39°52.91′ N, 75°16.64′ W)SET 1
SET 3
206
204
Dividing CreekDelaware BayDividing Creek, NJ (39°14.14′ N, 75°6.76′ W)SET 1
SET 3
230
104
Dennis CreekDelaware BaySouth Dennis, NJ (39°10.58′ N, 74°51.74′ W)SET 1
SET 3
186
104
Christina RiverDelaware BayWilmington, DE (39°43.21′ N, 75°33.74′ W)SET 1
SET 3
272
150
Broadkill CreekDelaware BayLewes, DE (39°47.24′ N, 75°9.96′ W)SET 1
SET 3
116
60
St. Jones CreekDelaware BayBowers, DE (39°5.01′ N, 75°26.30′ W)Boardwalk 1 Reverse Ditch 4 Trail 2088
30
269
Maurice RiverDelaware BayBilvalve, NJ (39°15.95′ N, 74°59.72′ W)SET 1
SET 3
207
151
Reedy CreekBarnegat BayBrick, NJ (40°1.74′ N, 74°5.07′ W)SET 1
SET 3
124
92
Island BeachBarnegat BaySeaside Park, NJ (39°47.96′ N, 74°6.10′ W)SET 1
SET 3
141
101
Horse PointBarnegat BayWest Creek, NJ (39°37.59′ N, 74°15.43′ W)SET 1
SET 3
211
198
Table 2. Research sites of decadal measurements of carbon accumulation from deep cores. Each line of the table corresponds to the location of one deep sediment core extracted between 2007 and 2014.
SiteEstuaryLocation
(Coordinates)
Site IDC Seq
(g C m−2y−1)
Canary CreekDelaware BayLewes, DE (38°46.97′ N, 75°10.25′ W)CC-1
CC-2
CC-3
CC-5
CC-6
28
68
268
106
136
Dennis CreekDelaware BayDennisville, NJ (39°10.92′ N, 74°10.25′ W)DEN-1
DEN-3
154
117
CrosswicksDelaware BayBordentown, NJ (40°9.76′ N, 74°42.51′ W)CCR-3348
Rancocas MarshDelaware BayDelran, NJ (40°2.54′ N, 74°58.11′ W)RAN-1
RAN-2
419
503
Tinicum MarshDelaware BayPhiladelphia, PA (39°52.91′ N, 75°16.64′ W)1B
2A
3B
139
195
95
Woodbury CreekDelaware BayThorofare, NJ (39°51.41′ N, 75°10.73′ W)WC-1254
Dravo CreekDelaware BayWilmington, DE (39°43.22′ N, 75°33.72′ W)DM-2256
ChurchmanDelaware BayWilmington, DE (39°42.02′ N, 75°37.81′ W)CM-1135
St. GeorgesDelaware BayPort Penn, DE (39°32.77′ N, 75°34.20′ W)SG-1
SG-2
SG-3
223
212
440
Blackbird CreekDelaware BayTownsend, DE (39°25.40′ N, 75°36.11′ W)BC-1
BC-2
BC-3
194
203
183
Stow CreekDelaware BayGreenwich, NJ (39°24.56′ N, 75°24.54′ W)SC-1260
Kelly IslandDelaware BayDover, DE (39°12.76′ N, 75°24.25′ W)KI-1
KI-2
KI-3
204
144
179
St. Jones RiverDelaware BayBowers, DE (39°5.01′ N, 75°26.30′ W)H2
WC1-2
SJBM-1
SJBM-2
SJBM-3
240
156
116
337
209
Mispillion RiverDelaware BayMilford, DE (38°56.87′ N, 75°21.23′ W)MR-1
MR-2
MR-3
146
153
188
Great MarshDelaware BayMilton, DE (38°47.99′ N, 75°11.74′ W)GM-1
GM-2
GM-3
GM-4
103
99
141
142
Dividing CreekDelaware BayDividing Creek, NJ (39°14.14′ N, 75°6.76′ W)DC-2148
Murderkill RiverDelaware BayFrederica, DE (39°14.14′ N, 75°6.76′ W)MK-1
MK-2
MK-3
MK-4
302
307
209
161
MantololkingBarnegat BayBrick, NJ (40°1.79′ N, 74°4.79′ W)BB-1109
Mid-BayBarnegat BayLacey, NJ (39°50.86′ N, 74°8.84′ W)BB-281
Oyster CreekBarnegat BayLacey, NJ (39°48.65′ N, 74°11.41′ W)BB-3122
West CreekBarnegat BayEagleswood, NJ (39°37.64′ N, 74°15.61′ W))BB-4100