Article

Gifted and Talented Services for EFL Learners in China: A Step-by-Step Guide to Propensity Score Matching Analysis in R

1
Center for Research and Development in Dual Language and Literacy Acquisition (CRDLLA), Department of Educational Psychology, College of Education and Human Development, Texas A&M University, College Station, TX 77843, USA
2
Department of Educational Psychology, College of Education and Human Development, Texas A&M University, College Station, TX 77843, USA
3
School of Foreign Languages, Hubei University of Technology, Wuhan 430068, China
*
Author to whom correspondence should be addressed.
Data 2019, 4(3), 119; https://doi.org/10.3390/data4030119
Submission received: 1 July 2019 / Revised: 31 July 2019 / Accepted: 1 August 2019 / Published: 3 August 2019

Abstract

:
We sought to quantify the effectiveness of a gifted and talented (GT) program, as was provided to university students who demonstrated a talent for learning English as a foreign language (EFL) in China. To do so, we used propensity score matching (PSM) techniques to analyze data collected from a tier-1 university where an English talent (ET) program was provided. Specifically, we provided (a) a step-by-step guide of PSM analysis using the R analytical package, (b) the codes for PSM analysis and visualization, and (c) the final analysis of baseline equivalence and treatment effect based on the matching sample. Collectively, the results of descriptive statistics, visualization, and baseline equivalence indicate that PSM is an effective matching technique for generating an unbiased counterfactual analysis. Moreover, the ET program yields a statistically significant, positive effect on ET students’ English language proficiency.

1. Introduction

Since the policy of Reform and Opening-Up was initiated in 1978, English has become the dominant foreign language subject at all levels of the Chinese education system [1]. The unique status of the English language has been constantly promoted and escalated as a result of several seminal events, such as China joining the World Trade Organization (WTO) in 2001, hosting the Olympic Games in Beijing in 2008, and initiating the policy of “One Belt, One Road” started by President Xi Jinping in 2013. These milestones have been accompanied by great opportunities for Chinese universities to demonstrate their value in preparing college students for the talent of international communication [2]. It has also led to an urgent need and shortage of foreign language talent needed to promote the progress of “introducing Chinese culture to the world” [3]. There has been growing interest in the effects of gifted and talented (GT) education around the world. The students who receive those services, although they could vary across different studies, generally speaking have demonstrated very high academic achievement performance in one or more subjects (e.g., [4,5,6]), or are ranked as above the 95th percentile on standardized tests [7]. However, in the field of GT education, the challenges do not only come from the identification of gifted students, but also the evaluation of GT programs. Evaluation within gifted education is essential, because it allows for monitoring the progress and growth of the GT students and furthering the effectiveness of the educational interventions [8]. In this study, we first review the cultural impact of GT education as well the current challenges of GT education in the English as a foreign language (EFL) context in China, especially regarding the issues related to methodology and evaluation. Furthermore, we present a practical yet rigorous evaluation method, propensity score matching (PSM), with steps and a demonstration to evaluate the effectiveness of a GT program for EFL, or an English talent (ET) program in the Chinese EFL education context.

2. Literature Review

2.1. Gifted and Talented and English as a Foreign Language Education in China

There are some unique social and cultural factors in the Chinese educational context that are reflected in GT education. First, Chinese culture places an extremely high value on education [9]. Students have no option but to perform well on the Zhongkao (entrance examination for high school) and in the National College Entrance Examination (NCEE) to be accepted into a well-known high school or top university [10]. It is worth noting that EFL is a required subject for both the Zhongkao and the NCEE, and carries the same weight in the scoring as other core courses, such as Chinese language arts and mathematics. Second, Chinese people have been greatly influenced by the ideology of collectivism, in which individuals should follow the expectation of his/her family and community [11], which leads to the phenomenon that a student’s academic achievement represents the glory (mianzi or “face” in Chinese culture) of his/her family [12]. Therefore, in Chinese culture, talented students are always associated with high social status, reputation, and prestige; their family has an even higher expectation of their academic success [9,13]. Third, Chinese general beliefs hold that GT is related to creativity in science, but barely so in liberal arts, which was reported in a few empirical [11,14]. For example, Zhang [13] emphasized that Chinese culture attributes “meritorious salience” to the value of high achievement, while western culture places more value on “aesthetic salience”, which results in GT-related research in China focusing on science-related disciplines instead of art or art-related subjects.
As was mentioned earlier, EFL is a required subject in the two most critical exams, the Zhongkao and the NCEE, for the students who intend to attend colleges and universities, and is the dominant foreign language education in China [1,15]. College English (CE) was established for undergraduate science majors in 1985 and for liberal art majors in 1986 [16,17]. Since then, CE has been designed as a two-year compulsory course for all non-English majors [15]. Moreover, the College English Test Band Four (CET-4) is the only nationwide standardized test for non-English major students at the university level [18], and many universities require students to pass this test as a prerequisite for obtaining a bachelor’s degree [15]. Based on Rao and Lei’s [19] analysis, college students take an average of 300 h of CE classroom instruction, which is equivalent to 16 credit hours to fulfill the bachelor’s degree. However, concerns have been raised regarding the extensive amount of instructional time with less challenging content that has failed to meet students’ needs [19] and made them less motivated [20], which led to a heated discussion of instructional hour reduction [15]. On the other hand, a more in-depth analysis showed that more than 90% of non-English major students passed the CET-4 in the first two years of college/university when CE was offered as a compulsory course; however, less than 10% scored 77% and above to be eligible to take CET-4 Oral Exam, a more advanced English proficiency sub-exam of CET-4 [15]. Tao also pointed out that many college students do not feel confident expressing their thoughts orally, due to limited English proficiency.
There are students who have demonstrated a higher level of English language proficiency and talents in expressing themselves in English, and they are exposed to great opportunities for receiving small-group training for speech competitions (e.g., the China Daily Cup, the CCTV Cup, and the 21st Century Cup) or advanced English public speaking courses limited to select students with highly advanced English language proficiency [15,21,22]. We only identified two studies that investigated the impact of this type of special course/training on students’ self-efficacy (i.e., [23]) or self-reflection on their progress in English language proficiency (i.e., [22]). However, there is no existing empirical study reporting the effectiveness of this small-group training/advanced course on the ET students’ English language proficiency, not to mention the methods to evaluate such effectiveness.

2.2. Evaluation Design Approach and Propensity Score Matching

As suggested by Yuen et al. [24], GT students spend less time practicing basic skills and benefit greatly from curriculum acceleration and higher-order thinking tasks. It is crucial to provide GT students with a learning environment where they can personalize and take ownership of their learning [25]. Because it is challenging for teachers to create equal opportunities for students with different levels of abilities in the same class [24], modifications of curriculum content and instruction or differentiated instruction for GT students are recommended [26,27,28,29]. However, the effectiveness of GT services remains to be established, due to the lack of rigorous research design (e.g., random assignment) to control for selection bias [30].
A randomized controlled trial (RCT), as the most powerful research design, can best detect the intervention effect on students, and is considered the gold standard for social, psychological, and education research [31,32]. Via randomization, students in the treatment and control conditions can be equivalent for both observed and unobserved background characteristics, thereby generating a relatively unbiased estimate of the impact of the program (i.e., GT services) on students’ achievement. However, it is not always realistic to randomly assign students to different programs—for example, students who qualify for GT services would all receive that service. An alternative approach to reducing selection bias and establishing comparability between conditions is the propensity score matching (PSM) technique [30]. A propensity score was proposed by Rosenbaun and Rubin [33] as a rigorous estimation of causal effect from observational data, and the matching technique uses propensity scores to correct for selection bias in nonexperimental/RCT studies, in which researchers can generate a “control” group that shares similar characteristics with a “treatment’ group. As was suggested by Hong and Raudenbush [34], as well as Shadish et al. [35], the proper use of PSM allows for a rigorously derived and relatively unbiased estimation of the treatment’s effect, which can approximate the findings obtained from RCT design [36]. Because of its ability to greatly reduce selection bias, PSM has started to catch researchers’ attention in the fields of education [30]. Take GT program for example, via PSM procedure, researchers can select a group of “control” students who share observed characteristics as the GT students, such as gender, learning experience, prior academic achievement, etc.
The purpose of this study is to demonstrate a practical yet rigorous statistical method to evaluate the effectiveness of the ET program. We used an example of 36 students from an ET program at a tier-1 university (University H) in China. These students were selected based on their scores (top 5%) on the English exam in the NCEE, as well as their performance in the ET qualification test held by University H. We demonstrated a step-by-step guide of PSM techniques in the R statistical package to select a comparable non-ET group for comparison. Via PSM procedure, we were able to match 36 ET students with another 36 students who demonstrated similar characteristics but did not receive the same ET services. We estimated the impact of ET education services on the ET students’ English language proficiency measured by the CET-4, compared to non-ET students. Our demonstration can guide researchers and practitioners in establishing an equivalent comparison group through a rigorous matching mechanism when randomization is not available due to realistic constraints. Such an approach has broader applicability to other program types as well. The use of a large sample of Chinese university students also informs researchers, practitioners, and administrators on the magnitude of ET education effects on university students’ English language learning.

3. Method

3.1. Research Design

In line with the focal university’s policy of “teaching students according to their aptitude”, the leadership team of University H, located in the central region of China, has launched an education reform, titled “7-2-1 mode”, with the following purposes: (a) prepare 70% of students to be ready for employment upon graduation, (b) ensure 20% of students are well-rounded with multi-functional ability, and (c) scaffold 10% of students who have innovative talents with elite education. In the Foreign Language School of University H, an ET program was established to support students who were rated in the top 5% of the NCEE and demonstrated a high level of English oral presentation. Our analytical sample included 3318 university students who were admitted to University H in 2016, with 36 students being enrolled in the ET program.
Both ET and non-ET student are required to take 64 College English instructional hours per semester, which accounted for 3 credit hours. For non-ET students, College English contains one curriculum—English for General Purposes (EGP)—while ET students are required to take two extra courses—English for Specific Purposes (ESP) and Intercultural Communication (IC)—within the same number of instructional hours. University H expected that adding higher-level EFL curriculum components and differentiated instruction would better support ET students’ development in English language proficiency. Furthermore, the ET instruction team is made up of experienced teachers selected by the administrators of the Foreign Language School. These teachers planned and prepared curriculum collaboratively, organized weekly with face-to-face discussions on course objectives and content, and further established a virtual chat room to discuss challenges and educational resources among themselves.
To evaluate the effectiveness of the ET service in University H, we used PSM to identify a comparison group that is non-ET, because random assignment of individual student into ET and non-ET is not realistic in the research context. In the following sections, we demonstrated steps in PSM matching using statistical package R [37,38].

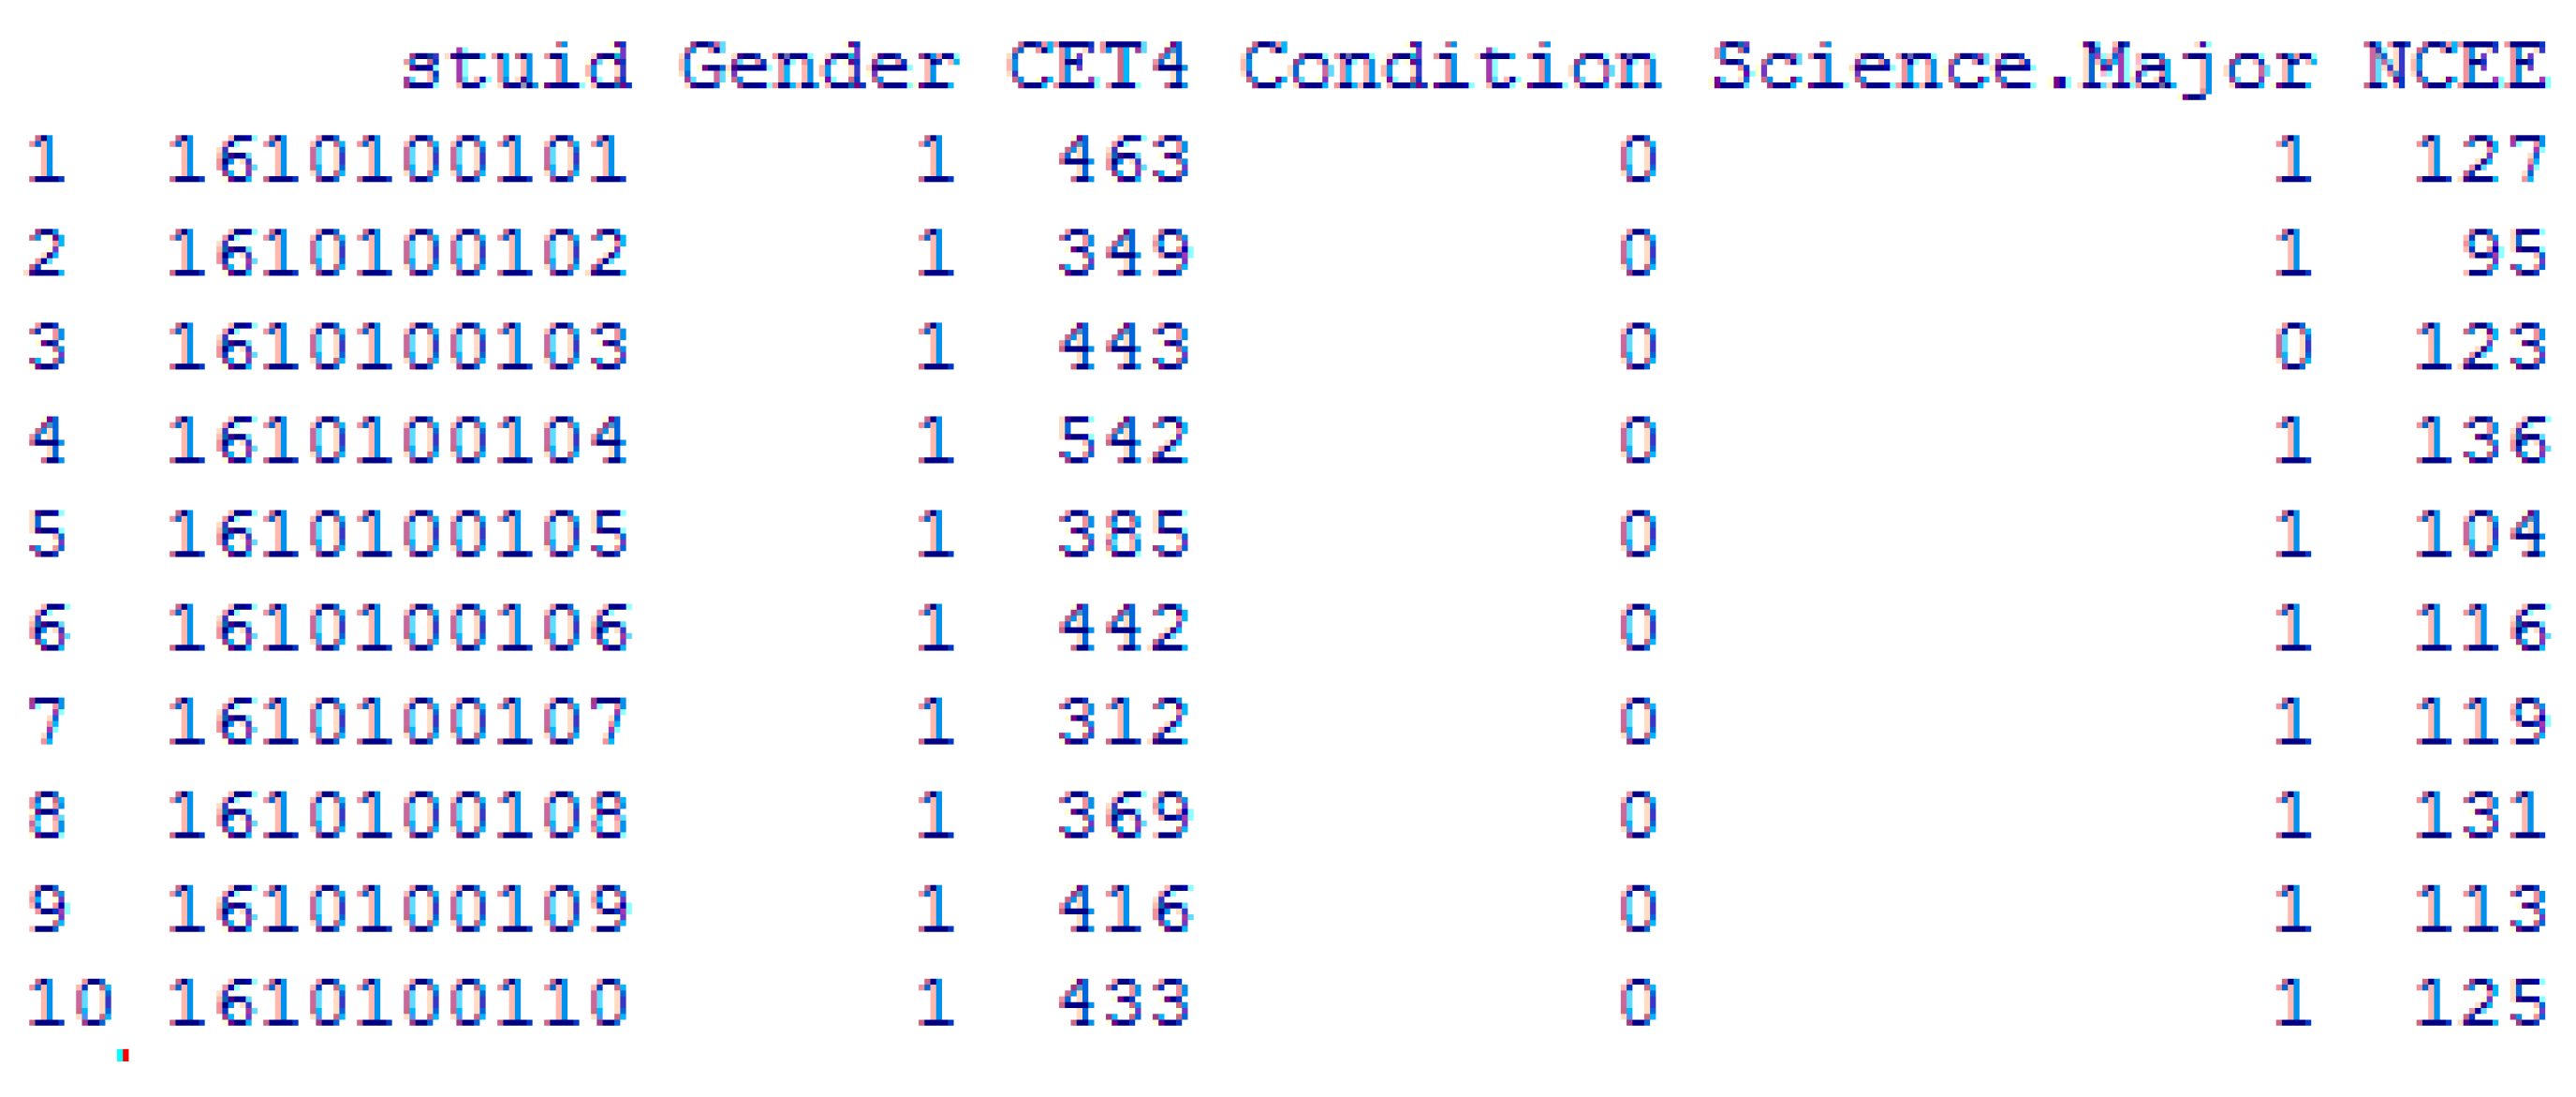
3.2. Variables Included in the Propensity Score Matching Study

Five variables were included in the matching procedure: condition, major, gender, NCEE scores, and CET-4 scores (see Table 1). Condition is a dichotomous variable that categorizes participants as “control” or “treatment”. In this study, the students in the “treatment” condition received ET services, while the students in the “control” condition received tradition College English instruction (here EGP). Majors is a dichotomous variable that categorizes participants as “science” or “art” majors. Gender is a dichotomous variable that categories participants as “male” or “female”. Major, NCEE scores, and gender are three matching variables that were included in the PSM procedure. CET-4 score is the outcome variable for the comparison analysis.

3.3. Steps of the Propensity Score Matching Procedure

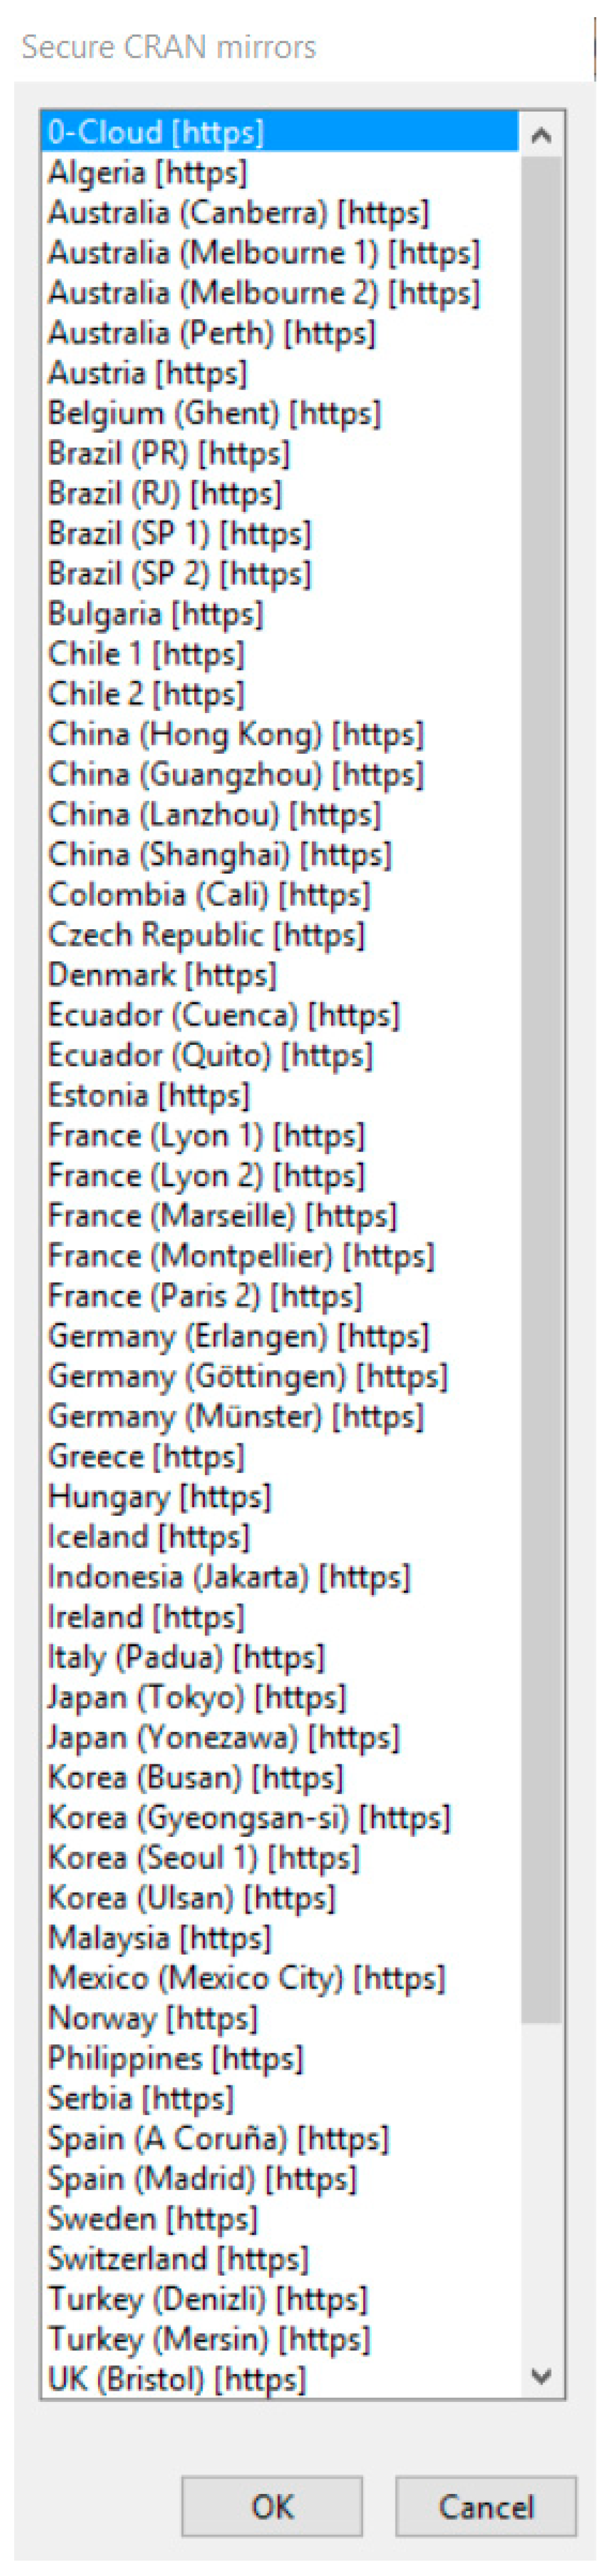
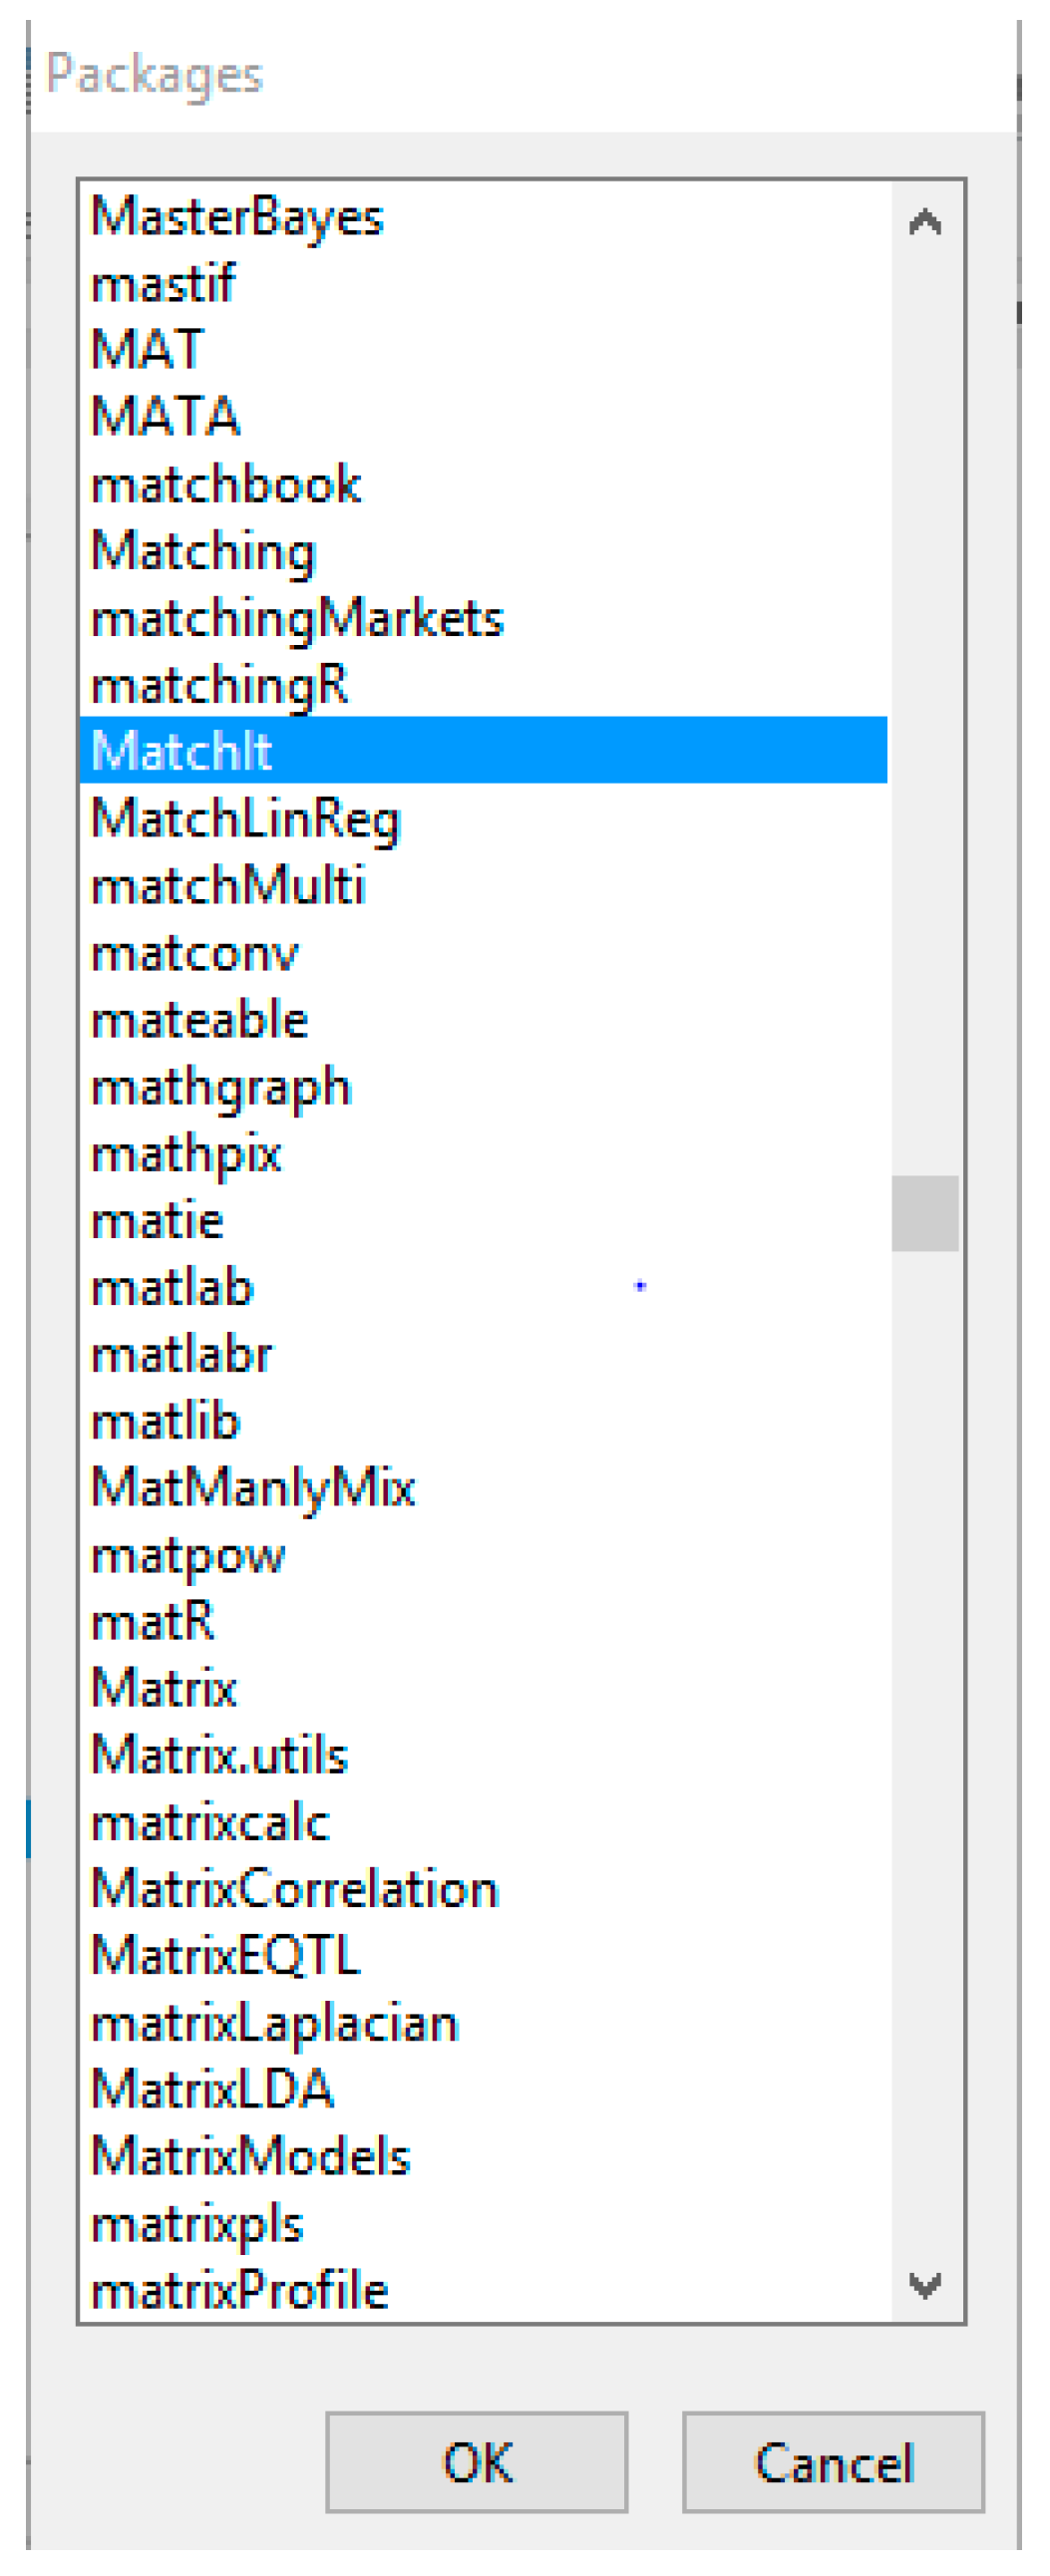
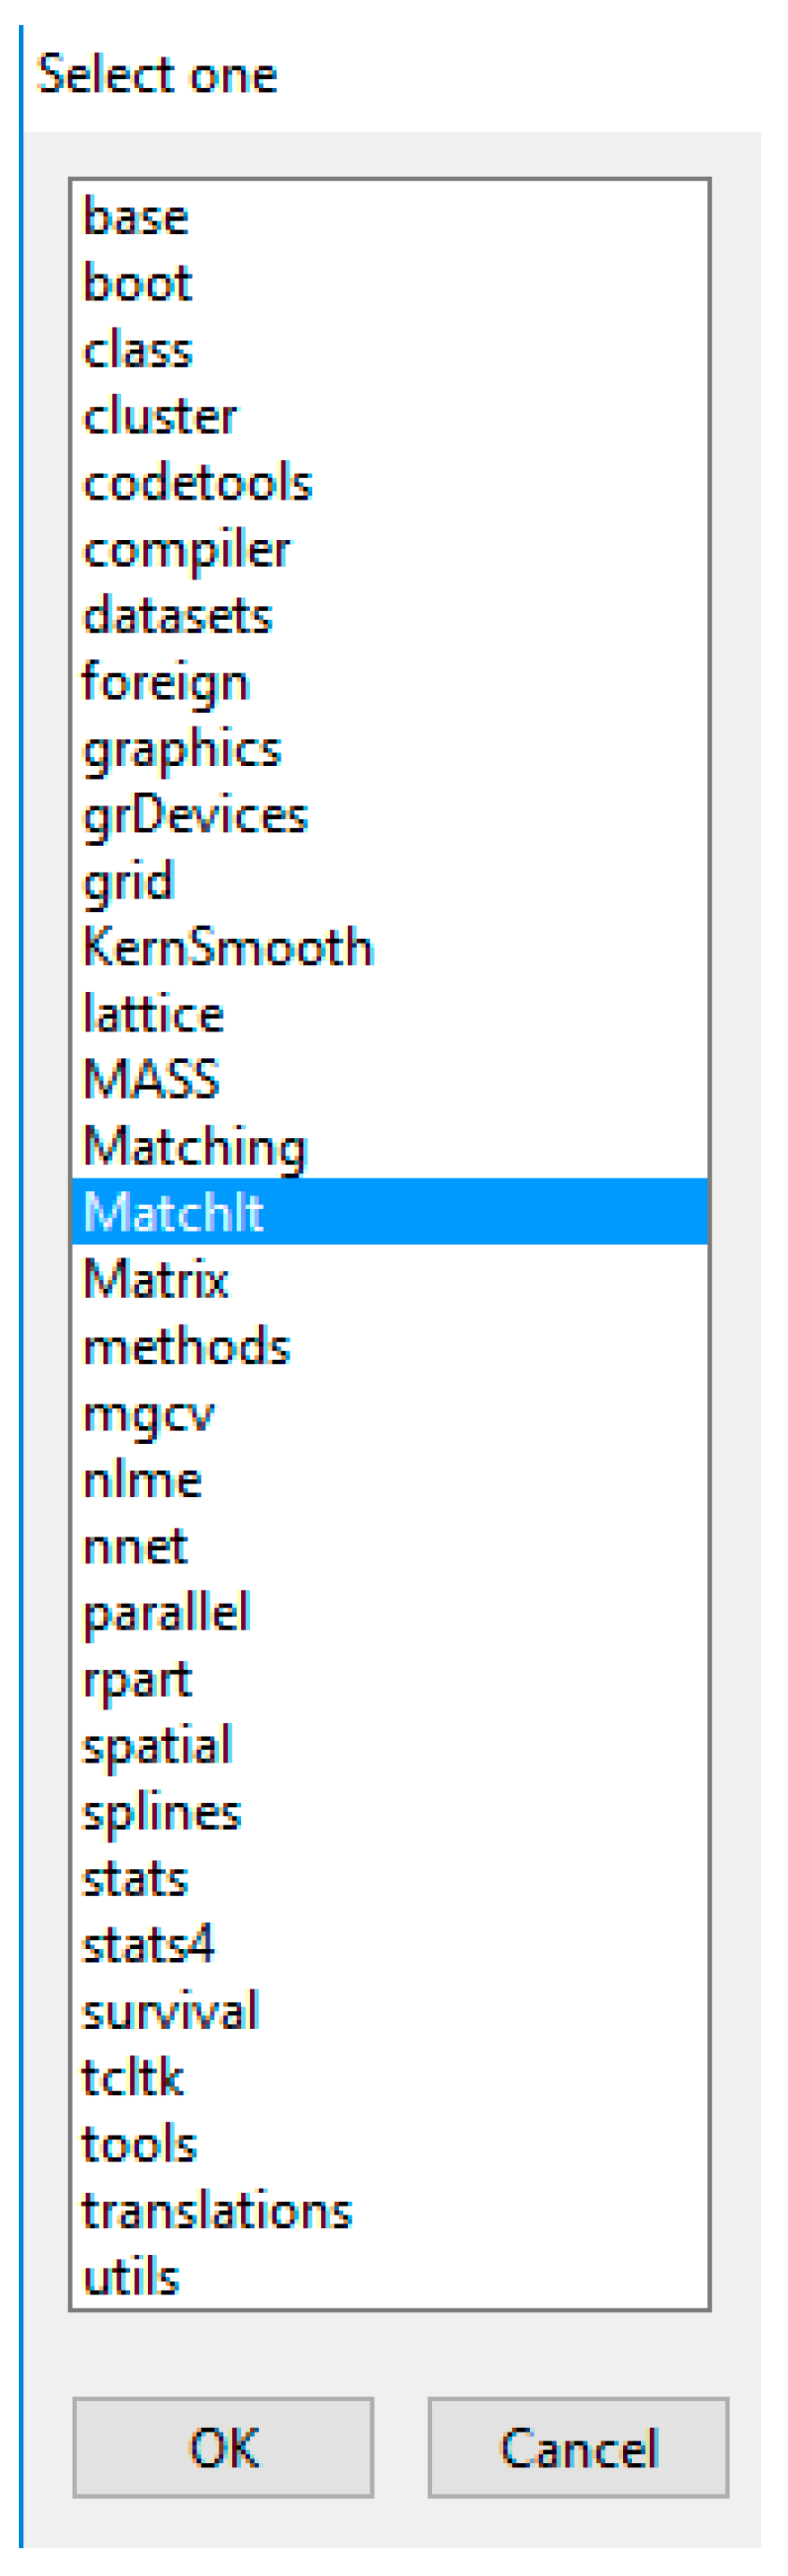
3.3.1. Step 1: Install R and MatchIt Packages

R is a free statistical software that can be downloaded from https://www.r-project.org/. The specific installation manual is provided on the website. Installation-related information can be found from the website https://cran.r-project.org/doc/FAQ/R-FAQ.html#What-machines-does-R-run-on_003f, which includes a basic introduction of R, platform/machines that R runs on, and how R can be obtained and installed. The PSM steps presented in this study are based on R 3.4.0. Once R is installed, the MatchIt package needs to be selected to conduct the PSM procedure. The package only needs to be downloaded once, but it will have to be loaded every time if R is re-opened for PSM analysis.
To install the MatchIt package, open R and select Packages > Install Package(s). A “Secure CRAN mirrors” list will pop up, as is shown in Figure 1. Select the site you prefer and click “OK”. Select Package > Install Package(s), then a new window will pop up (Figure 2). Select MatchIt and click “OK”. The package will be installed immediately. Next, click Packages > Load Package, and a new window will pop up (Figure 3). Select MatchIt and click “OK”. The package will then be loaded. MatchIt CRAN information can be referred to the website https://cran.r-project.org/web/packages/MatchIt/index.html [39].

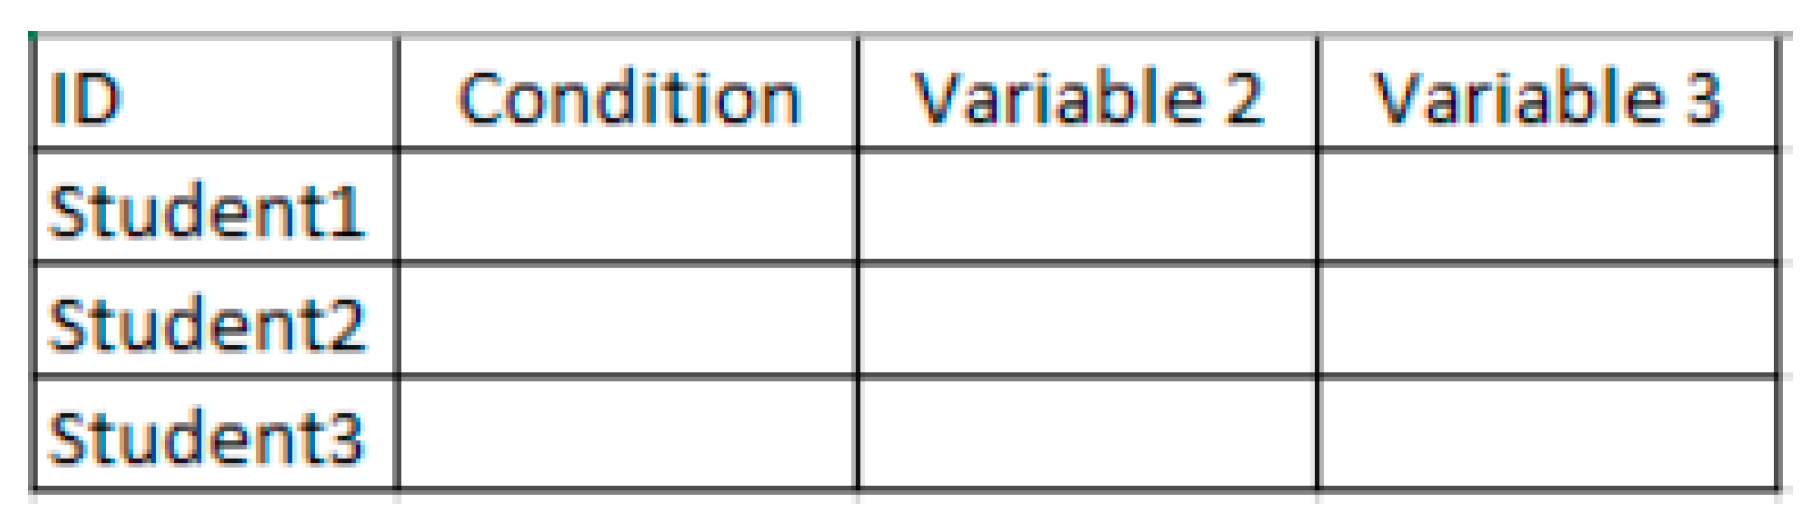
3.3.2. Step 2: Data Preparation and Importing

In order to do PSM, the data layout should be formatted so that each case is listed in a row, and the variable is listed in each column, as is shown in Figure 4. PSM matching requires at least one grouping variable (e.g., condition) and one or more matching variables. In this study, we have two conditions, treatment (coded as 1) and control (coded as 0). We also have three matching variables: gender (male coded as 1, female coded as 0), major (science coded as 1, art coded as 0), and NCEE scores (continuous). In this study, we used the basic format of a comma-separated values (CSV) file. R is also compatible with other data formats, such as Excel and SPSS. You can drag the file from the folder into the R Console to get the location of the file. When importing data into R, we need to ensure that there are no missing values. In this study, our sample included 3549 university students who were admitted to University H in 2016, with 110 students being enrolled in the ET program. Those 110 students were regrouped into three classes taught by three teachers. To avoid instructor effect on the outcome, we randomly selected one ET class for PSM procedure and comparison analysis. After removing the missing values, we ended up with an analytical sample of 3373 in the control and 36 in the treatment conditions used in the PSM analysis. The file imported into R is named “PSMR.csv” and saved in the PSM folder on the C drive. The code “dataPSM <- read.csv (“C:\\PSM\\PSMR.csv”)” in Figure 5 is the code for reading the data in PSMR.csv and renaming it dataPSM. The second line in Figure 5 (“attach(dataPSM)”) is the code for making the file available in R. The third line in Figure 5 (“dataPSM [1:10]”) is the code for showing the first 10 students’ data, which is demonstrated in Figure 6.

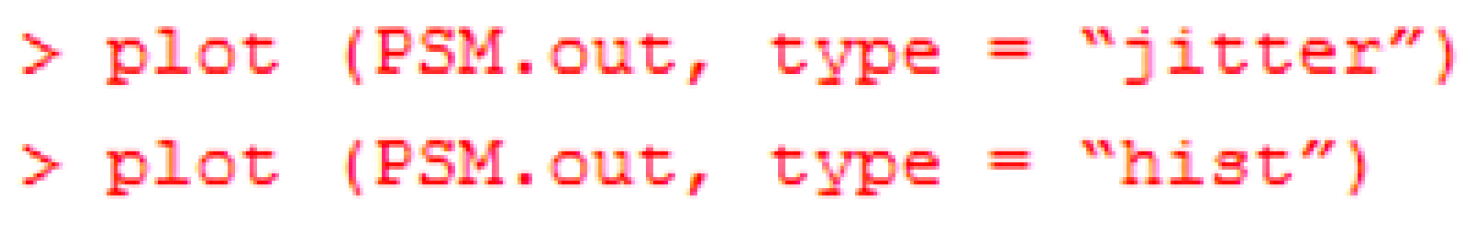
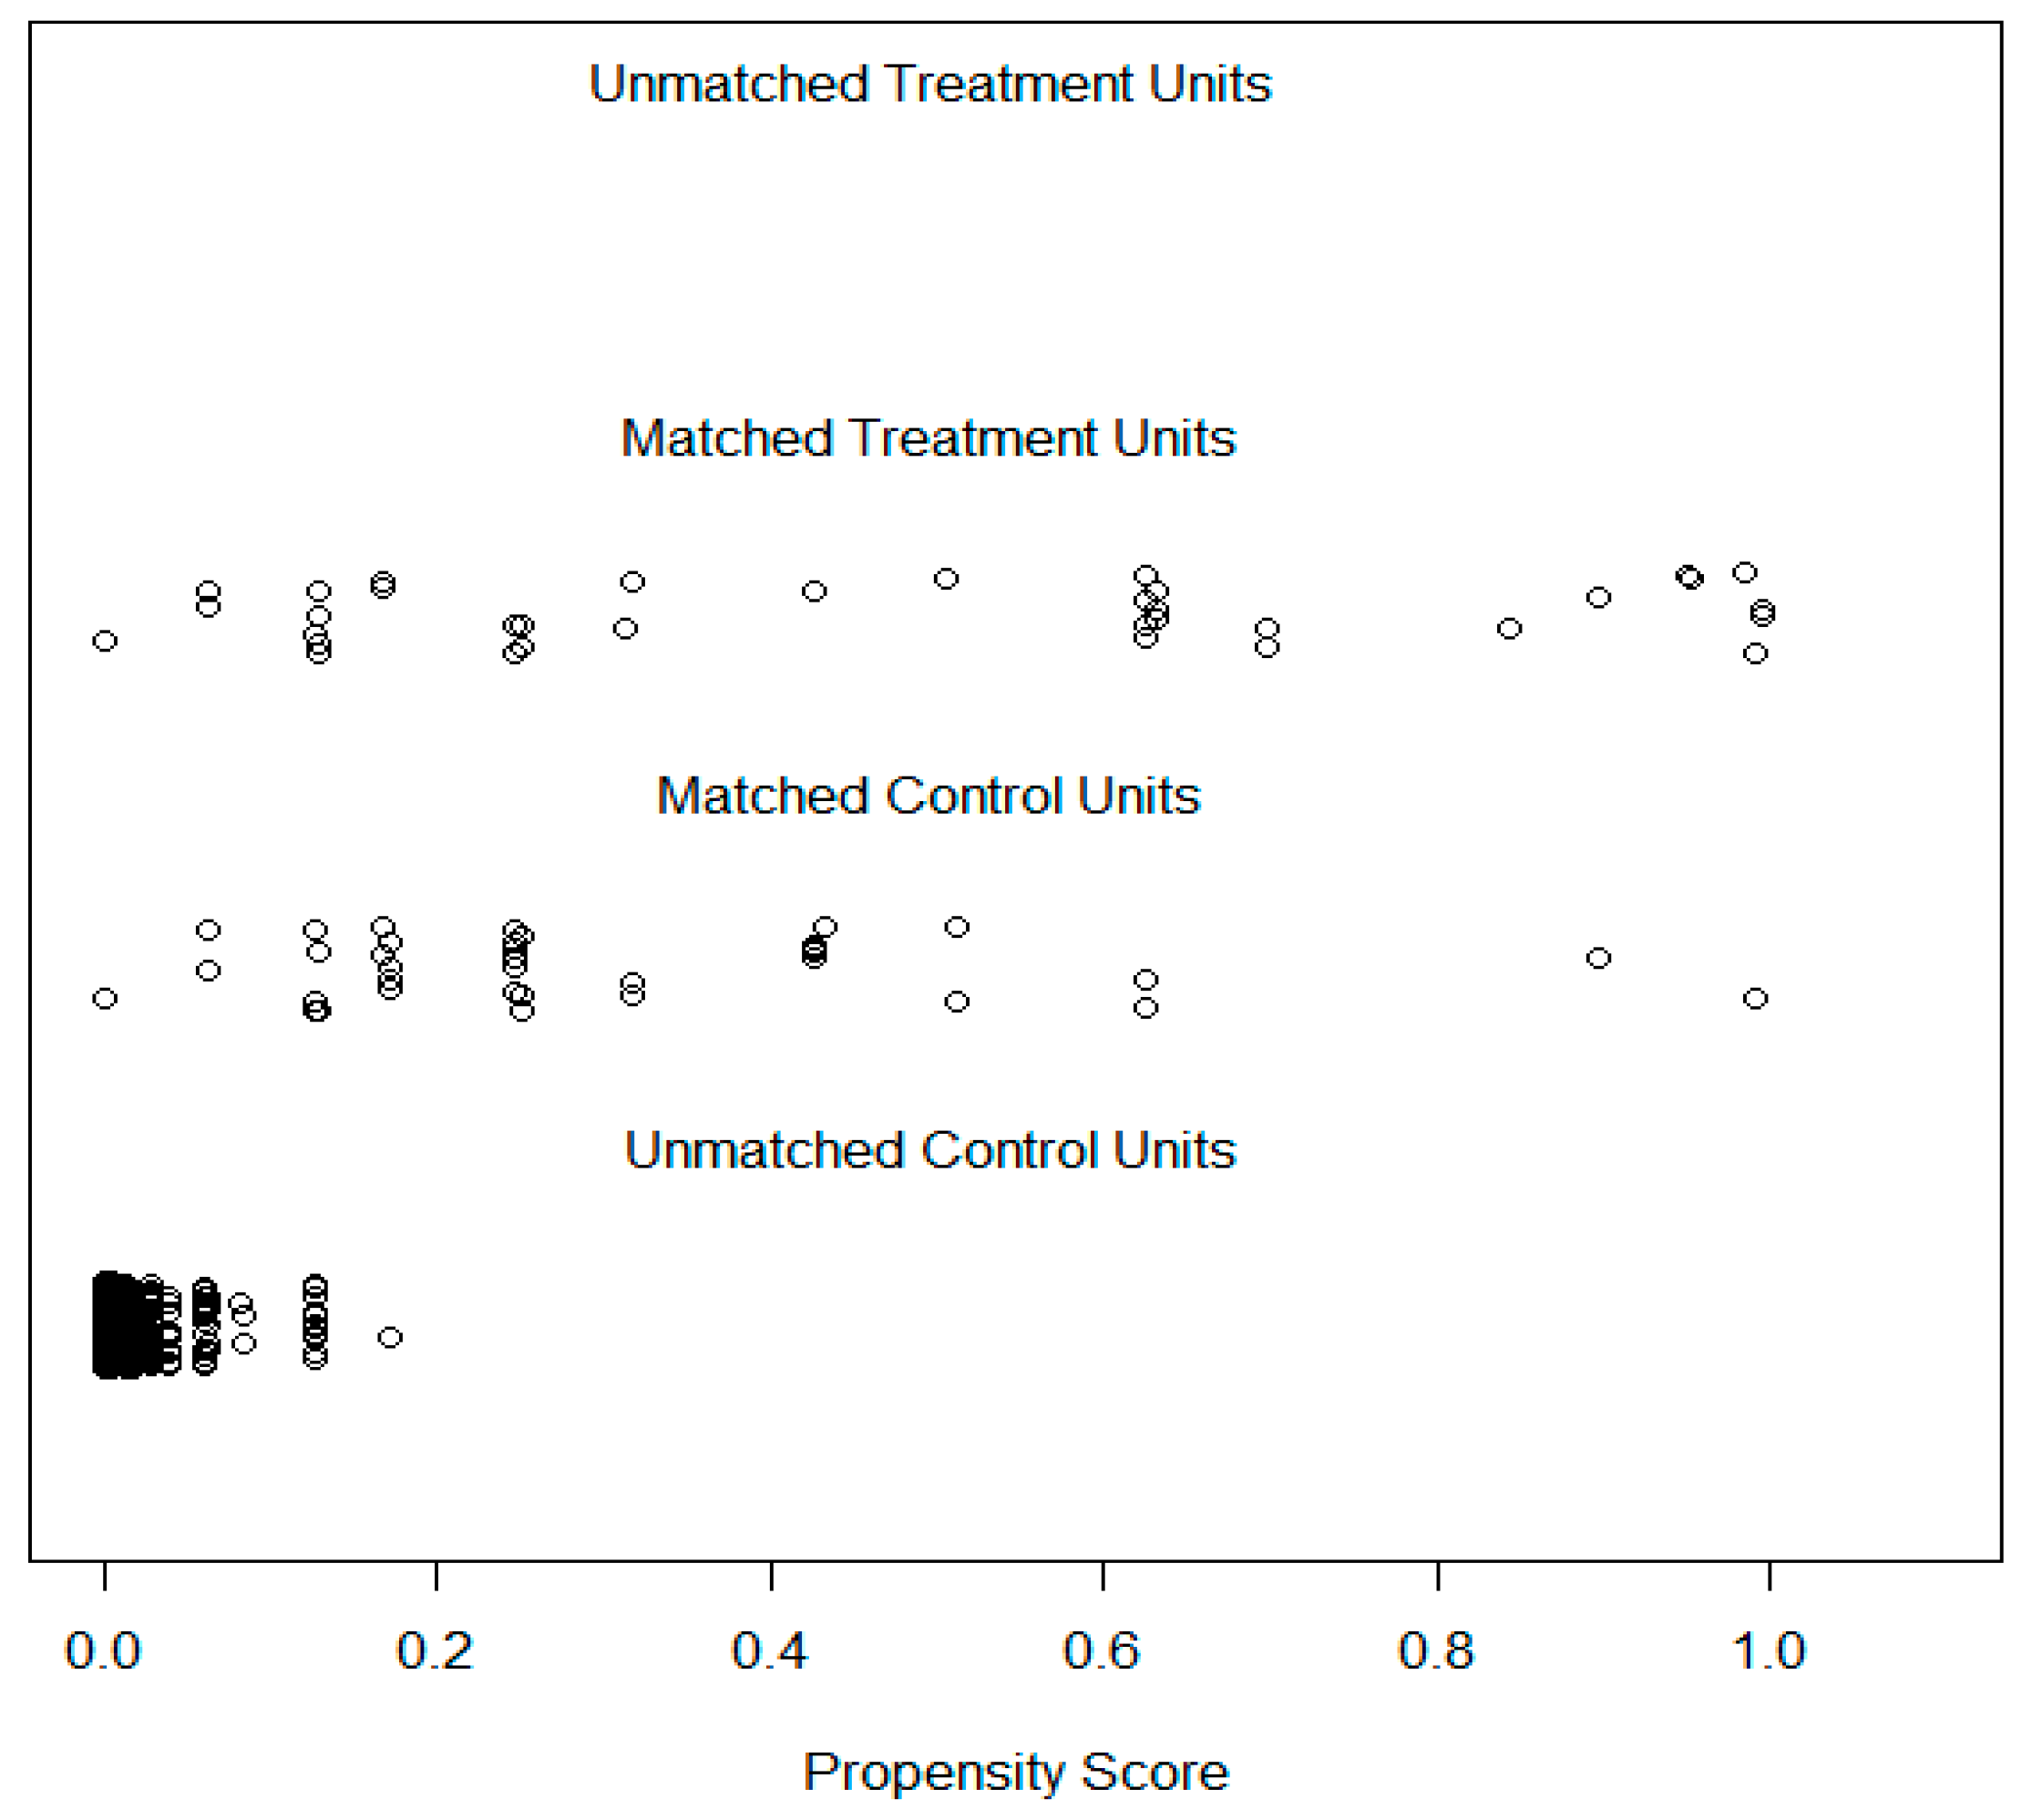
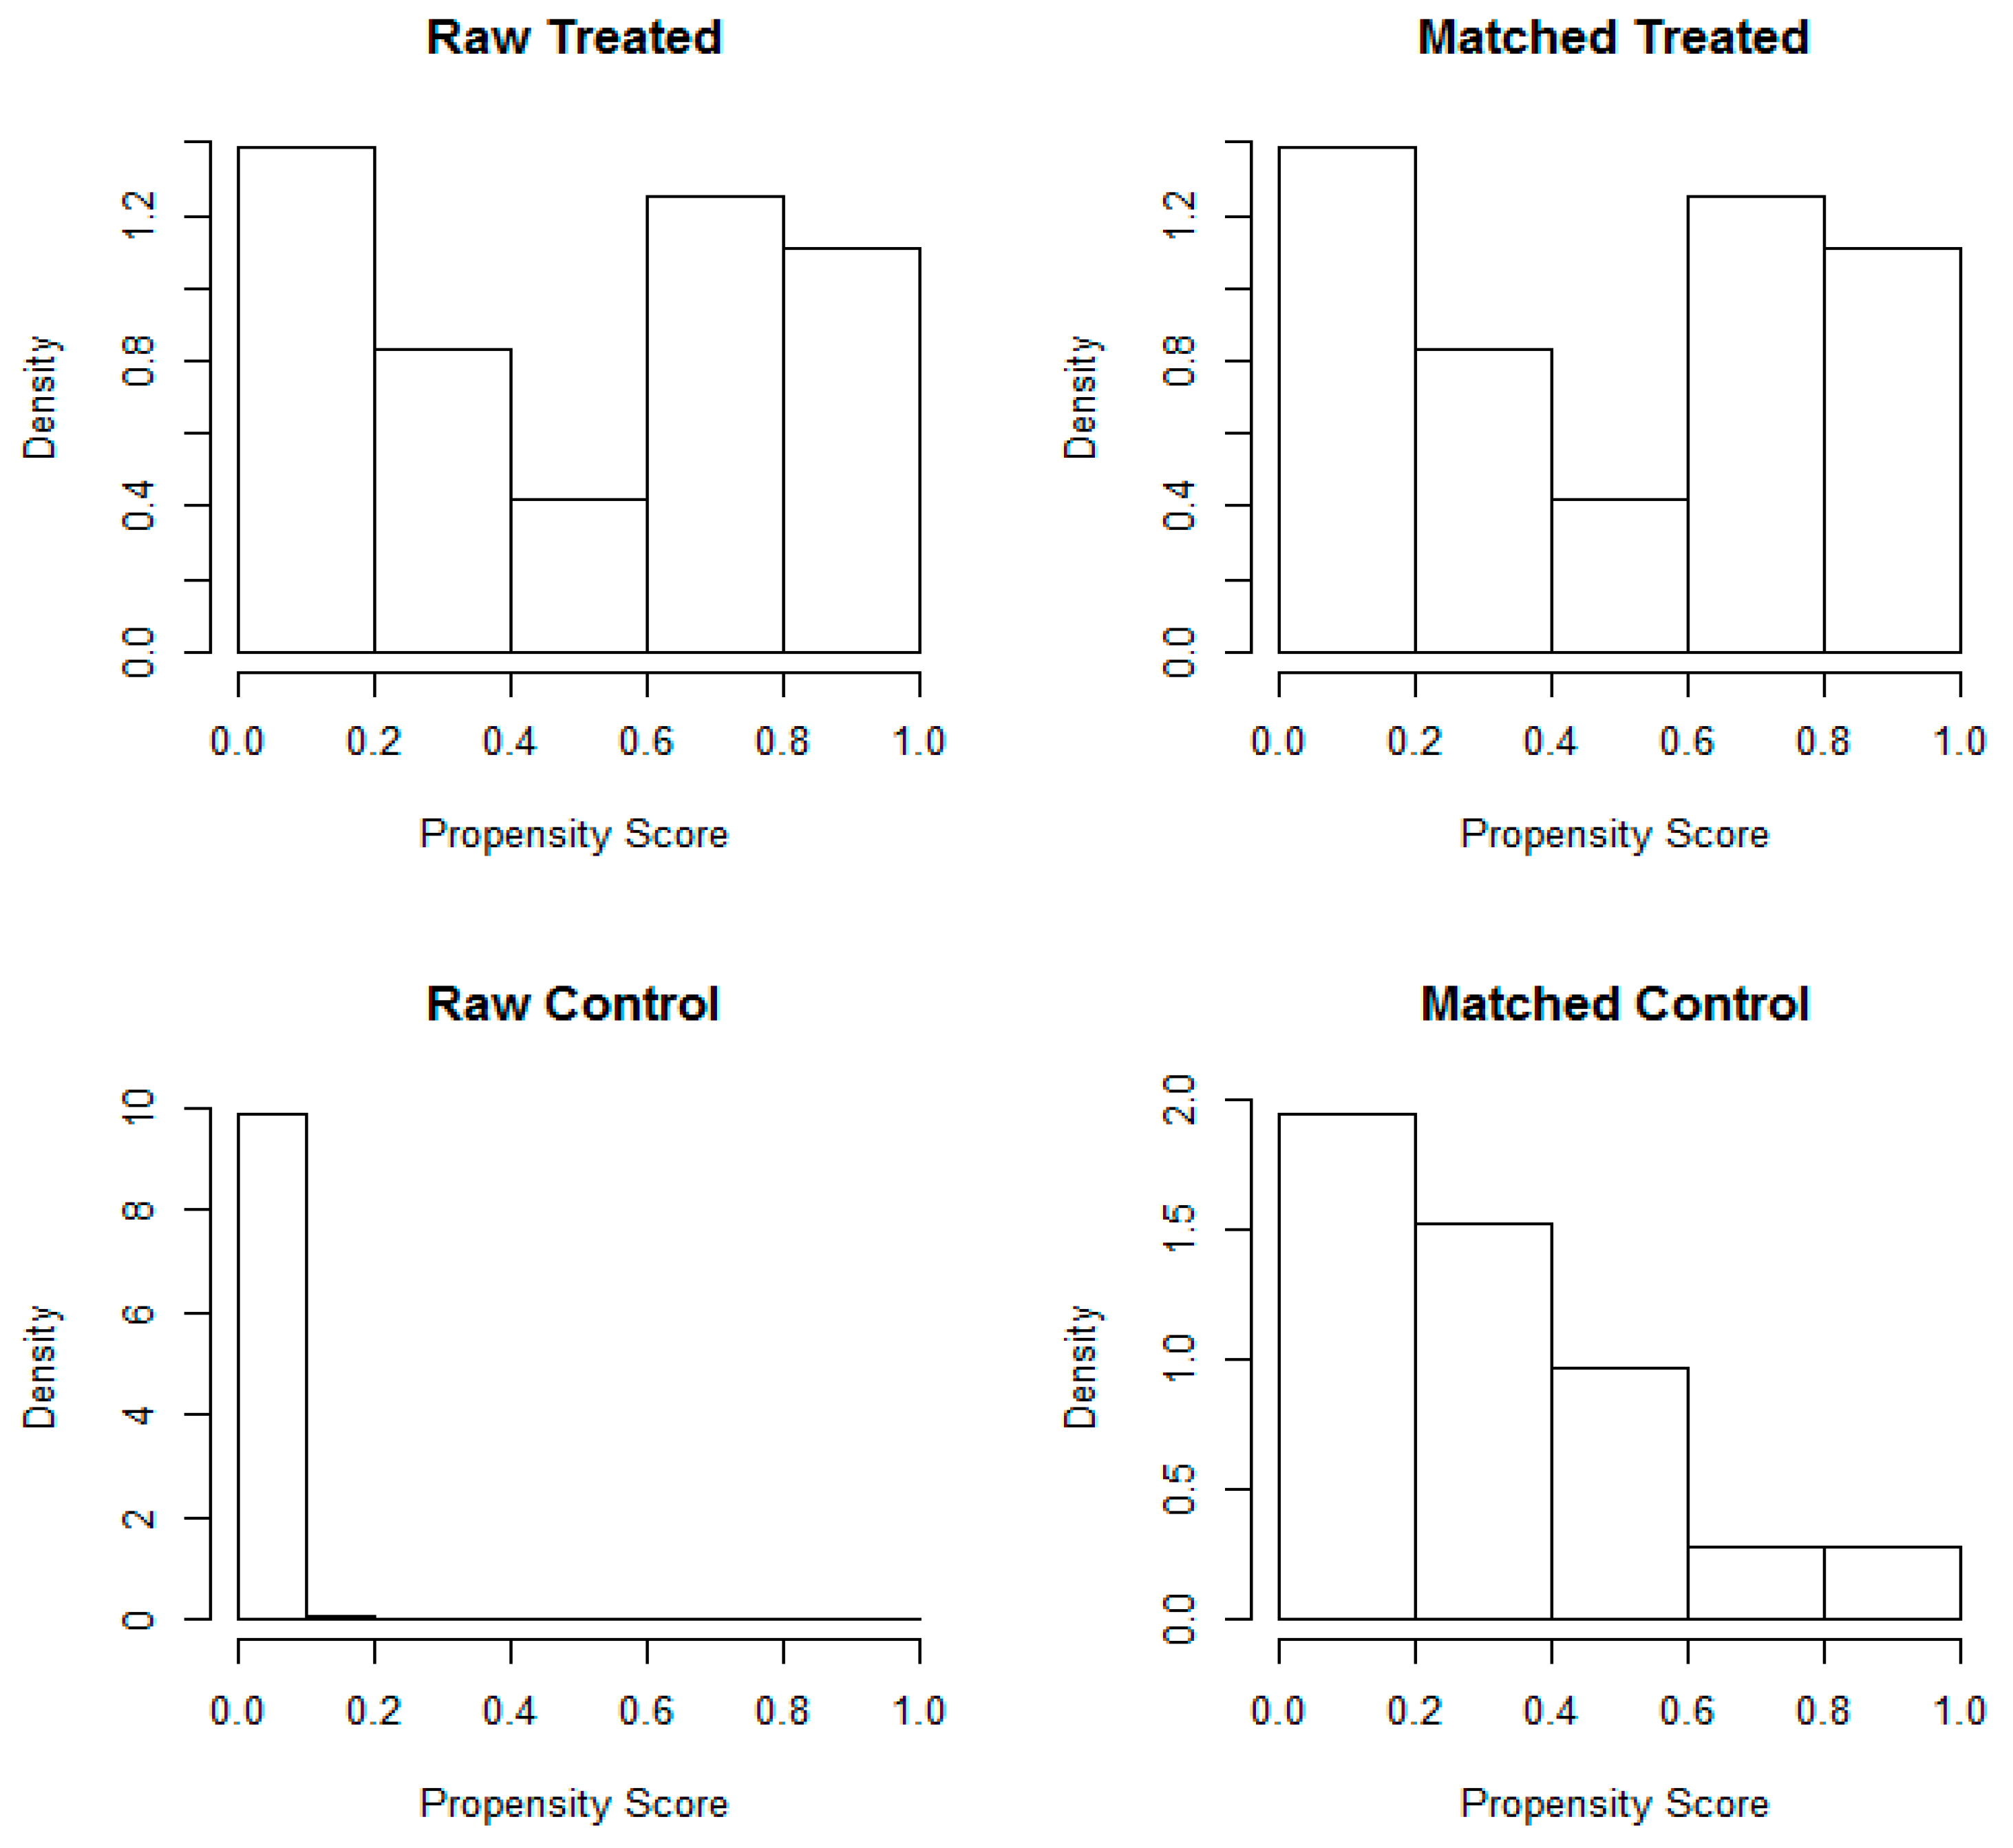
3.3.3. Step 3: Perform Propensity Score Matching and Visualize the Results

The code “PSM.out = matchit (Condition ~ Major + NCEE + Gender, data = dataPSM, method = “nearest”, ratio = 1)” in Figure 7 is used to conduct PSM. In this study, “major”, “NCEE”, and “gender” are the three matching variables, and “condition” is the grouping variable. There are many methods for matching, including nearest, exact, subclass, etc. (see details in Ho et al. [39]). In this study, we chose nearest as the matching method for demonstration purposes. The matching ratio was 1:1. If a 2:1 ratio match is preferred, the code for ratio should then be “ratio = 2”. The results of the PSM were saved as PSM.out. The second code “summary (PSM.out)” is for summarizing the PSM procedure. Such a summary is demonstrated in Figure 8.
The results in Figure 8 show that matching worked successfully for the following observations. First, before matching, the mean of NCEE scores was 138.5 in “treatment” and 117.06 in “control”, a 21.44-point difference. However, after matching, the mean NCEE score remained the same in “treatment” and increased to 137.28 in “control”. The gap between the two conditions was significantly reduced to 1.22 points. Second, before matching, the “control” group had 8.28% more male students. After matching, the gap decreased to 5.56%. There was not much difference between the “treatment” and “control” conditions before and after matching regarding the “major” distribution.
Next, to visualize the match procedure, we presented two lines of code in Figure 9. The first line “plot (PSM.out, type = “jitter”)” is for a jitter plot of the distribution of propensity scores. The plot is demonstrated in Figure 10. Each bubble represents an individual student’s propensity score. We can see that, compared with the distribution of unmatched “control” units, the distribution of matched “control” units shared more similarity with the distribution of the matched “treatment” units. The second line in Figure 9, “plot (PSM.out, type = “hist”)”, is the code for histograms before and after matching by the condition. As is demonstrated in Figure 11, the histograms of matched “treatment” and matched “control” are not exactly the same, but they share more similarities than the pair of histograms for raw “treatment” and raw “control”.

3.3.4. Step 4: Export the Matched File

Once the PSM procedure was completed, we created a data set that only matched cases. The first line in Figure 12, “Final.data1 <- match.data (PSM.out)”, is the code for creating an R dataset named “Final.data1”. In this study, we had 36 students in treatment, who were then matched with 36 control students. Therefore, we expected 72 matched cases in the dataset “Final.data1”. The second line in Figure 12, “write.csv (Final.data1, file = “C:/PSM/FinalPSM.csv”)”, is the code for exporting this file as a CSV file that can be further analyzed in R or ANother statistical software, e.g., SPSS or STATA. The CSV file was named “FinalPSM.csv” and saved in the folder “PSM” in the C drive.

3.3.5. Tips for Common Errors

In the step of data preparation, we need to make sure there is no missing value. If there is, the PSM procedure cannot move forward (see Figure 13). Researchers need to check the original dataset and decide which way to deal with the missing value—either delete the participant records or simulate value for the missing part. Another tip is for importing the data. Researchers can also type in the location of the data, but when the file’s location is complicated, the best way is to drag the file from the folder into R Console to get the exact location (see Figure 14). (“C:\\PSM\\PSMR.csv”) is the file location, and it can be copied and pasted after the code dataPSM <- read.csv for importing the data.

4. Results

In the Results section, an independent sample t-test was conducted to examine the baseline equivalence of students’ NCEE achievement between the “treatment” and “control” conditions after PSM. The results displayed in Table 1 indicate that there was no statistically significant difference between the two conditions (p = 0.069, d = 0.44). Because the effect size of the baseline exceeded the standard of 0.25 proposed by What Works Clearinghouse [40], NCEE was included in the analytical procedure of examining the treatment effect on the post-test. Moreover, a chi-square test was performed to examine the difference between the “treatment” and “control” conditions regarding the distribution of gender and major after matching. The results in Table 2 suggest that there was no statistically significant difference between conditions in the distribution of gender (p = 0.637, φ = 0.056) or major (p = 0.789, φ = 0. 032). These results from the t-test and the chi-square test indicate that the PSM procedure produced a balanced treatment–control sample for further analysis.
An analysis of covariance (ANCOVA) was run to determine the effect of the ET program on students’ CET-4 achievement after controlling for their scores on the NCEE, which served as a pre-test (Table 3 and Table 4). We found that after adjustment for the NCEE score, “treatment” students performed significantly better on the CET-4 (F [1,69] = 15.609, p < 0.001, partial η2 = 0.179, see Table 5).

5. Discussion and Perspectives

5.1. Application of Propensity Score Matching in an English Talent Program in the English as a Foreign Language Context

Although researchers and practitioners have been advocating for the importance of increasing the effectiveness of GT programs [30], empirical research intending to address such needs have been methodologically limited and have not directly been investigated in China, especially in the subject of EFL. In this study, we sought to quantify the effect of such an ET program on Chinese university students’ English proficiency. Because random assignment was not realistic, we used the PSM technique to select a group of students who shared similarities based on the observed characteristics. The rationale for using PSM techniques was that there were pre-existing differences between the two conditions, as illustrated in Figure 8. During the PSM procedure, we were able to involve all students in the matching procedure, which greatly reduced selection bias.
One of the major contributions of this study is that we used empirical data to introduce a step-by-step protocol of the PSM procedure, using the R package in GT research, where there is no study available to guide the evaluation of GT services for EFL students learning English. Although only three matching variables were involved in this study, our protocol and codes can serve as a reference for researchers and evaluators who aspire to conduct a rigorous comparison study. We recommend that more variables be involved in the matching procedure when available [41]. Furthermore, besides the PSM protocol and codes, we also provided R code for summarizing and visualizing the distribution of propensity scores. The descriptive summary of the pre- and post-PSM data, propensity score distribution, and histograms can help researchers understand the procedure both statistically and visually, which also serves as evidence of the effectiveness of PSM. It is important to note that PSM techniques can only rule out the observed characteristics, but cannot rule out bias in the estimates due to the unobserved characteristics [42].

5.2. The Impact of an English Talent Program on EFL Students’ English Learning

In the follow-up analysis that examined the differences between “treatment” and “control” students regarding their performance on the CET-4, we checked the baseline equivalence on pre-test (i.e., NCEE) achievement, gender, and major using the matched dataset. We found that there was no statistically significant difference between the two groups in these three matching variables. Furthermore, we found that ET service can greatly improve EFL students’ English language proficiency as measured by CET-4. Furthermore, since the comparison was conducted between ET students and matched students, findings can be generalized, suggesting the effectiveness of EL services that supported EFL students organized as a natural class, instead of small group tutoring for competition purposes. Since our PSM and follow-up analysis were conducted within one university and with a final analytic sample of 72 students, we encourage future studies to involve multiple research sites with more ET students in the EFL context to achieve stronger generalizability.
Moreover, our findings also offer some insights regarding the quality of instruction needed to enhance students’ English proficiency. In the ET program, we added two higher-level EFL courses, English for Specific Purposes and Intercultural Communication, within the same amount of instructional hours for ET students; this is a possible reason why ET students overperformed their matched non-ET peers. Therefore, we agree with Tong et al. [43] that students need quality instruction with academically/cognitively challenging content, learning materials, and tasks [44] to improve their English language proficiency, so as to maximize the effect of instruction.

6. Limitations and Conclusions

Our study has two limitations. First, our propensity model only includes the available factors, and may not have included additional variables that predict EFL students’ English language proficiency. Therefore, our findings may still be affected by some undetected bias. Students in our “control” group were not formally identified as ET or non-ET, although their observed background characteristics were very similar, according to the PSM and chi-square results. We did match students on the observed factors. However, we were not able to account for the multilevel effect on the matched control group (e.g., students in the “control” condition nested within different teachers’ class). Therefore, the PSM procedure can only be proximately similar to an RCT procedure in the initial grouping process.
One purpose of our study was to provide an overall estimate of the ET program in the EFL context. Our intent-to-treat analysis only provides the estimate of this ET program on this group of ET students. There is a limited generalization for the application of our ET program in a traditional EFL setting. Further investigation into the effect of the ET curriculum, a combination of English for General Purposes, English for Specific Purposes, and Intercultural Communication, on the students with different levels of English language proficiency is desirable. Our point estimates of ET program’s effect are limited to a one-year college education. Intervention across a longer time period might have a stronger effect on ET students. Our study also did not measure additional aspects related to language learning, such as motivation, attitude, and learning strategies, in which ET students might differ from their non-ET peers.
To sum up, a range of pedagogical practices has been empirically proven to positively affect EFL students’ language learning. To date, however, there is limited empirical study investigating and evaluating what practices and curriculum support ET students’ English language learning in the EFL context, which indicates that the need for such an effort has been methodologically limited and has not yet responded to the needs of ET students who demonstrate talent in English learning. Our findings add a possible method to evaluate the effectiveness of ET service being delivered in the EFL context.

Author Contributions

Conceptualization, S.T.; methodology, S.T.; validation, S.T.; formal analysis, S.T.; investigation, S.T.; resources, X.L.; data curation, X.L.; writing—original draft preparation, S.T.; writing—review and editing, F.T.; visualization, S.T.

Funding

This research received no external funding.

Conflicts of Interest

The authors declare no conflict of interest.

Abbreviations

AcronymsName
EFLEnglish as a foreign language
PSMpropensity score matching
GTgifted and talented
ETEnglish talent
WTOWorld Trade Organization
CECollege English
CET-4College English Test Band Four
RCTrandomized controlled trial
EGPEnglish for General Purposes
ESPEnglish for Specific Purposes
ICIntercultural Communication
NCEENational College Entrance Examination

References

  1. Bolton, K.; Graddol, D. English in China today: The current popularity of English in China is unprecedented, and has been fuelled by the recent political and social development of Chinese society. Engl. Today 2012, 28, 3–9. [Google Scholar] [CrossRef]
  2. Wang, P. An Evaluative Study of the Effectiveness of Content-Based Instruction as an EFL Approach in China’s Tertiary Education. Ph.D. Thesis, University of Nottingham, Nottingham, UK, 2018. [Google Scholar]
  3. Liu, Y. Cultivation of Foreign Language Talents Viewed from the Perspective of Educational Ecology. Theory Pract. Lang. Stud. 2015, 5, 2150–2156. [Google Scholar] [CrossRef]
  4. Chan, D.W. Identifying gifted and talented students in Hong Kong. Roeper Rev. 2000, 22, 88–93. [Google Scholar] [CrossRef]
  5. Chan, D.W. Healthy and Unhealthy Perfectionists Among Academically Gifted Chinese Students in Hong Kong: Do Different Classification Schemes Make a Difference? Roeper Rev. 2010, 32, 88–97. [Google Scholar] [CrossRef]
  6. Phillipson, S.N. Learning Diversity in the Chinese Classroom: Contexts and Practice for Students with Special Needs; Hong Kong University Press: Hongkong, China, 2007; Volume 1. [Google Scholar]
  7. Baker, J.A. Depression and Suicidal Ideation among Academically Gifted Adolescents. Gift. Child Q. 1995, 39, 218–223. [Google Scholar] [CrossRef]
  8. Cao, T.H.; Jung, J.Y.; Lee, J. Assessment in Gifted Education: A Review of the Literature from 2005 to 2016. J. Adv. Acad. 2017, 28, 163–203. [Google Scholar] [CrossRef]
  9. Chen, X.; Fan, X.; Cheung, H.Y.; Wu, J. The subjective well-being of academically gifted students in the Chinese cultural context. Sch. Psychol. Int. 2018, 39, 291–311. [Google Scholar] [CrossRef]
  10. Wu, Y. The Examination System in China: The case of Zhongkao Mathematics. In Selected Regular Lectures from the 12th International Congress on Mathematical Education; Springer: Berlin/Heidelberg, Germany, 2015; pp. 897–914. [Google Scholar]
  11. Rudowicz, E.; Yue, X.D. Concepts of Creativity: Similarities and Differences among Mainland, Hong Kong and Taiwanese Chinese. J. Creat. Behav. 2000, 34, 175–192. [Google Scholar] [CrossRef]
  12. Bodycott, P.; Lai, A. The Influence and Implications of Chinese Culture in the Decision to Undertake Cross-Border Higher Education. J. Stud. Int. Educ. 2012, 16, 252–270. [Google Scholar] [CrossRef]
  13. Zhang, Z. Gifted education in China. Cogent Educ. 2017, 4, 1–12. [Google Scholar] [CrossRef]
  14. Yue, X.D.; Bender, M.; Cheung, C.-K. Who are the Best-Known National and Foreign Creators—A Comparative Study among Undergraduates in China and Germany. J. Creat. Behav. 2011, 45, 23–37. [Google Scholar] [CrossRef]
  15. Tao, W. Less Classroom Hours of EFL Instruction to Non-English Majors in Chinese Universities Is It a Reason-Based Policy that Provokes No Response? Engl. Lang. Teach. 2019, 12, 170–176. [Google Scholar] [CrossRef]
  16. Ministry of Education of the People’s Republic of China. Chinese Ministry of Education College English Syllabus (for Undergraduate in Liberal Arts); Higher Education Press: Beijing, China, 1986.
  17. Ministry of Education of the People’s Republic of China. Chinese Ministry of Education College English Syllabus (for Undergraduate in Science and Engineering Majors); Shanghai Foreign Language Education Press: Shanghai, China, 1985.
  18. Wu, Z. Washback Effects of the Reformed CET-4 on College English Teaching and Learning in China: Students’ Perspectives. Ph.D. Thesis, Indiana University of Pennsylvania, Indiana, PA, USA, 2014. [Google Scholar]
  19. Rao, Z.; Lei, C. Teaching English as a foreign language in Chinese universities: The present and future: An appropriate way to teach English in China is to balance teaching activities for elaborating linguistic details and developing students’ communicative competence. Engl. Today 2014, 30, 40–45. [Google Scholar] [CrossRef]
  20. Li, C.; Zhou, T. An Exploratory Study on the Relationship between Demotivation and Academic Fields among Chinese EFL Learners. Arab. World Engl. J. 2017, 8, 42–54. [Google Scholar] [CrossRef] [Green Version]
  21. Lei, F.; Weiwei, F.; Di, H. Chinese EFL Learners’ Public Speaking Skills: An Investigation of Impromptu Speeches at the “FLTRP Cup” English Speaking Contest in the Light of Communication Models. Chin. J. Appl. Linguist. 2016, 39, 421–439. [Google Scholar] [CrossRef]
  22. Lucas, S.E. English Public Speaking and the Cultivation of Talents for Chinese College Students. Chin. J. Appl. Linguist. 2013, 36, 163–182. [Google Scholar] [CrossRef]
  23. Zhang, X.; Ardasheva, Y. Sources of college EFL learners’ self-efficacy in the English public speaking domain. Engl. Specif. Purp. 2019, 53, 47–59. [Google Scholar] [CrossRef]
  24. Yuen, M.; Chan, S.; Chan, C.; Fung, D.C.; Cheung, W.M.; Kwan, T.; Leung, F.K. Differentiation in key learning areas for gifted students in regular classes: A project for primary school teachers in Hong Kong. Gift. Educ. Int. 2018, 34, 36–46. [Google Scholar] [CrossRef]
  25. Wallace, B.; Bernardelli, A.; Molyneux, C.; Farrell, C. TASC: Thinking actively in a social context. A universal problem-solving process: A powerful tool to promote differentiated learning experiences. Gift. Educ. Int. 2012, 28, 58–83. [Google Scholar] [CrossRef]
  26. Chan, C.; Chang, M.; Westwood, P.; Yuen, M. Teaching adaptively: How easy is differentiation in practice? Asia Pac. Educ. Res. 2002, 11, 27–58. [Google Scholar]
  27. Tomlinson, C. The Differentiated Classroom: Responding to the Needs of All Learners; ASCD: Alexandria, VA, USA, 1999. [Google Scholar]
  28. Tomlinson, C.A.; Allan, S.D. Leadership for Differentiating Schools and Classrooms; ASCD: Alexandria, VA, USA, 2000. [Google Scholar]
  29. Wan, S.W. Differentiated instruction: Hong Kong prospective teachers’ teaching efficacy and beliefs. Teach. Teach. 2016, 22, 148–176. [Google Scholar] [CrossRef]
  30. Morgan, P.L.; Frisco, M.L.; Farkas, G.; Hibel, J. A propensity score matching analysis of the effects of special education services. J. Spec. Educ. 2010, 43, 236–254. [Google Scholar] [CrossRef] [PubMed]
  31. Lilienfeld, O.S.; McKay, D.; Hollon, S.D. Why randomised controlled trials of psychological treatments are still essential. Lancet Psychiatry 2018, 5, 536–538. [Google Scholar] [CrossRef]
  32. Deaton, A.; Cartwright, N. Understanding and misunderstanding randomized controlled trials. Soc. Sci. Med. 2018, 210, 2–21. [Google Scholar] [CrossRef] [PubMed]
  33. Rosenbaum, P.R.; Rubin, D.B. The central role of the propensity score in observational studies for causal effects. Biometrika 1983, 70, 41–55. [Google Scholar] [CrossRef]
  34. Hong, G.; Raudenbush, S.W. Effects of Kindergarten Retention Policy on Children’s Cognitive Growth in Reading and Mathematics. Educ. Eval. Policy Anal. 2005, 27, 205–224. [Google Scholar] [CrossRef]
  35. Shadish, W.R.; Cook, T.D.; Campbell, D.T. Experimental and Quasi-Experimental Designs for Generalized Causal Inference; Wadsworth Publishing: Belmont, CA, USA, 2002. [Google Scholar]
  36. Becker, S.O.; Ichino, A. Estimation of Average Treatment Effects Based on Propensity Scores. Stata J. Promot Commun. Stat. Stata 2002, 2, 358–377. [Google Scholar] [CrossRef] [Green Version]
  37. R Core Team. R: A Language and Environment for Statistical Computing. Available online: https://www.R-project.org/ (accessed on 2 August 2019).
  38. Randolph, J.J.; Falbe, K. A step-by-step guide to propensity score matching in R. Practical Assessment. Res. Eval. 2014, 19, 1–6. [Google Scholar]
  39. Ho, D.; Imai, K.; King, G.; Stuart, E.A. MatchIt: Nonparametric Preprocessing for Parametric Causal Inference. J. Stat. Softw. 2011, 42, 1–28. [Google Scholar] [CrossRef] [Green Version]
  40. What Works Clearinghouse. WWC Standard Brief for Baseline Equivalence. 2015. Available online: https://ies.ed.gov/ncee/wwc/Docs/referenceresources/wwc_brief_baseline_080715.pdf (accessed on 2 August 2019).
  41. Brookhart, M.A.; Schneeweiss, S.; Rothman, K.J.; Glynn, R.J.; Avorn, J.; Stürmer, T. Variable selection for propensity score models. Am. J. Epidemiol. 2006, 163, 1149–1156. [Google Scholar] [CrossRef]
  42. Burden, A.; Roche, N.; Miglio, C.; Hillyer, E.V.; Postma, D.S.; Mc Herings, R.; Overbeek, A.J.; Khalid, J.M.; Van Eickels, D.; Price, D.B. An evaluation of exact matching and propensity score methods as applied in a comparative effectiveness study of inhaled corticosteroids in asthma. Pragmatic Obs. Res. 2017, 8, 15–30. [Google Scholar] [CrossRef] [PubMed]
  43. Tong, F.; Irby, B.J.; Lara-Alecio, R.; Guerrero, C.; Tang, S.; Sutton-Jones, K.L. The impact of professional learning on in-service teachers’ pedagogical delivery of literacy-infused science with middle school English learners: A randomised controlled trial study in the U.S. Educ. Stud. 2018, 45, 533–553. [Google Scholar] [CrossRef]
  44. Yuan, Y.; Tangen, D.; Mills, K.A.; Lidstone, J. Learning English pragmatics in China: An investigation into Chinese EFL learners’ perceptions of pragmatics. Electron. J. Engl. Second Lang. 2015, 19, 1–16. [Google Scholar]
Figure 1. Secure CRAN mirrors of the MatchIt package.
Data 04 00119 g001
Figure 2. Installing the MatchIt Package in R.
Data 04 00119 g002
Figure 3. Loading the MatchIt Package in R.
Data 04 00119 g003
Figure 4. Layout of data for the propensity score matching (PSM) procedure.
Data 04 00119 g004
Figure 5. Example of codes for loading a data set.
Data 04 00119 g005
Figure 6. Demonstration of the first 10 cases of imported data.
Data 04 00119 g006
Figure 7. Example codes for performing PSM and summarizing the results.
Data 04 00119 g007
Figure 8. Results of the PSM procedure.
Data 04 00119 g008
Figure 9. Codes for the visualization of the effectiveness of the PSM procedure.
Data 04 00119 g009
Figure 10. Distribution of propensity scores.
Data 04 00119 g010
Figure 11. Histograms of propensity scores before and after matching by condition.
Data 04 00119 g011
Figure 12. Code to output a matched dataset.
Data 04 00119 g012
Figure 13. R’s feedback for missing values.
Data 04 00119 g013
Figure 14. How to get a data location.
Data 04 00119 g014
Table 1. Description of variables for PSM.
Variable NameTypeRole
CET-4 scoresScaleDependent variable
NCEE scoresScaleMatching variable
GenderdichotomousMatching variable
MajordichotomousMatching variable
ConditiondichotomousCondition variable
Table 2. The t-test results from comparing English talent (ET) and non-ET students’ National College Entrance Examination (NCEE) Scores.
NMeanStd. DeviationStd. Error Meantpd
NCEEET36138.53.1120.5191.850.0690.44
Non-ET36137.282.4570.409
Table 3. Chi-square results from comparing ET and non-ET students’ gender and major.
GenderMajor
FemaleMalePhipArtSciencePhip
ConditionNon-ET18180.0560.63710260.0320.789
ET1620 927
Table 4. Descriptive statistics of adjusted outcome (on the CET-4) by condition.
ConditionNCET-4Std. Deviation
Non-ET36520.0639.414
ET36557.6436.166
Table 5. Analysis of covariance (ANCOVA) using NCEE as a covariate.
PredictorsDependent VariabledfFpPartial Eta Squared
ConditionCET-4115.069<0.0010.179
NCEECET-411.2540.2670.018

