Building Stock and Building Typology of Kigali, Rwanda

 ,
,  ,
, 
Abstract

1. Summary
2. Methods
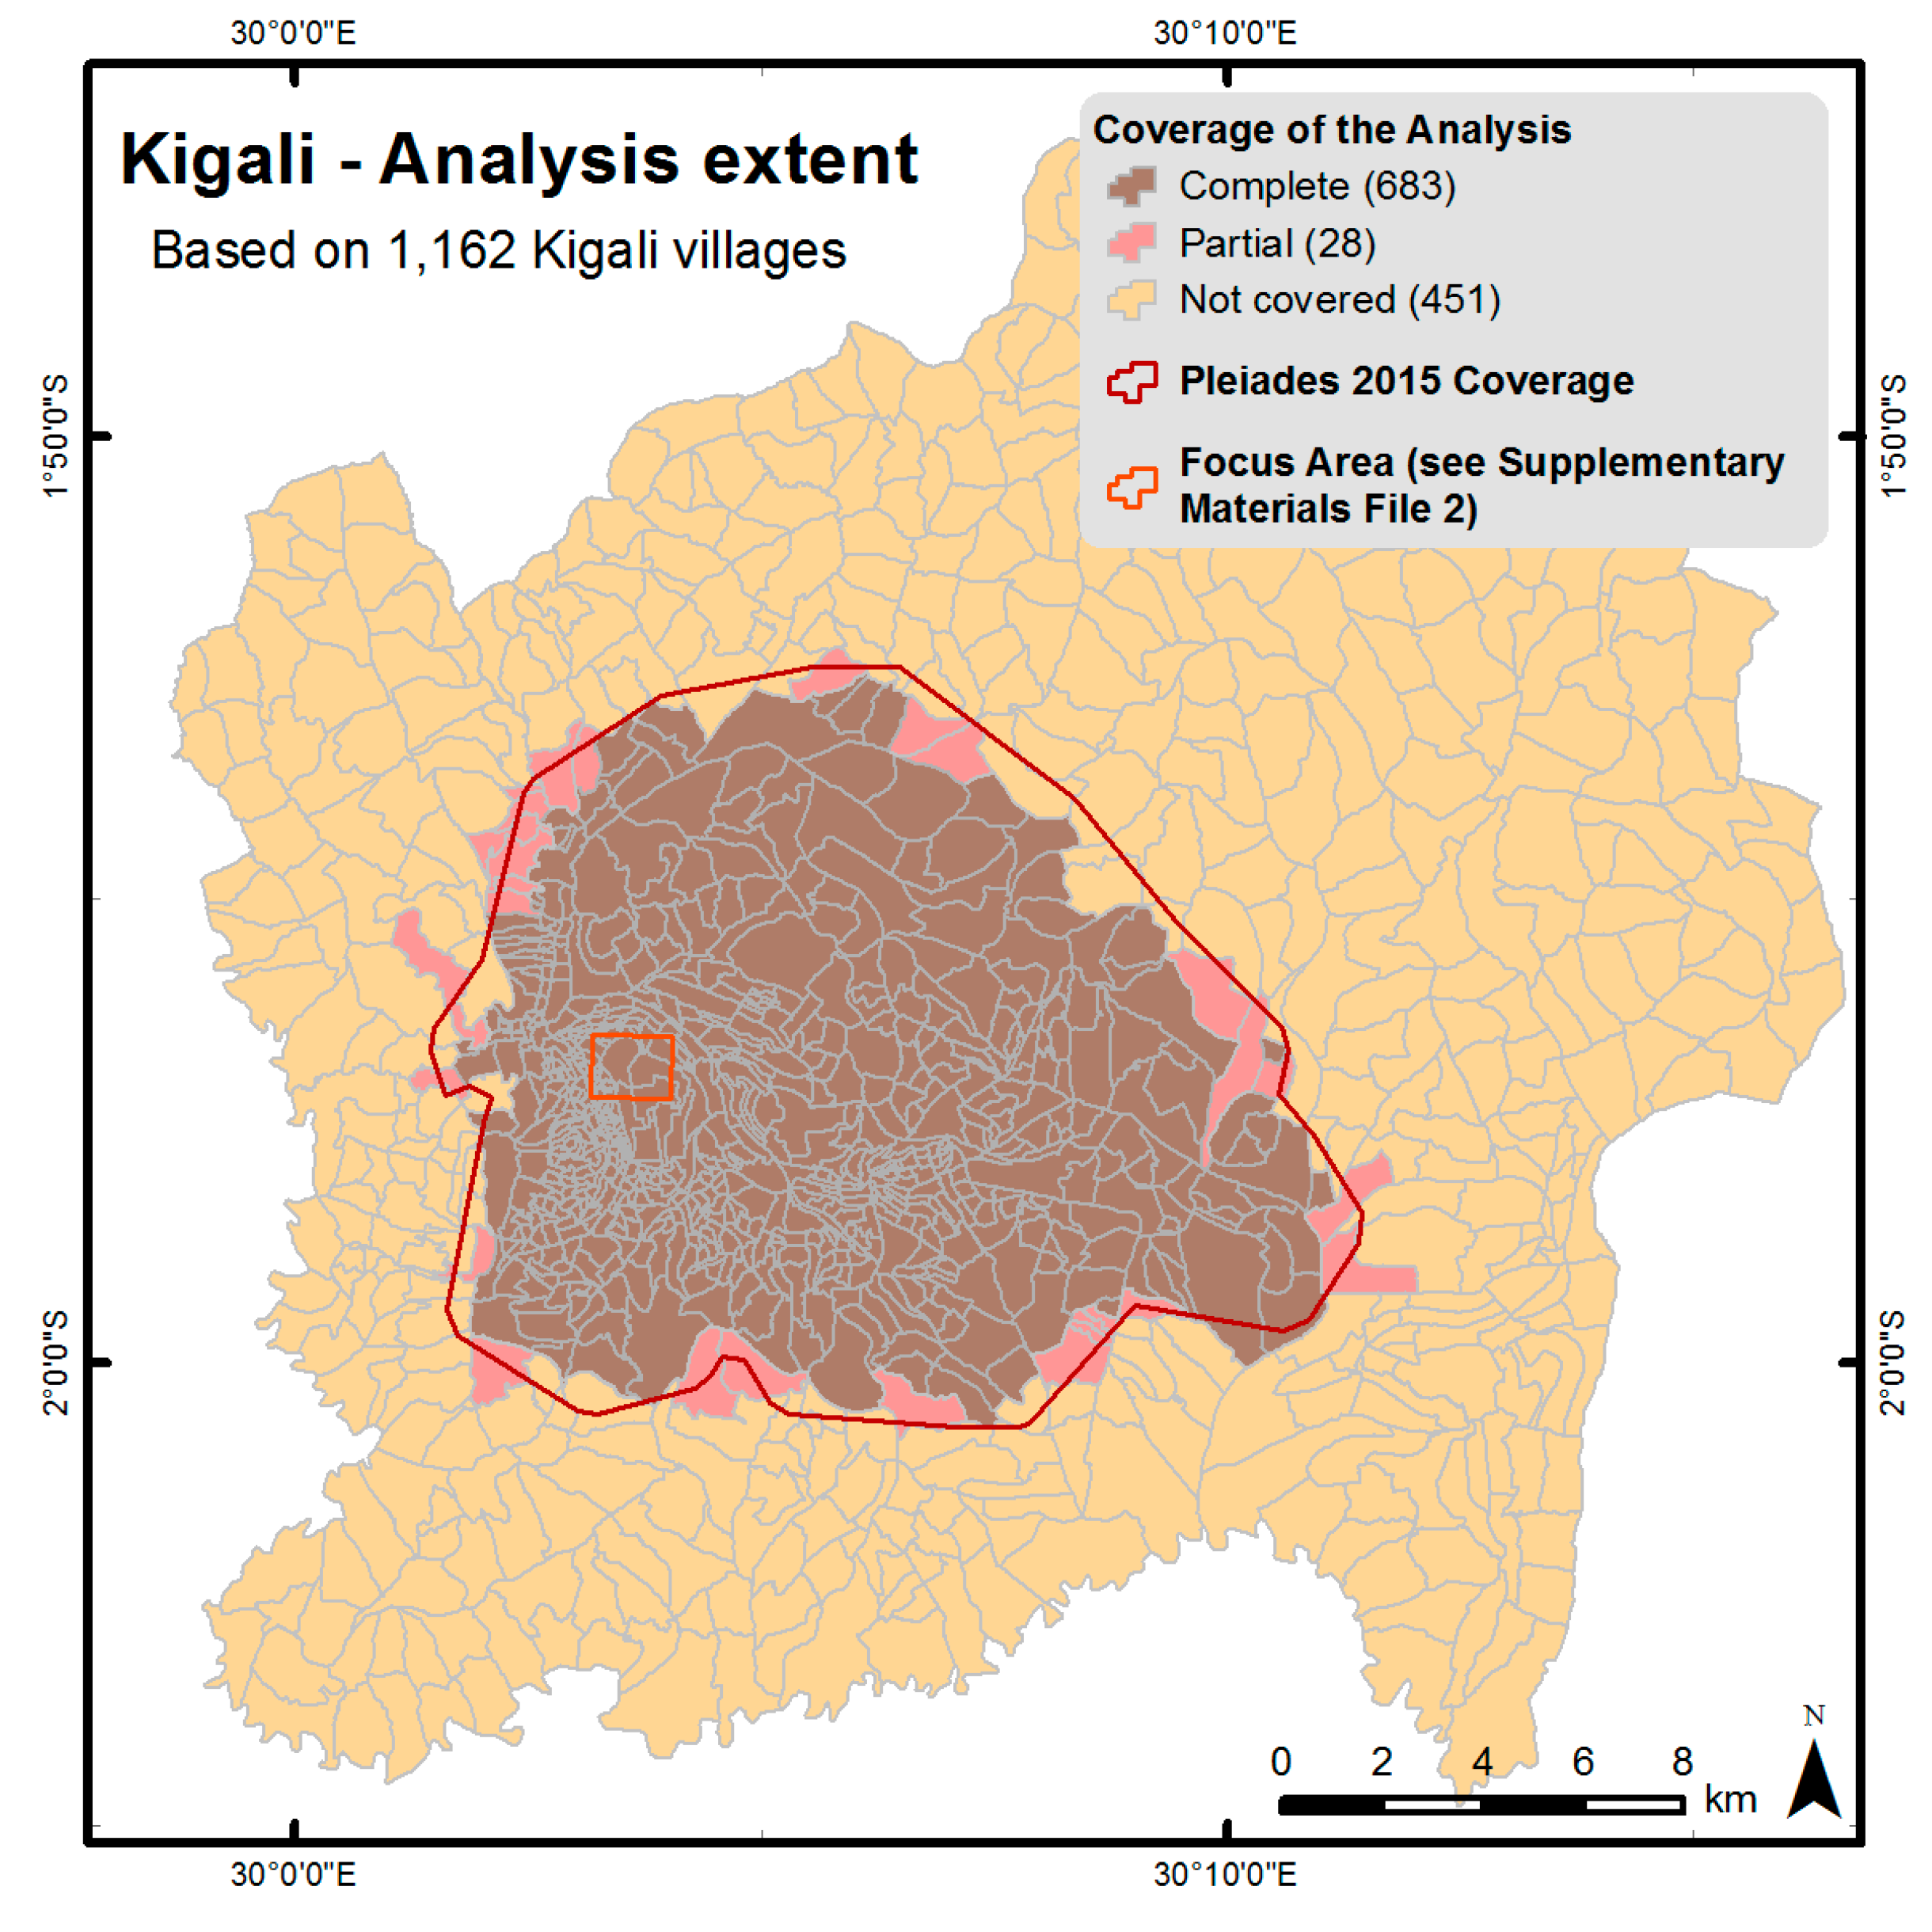
2.1. Study Area
2.2. Remote Sensing Data
2.3. Reference Data
2.4. Building Typology
2.5. Object-Based Image Analysis (OBIA)
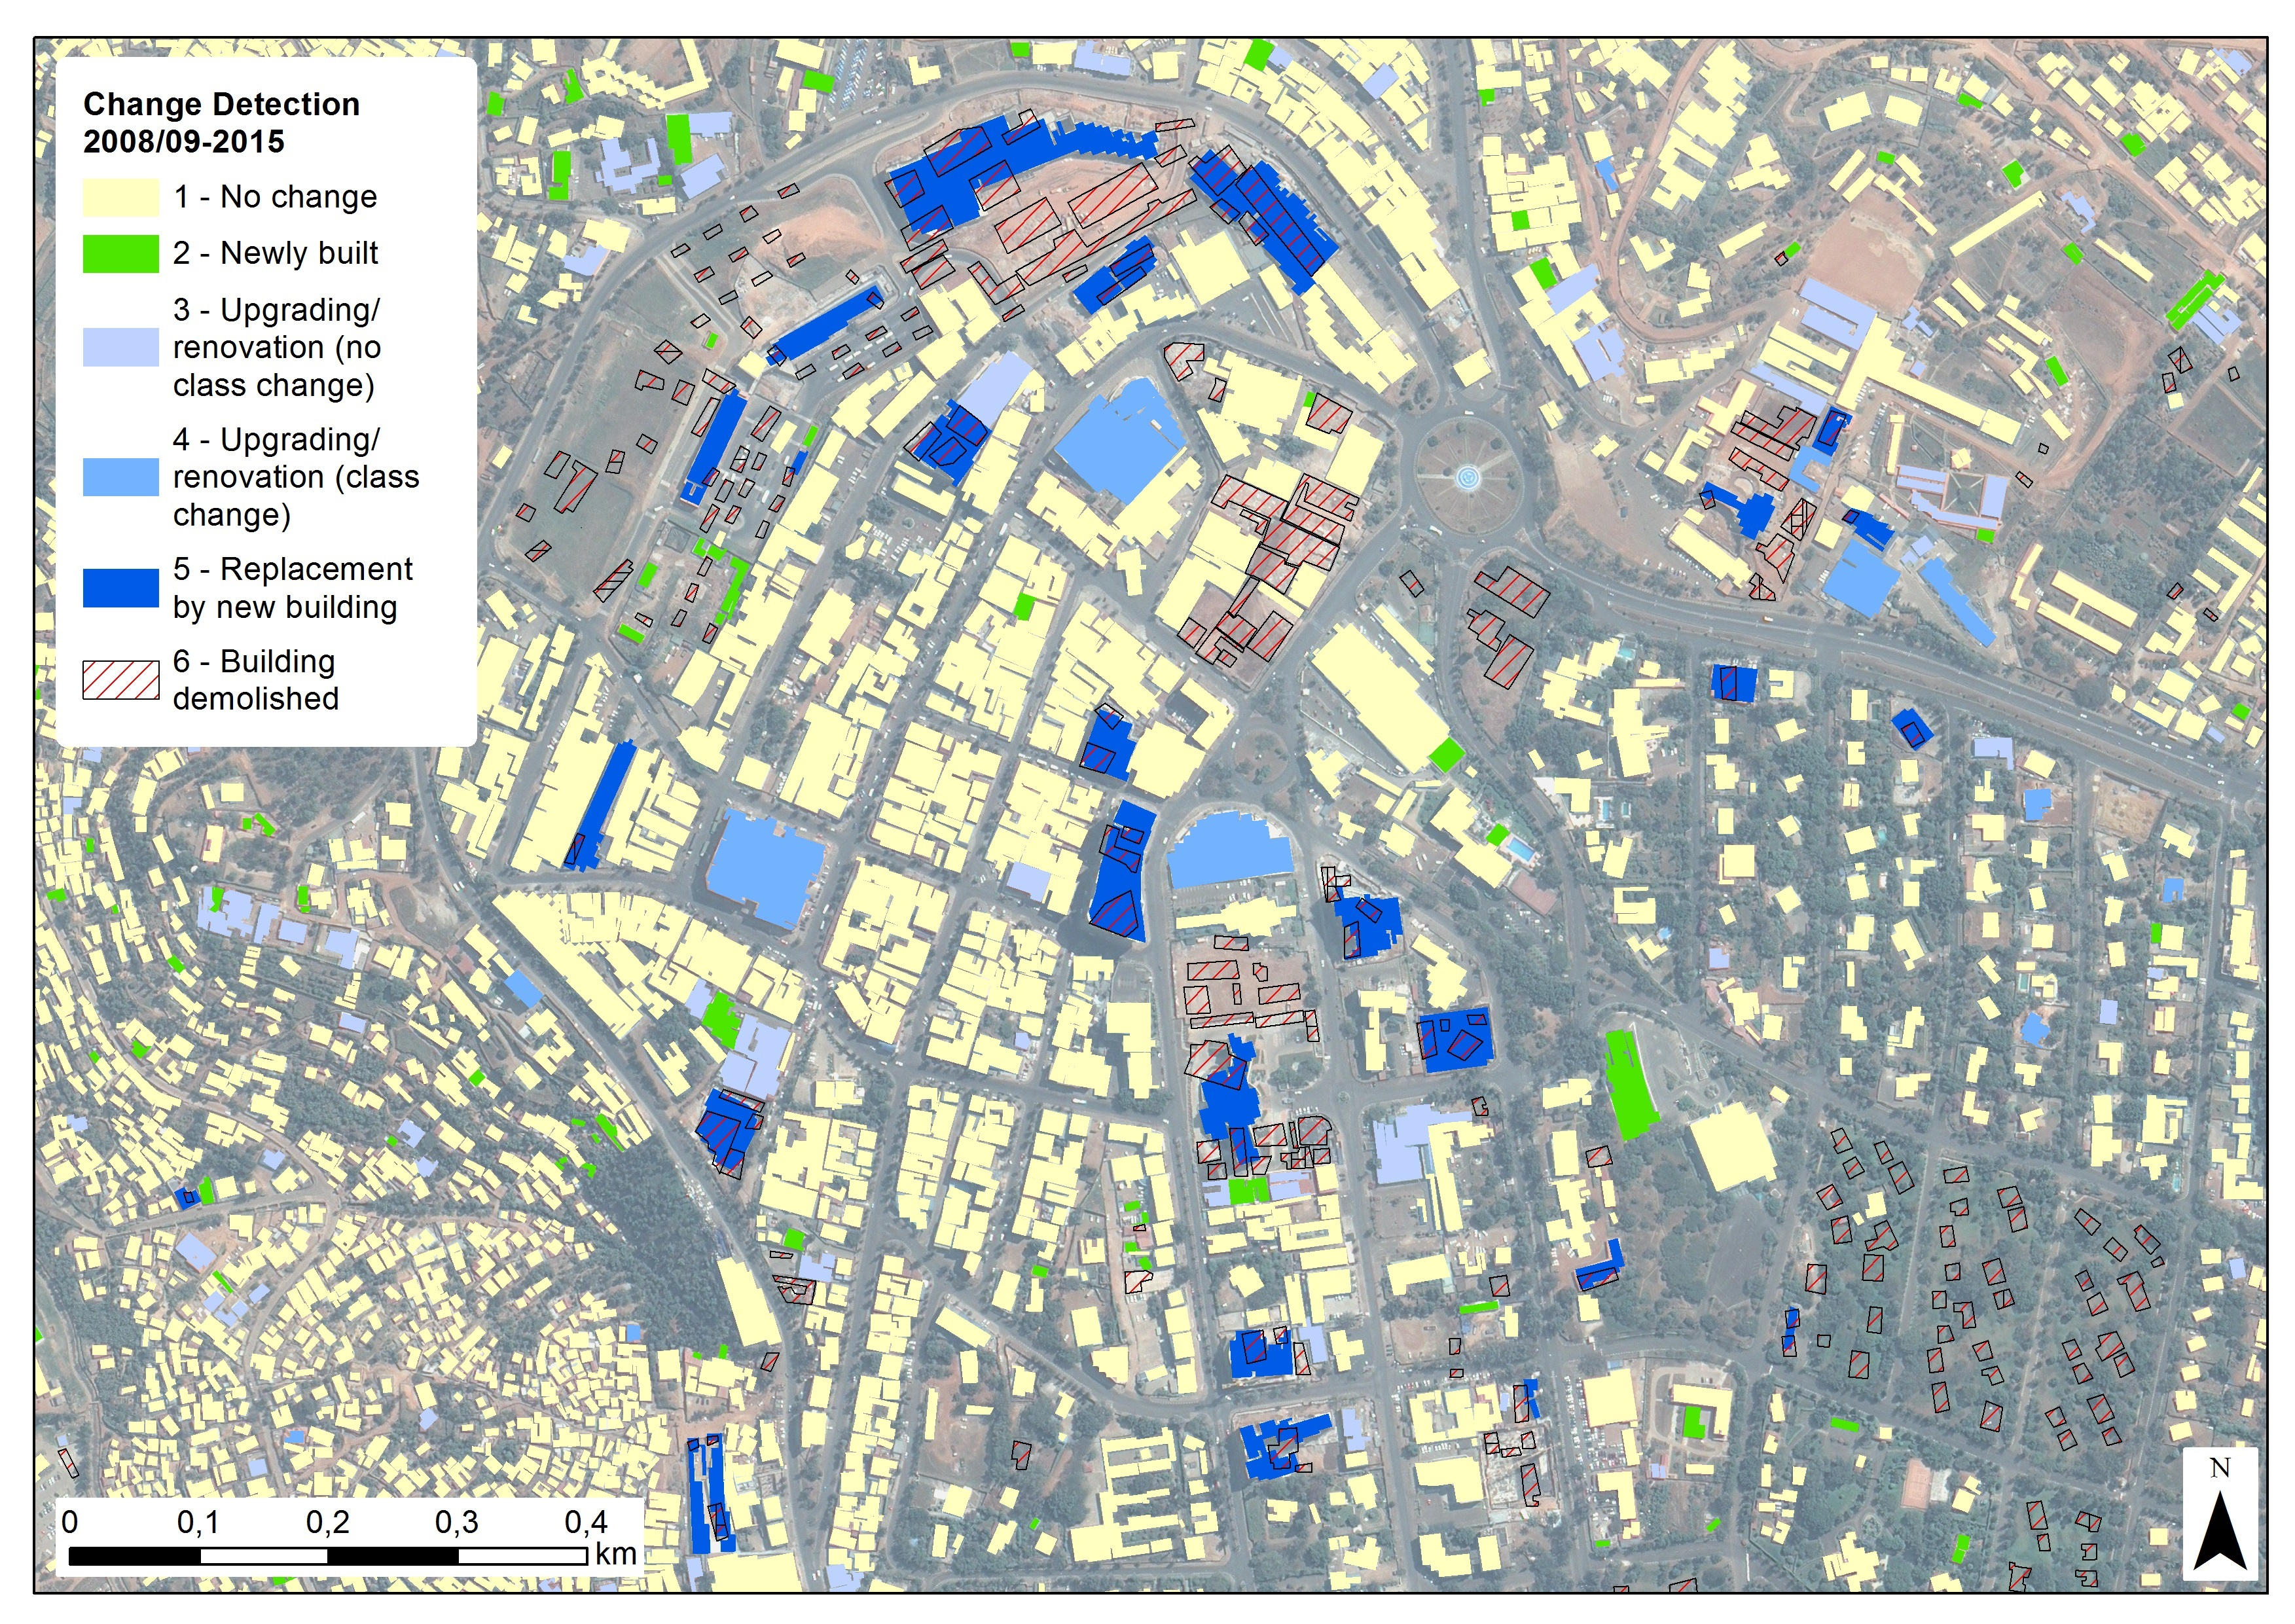
2.6. Geospatial Processing, Modelling, Expert Based Revision, and Manual Editing
2.7. Building Heights
3. Data Description
3.1. Basic Statistics on the Dataset
3.2. Accuracy Assessment and Known Limitations
3.3. Private Data Protection
3.4. Data Type
3.5. Data Structure
4. User Notes
- Which buildings existed in 2015?
- SELECT FROM EO4Kigali.shp WHERE (F2015_ty > 0)
- Which buildings existed in 2008–2009?
- SELECT FROM EO4Kigali.shp WHERE (Change = 1 OR Change = 3 OR Change = 4 OR Change = 6)
- Which/how many “Bungalow” buildings existed in 2015?
- SELECT FROM EO4Kigali.shp WHERE (F2015_ty = 3)
- For which buildings were no changes detected between 2008–2009 and 2015?
- SELECT FROM EO4Kigali.shp WHERE (Change = 1)
- Which/how many buildings were demolished between 2008–2009 and 2015?
- SELECT FROM EO4Kigali.shp WHERE (Change = 6)
- To include buildings that were rebuilt/renovated to a new building type:
- SELECT FROM EO4Kigali.shp WHERE (Change = 6 OR Change = 4)
- Which/how many were newly built/rebuilt between 2008–2009 and 2015?
- SELECT FROM EO4Kigali.shp WHERE (Change = 2 OR Change = 3 OR Change = 4 OR Change = 5); (Remark: with Change = 3 buildings are included that might only be renovated or slightly changed).
- Which/how many of object geometries of the “Basic” buildings were modelled and do therefore not represent the actual delineation to adjacent buildings?
- SELECT FROM EO4Kigali.shp WHERE (Model = 1)
Supplementary Materials
Author Contributions
Funding
Acknowledgments
Conflicts of Interest
References
- Musakwa, W.; Niekerk, A.V. Earth observation for sustainable urban planning in developing countries: Needs, trends, and future directions. J. Plan. Lit. 2015, 30, 149–160. [Google Scholar] [CrossRef]
- Bachofer, F.; Murray, S. Remote Sensing for Measuring Housing Supply in Kigali; C-38418-RWA-1; IGC: London, UK, 2018; p. 38. [Google Scholar]
- NISR; MINECOFIN. Rwanda Fourth Population and Housing Census 2012; National Institute of Statistics of Rwanda (NISR, Rwanda), Ministry of Finance and Economic Planning (MINECOFIN, Rwanda): Kigali, Rwanda, 2015; p. 99.
- Nduwayezu, G.; Sliuzas, R.; Kuffer, M. Modeling urban growth in Kigali city Rwanda. Rwanda J. 2017, 1. [Google Scholar] [CrossRef]
- Shrijan, J.; Shrena, J.; Hrydhal, D.; Juvena, N.; Lissiana, L. Kigali City Master Plan Report; RWF1101_03; Surbana: Kigali City, Rwanda, 2013. [Google Scholar]
- Gleyzes, M.A.; Perret, L.; Kubik, P. Pleiades System Architecture and Main Performances. In Proceedings of the ISPRS—International Archives of the Photogrammetry Remote Sensing and Spatial Information Sciences, Melbourne, Australia, 25 August–1 September 2012; pp. 537–542. [Google Scholar]
- Ghassemian, H. A review of remote sensing image fusion methods. Inf. Fusion 2016, 32, 75–89. [Google Scholar] [CrossRef]
- Sagashya, D.G. Launching the New Rwanda Basemap 1:50,000; Rwanda Natural Resources Authority—RNRA: ESRI GIS-day Kigali, Rwanda, 2014. [Google Scholar]
- Blaschke, T. Object based image analysis for remote sensing. ISPRS J. Photogramm. Remote Sens. 2010, 65, 2–16. [Google Scholar] [CrossRef]
- Baatz, M.; Schäpe, A. Multiresolution segmentation: An optimization approach for high quality multi-scale image segmentation. In Angewandte Geographische Informations-Verarbeitung, XII; Strobl, J., Blaschke, T., Griesbner, G., Eds.; Wichmann Verlag: Karlsruhe, Germany, 2000; pp. 12–23. [Google Scholar]
- Ma, L.; Li, M.; Blaschke, T.; Ma, X.; Tiede, D.; Cheng, L.; Chen, Z.; Chen, D. Object-based change detection in urban areas: The effects of segmentation strategy, scale, and feature space on unsupervised methods. Remote Sens. 2016, 8, 761. [Google Scholar] [CrossRef]
- Canny, J. A computational approach to edge detection. IEEE Trans. Pattern Anal. Mach. Intell. 1986, PAMI-8, 679–698. [Google Scholar] [CrossRef]
- Bachofer, F.; Quénéhervé, G.; Zwiener, T.; Maerker, M.; Hochschild, V. Comparative analysis of edge detection techniques for SAR images. Eur. J. Remote Sens. 2016, 49, 205–224. [Google Scholar] [CrossRef]
- OpenStreetMap. © OpenStreetMap Contributors. Available online: https://www.openstreetmap.org (accessed on 15 October 2014).
- Gribov, A. Searching for a compressed polyline with a minimum number of vertices (discrete solution). In Graphics Recognition. Current Trends and Evolutions; Springer International Publishing: Cham, Switzerland, 2018; pp. 54–68. [Google Scholar]
- Baker, W.L.; Cai, Y. The r.Le programs for multiscale analysis of landscape structure using the grass geographical information system. Landsc. Ecol. 1992, 7, 291–302. [Google Scholar] [CrossRef]
- d’Angelo, P.; Kuschk, G. Dense multi-view stereo from satellite imagery, IGARSS 2012. In Proceedings of the IEEE, Munich, Germany, 22–27 July 2012; pp. 6944–6947. [Google Scholar]
- Perko, R.; Raggam, H.; Gutjahr, K.H.; Schardt, M. Advanced DTM generation from very high resolution satellite stereo images. In Proceedings of the ISPRS Annals of Photogrammetry Remote Sensing and Spatial Information Sciences, Munich, Germany, 25–27 March 2015; Volume II-3/W4, pp. 165–172. [Google Scholar] [CrossRef]
- ESRI. Esri Shapefile Technical Description; Environmental Systems Research Institute, Inc. (ESRI): Redlands, CA, USA, 1998. [Google Scholar]


| Building Archetypes/Building Class | Code | Short Names | Minimum Area (m2) | Maximum Area (m2) | Minimum Height (m) | Maximum Height (m) |
|---|---|---|---|---|---|---|
| Rudimentary, basic or unplanned buildings | 1 | Basic | 5 | 150 | 2.1 | 6 |
| Building in block structure/large courtyard buildings | 2 | Block | 5 | - | 2.1 | 8 |
| Bungalow-type buildings | 3 | Bungalow | 40 | 500 | 3.1 | 12 |
| Villa-type buildings | 4 | Villa | 150 | 600 | 3.2 | 15 |
| Low to mid-rise multi-unit buildings | 5 | Mid-rise | 100 | - | 3 | 10 |
| High-rise buildings | 6 | High-rise | 200 | - | 8 | - |
| Halls | 7 | Hall | 100 | - | 3 | - |
| Special structures | 8 | Special | 5 | - | - | - |
| Construction site | 9 | Construction | 5 | - |

| Change Code | Type of Change |
|---|---|
| 1 | No change |
| 2 | Newly built (on a previously unbuilt area) |
| 3 | Upgrading/ renovation (roof, structure) of an existing building or newly built building without a significant change of the building class or footprint area |
| 4 | Upgrading/ renovation (roof, structure) of an existing building or newly built building with a change of the building class. No change in the number of buildings and the footprint area |
| 5 | Building replaced by one or more newly built buildings with a change of the building class OR a significant change of the footprint area |
| 6 | Building demolished |
| Building Type | No. of Buildings 2008–2009 | No. of Buildings 2015 | Change of Number of Buildings | Change in % | Area of Buildings 2008–2009 (m2) | Area of Buildings 2015 (m2) | Total Area Change (m2) | Area Change in % |
|---|---|---|---|---|---|---|---|---|
| Basic | 135,577 | 170,805 | 35,228 | 26.0% | 9,590,293 | 11,558,170 | 1,967,877 | 20.5% |
| Block | 1609 | 1587 | −22 | −1.4% | 339,830 | 340,747 | 917 | 0.3% |
| Bungalow | 20,313 | 27,610 | 7297 | 35.9% | 3,853,114 | 5,179,569 | 1,326,455 | 34.4% |
| Villa | 1542 | 4781 | 3239 | 210.1% | 471,511 | 1,371,557 | 900,046 | 190.9% |
| Mid-rise | 503 | 806 | 303 | 60.2% | 290,089 | 470,566 | 180,477 | 62.2% |
| High-rise | 211 | 371 | 160 | 75.8% | 154,731 | 303,134 | 148,403 | 95.9% |
| Hall | 3396 | 4306 | 910 | 26.8% | 1,896,004 | 2,456,091 | 560,087 | 29.5% |
| Special | 211 | 253 | 42 | 19.9% | 48,338 | 61,508 | 13,170 | 27.2% |
| Construction | 2263 | 939 | −1324 | −58.5% | 611,744 | 311,927 | −299,817 | −49.0% |
| SUM | 165,625 | 211,458 | 45,833 | 27.7% | 17,255,654 | 22,053,269 | 4,797,615 | 27.8% |
| Classified Building Types | Producer’s Accuracy | |||||||||
|---|---|---|---|---|---|---|---|---|---|---|
| 1 | 2 | 3 | 4 | 5 | 6 | 7 | 8 | |||
| Reference Data | 1 | 330 | 1 | 3 | 0 | 0 | 0 | 0 | 0 | 99% |
| 2 | 0 | 84 | 0 | 0 | 0 | 0 | 0 | 0 | 100% | |
| 3 | 11 | 0 | 243 | 2 | 0 | 0 | 1 | 0 | 95% | |
| 4 | 0 | 0 | 11 | 90 | 0 | 0 | 0 | 0 | 89% | |
| 5 | 0 | 0 | 1 | 0 | 24 | 2 | 2 | 0 | 83% | |
| 6 | 0 | 0 | 0 | 0 | 1 | 37 | 0 | 0 | 97% | |
| 7 | 1 | 0 | 2 | 0 | 1 | 0 | 38 | 0 | 90% | |
| 8 | 0 | 1 | 1 | 0 | 0 | 0 | 0 | 2 | 50% | |
| User’s Accuracy | 96% | 98% | 93% | 98% | 92% | 95% | 93% | 100% | Overall Accuracy 848/889 = 95.4% | |
| Building Type | 1 | 2 | 3 | 4 | 5 | 6 | 7 | 8 | All Buildings |
|---|---|---|---|---|---|---|---|---|---|
| Mean absolute derivation in m | 0.78 | 0.83 | 0.84 | 1.28 | 3.83 | 5.11 | 1.54 | 4.23 | 1.21 |
| Column Name | Content | Valid for 2008–2009 | Valid for 2015 |
|---|---|---|---|
| Model | Value “1” indicates that the object results from the splitting of a large “Basic” building segment according to the LUT in Section 2.6. | X | X |
| Change | Indicates the type of change between 2008–2009 and 2015. The value ranges from 1–6 for 2008–2009, and from 1–5 for 2015 (see Table 3). | X | X |
| 2015_ty | Indicates the building archetype by code for the year 2015. The value ranges from 1–9 (0 in case a building that existed in 2008–2009 was demolished). | X | |
| 2009_ty | Indicates the building archetype by code for 2008/2009. The value ranges from 1–9 (0 in the case that a building was newly built between 2008/2009 and 2015). | X | |
| 2015_name | Indicates the building archetype by its short name for the year 2015. | X | |
| 2009_name | Indicates the building archetype by its short name for the year 2009. | X | |
| Height | Corrected mean object height in m (corresponds to the 2015 buildings). | X | |
| Shape_Leng | Total perimeter of the object in m. | X | X |
| Shape_Area | Total area of the object in m2. | X | X |
| UID | Unique identifier (Integer) of an object feature. | X | X |
© 2019 by the authors. Licensee MDPI, Basel, Switzerland. This article is an open access article distributed under the terms and conditions of the Creative Commons Attribution (CC BY) license (http://creativecommons.org/licenses/by/4.0/).
Share and Cite
Bachofer, F.; Braun, A.; Adamietz, F.; Murray, S.; d’Angelo, P.; Kyazze, E.; Mumuhire, A.P.; Bower, J. Building Stock and Building Typology of Kigali, Rwanda. Data 2019, 4, 105. https://doi.org/10.3390/data4030105
Bachofer F, Braun A, Adamietz F, Murray S, d’Angelo P, Kyazze E, Mumuhire AP, Bower J. Building Stock and Building Typology of Kigali, Rwanda. Data. 2019; 4(3):105. https://doi.org/10.3390/data4030105
Chicago/Turabian StyleBachofer, Felix, Andreas Braun, Florian Adamietz, Sally Murray, Pablo d’Angelo, Edward Kyazze, Abias Philippe Mumuhire, and Jonathan Bower. 2019. "Building Stock and Building Typology of Kigali, Rwanda" Data 4, no. 3: 105. https://doi.org/10.3390/data4030105
APA StyleBachofer, F., Braun, A., Adamietz, F., Murray, S., d’Angelo, P., Kyazze, E., Mumuhire, A. P., & Bower, J. (2019). Building Stock and Building Typology of Kigali, Rwanda. Data, 4(3), 105. https://doi.org/10.3390/data4030105