Data Descriptor

BLE RSS Measurements Dataset for Research on Accurate Indoor Positioning

Institute of New Imaging Technologies, Universitat Jaume I, Av. Vicente Sos Baynat s/n, 12071 Castellón de la Plana, Spain
*
Author to whom correspondence should be addressed.
These authors contributed equally to this work.
Submission received: 5 December 2018 / Revised: 2 January 2019 / Accepted: 8 January 2019 / Published: 12 January 2019
(This article belongs to the Special Issue Wireless Localization: Tracking and Navigation Data Set)

Abstract

:
RSS-based indoor positioning is a consolidated research field for which several techniques have been proposed. Among them, Bluetooth Low Energy (BLE) beacons are a popular option for practical applications. This paper presents a new BLE RSS database that was created to aid in the development of new BLE RSS-based positioning methods and to encourage their reproducibility and comparability. The measurements were collected in two university zones: an area among bookshelves in a library and an area of an office space. Each zone had its own batch of deployed iBKS 105 beacons, configured to broadcast advertisements every 200 ms. The collection in the library zone was performed using three Android smartphones of different brands and models, with beacons broadcasting at −12 dBm transmission power, while in the other zone the collection was performed using of one those smartphones with beacons configured to advertise at the −4 dBm, −12 dBm and −20 dBm transmission powers. Supporting materials and scripts are provided along with the database, which annotate the BLE readings, provide details on the collection, the environment, and the BLE beacon deployments, ease the database usage, and introduce the reader to BLE RSS-based positioning and its challenges. The BLE RSS database and its supporting materials are available at the Zenodo repository under the open-source MIT license.
Dataset License: MIT

1. Introduction

Location-based services (LBS) have drawn great attention from academia and industry in recent years as they have become more frequently used and demanded. Positioning is at the core of LBS, and it remains a technical challenge for dense urban environments, indoors, and underground [1], despite the many efforts devoted to alternatives to GNSS-based positioning [2], and in particular to alternatives readily applicable to smartphones [3]. Among those alternatives are magnetic signals [4,5], RFID [6], LED light [7,8], vision-based techniques [9], and Wi-Fi [10] and Bluetooth Low Energy (BLE) [11] signals, all of them often combined with Pedestrian Dead Reckoning (PDR) and Map-Matching [3,12]. Cellular networks can be used for positioning using techniques like UTDOA [13], OTDOA and E-CID [14] with 4G LTE networks. The advent of 5G NR networks will likely mean densely distributed access nodes and wide bandwidths at high frequency bands, which will likely enable very accurate positioning in GNSS-denied environments [15,16].
BLE beacon-based positioning is a reality [17], and it is currently applied in museums, airports [17,18,19] and applications that require fine-grained proximity or a relatively cheap positioning technique when Wi-Fi-based positioning is not appropriate [20]. BLE beacons are usually small, advertisement-emitting, battery-powered devices designed for easy deployment in a variety of indoor environments. Currently, there is richness in the BLE beacons availability regarding vendor, price range, supported protocols, transmission powers, advertisement frequency capabilities and battery lifespan [21]. Higher achievable accuracies, better privacy, lower phone battery drain, and lower network traffic are some of the advantages of using BLE over Wi-Fi for indoor positioning [3,11].
BLE was introduced in Bluetooth 4.0, and among its goals were to lower costs and to lower the power consumption in comparison to the “classical” Bluetooth [22]. BLE shares many similarities with Wi-Fi (2.4 GHz band frequencies), and thus, it is often used in a similar way as Wi-Fi for indoor positioning, i.e., applying RSS-based techniques [3]. However, some important differences should be considered when dealing with BLE RSS measurements [11]. Furthermore, while most Wi-Fi positioning research works have the assumption that there are Wi-Fi routers already in place, the BLE beacon placement choice should be carefully considered to find a proper balance among goals like accuracy, cost, robustness, and battery duration.
The need for RSS databases in indoor positioning research that would foster reproducibility and comparability has been acknowledge for the case of Wi-Fi [23], with several and variate available databases [24]. Such need has also been referred for other radio-frequencies [25,26]. However, to the best of our knowledge, the number of available BLE RSS databases is currently low. Tóth and Tamás [27] collected measurements from Bluetooth enabled devices, but their actual locations were not registered. In some databases, the measurements were collected using Raspberry Pis [28,29,30,31] while the localization target had a BLE emitting device. For Iqbal et al. [28], Byrne et al. [29], Sikeridis et al. [30], the localization target was a participant describing a track, in several environments, while in [31] the target was static. The number of BLE RSS databases is even lower for the case of RSS measurements for off-the-shelf (location or proximity intended) beacons signals collected using smartphones. The database in Mohammadi et al. [32] provides RSS readings from 13 iBeacons (with a 30–40 feet separation) mounted on the ceiling of a floor from a university library. The measurements were collected using an iPhone 6S. The database from Lazik et al. [33] was collected using an iPhone 5S by participants describing tracks in several environments and include measurements from several sensors. The beacons were developed by the authors, they were mounted in tripods near the ceiling, and they emitted iBeacon broadcasts at 10 Hz. In the environments, 3–4 beacons were always visible in line-of-sight to the receptor, and the number of beacons in a environment ranged from 5 to 11. Their database also provides information about the environment and scripts to load the data and to test several positioning algorithms that use measurements from several sensors. In Baronti et al. [34], the authors setup had Raspberry Pis boards with BLE dongles acting as (fixed) emitters and receivers, also having BLE beacons and smartphones carried by subjects. Their dataset is divided into a set for remote positioning, which corresponds to data collected by fixed emitters and emitted by BLE beacons (wearable emitters), and a set for self positioning, which correspond to measurements collected by smartphones and emitted by the fixed emitters. The authors considered several rooms and three power transmission configurations. One phone model was used and there was one fixed emitter/receiver per room.
The main goal of this paper is to introduce to the research community a new BLE RSS database and its related information. The database is composed by BLE measurements collected for research in RSS and smartphone based, fine grained, indoor positioning techniques. The measurements were taken in two zones of the Universitat Jaume I (UJI): an area of its Library’s 5th floor and an area of the Geotec group office space. Both of them featured dense BLE beacon deployments that allow positioning accuracies below 3 m. The RSS measurements were carefully labeled with their collection details and they involved three smartphones of different brand and model for the Library zone, and three different transmission power levels for the Geotec zone.
To the best of our knowledge, no other freely available BLE RSS database allows testing positioning methods across several devices, environments and transmission power levels with a high density of deployed BLE beacons. The database described in this paper intents to aid the development of indoor positioning methods that may obtain high accuracies by relying in a relatively high density of emitters, namely BLE beacons. BLE-based positioning methods are able to obtain higher accuracies than those based on Wi-Fi [3,11]. Despite technologies like UWB and ultrasound allow higher accuracies than BLE, they are not widely supported in user devices or have cheap emitter devices that form an ecosystem that allows them a fast-paced growth in market and research [35].
The BLE RSS data is accompanied by beacon deployment descriptions, environment information, and a set of Matlab © scripts that help in data handling and perform demonstrative analyses. The analyses are intended to show likely data usage in indoor positioning research and to highlight important details to take into account when developing BLE RSS-based positioning methods. More specifically, they show how the variations in signal strength and in the advertisement detection intervals deteriorate the positioning accuracy, while also demonstrating how the known buffering technique [11] effectively deals with such issues. Additionally, the analyses show the difference in reported RSS and the positioning accuracy among the collection smartphones and transmission power levels. Furthermore, they present how, apart from fingerprinting, which is the star technique for Wi-Fi based positioning, the much simpler Weighted Centroid is an appropriate method for BLE-based positioning given that the beacon deployment locations are known and that its accuracy is high. In addition, the two position estimation methods are tested first under three deployment configurations and later under random beacon disconnection settings. Moreover, the collection locations match some of the positions used to collect samples for previous Wi-Fi databases [24,36] which may prove useful to test indoor positioning approaches that may harness both signals, as well as RSS values comparisons regarding stability and emitter detection times.
The organization of the remaining sections of the paper is as follows. Section 2 provides insights on the the data collection process and environments. Section 3 describes the RSS data and its related information. Section 4 provide analyses that introduce the database usage and BLE RSS-based positioning. Finally, Section 5 closes the paper with some concluding statements.

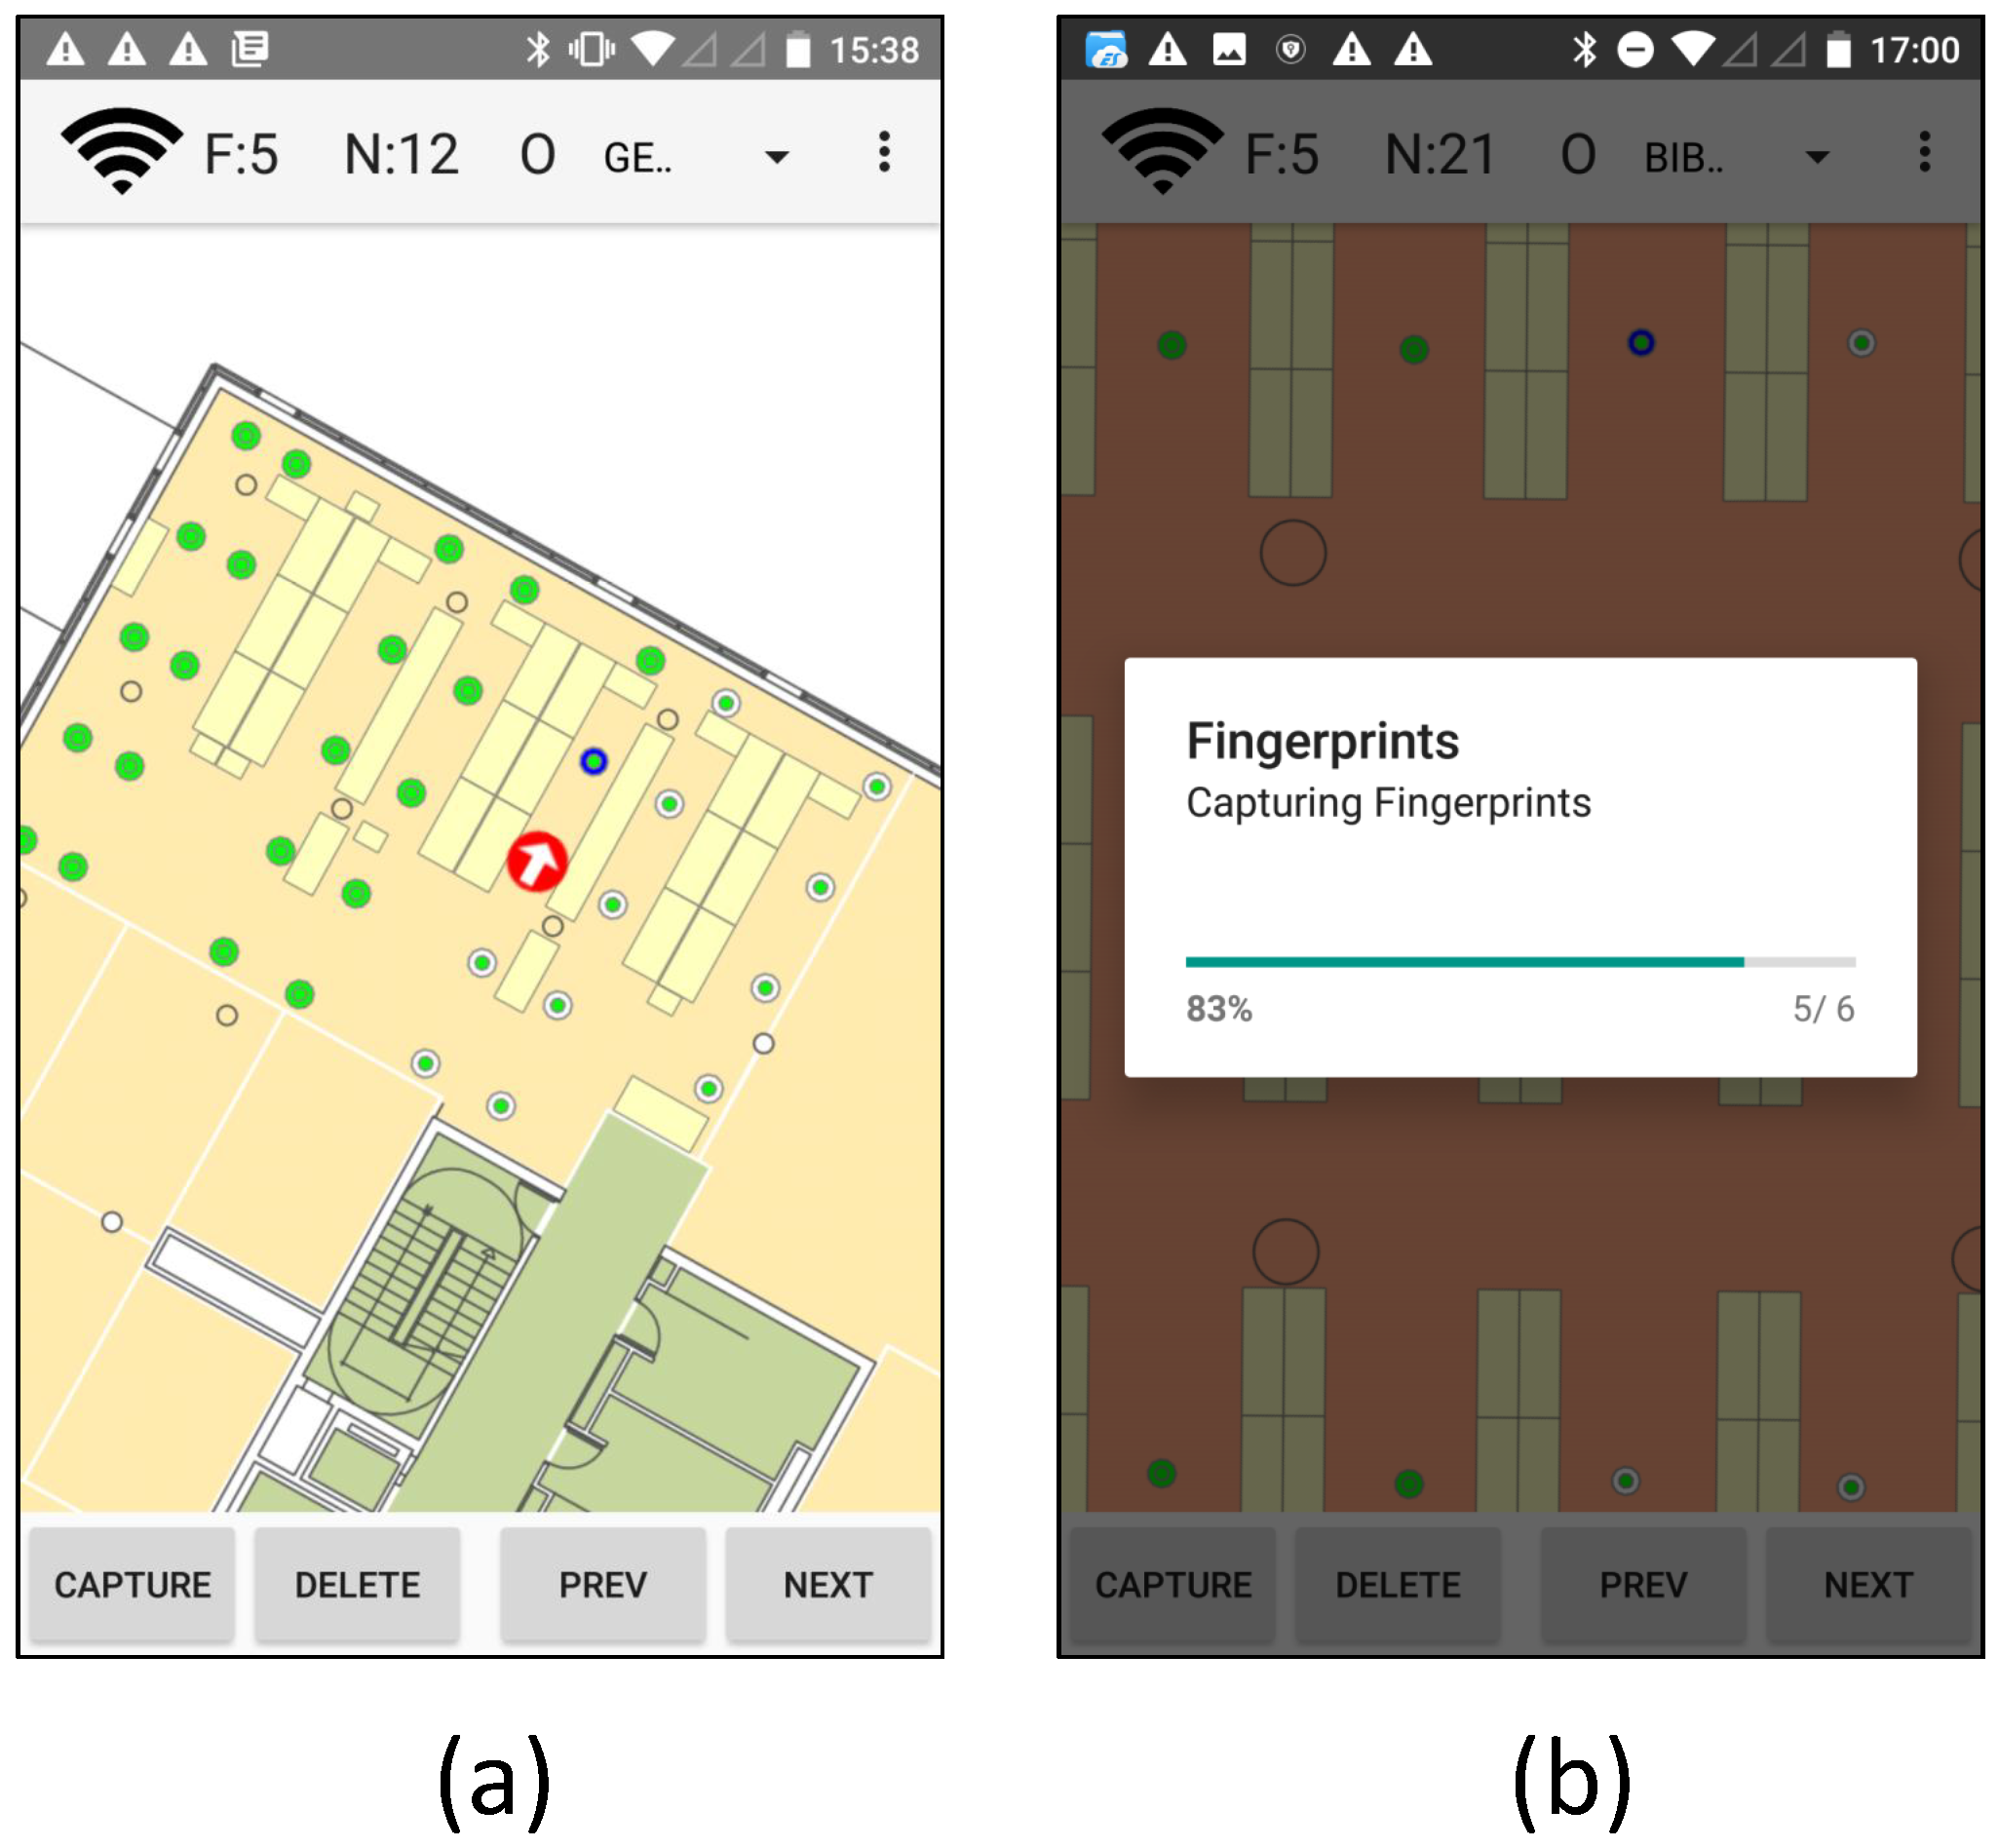
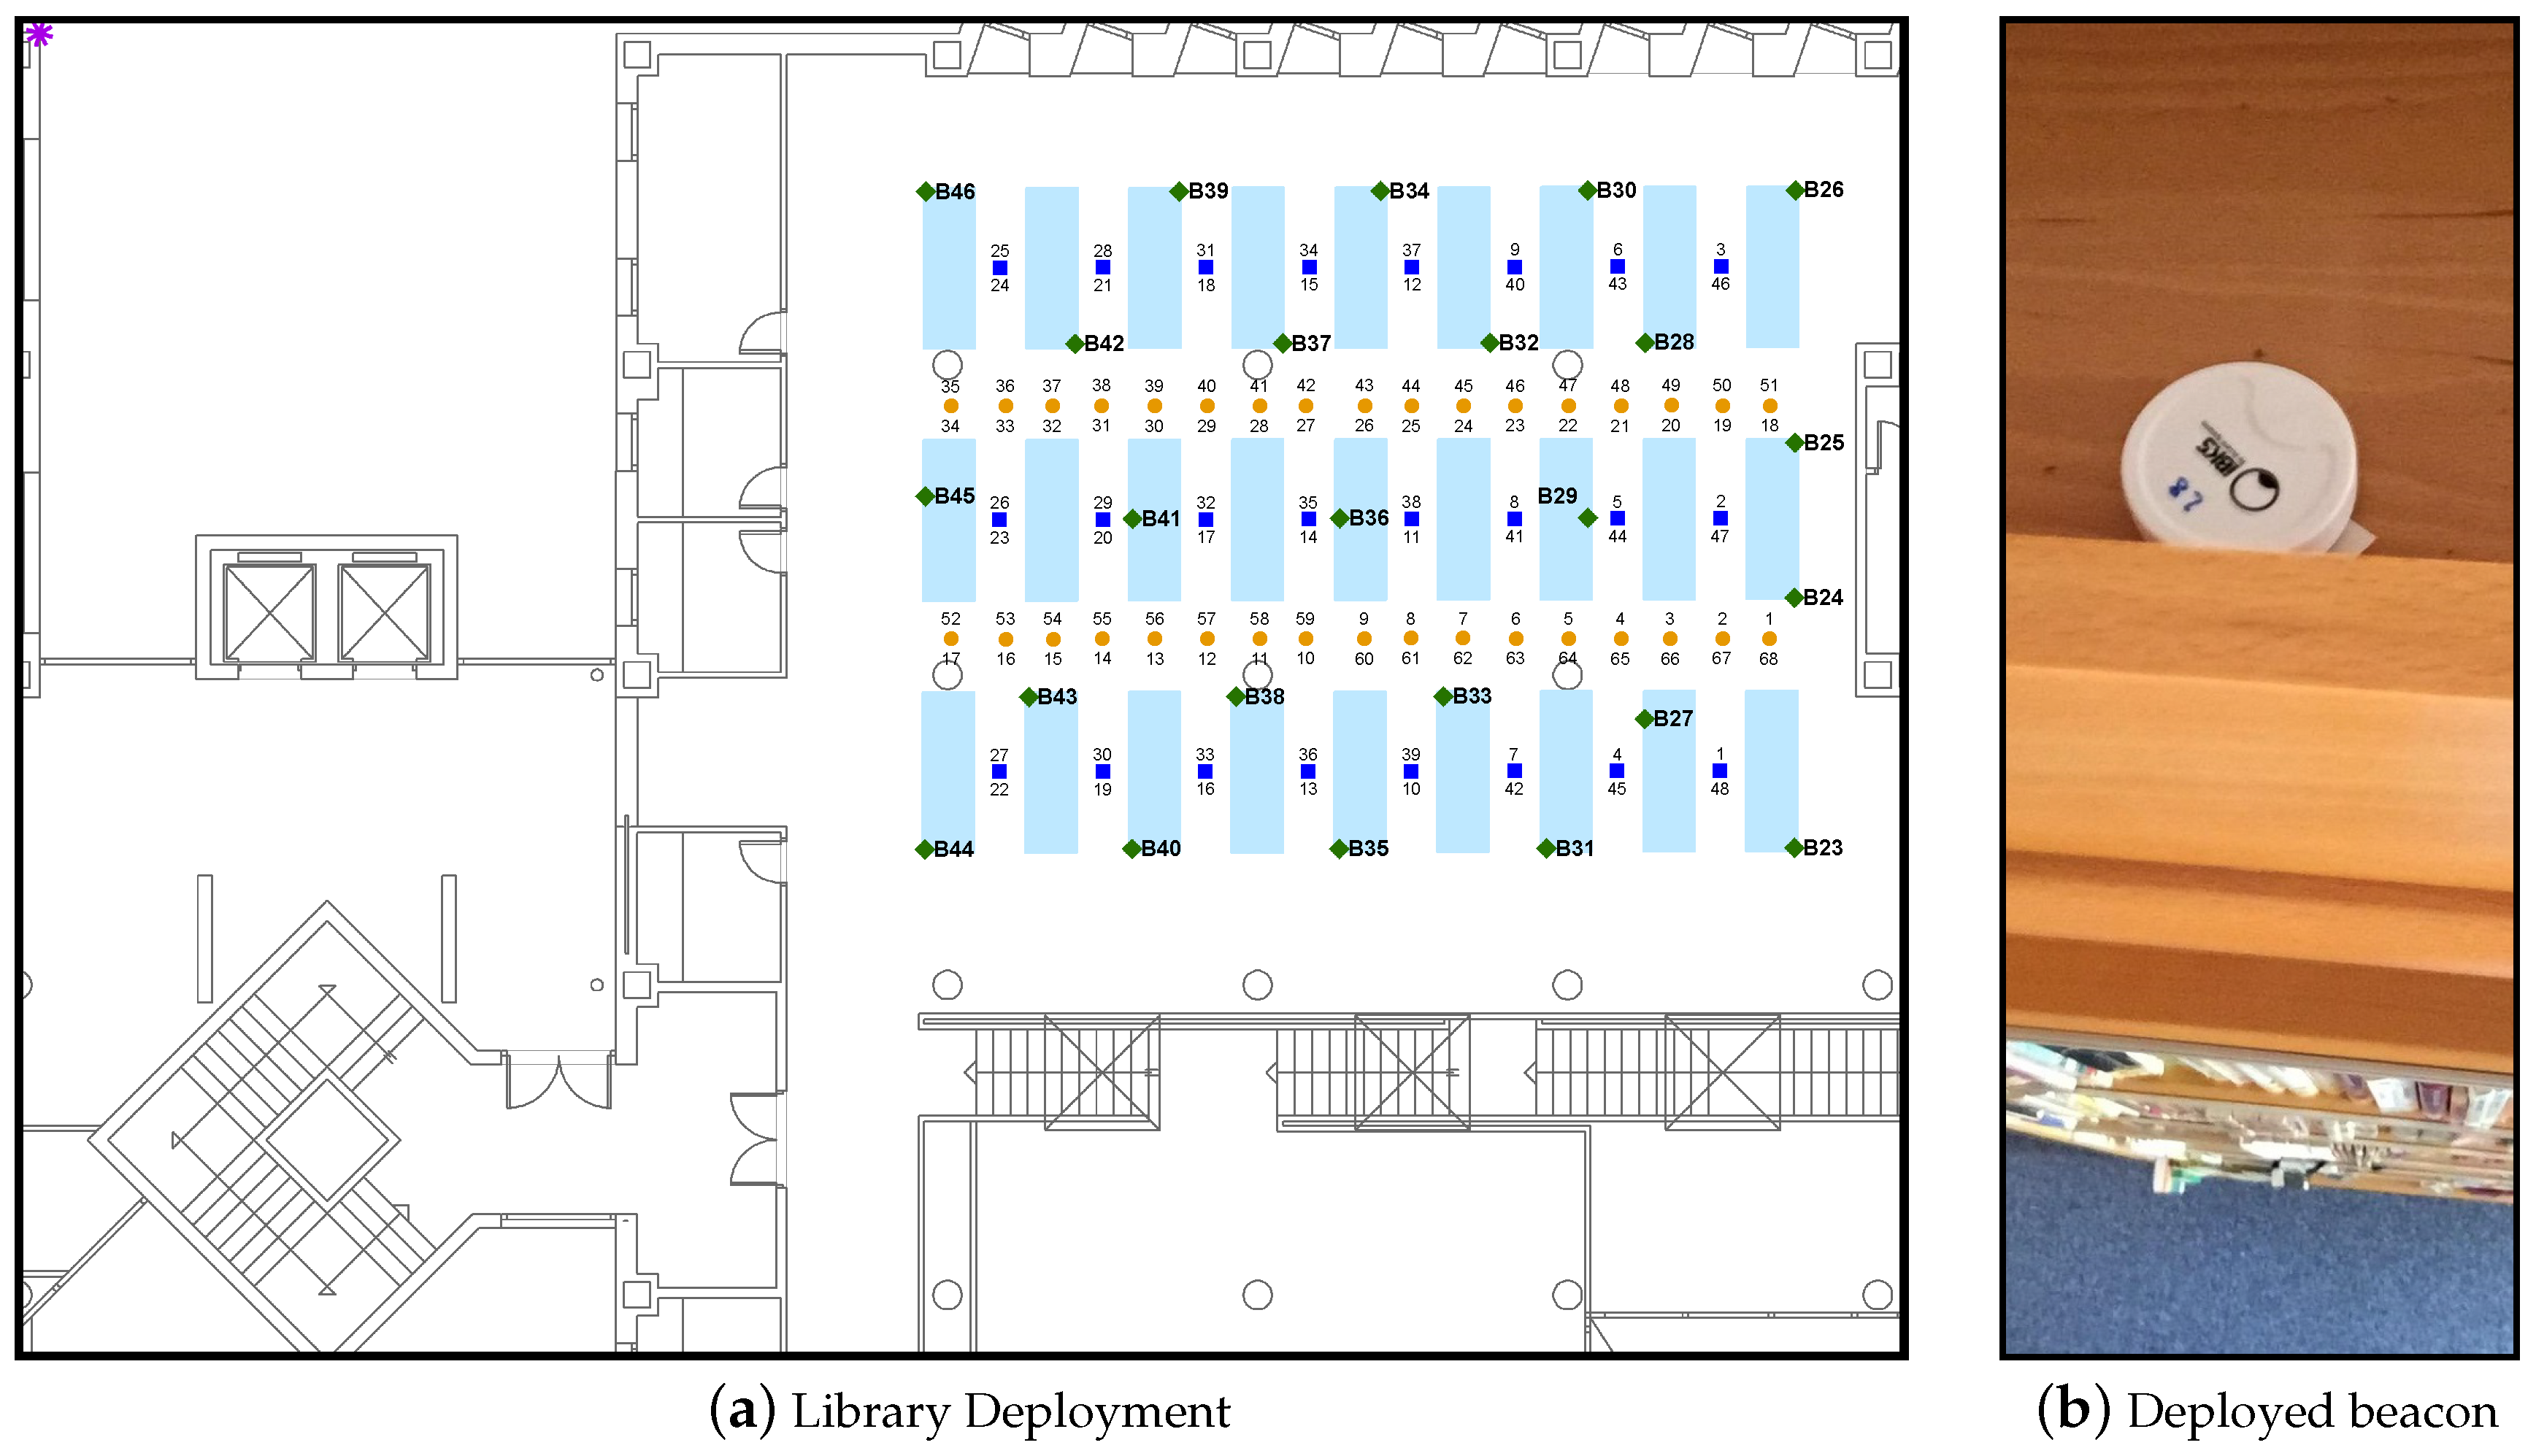
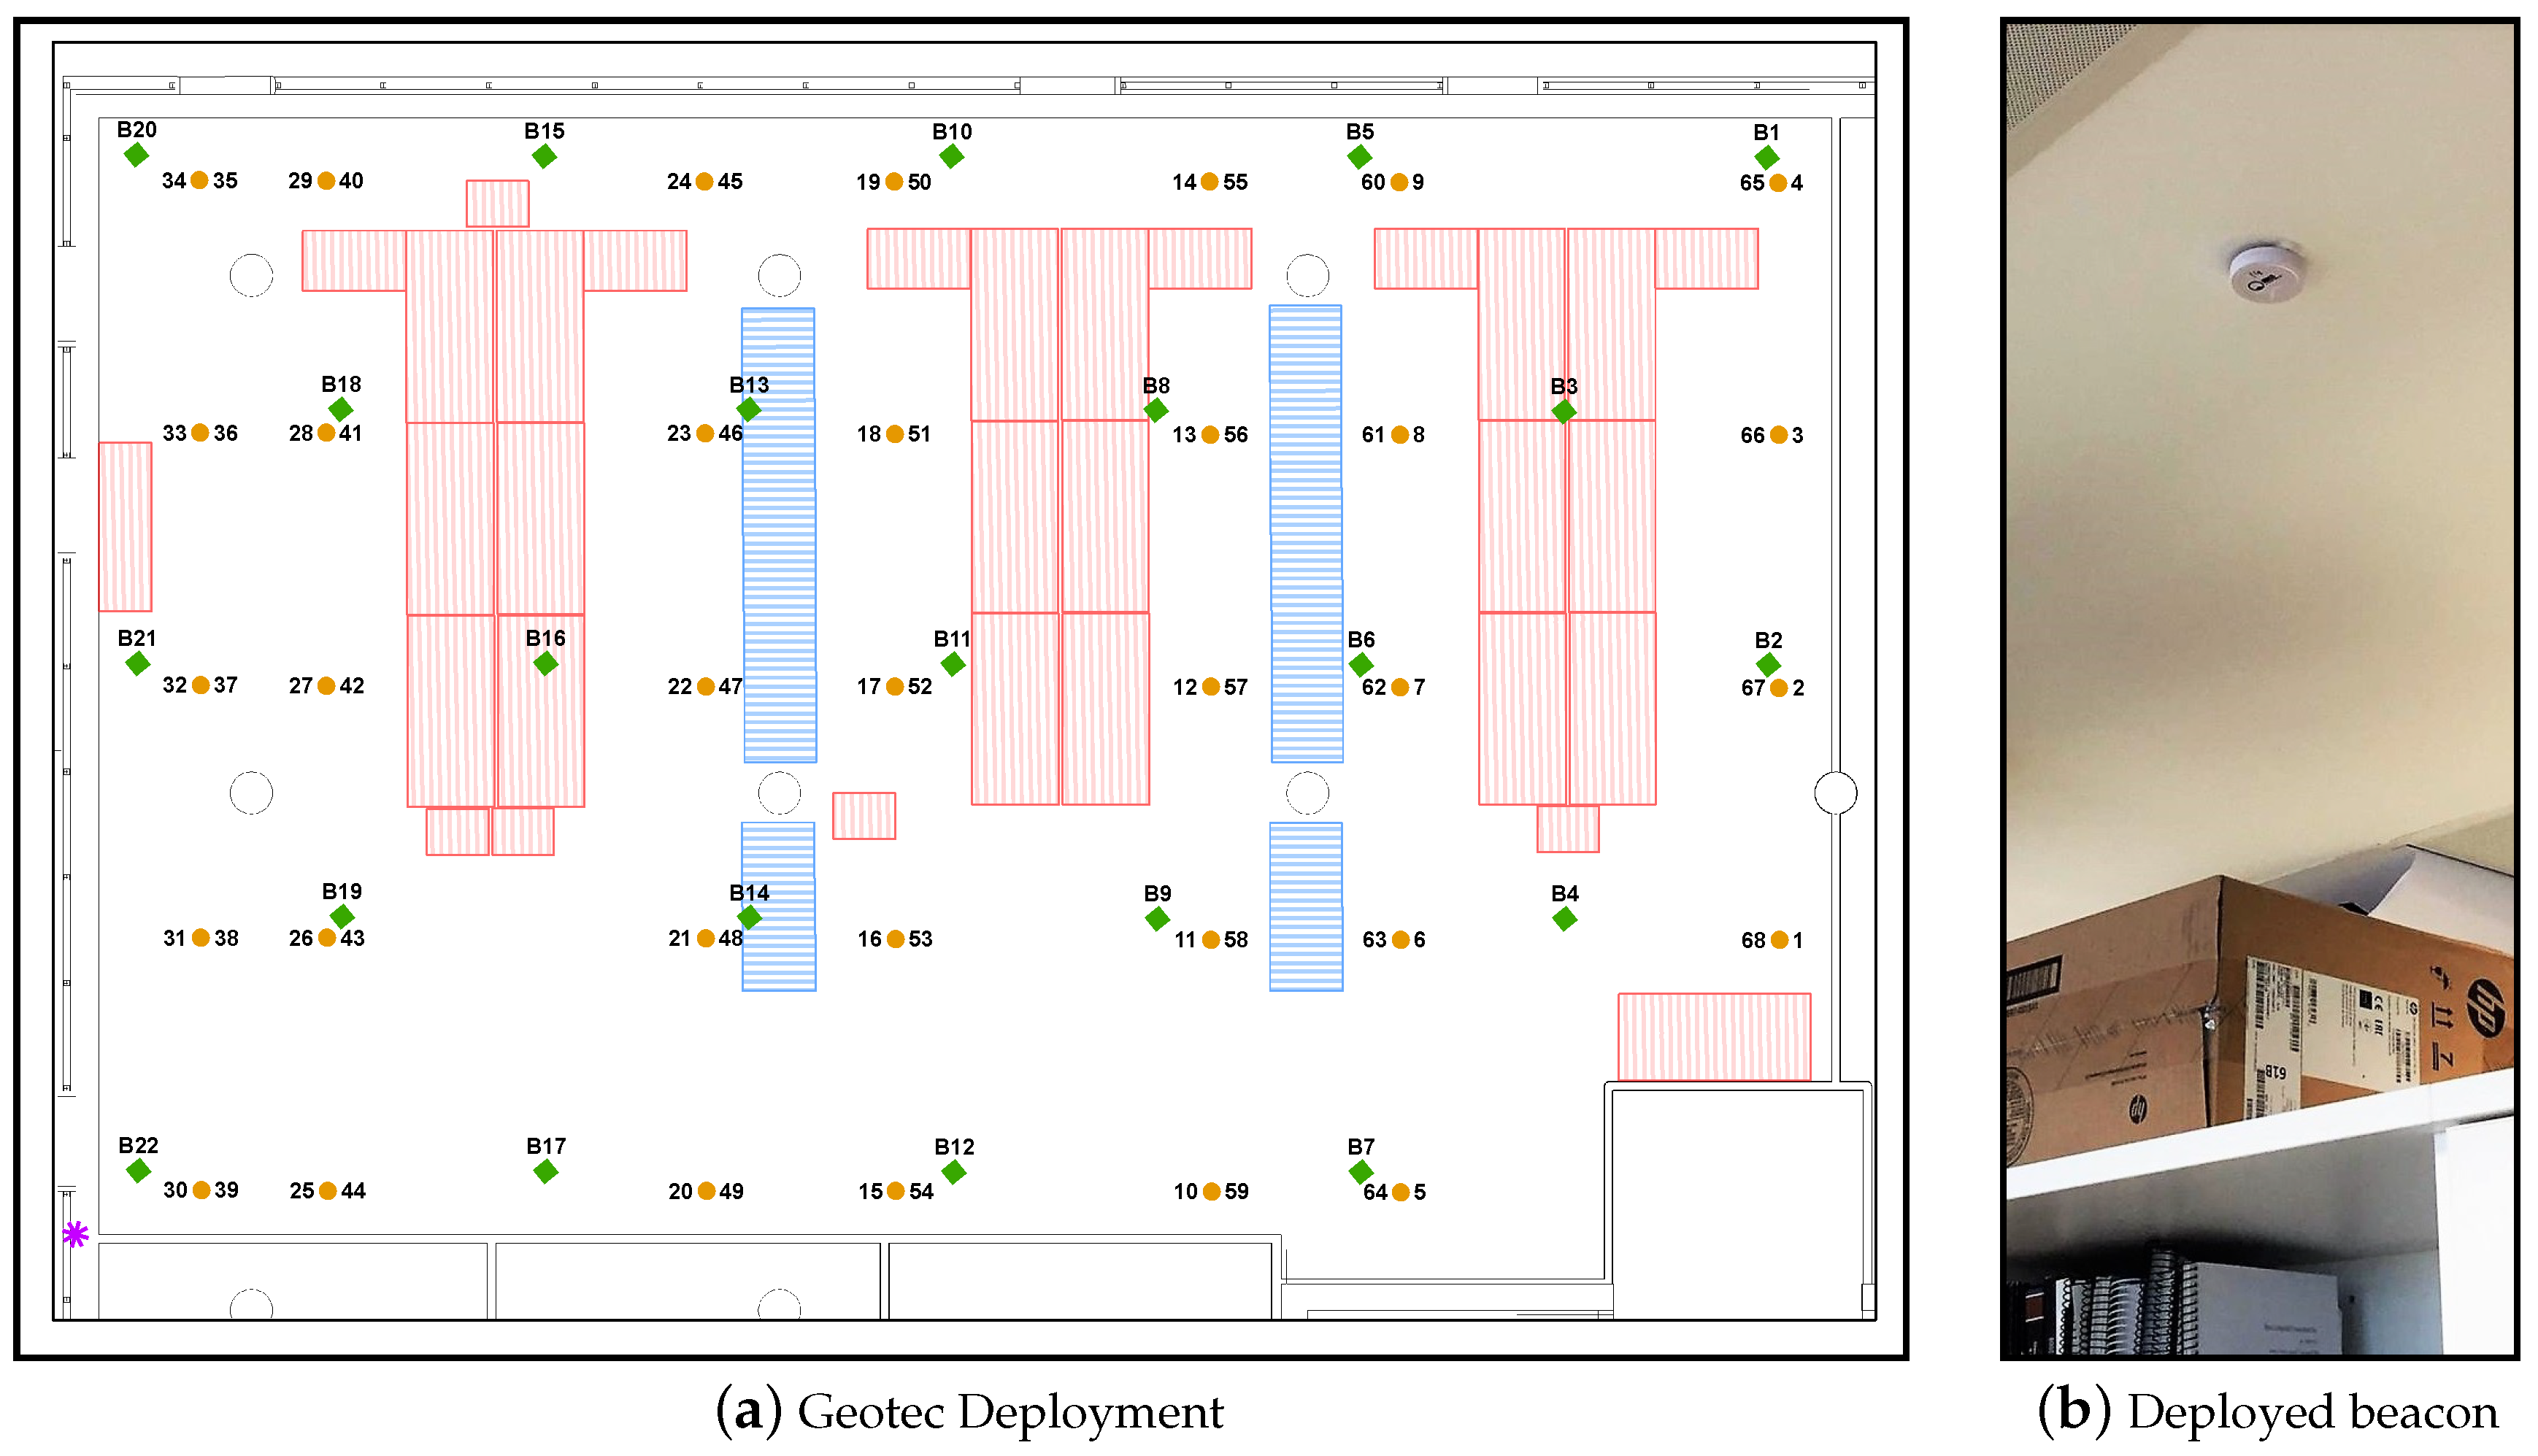
2. Setup and Collection Procedure

The beacons used in this work are off-the-shelf Accent Systems’ IBKS 105 [37] with a Nordic nRF51822 core [38]. Those beacons are capable of concurrent broadcasting iBeaconTM and EddystoneTM advertisements across several emission slots. The deployed beacons were configured to use only one iBeacon slot and an advertising period of 200 ms (5 Hz), which is a setup that provides a battery duration of 8 to 10 months. The collection was organized in campaigns, and performed by trained individuals (hereinafter, the subjects), that stood at predefined positions, holding their smartphones with the right hand in front of their chests in a way that resembled people following directions for an indoor environment.
The radio signals in indoor environments are known to be affected by factors like multi-path, fast fading [39], and in the case of 2.4 GHz frequencies, strong human body absorption, which may account for up to ≈10 dBm [40], being even more notable for devices like smartwatches [41]. In addition, the BLE advertisements are broadcast on three narrow (2 MHz width) advertising channels in quick succession, which made the reported signal instability a higher challenge than in Wi-Fi positioning [11].
The BLE data collection was performed using Android smartphones, due to their abundance and availability. We adapted a previous Wi-Fi RSS collection application [24] to perform campaign-directed BLE RSS collections. Android provides two ways of notifying BLE advertisement detections: anytime an advertisement is received, or when a batch of advertisements is collected. According to our tests, the batch approach leads to fewer advertisement detections, and thus, we decided to use the former approach. Giving that the advertisement collection was not batch-driven, a fingerprint abstraction was created, so that all measurements received in a window of 1s were placed into a fingerprint. If a beacon was detected more than once in a fingerprint window time, only its mean RSS value, (and the first detection time in nanoseconds since device boot), was stored. The smartphones that the subjects used for RSS collection had the previously mentioned application, which helped the subjects (Figure 1) in following a collection campaign and avoiding errors like wrong position tagging. A collection campaign is an ordered list of positions. The subjects had to follow that order and collect a number of consecutive samples (fingerprints) at each point facing a specific direction. The collection orientations, i.e., the facing directions, were those corresponding to the usual walking directions.
The RSS measurement collection was performed in two environments (zones) from the UJI, in Castellón, Spain: an area among bookshelves in the Library building (hereinafter, Library) and an area of the office space of the Geotec Research Group (hereinafter, Geotec). Table 1 presents data describing the collection, the beacon deployment and the environment of each zone. In Table 1, MDMS represents the maximum distance from the position of a collection point to another collection point that is the closest to it in the space. MDMB is described as MDMS, but considering beacon positions instead of collection points positions.
The deployment in the Library (Figure 2a) had the goal of supporting a positioning service for users trying to find a book. The 22 beacons were placed inside the enclosed top of the (wooden) shelves for security concerns (Figure 2b). Therefore, there were no line-of-sight situations to beacons in this environment. The dense deployment was designed so that the area covered by the beacons included all shelves and the deployed beacons were as far apart from each other as possible. The shelves height is 2.35 m, which is almost as high as the altitude of the ceiling (about 2.60 m). The collection was divided into two campaigns, one with the subjects facing the up or down directions and another one with them facing the left or right directions (blue squares and orange circles in Figure 2b, respectively). Each collection campaign was performed three times, each time using a different smartphone and by a different individual. The smartphones were a BQ Aquaris X5 plus, a Samsung Galaxy S6 (SM-G920F) and a Samsung Galaxy A5 2017 (SM-A520F), hereinafter BQ, S6 and A5, respectively.
In the Geotec zone (Figure 3a) there are only four tall furnitures and the beacons were attached to the ceiling tiles (Figure 3b). As a result, every collection point had line-of-sight situations with more than three beacons at the same time, if human-body blockage is not considered. The collection was performed following one campaign (with the subject facing the up or down directions) and one smartphone of the those used for the Library zone. The campaign was performed three times, each time with the beacons configured for a different transmission power.

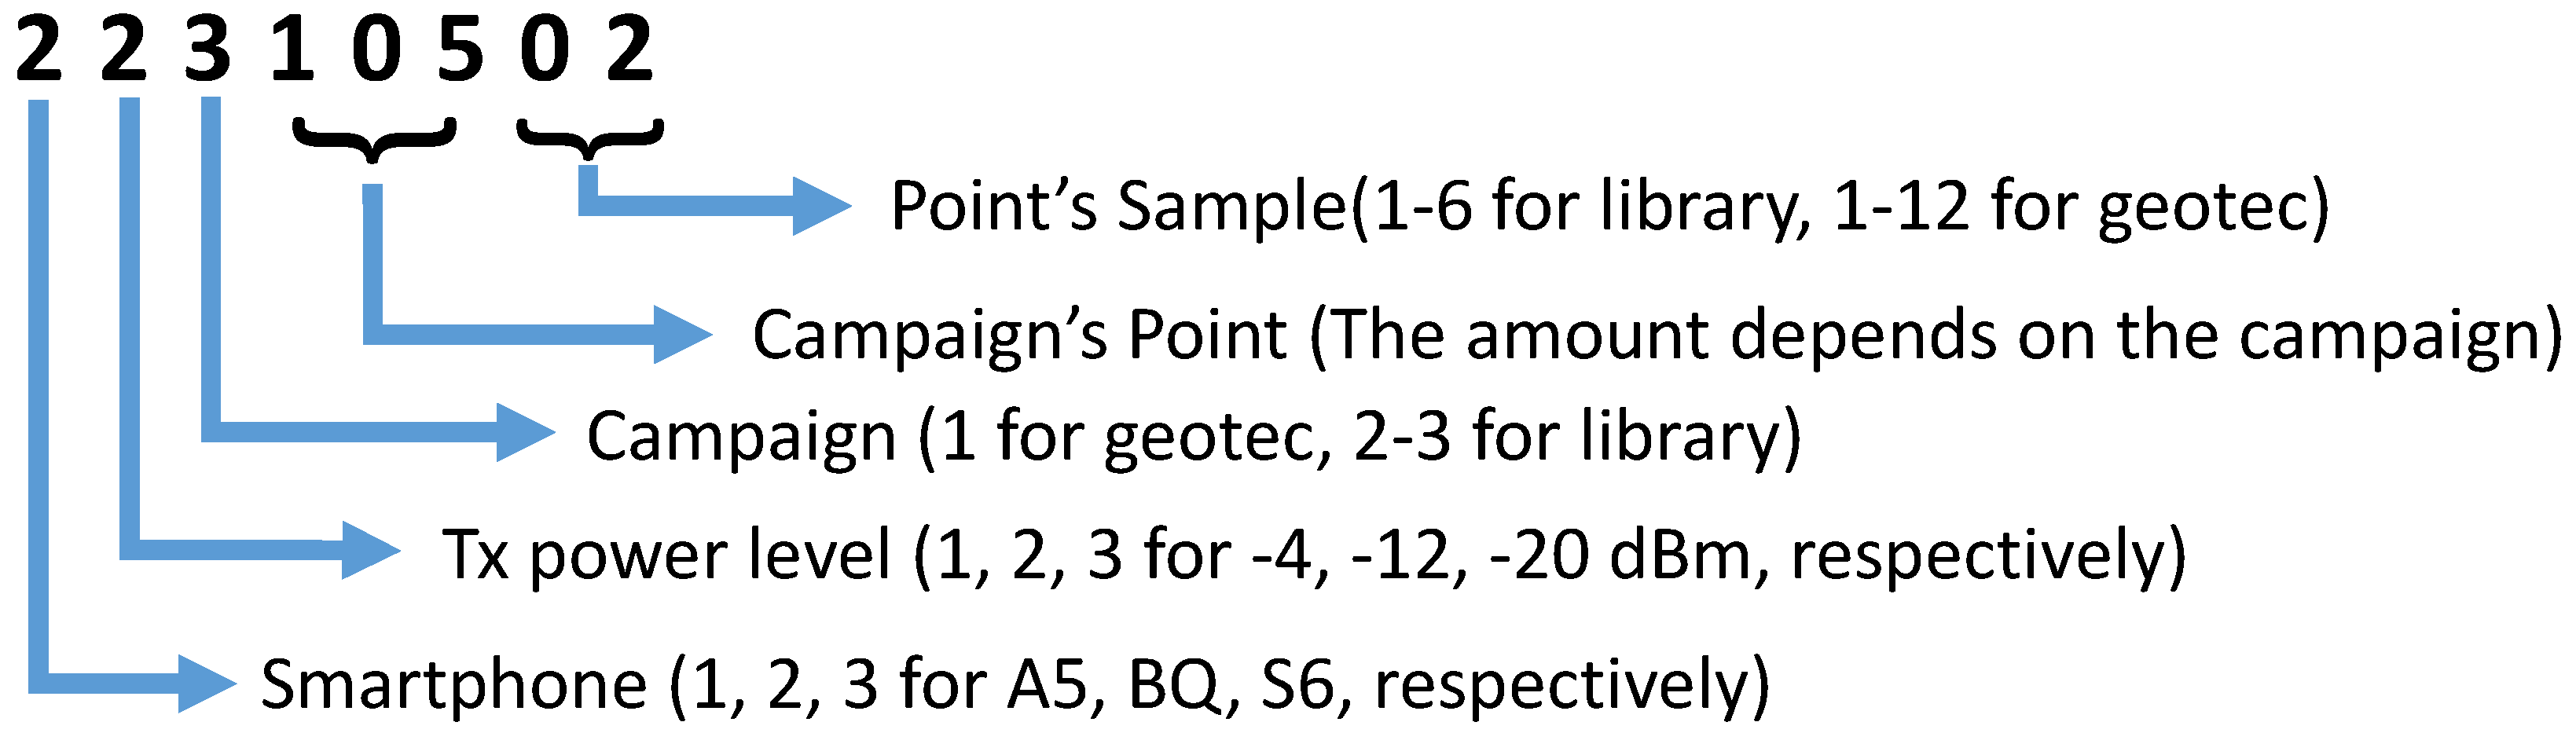
3. The BLE RSS Database

The provided database is openly available at Mendoza-Silva et al. [42]. It contains a dataset for the Library zone ( D l ) and another dataset for the Geotec zone ( D g ). Each dataset is composed of four sets: RSS values, positions, times and identifiers sets. A set of RSS values is defined as:
R ( p · s ) × a = { r i , j } ,
where p is the number of points (unique triplets of the 2D coordinates and the direction the subject was facing), s is the number of samples per unique triplet collected in the zone, a is the number of beacons deployed in the zone, and r i , j is the BLE RSS value measured in dBm (or a non-detection value of 100) for the j-th beacon (column) at the i-th fingerprint (row). The operation ( p · s ) represent the product between two real numbers. Remember from Section 2 that a fingerprint is composed by the RSS values associated to beacon advertisements detected in a 1-s time window. A set of times is defined as:
T ( p · s ) × a = { t i , j } ,
where t i , j is the timestamp when a j-th beacon RSS value was measured (or a non-detection value of 0) during the time period corresponding to the i-th fingerprint. The timestamp is relative to the device boot and it represents the number of nanoseconds elapsed until the advertisement was detected. A set of positions is defined as:
L ( p · s ) × 2 = { ( x i , y i ) } ,
where x i , y i are the (x,y) local coordinates where the i-th fingerprint was collected. The local coordinates were designed taken a given position in the target zone as the coordinates origin (represented by magenta asterisks in Figure 2a and Figure 3a) and assuring that 1 unit of distance represents 1 m of actual distance in the zone. A set of identifiers is defined as:
I D ( p · s ) × 1 = { i d i } ,
where i d i is a number that uniquely identifies the i-th fingerprint in the whole database. The number format contains information that allows determining membership information of the fingerprint, as shown in the example of Figure 4. The membership information is harnessed by the supporting scripts provided along with the database for fingerprint selection.
The files in the database are organized in three folders: the RSS measurements and their labels (“rss”), the BLE beacon deployment positions (“dep”), and the geometries of obstacles (shelves and pillars) found inside the collection area (“obs”). The name of every file includes an indication of the zone its information refers to: “lib” for the Library zone and and “geo” for the Geotec zone. The RSS values, positions, times and identifiers sets of a zone are each stored in a file whose name includes “rss”, “crd”, “tms”, or “ids”, respectively. The i-th row of each of them holds the respective information of the i-th fingerprint collection in the zone.

4. Usage Examples

The RSS measurements, their labels, the beacon deployment and the environment description are the most significant value of the provided material. However, the Matlab® scripts shipped with the data are also relevant, as they not only provide examples on the data usage, but also can be considered an introduction to problems that Indoor Positioning Systems implementers face for BLE-based positioning. The examples presented in the following subsections explore the effects of the measurement device, the environment and the beacon deployment on the detection and strength of the BLE advertisements, and therefore on the positioning accuracy. These examples, although they show issues for which solutions are already proposed [3,11,20], are starting points for further refinements to improve the BLE-based positioning techniques.

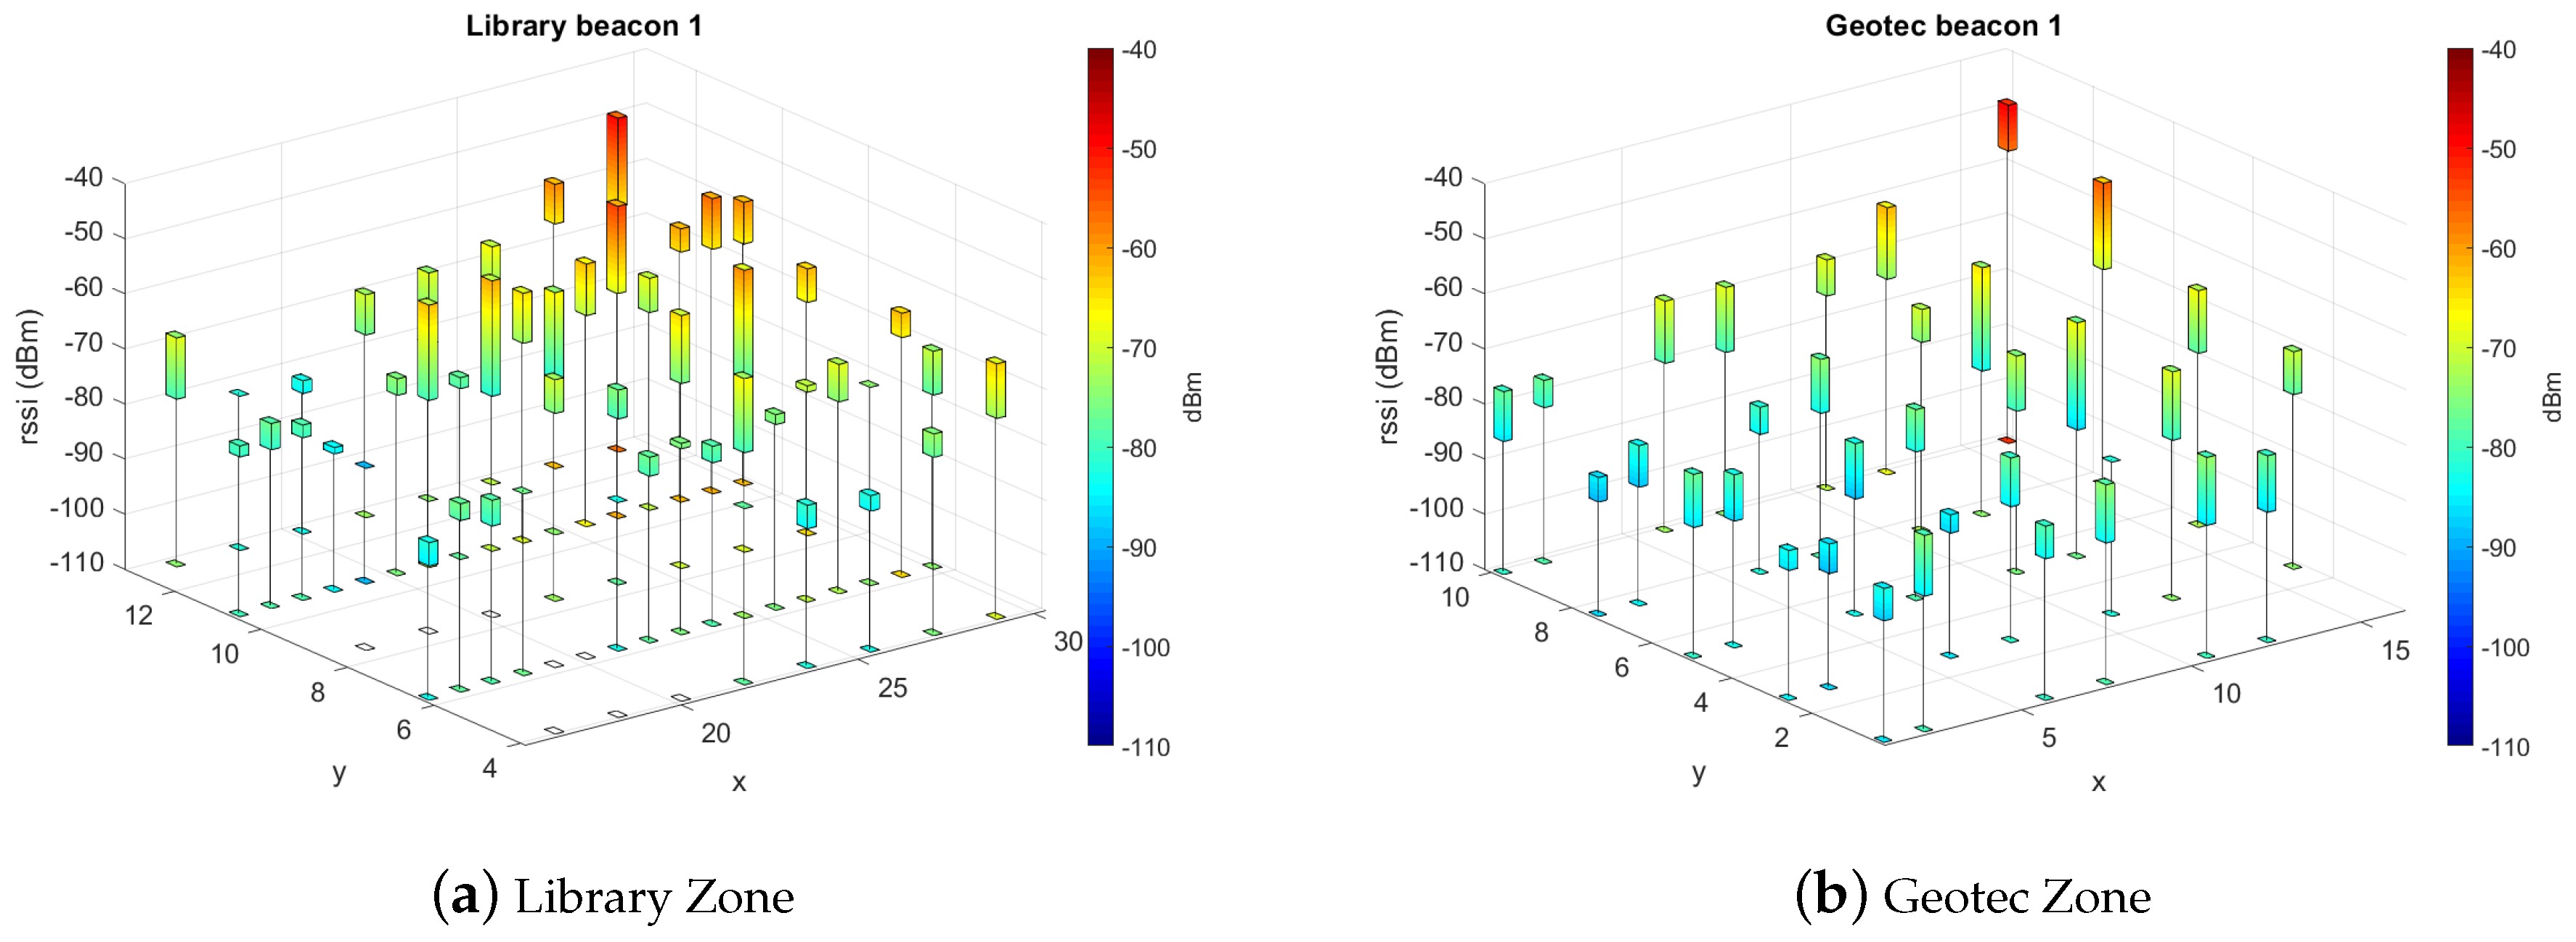
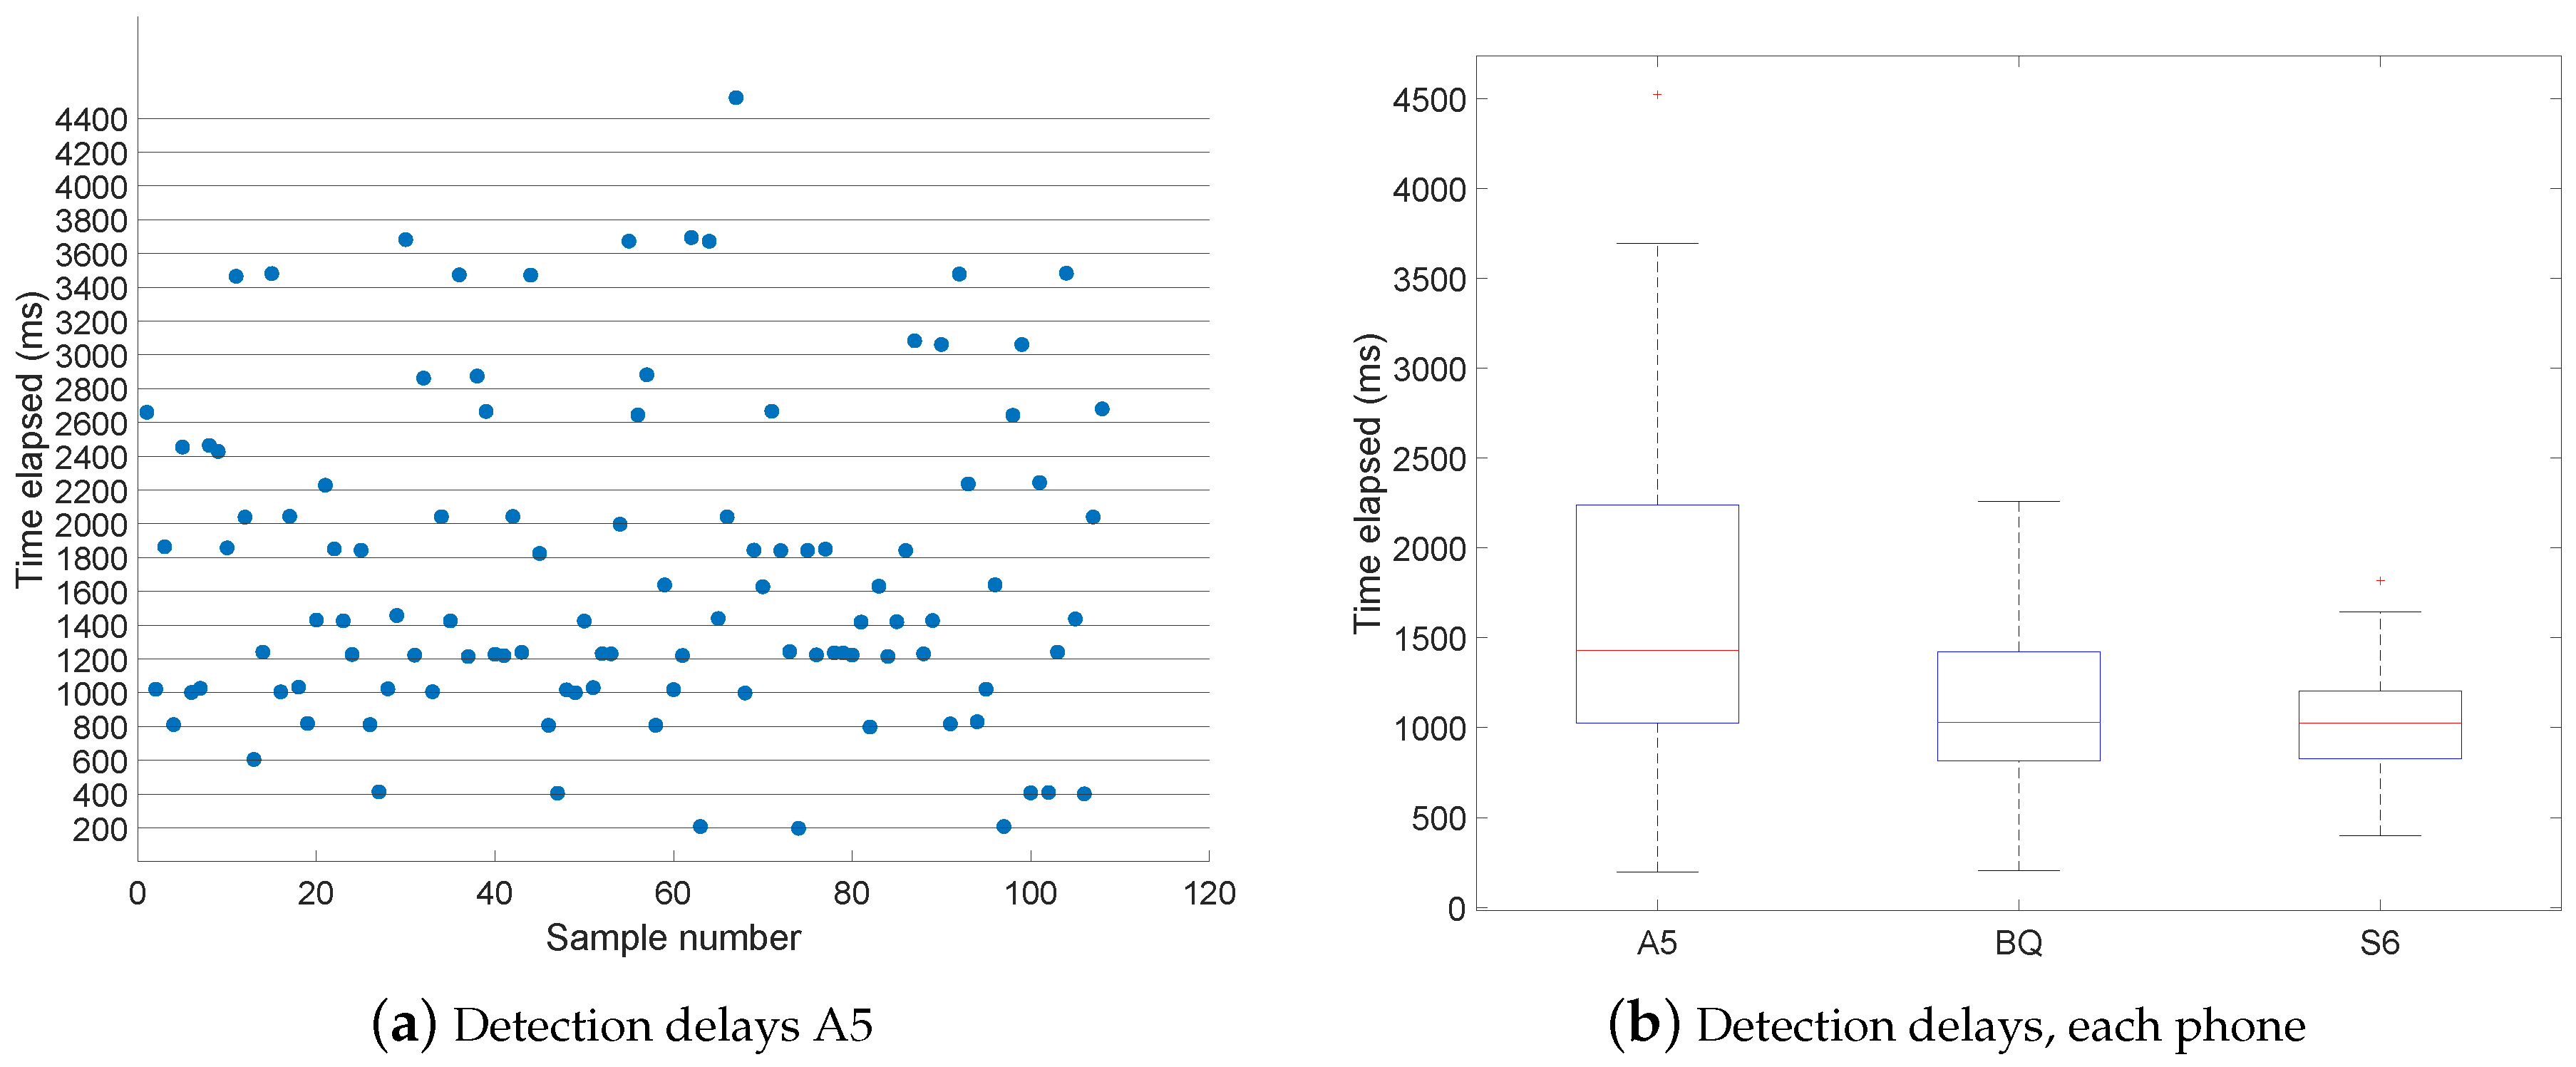
4.1. Environment and Device: Signal Intensities and Advertisements Loss

The environment influence relates not only to the presence or absence of line-of-sight between beacons and a smartphone. As presented in Figure 5, the drop in signal strength as the distance to a beacon increases is more significant in the Library zone than in Geotec as a result of a dense bookshelf placement. In the Geotec zone there are only four tall shelves and the height of other furniture pieces is below the altitude at which a person usually holds a smartphone, thus, the shelves do not significantly influence the reported beacon RSS.
Table 2 shows how, apart from the transmission power, the range (or detectability) of the beacons depends on the measurement smartphone and the deployment environment. The first row indicates the maximum detected value for a beacon at any collection point. For the Library zone, the signals strengths reported by the S6 smartphone were weaker than those reported by the A5 smartphone. The A5 smartphone was able to detect stronger signals in the Library than in Geotec. Despite the non-existence of line-of-sight situations in the Library, the minimum distance (3D) between collection points and beacons is smaller than in Geotec. The second row (MDP70) displays the maximum distance at which a beacon was spotted with a signal strength over −70 dBm. The distances are consistent with the maximum reported RSS. The third row (MDHT) presents the maximum distance at which a beacon was consistently detected (in more than half of fingerprints) at a collection point. The S6 smartphone was notably better at detecting beacon advertisements, despite it registered weaker values of RSS.
BLE beacons can be usually configured to send advertisements at given time intervals. It is however known that the times between two consecutive detections, as reported by a smartphone, are usually higher than the interval setting configured in the beacons [11,20]. It is not only that advertisements are lost if the receptor is beyond the beacon range, or that some (tiny) extra processing time is added, but that some smartphones are unable to properly detect all advertisements. Figure 6a shows the detection delays as registered by the smartphone A5 for beacon 1 in the Library zone. All beacons were configured to advertise every 200 ms, but the number of two consecutive advertisements detected with a time difference of about 200 ms is very low. Figure 6b shows that the smartphone A5 has a low detection capability when compared to the BQ and S6 smartphones.
It is also known that for the 2.4 GHz networks, closer distances to an emitter correlate to higher variance in reported RSS. It has also been stated that closer distances to a beacon correlate to a lower detection delays [41]. Table 3 shows the results of exploring the presence of the latter correlation for the A5 smartphone. The correlation was individually tested for each beacon, and Table 3 only presents the ρ and p-value for the beacon with the most interesting values. The results are not conclusive, but they hint that the distance to a beacon is not a relevant factor for advertisement detection delays. Also, given that consecutive measurements in a point have the same collection direction, orientation is likely to have only a small influence on detection delays for our settings and analyses.

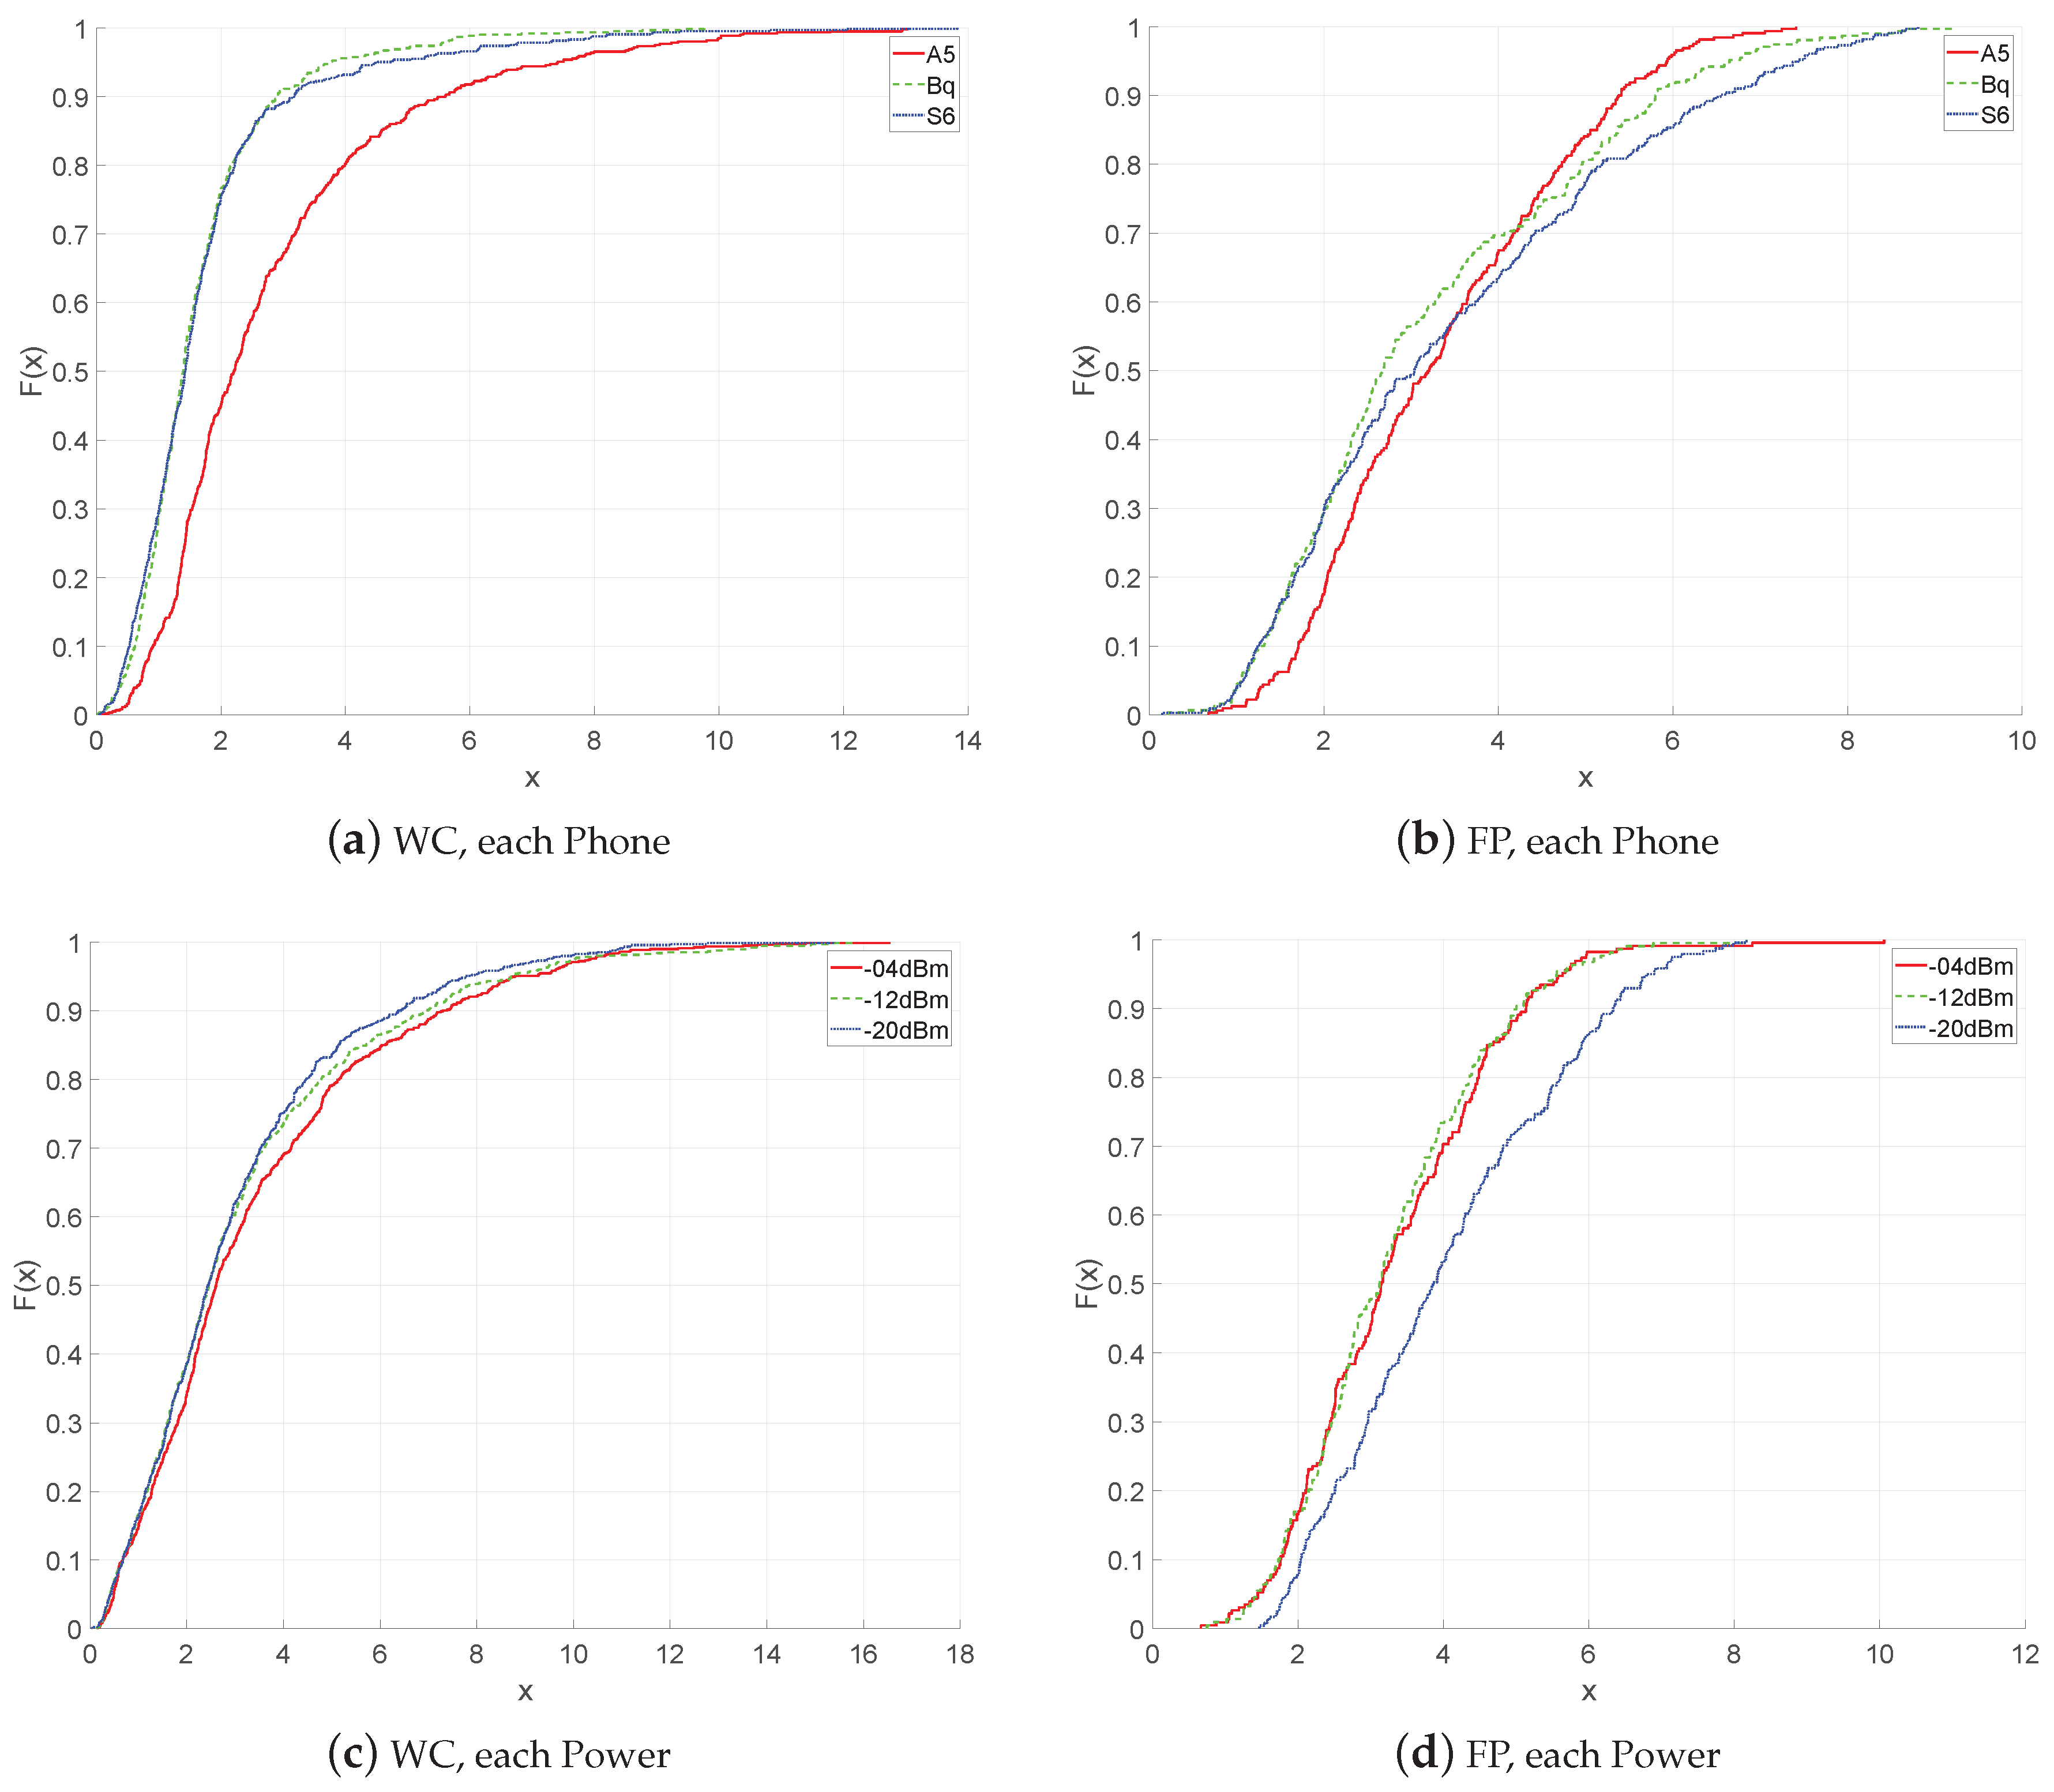
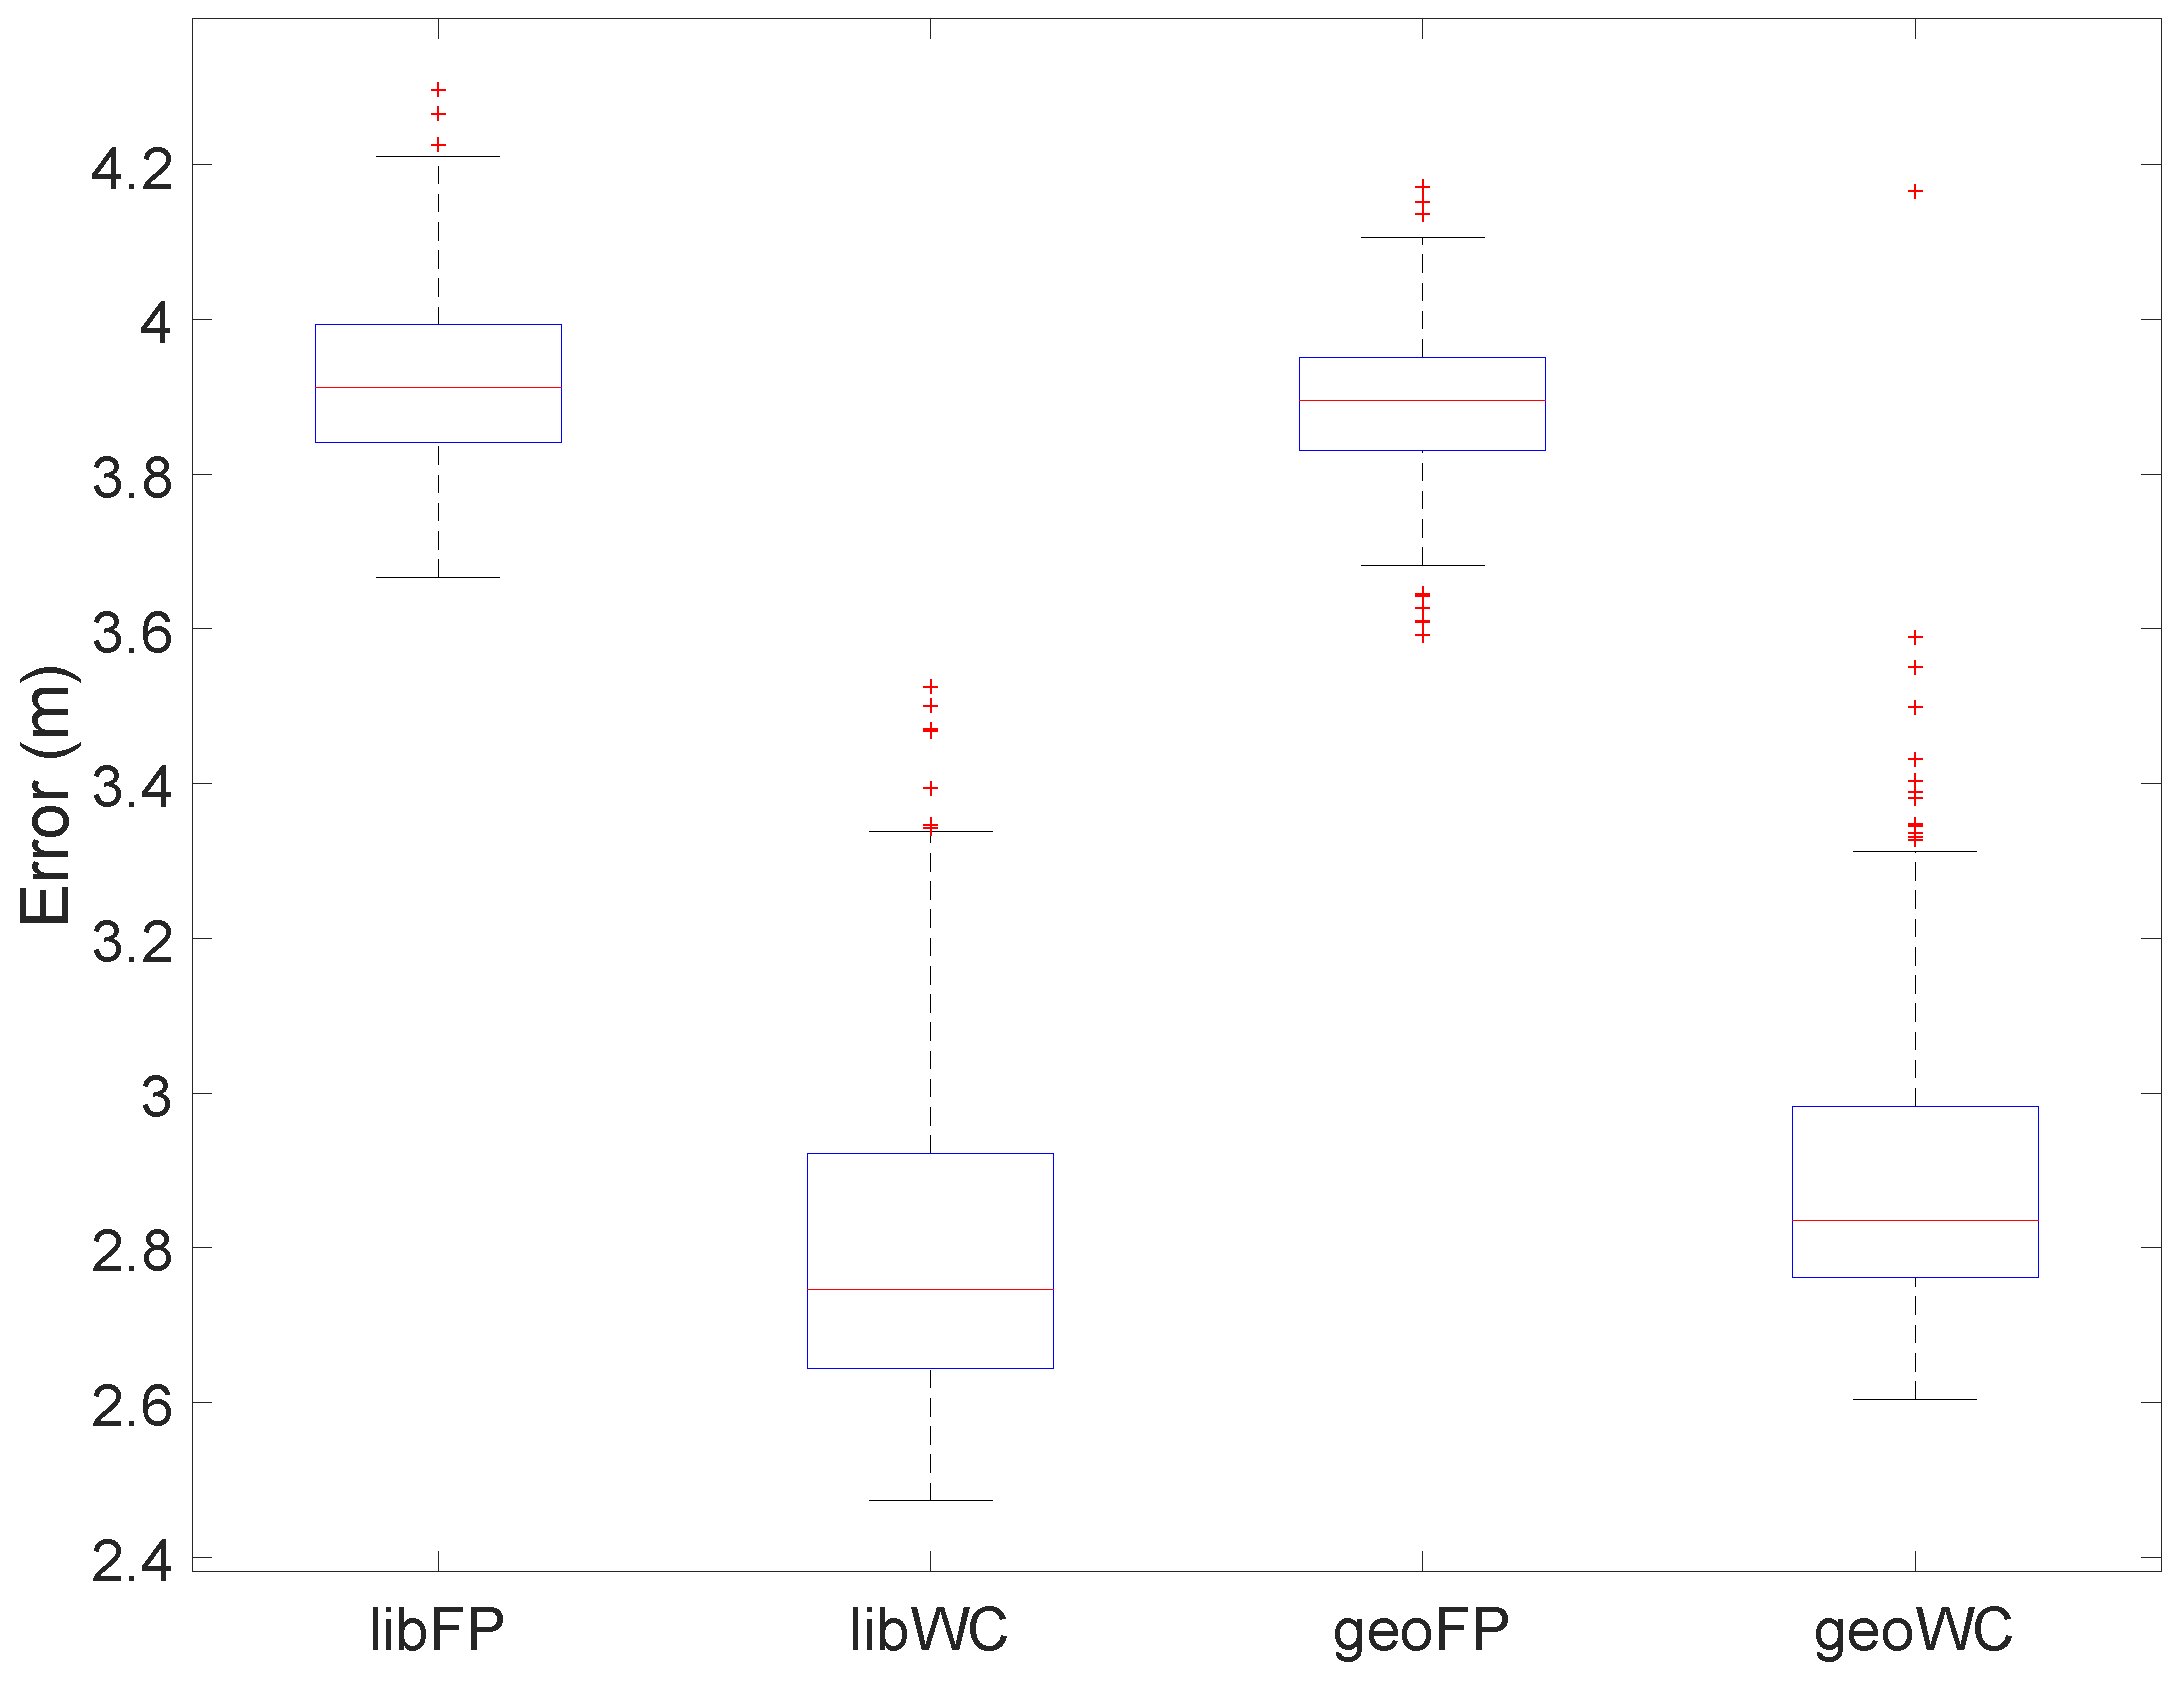
4.2. Positioning Accuracy

BLE RSS-based positioning methods are commonly affected by factors like the environment, beacon configuration, beacon deployment, and the receiving smartphone. Some of the methods found in literature address one or several of those factors [43]. To explore those factors in this work, two simple methods were tested: the weighted centroid method (applicable and used in BLE-based positioning because the beacon deployment positions are known) and the k-Nearest Neighbors (kNN) method commonly used in fingerprinting for indoor positioning.
The weighted centroid method, hereinafter WC, has been used in several studies of BLE-based positioning, although with other names [11,44]. The WC method estimates a 2D position for a BLE (operational) fingerprint by averaging the positions of the 1 k n beacons detected with the highest RSS values in the fingerprint, being n the number of beacons deployed in the target area. The kNN method [45], hereinafter FP, has been widely used in RSS-based indoor positioning. It assumes the existence of a previously collected database of labeled training fingerprints. The method finds the k fingerprints in the training database that are the closest ones to the (operational) fingerprint. The 2D position estimation is then computed as the centroid of the position labels of the selected k fingerprints. Given that the data in database described in this paper was not collected separately for training and estimation purposes, the scrips shipped with the data provides several suggestions for training-test data partitioning. It is advised to follow those suggestions, because the common way of selecting a percentage of the total data may not be practical given that every collection point has several (even 13) fingerprints that are similar between them.
The accuracy of a RSS-based positioning method is computed in terms of the positioning error, i.e., the difference between the estimated position and the actual position where a fingerprint was taken. In this work, that difference is the 2D Euclidean distance. The accuracy metric mainly used for this work is the 75 percentile of the positioning error, which has been adopted as a comparison metric in recent research works and competitions [46], although the comparison of empirical cumulative distribution function plots is also used.
The BLE RSS data from the Library zone allows positioning error analyses for different phones (Figure 7a,b), and the data from the Geotec zone allows positioning error analyses for different beacon transmission powers (Figure 7c,d).
For the WC positioning method, the usage of data from A5 leads to more noticeable errors than when data from BQ and S6 are used. However, when the FP method is used, the positioning errors are similar among the three phones. In general, the phone that provides the most suitable BLE measurements for positioning is the BQ. Regarding the comparison of different transmission powers, the usage of data captured with the −20 dBm power setting leads to a better accuracy for the WC method, and to a notably worse accuracy for the FP method, than when the data of other two powers are used. There is no notable accuracy difference between the results using data for powers −12 dBm and −4 dBm. Across the explored power configurations and collection smartphones, the WC method has larger maximum positioning errors than the FP method, but for percentiles below 75, the WC method provides lower positioning errors. The used smartphone may have an important impact on the positioning accuracy, and very weak transmission powers should be avoided. The positioning accuracy for fingerprinting is low, even below that reported in a previous study for Wi-Fi in the same environment [24]. However, it should be noticed that BLE is more affected by fast fading than Wi-Fi (its known solution is addressed later) and that the test locations for Mendoza-Silva et al. [24] included locations closer to the training locations than those from the BLE data described in this paper.
In the two positioning methods, WC and FP, a parameter k should be set up before testing the method goodness for positioning. For WC, the k parameter represents the number of the most strongly detected beacons whose positions are considered in the operational fingerprint. For FP, it is the number of most similar training fingerprints whose positions are considered. We tested the impact of the value of k on the accuracy of the WC method for the Library zone, but the difference among several k values was negligible as long as the value was above 3. Therefore, and considering the detection delays issue explored in the previous section, three configurations were tested:
  • All: all beacons detected in a fingerprint are used. All estimations are used to compute the accuracy metric.
  • K10: k = 10, (10 was the k value providing the best accuracy). Take notice that the number of beacons detected in a fingerprint can be lower than 10. All estimations are used to compute the accuracy metric.
  • KF10: k = 10. Estimations for samples with less than 10 detected beacons are considered unfeasible and thus, not used to compute the accuracy metric.
Table 4 shows the results of applying the previous three configurations on the positioning accuracy. Setting a k value has no significant influence on the WC’s accuracy for this environment. Notice that in the Library zone there was no beacon whose detection range was larger than the others because of the the environment’s layout. As presented in the result for configuration KF10, the accuracy for samples with 10 or more detected beacons are better than the rest of samples. The positioning method could be adapted so that it does not provide estimations for the latter samples, or so that it associates to a position estimation a certainty indicator based on the number of beacons detected for a sample.
For the FP method (using k = 72), the number of detected beacons is relevant for both the fingerprints that are collected for training and for the operational (test) fingerprints. Table 5 presents how the accuracy in FP correlates with the number of coincident beacons that were detected in both the operational and training fingerprints. Notice how the number of coincident beacons is low (or very low for the case of A5) and the accuracy is lower than the one obtained with WC. The results of the Pearson correlation test between the positioning error and the number of coincident beacons for each test sample are presented in the last two rows of Table 5. The correlation is large and significant for the BQ and S6 smartphones, and large but not significant for the A5 smartphone. This correlation may explain why the accuracy for FP is lower than for WC, and that a solution for detection delays should be applied to both training and operational fingerprints.
There is a known solution to the detection delays: create measurement windows [11]. As explained in Section 2, the fingerprint abstraction provided in the database is the result of grouping the measurements collected during a time window. However, that time window is small and all previously seen records are discarded. Table 6 present the result of applying a fixed-size moving window over the fingerprints that belong to the same collection point (recalling, unique 2D position and subject facing direction triplet). If a beacon is detected more than once in the fingerprints of a window, the resulting RSS value for that beacon is computed either as the mean value of all the beacon’s RSS in the fingerprints inside the window, or as the last detected value. In the results of Table 6, the larger the window size, the better the accuracy, which may be a result of the static collection procedure followed for our database. Also, in some cases, the accuracy difference between the FP and WC is reduced.

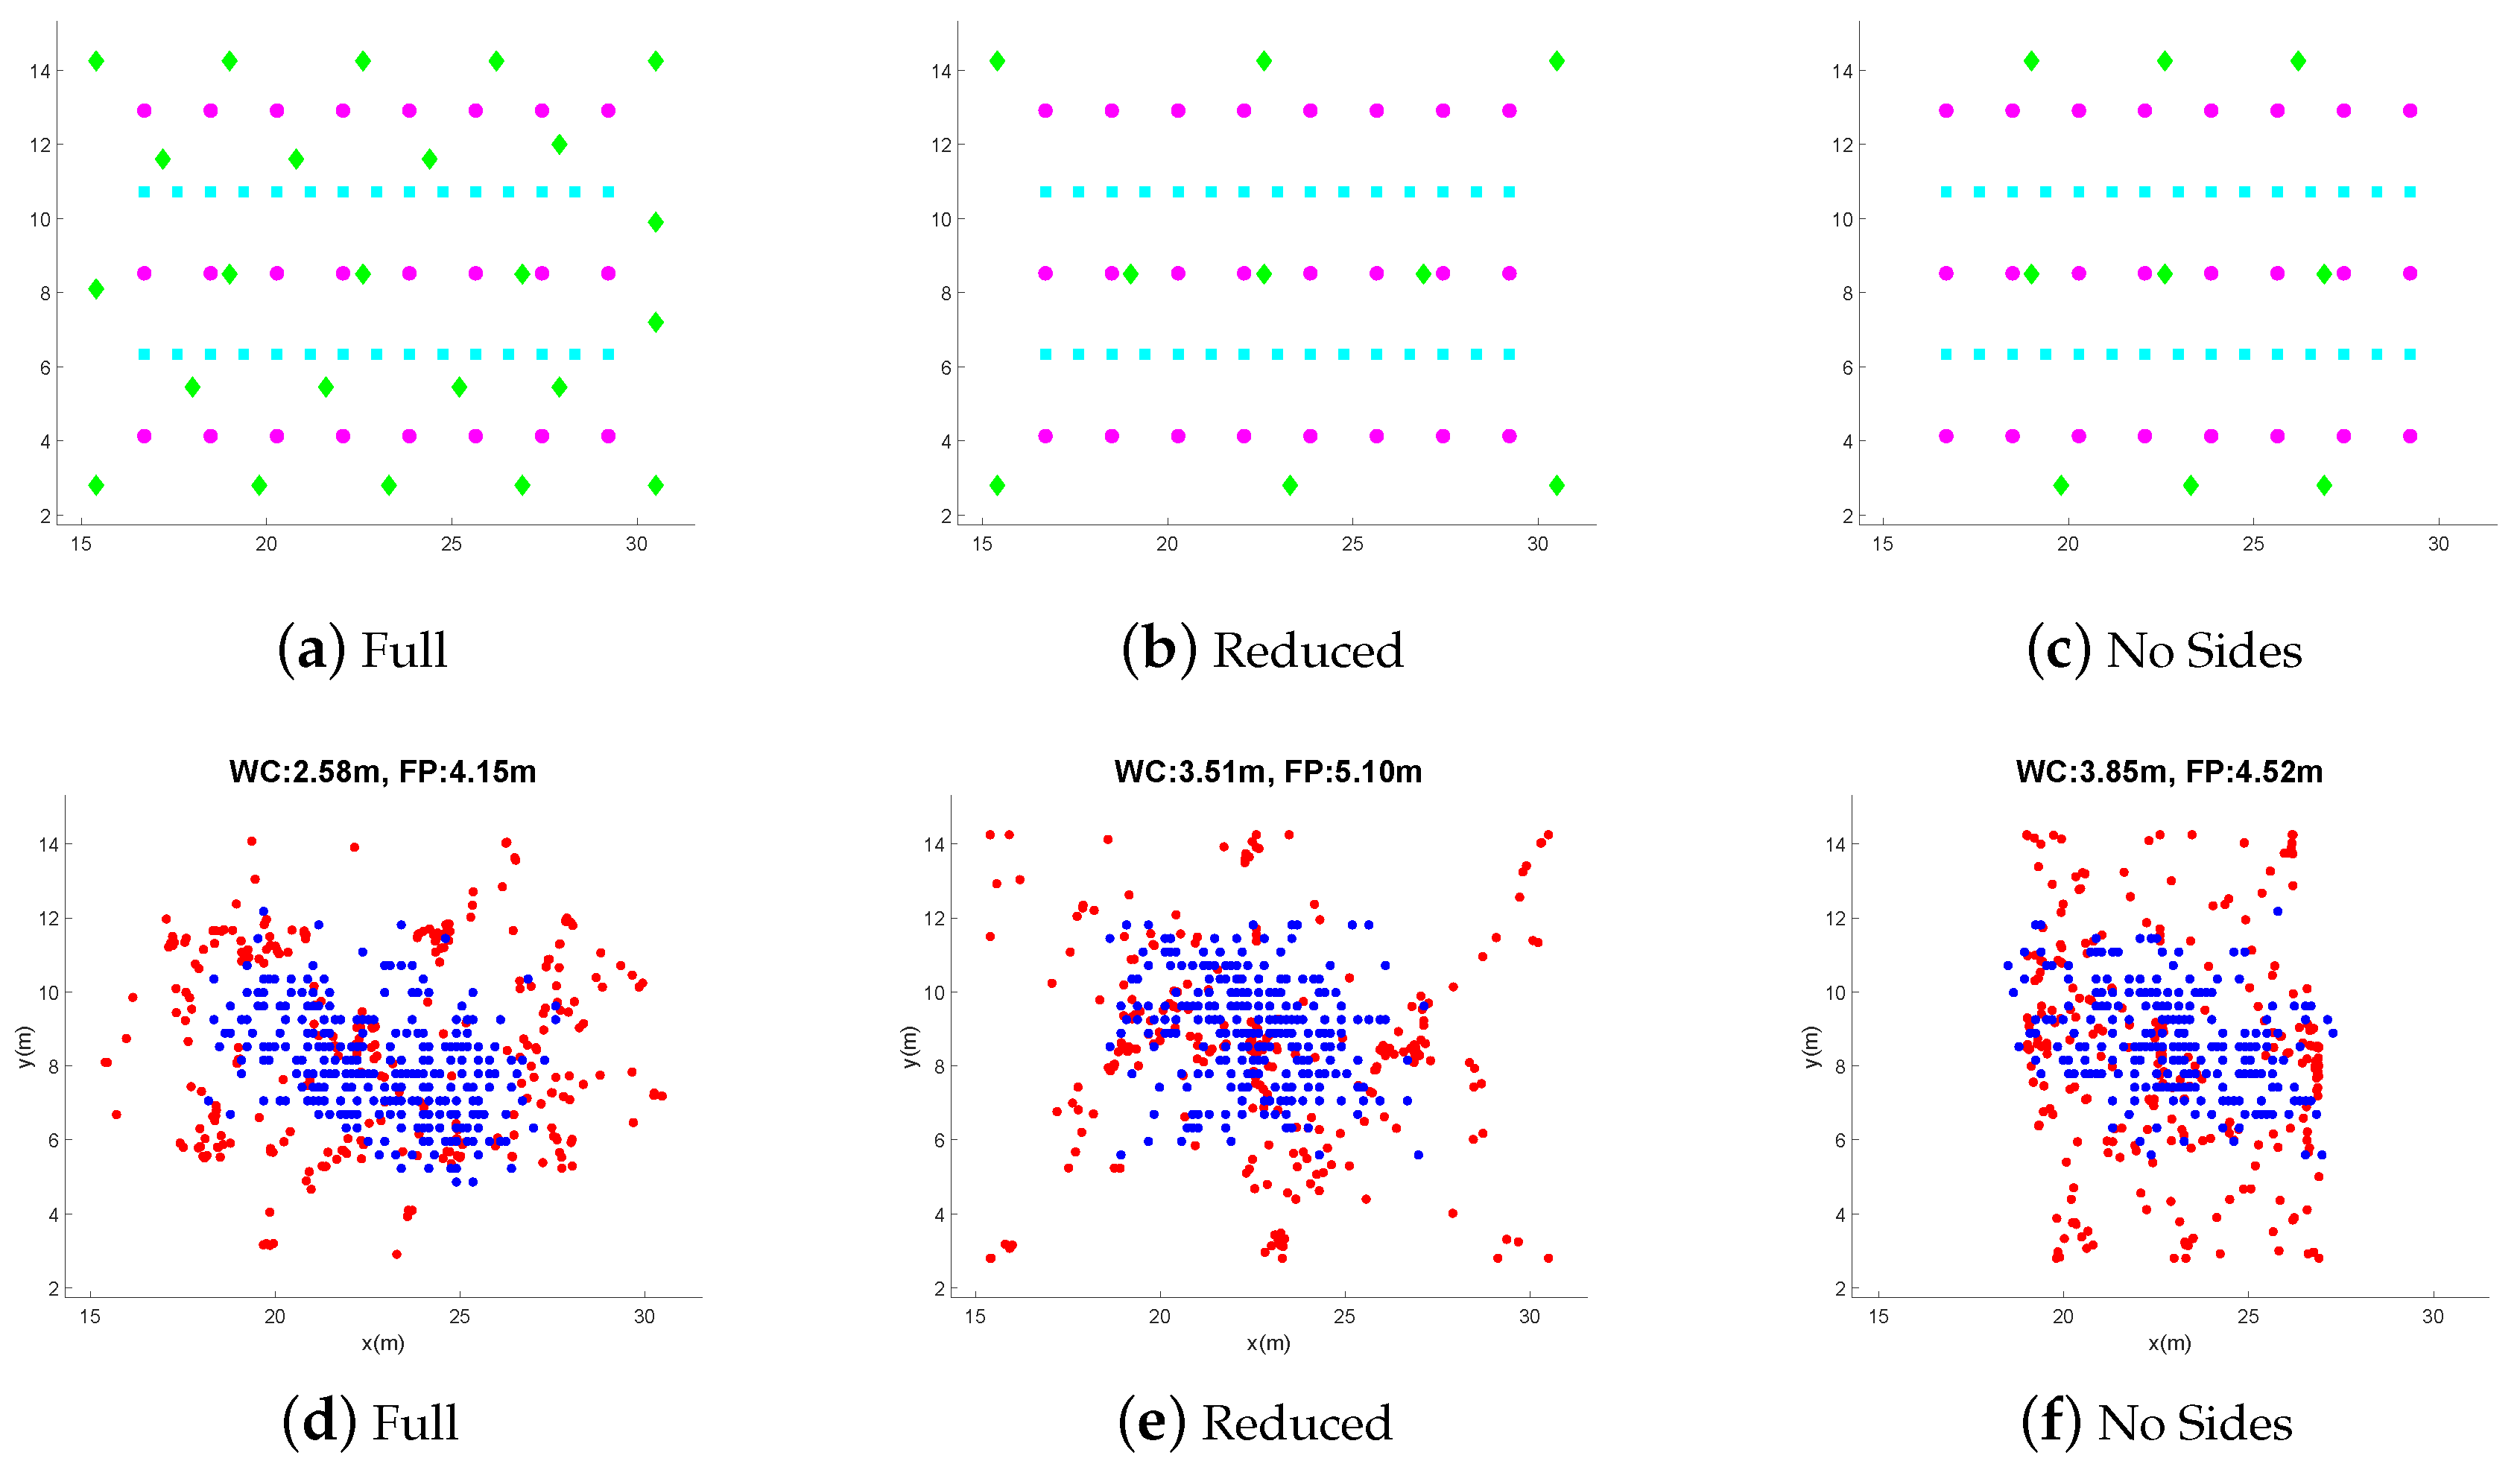
4.3. Beacon Deployment, Estimations Positions and Robustness

For Wi-Fi-based positioning, is it acknowledged that a high Wi-Fi routers density in the target area benefits the positioning accuracy. A large beacon density is also positive for BLE-based positioning [47]. Despite their cost is lower and their deployment is easier than for Wi-Fi routers, largely increasing the number of beacons for a deployment is usually not practical. The choice of the amount of beacons and their placement depends on factors like deployment restrictions in the target area, the beacon range, the positioning method, and environment obstacles. Beacon deployment choice has been addressed in literature [11,48,49], showing the complexity of the problem and only a few placement guidelines.
The beacon deployments used in the provided database are dense in the two zones, so that subsets of the deployed beacons can be considered alternative deployments. The scripts shipped with the data allow the selection of several alternative deployments that we considered interesting. Figure 8 shows the location estimations and their accuracy using the WC and FP methods for three distinct beacon deployments. The first deployment (Figure 8a) considers all beacons deployed in the Library zone. The positioning methods used a window of size 2 for buffering (for improved results), and the estimations were performed only for test points. Notice that the value for k parameter of the FP method is lower than the one used in previous experiments, despite that the new k value provides a worse accuracy metric value. The new k value was chosen to avoid a further concentration of the estimates in the center of the zone. The second deployment (Figure 8b) reduces the number of beacons to nine, and the accuracy drops in ≈1 m in the two methods. Notice that the FP estimated positions remain concentrated in the center area. The WC estimated positions, however, change and there are wide areas near the borders and away from beacons where the WC method is unable to place estimations. The third deployment (Figure 8c) also has only nine beacons, but no beacon was placed in the left and right sides of the area. The WC method is further unable to make proper position estimations for samples in areas near the sides. The absence of beacons near the boundary of the target area does not affect the FP method in this experiments. The FP accuracy is improved in the third deployment, because this new layout decrease mean distance of beacons to collection points and thus, the number of beacons detected in training and test fingerprints is higher.
The BLE beacons are battery-powered devices and thus, unless active monitoring and fast replacements are done, the situation where two or more beacons are not broadcasting at a given time is likely to happen when the power in their batteries is close to the time of exhaustion. The Figure 9 presents the robustness of WC and FP methods to situations where one to six beacons stop broadcasting. The WC method has better accuracies than the FP method, as we had previously seen, but it is also more affected by beacon disconnections. The larger reported errors should correspond to cases when the removed beacons are near the area boundary. The FP method is not heavily affected by the position where the disconnected beacons are located, and thus, the changes are not as drastic as for the WC method.

5. Discussion and Conclusions

This paper introduced a new BLE RSS database freely available to the research community. The RSS data was taken at two distinct zones of a university: among shelves in a library and at an office space. The RSS measurements were carefully annotated with position, time, and collection details labels. The data was gathered in the library zone using three smartphones (by three individuals) and in the office zone using one of those smartphones with beacons configured at three transmission powers. The difference of zones, collection devices, and transmission powers, as well as the dense beacon deployments, make the data useful to analyze a BLE RSS-based indoor positioning system in different environments and device settings, thus, likely making it more suitable to practical tests. In addition to the RSS and their associated labels, the position where the beacons were deployed and the geometries of shelves found in the environments are also provided.
Beyond the description of the collection process and the provided data, this paper provided a starting point to the usage of the data and presented key problems in the BLE RSS-based indoor positioning. The reader is introduced to the effect of the environment on the RSS values, the signal detection sensibility differences in the smartphones, and the major hurdle that is advertisement detection delays, which is significant in some devices. To test positioning using our data, two simple but widely used methods were applied: the weighted centroid and the kNN-based fingerprinting. The paper presented the results of testing them across the range of zones, devices, and powers that our database allows, and also considered a solution to the detection delays problem. In addition, brief analyses regarding beacon placement and positioning method robustness to beacon disconnection are presented. The data, the code, the analyses and the references described in this document may prove of significant importance for further studies into challenges of BLE assisted indoor positioning.
The analyses presented in this paper are only simple examples to encourage the research community working in indoor positioning to use our dataset and to introduce some common challenges in BLE RSS-based positioning. Plenty of other experiments are possible using the dataset, like analyzing the effects of orientation of different training and test sets or beacons deployment selection on fingerprinting methods, as well as the combination of BLE and Wi-Fi, if our previously published datasets are also used, and more in deep analysis of Wi-Fi and BLE similarities and differences. We plan to create new versions of the database, which would likely include other locations and collection orientations.

Author Contributions

G.M.M.-S. and M.M.-S. designed the collection campaigns and performed the data collection. G.M.M.-S. and J.T.-S. conceived the data formats. G.M.M.-S. wrote the scripts. J.T.-S. and J.H. analyzed and validated the experimental results. All authors participated in the paper’s writing and internal reviewing.

Funding

Germán M. Mendoza-Silva gratefully acknowledges funding from grant PREDOC/2016/55 by Universitat Jaume I. The authors gratefully acknowledge funding from European Union’s Horizon 2020 research and innovation programme under the Marie Skłodowska Curie grant agreement No. 813278 (A-WEAR: A network for dynamic wearable applications with privacy constraints, http://www.a-wear.eu/) and from Agència Valenciana de la Innovació transfer programme under the “Valorización, transferencia y explotación por las empresas de resultados de I+D” funding line INNVAL10/18/049 (Prototipo de Asistente Virtual Basado en Geolocalización para Visitas Guiadas en Museos).

Conflicts of Interest

The authors declare no conflict of interest. The founding sponsors had no role in the design of the study; in the collection, analyses, or interpretation of data; in the writing of the manuscript, and in the decision to publish the results.

References

  1. Huang, H.; Gartner, G. Current Trends and Challenges in Location-Based Services. ISPRS Int. J. Geo-Inf. 2018, 7, 199. [Google Scholar] [CrossRef]
  2. Tariq, Z.B.; Cheema, D.M.; Kamran, M.Z.; Naqvi, I.H. Non-GPS Positioning Systems: A Survey. ACM Comput. Surv. 2017, 50, 57:1–57:34. [Google Scholar] [CrossRef]
  3. Davidson, P.; Piché, R. A Survey of Selected Indoor Positioning Methods for Smartphones. IEEE Commun. Surv. Tutor. 2017, 19, 1347–1370. [Google Scholar] [CrossRef]
  4. Ban, R.; Kaji, K.; Hiroi, K.; Kawaguchi, N. Indoor positioning method integrating pedestrian Dead Reckoning with magnetic field and WiFi fingerprints. In Proceedings of the 2015 Eighth International Conference on Mobile Computing and Ubiquitous Networking (ICMU), Hakodate City, Japan, 20–22 January 2015; IEEE: New York, NY, USA, 2015; pp. 167–172. [Google Scholar]
  5. Barsocchi, P.; Crivello, A.; La Rosa, D.; Palumbo, F. A multisource and multivariate dataset for indoor localization methods based on WLAN and geo-magnetic field fingerprinting. In Proceedings of the 2016 International Conference on Indoor Positioning and Indoor Navigation (IPIN), Alcala de Henares, Spain, 4–7 October 2016; IEEE: New York, NY, USA, 2016; pp. 1–8. [Google Scholar]
  6. Ozdenizci, B.; Coskun, V.; Ok, K. NFC internal: An indoor navigation system. Sensors 2015, 15, 7571–7595. [Google Scholar] [CrossRef] [PubMed]
  7. Hassan, N.U.; Naeem, A.; Pasha, M.A.; Jadoon, T.; Yuen, C. Indoor positioning using visible led lights: A survey. ACM Comput. Surv. (CSUR) 2015, 48, 20. [Google Scholar] [CrossRef]
  8. Hou, Y.; Xiao, S.; Bi, M.; Xue, Y.; Pan, W.; Hu, W. Single LED Beacon-Based 3-D Indoor Positioning Using Off-the-Shelf Devices. IEEE Photonics J. 2016, 8, 1–11. [Google Scholar] [CrossRef]
  9. Saputra, M.R.U.; Markham, A.; Trigoni, N. Visual SLAM and Structure from Motion in Dynamic Environments: A Survey. ACM Comput. Surv. (CSUR) 2018, 51, 37. [Google Scholar] [CrossRef]
  10. He, S.; Chan, S.H.G. Wi-Fi Fingerprint-Based Indoor Positioning: Recent Advances and Comparisons. IEEE Commun. Surv. Tutor. 2016, 18, 466–490. [Google Scholar] [CrossRef]
  11. Faragher, R.; Harle, R. Location fingerprinting with bluetooth low energy beacons. IEEE J. Sel. Areas Commun. 2015, 33, 2418–2428. [Google Scholar] [CrossRef]
  12. Yang, Z.; Wu, C.; Zhou, Z.; Zhang, X.; Wang, X.; Liu, Y. Mobility increases localizability: A survey on wireless indoor localization using inertial sensors. ACM Comput. Surv. (CSUR) 2015, 47, 54. [Google Scholar]
  13. Bull, J.F. Wireless geolocation—Advantages and disadvantages of the two basic approaches for E-911. IEEE Veh. Technol. Mag. 2009, 4, 45–53. [Google Scholar] [CrossRef]
  14. Kangas, A.; Siomina, I.; Wigren, T. Positioning in LTE. In Handbook of Position Location; John Wiley and Sons, Ltd.: New York, NY, USA, 2011; Chapter 32; pp. 1081–1127. [Google Scholar]
  15. Koivisto, M.; Hakkarainen, A.; Costa, M.; Kela, P.; Leppanen, K.; Valkama, M. High-Efficiency Device Positioning and Location-Aware Communications in Dense 5G Networks. IEEE Commun. Mag. 2017, 55, 188–195. [Google Scholar] [CrossRef] [Green Version]
  16. Lu, Y.; Richter, P.; Lohan, E.S. Opportunities and Challenges in the Industrial Internet of Things based on 5G Positioning. In Proceedings of the 2018 8th International Conference on Localization and GNSS (ICL-GNSS), Guimaraes, Portigal, 26–28 June 2018; IEEE: New York, NY, USA, 2018; pp. 1–6. [Google Scholar]
  17. Bluetooth SIG, Inc. Bluetooth Market Update. Available online: https://www.bluetooth.com/markets/market-report (accessed on 21 December 2018).
  18. Use of Bluetooth Beacon Technology in Smart Airport. Available online: https://www.amarinfotech.com/use-of-bluetooth-beacon-technology-in-smart-airport.html (accessed on 21 December 2018).
  19. Wang, C.S. An AR mobile navigation system integrating indoor positioning and content recommendation services. World Wide Web 2018. [Google Scholar] [CrossRef]
  20. Jeon, K.E.; She, J.; Soonsawad, P.; Ng, P.C. BLE Beacons for Internet of Things Applications: Survey, Challenges, and Opportunities. IEEE Internet Things J. 2018, 5, 811–828. [Google Scholar] [CrossRef]
  21. The Hitchhikers Guide to iBeacon Hardware: A Comprehensive Report by Aislelabs. Available online: https://www.aislelabs.com/reports/beacon-guide/ (accessed on 21 December 2018).
  22. Bluetooth Special Interest Group Bluetooth Specification Core Versione 4.0, 2010. Available online: https://www.bluetooth.org/docman/handlers/downloaddoc.ashx (accessed on 21 December 2018).
  23. Potortì, F.; Crivello, A.; Palumbo, F. 11—The EvAAL Evaluation Framework and the IPIN Competitions. In Geographical and Fingerprinting Data to Create Systems for Indoor Positioning and Indoor/Outdoor Navigation; Conesa, J., Pérez-Navarro, A., Torres-Sospedra, J., Montoliu, R., Eds.; Intelligent Data-Centric Systems; Academic Press: New York, NY, USA, 2019; pp. 209–224. [Google Scholar]
  24. Mendoza-Silva, G.M.; Richter, P.; Torres-Sospedra, J.; Lohan, E.S.; Huerta, J. Long-Term WiFi Fingerprinting Dataset for Research on Robust Indoor Positioning. Data 2018, 3, 3. [Google Scholar] [CrossRef]
  25. Popleteev, A. AmbiLoc: A year-long dataset of FM, TV and GSM fingerprints for ambient indoor localization. In Proceedings of the 2017 International Conference on Indoor Positioning and Indoor Navigation (IPIN), Sapporo, Japan, 18–21 September 2017. [Google Scholar]
  26. Hanley, D.; Faustino, A.; Zelman, S.; Degenhardt, D.; Bretl, T. MagPIE: A Dataset for Indoor Positioning with Magnetic Anomalies. In Proceedings of the 2017 International Conference on Indoor Positioning and Indoor Navigation (IPIN), Sapporo, Japan, 18–21 September 2017. [Google Scholar]
  27. Tóth, Z.; Tamás, J. Miskolc IIS Hybrid IPS: Dataset for Hybrid Indoor Positioning. In Proceedings of the 26st International Conference on Radioelektronika, Kosice, Slovakia, 19–20 April 2016; lIEEE: New York, NY, USA, 2016; pp. 408–412. [Google Scholar]
  28. Iqbal, Z.; Luo, D.; Henry, P.; Kazemifar, S.; Rozario, T.; Yan, Y.; Westover, K.; Lu, W.; Nguyen, D.; Long, T.; et al. Accurate real time localization tracking in a clinical environment using Bluetooth Low Energy and deep learning. PLoS ONE 2018, 13, e0205392. [Google Scholar] [CrossRef] [PubMed]
  29. Byrne, D.; Kozlowski, M.; Santos-Rodriguez, R.; Piechocki, R.; Craddock, I. Residential wearable RSSI and accelerometer measurements with detailed location annotations. Sci. Data 2018, 5, 180168. [Google Scholar] [CrossRef]
  30. Sikeridis, D.; Papapanagiotou, I.; Devetsikiotis, M. BLEBeacon: A Real-Subject Trial Dataset from Mobile Bluetooth Low Energy Beacons. arXiv, 2018; arXiv:1802.08782. [Google Scholar]
  31. Sadowski, S.; Spachos, P. RSSI-Based Indoor Localization with the Internet of Things. IEEE Access 2018, 6, 30149–30161. [Google Scholar] [CrossRef]
  32. Mohammadi, M.; Al-Fuqaha, A.; Guizani, M.; Oh, J.S. Semi-supervised Deep Reinforcement Learning in Support of IoT and Smart City Services. IEEE Internet Things J. 2017. [Google Scholar] [CrossRef]
  33. Lazik, P.; Rajagopal, N.; Shih, O.; Sinopoli, B.; Rowe, A. ALPS: A bluetooth and ultrasound platform for mapping and localization. In Proceedings of the 13th ACM Conference on Embedded Networked Sensor Systems, Seoul, Korea, 1–4 November 2015; ACM: New York, NY, USA, 2015; pp. 73–84. [Google Scholar]
  34. Baronti, P.; Barsocchi, P.; Chessa, S.; Mavilia, F.; Palumbo, F. Indoor Bluetooth Low Energy Dataset for Localization, Tracking, Occupancy, and Social Interaction. Sensors 2018, 18, 4462. [Google Scholar] [CrossRef]
  35. The Complete Beacon Industry Report: Current Technology and Recent History. Available online: http://goto.kontakt.io/industry-report-whitepaper (accessed on 21 December 2018).
  36. Torres-Sospedra, J.; Montoliu, R.; Mendoza-Silva, G.M.; Belmonte, O.; Rambla, D.; Huerta, J. Providing Databases for Different Indoor Positioning Technologies: Pros and Cons of Magnetic Field and Wi-Fi Based Positioning. Mobile Inf. Syst. 2016, 2016. Available online: http://indoorloc.uji.es/databases/geotecDatabaseWGS.zip (accessed on 21 December 2018). [CrossRef]
  37. Accent Systems IBKS 105. Available online: https://accent-systems.com/product/ibks-105 (accessed on 20 June 2018).
  38. Nordic Semiconductor nRF51822 Core. Available online: https://www.nordicsemi.com/Products/Low-power-short-range-wireless/nRF51822 (accessed on 21 December 2018).
  39. Rappaport, T.S. Wireless Communications: Principles and Practice; Prentice Hall PTR: Englewood Cliffs, NJ, USA, 1996; Volume 2. [Google Scholar]
  40. Faragher, R.; Harle, R. An analysis of the accuracy of bluetooth low energy for indoor positioning applications. In Proceedings of the 27th International Technical Meeting of the Satellite Division of the Institute of Navigation (ION GNSS+’14), Tampa, FL, USA, 8–12 September 2014; pp. 201–210. [Google Scholar]
  41. Bouchard, K.; Ramezani, R.; Naeim, A. Features based proximity localization with Bluetooth emitters. In Proceedings of the 2016 IEEE 7th Annual Ubiquitous Computing, Electronics Mobile Communication Conference (UEMCON), New York, NY, USA, 20–22 October 2016; pp. 1–5. [Google Scholar]
  42. Mendoza-Silva, G.M.; Torres-Sospedra, J.; Huerta, J.; Matey Sanz, M.; BLE RSS Meaurements Database and Supporting Materials. Zenodo Repository. Available online: https://zenodo.org/record/1066041 (accessed on 21 December 2018).
  43. Paterna, V.C.; Augé, A.C.; Aspas, J.P.; Bullones, M.A.P. A bluetooth low energy indoor positioning system with channel diversity, weighted trilateration and kalman filtering. Sensors 2017, 17, 2927. [Google Scholar] [CrossRef] [PubMed]
  44. Muñoz-Organero, M.; Muñoz-Merino, P.J.; Delgado Kloos, C. Using bluetooth to implement a pervasive indoor positioning system with minimal requirements at the application level. Mob. Inf. Syst. 2012, 8, 73–82. [Google Scholar] [CrossRef]
  45. Bahl, P.; Padmanabhan, V.N. RADAR: An in-building RF-based user location and tracking system. In Proceedings of the Conference on Computer Communications, Nineteenth Annual Joint Conference of the IEEE Computer and Communications Societies (INFOCOM 2000), Tel Aviv, Israel, 26–30 March 2000; IEEE: New York, NY, USA, 2000; Volume 2, pp. 775–784. [Google Scholar]
  46. IPIN 2017 Conference Web Site, 2017. Available online: http://www.ipin2017.org/ (accessed on 21 December 2018).
  47. Kriz, P.; Maly, F.; Kozel, T. Improving Indoor Localization Using Bluetooth Low Energy Beacons. Mob. Inf. Syst. 2016, 2016, 1–11. [Google Scholar] [CrossRef]
  48. Budina, J.; Klapka, O.; Kozel, T.; Zmitko, M. Method of iBeacon Optimal Distribution for Indoor Localization; Modeling and Using Context; Christiansen, H., Stojanovic, I., Papadopoulos, G.A., Eds.; Springer: Cham, Switzerland, 2015; pp. 105–117. [Google Scholar]
  49. Castillo-Cara, M.; Lovón-Melgarejo, J.; Bravo-Rocca, G.; Orozco-Barbosa, L.; García-Varea, I. An Analysis of Multiple Criteria and Setups for Bluetooth Smartphone-Based Indoor Localization Mechanism. J. Sens. 2017, 2017, 1–22. [Google Scholar] [CrossRef]
Figure 1. Examples of the collection application operation: (a) Moving through the collection points, (b) Samples collection.
Data 04 00012 g001
Figure 2. 5th floor Library zone. In (a), green diamonds and the magenta asterisk represent the position of beacons and the local coordinates origin, respectively. The orange circles and blue squares represent the collection locations where the subject faced the left–right directions and those where they faced the up-down directions, respectively. The pale blue rectangles represent bookshelves. In (b), a shot that shows how beacons were deployed inside the top of bookshelves.
Data 04 00012 g002
Figure 3. Geotec office zone. In (a), green diamonds, orange circles and the magenta asterisk represent the position of beacons, collection locations and the local coordinates origin, respectively. The blue horizontal-lines-filled rectangles represent tall furniture that create NLOS situations. In (b), a shot to show how beacons were deployed in the ceiling tiles.
Data 04 00012 g003
Figure 4. Example of membership information extracted from an identifier. The fingerprint tagged by this identifier is the 2nd fingerprint captured for the 105th point of campaign number 3 (Library zone). The smartphone used is the BQ and beacons were advertising at a power level of −12 dBm.
Data 04 00012 g004
Figure 5. Difference between zones in the RSS values as detected by the A5 smartphone, with beacon transmission power set to −12 dBm.
Data 04 00012 g005
Figure 6. Times elapsed between two consecutive beacon detections while active registration of BLE advertisements. Measurements correspond beacon 1 broadcasting at −12 dBm in the Library zone. In (a), thet ×200 ms (t ≥ 1) detection delay pattern is shown. In (b), a comparison of detection capability among the three smartphones is presented.
Data 04 00012 g006
Figure 7. Positioning accuracy. For (a,b), data was captured in the Library zone. For (c,d), data was captured in the Geotec zone.
Data 04 00012 g007
Figure 8. Estimated positions and accuracy (df) for three deployments (ac) using the WC (k = 10) and FP (k = 12) methods. In the deployment figures, green diamonds, cyan squares and magenta circles represent the position of beacons, test and training samples, respectively. In the position estimation figures, red circles and blue circles represent the estimations provided by the WC and FP methods, respectively. Data was collected in the Library zone using the S6 smartphone.
Data 04 00012 g008
Figure 9. Positioning accuracies when 1–6 beacons stop sending advertisements (A5 smartphone).
Data 04 00012 g009
Table 1. General description of each collection zone.
GeotecLibrary
number of beacons2224
number of samples26522100
number of campaigns12
smartphonesA5A5,BQ,S6
involved subjects13
consecutive collection samples136
transmission powers (dBm)−20,−12,−4−20
area (m2)151.07176.02
area covered by tall obstacles (m2)8.7068.73
area covered by samples (m2)137.51121.65
area covered by beacons (m2)138.08172.9
MDMS (m)2.341.79
MDMB (m)3.073.71
Table 2. Beacons detection range.
Library (S6)Library (A5)Geotec (A5)
Max detected RSS (dBm)−52−33−44
MDP70 (m)0.473.922.75
MDHT (m)4.501.471.16
Table 3. Pearson correlation test between detection delays and distance to a beacon. Values correspond to the beacon reporting the ρ value farthest from zero, considering data captured by the A5 smartphone and a −12 dBm beacon power setting).
Zone ρ p-ValueBeacon
Geotec−0.140.042
Library−0.140.1218
Table 4. Influence of the number of detectable beacons in WC accuracy.
A5BQS6
Error(m)-All3.511.952.01
Error(m)-K103.511.942.00
Error(m)-KF102.631.881.83
Ratio-KF100.440.820.83
Table 5. Influence of the number of detectable beacons in FP accuracy.
A5BQS6
Error (m)4.434.614.88
Max number of coincident beacons41211
ρ −0.80−0.95−0.93
p-value0.2 0 0
Table 6. Buffering results using data for the A5 phone and power −12 dBm. For realistic comparisons, position estimation were only computed for test sets in WC.
MeanLast
LibraryGeotecLibraryGeotec
Windows sizeFPWCFPWCFPWCFPWC
none4.463.464.163.444.463.464.163.44
23.772.583.912.693.852.563.932.69
33.432.323.492.593.412.353.522.49
42.952.293.382.613.032.313.472.45
52.832.283.342.482.872.303.552.37

