Article

Transcriptional Profiles of Secondary Metabolite Biosynthesis Genes and Cytochromes in the Leaves of Four Papaver Species

1
Genomics Division, National Institute of Agricultural Science, RDA, 370, Nongsaengmyeong-ro, Wansan-gu, Jeonju-si, Jeollabuk-do 54874, Korea
2
Research and Development Center, Insilicogen Inc., Yongin-si, Gyeonggi-do 16954, Korea
3
Department of Forest Sciences, College of Agriculture and Life Sciences, Seoul National University, Seoul 08826, Korea
4
Korean Medicine Clinical Trial Center (K-CTC), Kyung Hee University Korean Medicine Hospital, Seoul 02447, Korea
5
KHU-KIST Department of Converging Science & Technology, Kyung Hee University, Seoul 02447, Korea
6
Department of Biological Sciences, Sungkyunkwan University, Suwon 16419, Korea
*
Author to whom correspondence should be addressed.
These authors contributed equally to this study.
Submission received: 22 October 2018 / Revised: 26 November 2018 / Accepted: 26 November 2018 / Published: 28 November 2018

Abstract

:
Poppies are well-known plants in the family Papaveraceae that are rich in alkaloids. This family contains 61 species, and in this study we sequenced the transcriptomes of four species’ (Papaver rhoeas, Papaver nudicaule, Papaver fauriei, and Papaver somniferum) leaves. These transcripts were systematically assessed for the expression of secondary metabolite biosynthesis (SMB) genes and cytochromes, and their expression profiles were assessed for use in bioinformatics analyses. This study contributed 265 Gb (13 libraries with three biological replicates) of leaf transcriptome data from three Papaver plant developmental stages. Sequenced transcripts were assembled into 815 Mb of contigs, including 226 Mb of full-length transcripts. The transcripts for 53 KEGG pathways, 55 cytochrome superfamilies, and benzylisoquinoline alkaloid biosynthesis (BIA) were identified and compared to four other alkaloid-rich genomes. Additionally, 22 different alkaloids and their relative expression profiles in three developmental stages of Papaver species were assessed by targeted metabolomics using LC-QTOF-MS/MS. Collectively, the results are given in co-occurrence heat-maps to help researchers obtain an overview of the transcripts and their differential expression in the Papaver development life cycle, particularly in leaves. Moreover, this dataset will be a valuable resource to derive hypotheses to mitigate an array of Papaver developmental and secondary metabolite biosynthesis issues in the future.

Graphical Abstract

1. Introduction

Benzylisoquinoline alkaloids (BIAs) are a group of specialized metabolites that are predominantly found in members of the plant order Ranunculales. Approximately 2500 natural BIAs have been identified from these plants, and they are primarily used as drugs to treat a number of human diseases [1]. Natural products derived from secondary metabolites (SMs) that originate from plants both directly and indirectly contribute to more than 50% of known drugs, as they are used to modify the physiochemical properties of drugs [2,3,4,5]. Among the Ranunculales, species in the family Papaveraceae (poppy) are rich in alkaloids and their precursors, which are used in various alkaloid-based drugs [1,6]. Historically, from the Sumerian civilization to the modern scientific era, poppies have been used in medicine for their alkaloid-rich latex sap [7,8]. However, the elucidation of novel enzymes from a natural source and the characterization of their metabolism is an ongoing process. To enhance the sustainable production of specific alkaloids for these purposes, the enzymes can be cloned into microbes [9,10,11].
At present, there is only one reference genome for the family Papaveraceae, which was recently reported to have a size of 2.7 Gb [12]. However, species in this family have varying genome sizes, which are estimated to range from 1.7 Gb (Papaver nudicaule) to 8.7 Gb (Papaver orientale) [13,14]. Generally, in Papaveraceae, characterizations of the BIA biosynthesis enzymes are broad, but remain incomplete because of a paucity of genetic materials. Only a few studies have generated datasets for the genetic components of these systems; for example, different tissues (capsule, stem, leaf, and root) in Papaver somniferum were previously sequenced by Illumina to assess the putative miRNAs that regulate BIA biosynthesis [15]. The stems and latex from 60–80-day-old plants of P. somniferum cultivars were sequenced by 454 pyrosequencing to identify BIA biosynthesis pathway transcripts and quantify targeted metabolites [16]. Similarly, studies of cells cultured in vitro, treated with a fungal elicitor of the peduncle from P. somniferum, and was sequenced by 454 pyrosequencing [17,18], and a few other studies that performed sequencing with Sanger-based expressed sequence tags (ESTs), have characterized BIA biosynthesis genes. Furthermore, a survey was conducted of the sequence read archive (SRA) repository, which contains only 40 libraries for RNA; 15 libraries were sequenced by the 454 pyrosequencing method, and 25 libraries were sequenced by Illumina (accessed on July 2018). Additionally, 22 of these libraries were sequenced for different tissues in four Papaver species: Papaver bracteatum, Papaver rhoeas, P. somniferum, and Papaver setigerum. These datasets were not developed with a focus on the developmental cycle of Papaver plants. However, in the present study, we focused on the developmental stages of the different Papaver species; our initial findings for similar datasets were recently reported for P. rhoeas and Papaver nudicaule [19].
The multifamily gene cytochrome P450 monooxygenase (CYP) is present in almost all groups of organisms in the tree of life [20]. CYP is a multifamily enzyme that is primarily involved in catalyzing the oxidation of specific substrates mainly through regio- and stereo-selective processes. These CYPs are largely responsible for species-specific metabolite biosynthesis. The CYP80 superfamily of these enzymes is specific to plants in the order Ranunculales [21], and contains key enzymes for BIA biosynthesis; indeed, 20% of the enzymes involved in the BIA biosynthesis pathway are cytochromes (CYP), including CYP80, CYP82, CYP96, and CYP719 (with reference to the KEGG pathway map00950) [21,22,23]. These enzymes play roles in the biosynthesis of morphine, codeine, magnoflorine, berbamunine, norreticuline, crinine, sanguinarine, noscapine, and narcotoline metabolites [22]. According to the CYP nomenclature committee report, 1% of the protein-coding genes in plants are CYPs [21], more than 16,000 of which are named, and these are grouped into the superfamilies CYP71–CYP99 and CYP701–CYP999 [24,25]. Thus far, more than 300,000 CYPs have been sequenced, 57% (171,000) of which are from plant genomes or transcriptomes, which greatly facilitates our understanding of plant-specific SMs [20]. Half of these sequences were sequenced in large-scale sequencing projects, such as the “1000 plants transcriptome project” (1KP) [20,26]. For the 1KP, P. bracteatum was sequenced, and these results are included in this study.
In the present study, the leaves were selected instead of another organ, such as the alkaloid-rich latex, because leaves are common tissue that can be collected from all developmental stages of the same plant and that directly respond to environmental stress. A transcriptome-wide multifamily analysis can provide preliminary information about available SMs. In plants in particular, secondary metabolite biosynthesis (SMB) genes and cytochromes are the primary candidates to initiate molecular characterizations to obtain information on plant-specific SMs [27,28]. Furthermore, the comparative profiles of these selected candidates with closely or distantly related plants can be assessed, which aids in the functional characterization of the putative genes [29]. This is the rationale for selecting multiple species for sequencing (which have different phenotypes and flower colors) and comparing these with alkaloid-rich genomes. With these procedures, we sequenced a large-scale leaf transcriptome, while focusing on the developmental stages of Papaver, to assess the complete cytochrome and SMB profiles of six different Papaver species, and compared them with other alkaloid-rich genomes. Among these six Papaver species, the leaves of four (P. rhoeas, P. nudicaule, Papaver fauriei, and P. somniferum) species were sequenced in this study, and the other two (P. bracteatum and P. setigerum) transcriptomes were obtained from SRAs. The Papaver life cycle comprises six developmental stages from dormancy to seed ripening [8]. Among these, leaves taken from three life stages—leaf rosetting (30 days), branching and elongation (60 days), and seed and blossom formation (90–120 days)—were sequenced to capture the transcript expression profiles across the developmental cycle. P. fauriei is a slow-growing plant compared to the other species; thus, 120-day-old plants’ leaves from this species were included for additional sequencing. These sequenced transcriptomes were then systematically analyzed for cytochromes and SMB pathway transcripts, along with those of other genomes, using bioinformatics methods.

2. Results

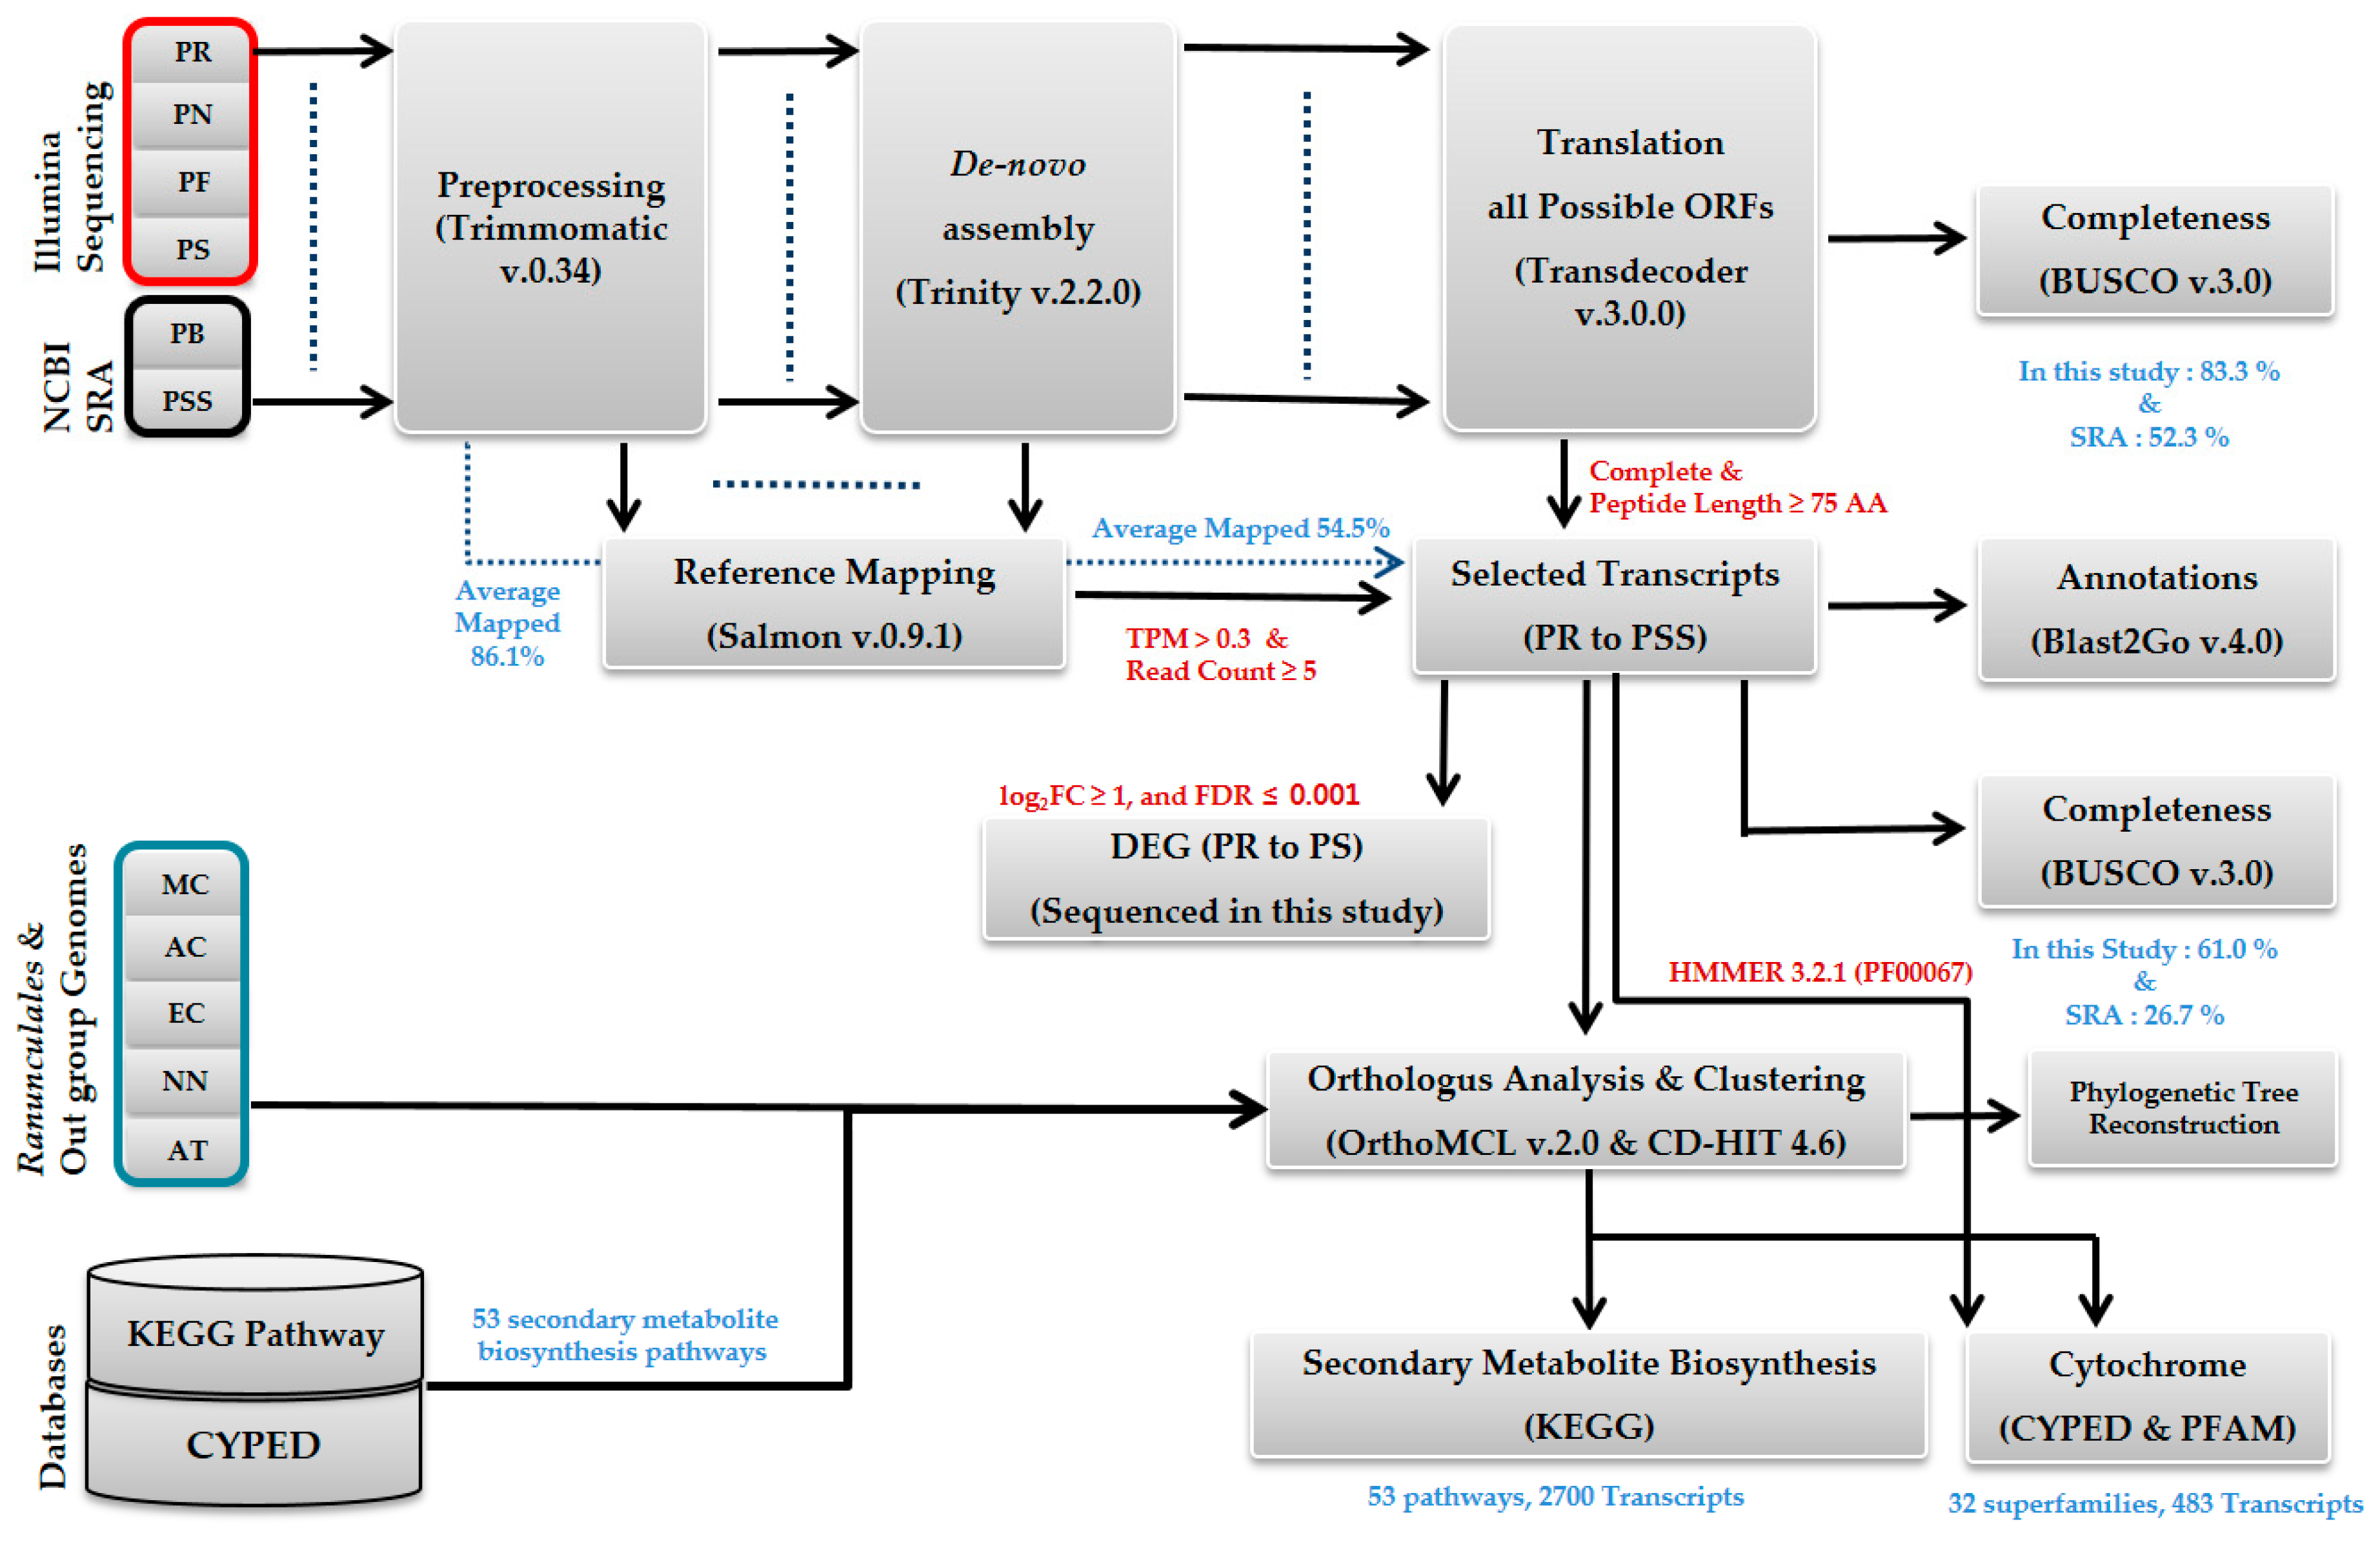
2.1. Sequencing and De Novo Transcriptome Assembly

In this study, 275.4 Gb of leaf transcriptome were sequenced for three different stages of the Papaver developmental cycle, including the leaf rosetting (30 days), branching and elongation (60 days), and seed and blossom formation (90 days) stages. For P. fauriei only, we sequenced four different time points because it is a slow-growing species compared to the other three species (with elongation and branching completed at 60 and 120 days, respectively). Each Papaver species was assembled into contigs individually after processing for sequencing errors. In total, 815 Mb of bases were assembled into 1,137,223 transcripts/contigs. Among these, 121,236 (10.7%) contigs, totaling 226 Mb, were selected as final representative transcripts. For transcript selection, 56% of the assembled contigs were not expressed in at least one of the four plants. Additionally, 33% of the assembled transcripts were found in the fragments (not full-length) and small peptides categories (Supplementary Table S1). Due to this filter, we were able to reduce the frequencies of assembly and sequencing artifacts, whereas there was some loss in the detection of low-expressed transcripts. On average, 83.3% of the core benchmarking genes were completely present in the de novo assemblies; this was confirmed by an analysis of benchmarking universal single-copy orthologs (BUSCOs). However, in the final selected transcripts after filtration, the BUSCO score was reduced to 61% on average. This 22% loss mostly occurred when applying the peptide length criteria, which can be observed in the plot of BUSCO missing genes (Supplementary Figure S1B). Among these selected transcripts, 80.7% of the selected transcripts (contigs) were annotated from the UniProt database by performing a sequence similarity search (Table 1). Finally, evolutionary relationships were derived by reconstructing phylogenetic trees, which placed P. somniferum and its putative subspecies P. setigerum in the same clade (Supplementary Figure S2). The systematic bioinformatics workflow of this study is given in the form of a flowchart, along with the filter cut-offs and results, in Figure 1.

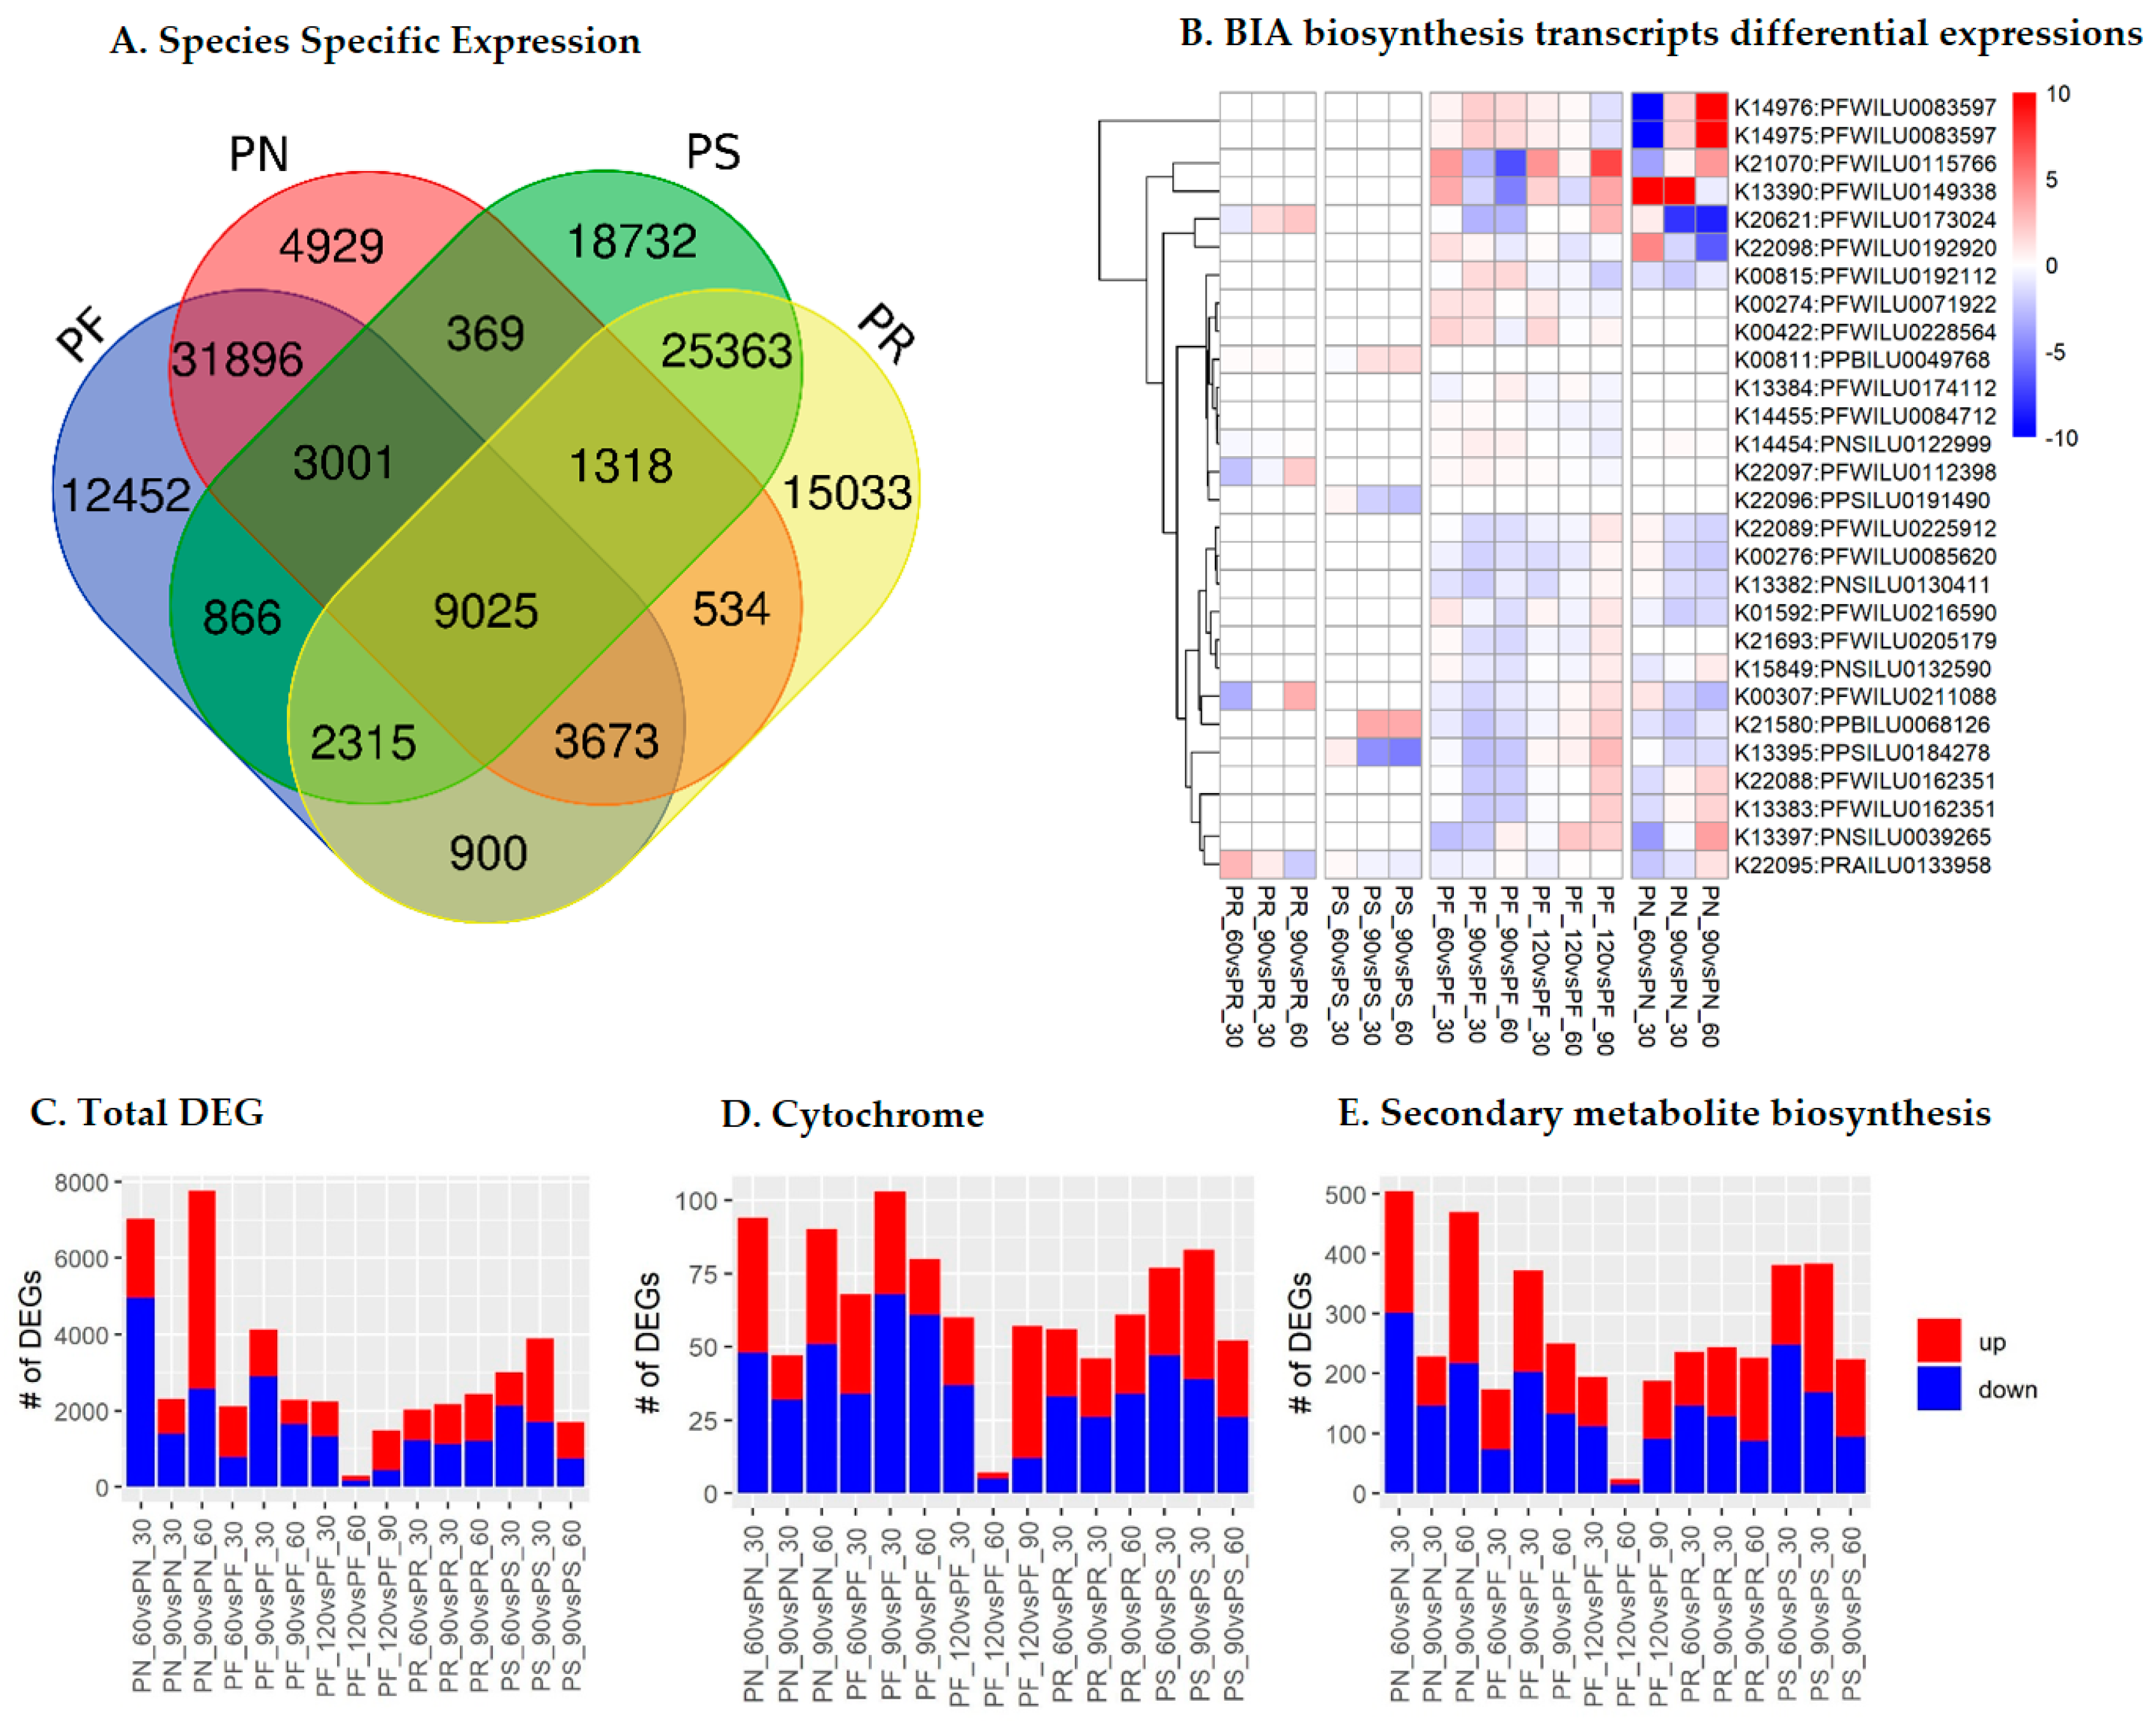
2.2. Species- and Stage-Specific Differentially Expressed Transcripts

Species-specific and stage-specific differential expression analyses were conducted for the complete transcriptome, which was newly sequenced in this study. In total, 9025 (6.5%) of the selected transcripts were expressed in all four studied species. Among these, the transcripts of P. somniferum and P. rhoeas showed the most unique expression profiles compared to the other species (Figure 2A). In the analysis of differential expression among stages, 46,184 (33.4%) of the selected transcripts were differentially expressed in the different growth stages of Papaver. Among these, 294 transcripts showed differential expression among stages in all four Papaver species, and 1418 SMB transcripts and 175 CYP transcripts were also differentially expressed in one of the developmental stages of Papaver (Figure 2B–E and Supplementary File 1). Among these transcripts, most were differentially expressed in P. nudicaule and P. somniferum.

2.3. Cytochrome Profiles

The complete cytochrome transcript profiles were obtained by three individual methods (i.e., ortholog, clustering, and profile search analyses). As a result, 483 transcripts (540 peptides, all possible open reading frames from transcripts) from all three analyses were examined. Out of these, only the sequences grouped with CYPED reference sequences were named along with their superfamilies. In total, 178 transcripts were identified from the ortholog analysis, 277 transcripts were identified from the clustering analysis, and 498 transcripts were identified from the profile search; these were plotted in the form of a Venn diagram (Supplementary Figure S3A). The results showed that the sequences identified by the clustering analysis were mostly similar to those identified by the other two analyses. However, the ortholog analysis had the fewest sequences due to the reduction of in-paralogs by the OrthoMCL algorithm. Finally, the results from the clustering and ortholog analyses were plotted on co-occurrence heat maps (Figure 3 and Supplementary Figure S3C). From this, 49 common superfamilies were identified in both analyses (Supplementary Figure S3B). Among these, CYP71 was predominantly present in all of the selected genomes. According to the CYP nomenclature committee, the CYP71 genome is present in the youngest clades of plants, and contributes considerably to plant evolution [21]. The CYP82, CYP719, and CYP80 superfamilies are involved in BIA biosynthesis through multiple reactions. Moreover, according to the CYP nomenclature report, CYP80 is more common in plants belonging to the order Ranunculales [21,23]. Accordingly, in our results, more transcripts of the CYP82 and CYP719 superfamilies were found compared to those of the other CYPs. Further, although CYP80 is ubiquitous among Ranunculales, no transcripts were present in the Papaver leaves’ transcriptome, but did exist in other Papaveraceae genomes, such as those of Macleaya cordata and Eschscholzia californica, which are also species rich in alkaloids [30,31]. Furthermore, the CYP73, CYP710, and CYP722 superfamilies were more specific to P. sominifera. CYP88 was only present in P. rhoeas, CYP724 was only present in P. nudicaule, and CYP721 was only present in P. fauriei. Ten other superfamilies were only present in M. cordata and E. californica, and were not present in any other species of Papaveraceae (Figure 3).

2.4. Cytochromes Involved in Secondary Metabolite Biosynthesis (SMB)

Cytochromes are critical protein to the biosynthesis of plant-specific SMs. Accordingly, we connected the cytochromes identified to the SMB pathways in the KEGG pathway database. In total, eight pathways involving 17 CYP superfamilies were present in the Papaver leaves’ transcriptome (Table 2). Among these, the brassinosteroid biosynthesis pathway (map00905) involved the most (five) CYP superfamilies, followed by the diterpenoid biosynthesis pathway(map00904), which involved three CYP superfamilies. In the brassinosteroid biosynthesis pathway, these five cytochrome superfamilies were involved in 73% of the entire pathway. Brassinosteroids are plant steroidal hormones and a class of terpenes, which are primarily involved in cross-talk between other phytohormones that protect plants from various environmental stresses [32,33]. Another class of terpene is involved in the diterpenoid biosynthesis pathway, which contained a minimal number of cytochromes. Furthermore, the BIA pathway also included three superfamilies of CYP in its biosynthesis cascade.

2.5. SMB Pathway Profiles

To elucidate the complete SMB pathways from the Papaver leaves’ transcriptome, the 53 SMB pathways from the KEGG pathway database were used as a reference. The ortholog sequences from those pathways were compared to the Papaver leaves’ transcriptome by calculating the sequence similarity. In total, 2700 transcripts were similar to KEGG orthologs, which were plotted on a co-occurrence heat map along with other alkaloid-rich genomes. Among these, half of the transcripts belonged to enzymes that are involved in the biosynthesis of zeatins (map00908), flavonoids (map00941), phenylpropanoids (map00940), betalains (map00965), brassinosteroids (map00905), terpenoid backbones (map00900), anthocyanins (map00942), carotenoids (map00906), terpenoid backbones (map00900), and BIAs (map00950). Out of these, 73% of brassinosteroid biosynthesis pathways were present in the Papaver leaves’ transcriptome, and the zeatin biosynthesis pathway was present in all of the genomes and transcriptomes that were examined except for those of P. bracteatum and P. setigerum. The flavonoid biosynthesis pathway in P. rhoeas and P. somniferum showed a differential coverage compared to those in other Papaver species. Similarly, the BIA biosynthesis pathway had a very low coverage in Arabidopsis thaliana compared to that in other genomes (Figure 4), which indicates that the alkaloid-rich plants cover most of the BIA biosynthesis pathway. The 1228 (out of 2700; 45%) KEGG SMB annotated transcripts showed different expression patterns in all Papaver species at different stages of growth.

2.6. BIA Biosynthesis Pathway

The BIA biosynthesis pathway is one of the pathways that is most often focused upon in studies of Papaver species aiming to produce various drugs. In total, 27 (46%) KOs of the BIA biosynthesis pathway were present in the Papaver leaves’ transcriptome. Of the KOs involved in BIA biosynthesis, 12 (20%) were cytochromes, among which five KOs were present in the Papaver leaves’ transcriptome: K22094 (CYP82X2), K22096 (CYP82X1), K13395 (CYP719A1_2_3_13), K21070 (CYP719A14), and K20621 (CYP82Y1). In total, 183 transcripts belonging to the BIA biosynthesis pathway were plotted on a co-occurrence heat map along with other alkaloid-rich genomes (Figure 5). From these results, K21070 (CYP719A14) and K13395 (CYP719A1_2_3_13) were found to be predominant in all of the selected genomes except for that of Arabidopsis thaliana. Similarly, other KOs, e.g., K13384 (coclaurine N-methyltransferase), were also present in all genomes except for that of P. nudicaule. K22096 (CYP82X1) was found to be only present in P. somniferum, and is considered to be an upstream gene that is involved in the biosynthesis of noscapine and narcotoline molecules. Additionally, K22095 (1, 13-dihydroxy-N-methylcandine 13-O-acetyltransferase) was also only present in P. rhoeas. K22094 (CYP82X2) is also an upstream gene for the biosynthesis of noscapine and narcotoline molecules, and is present in P. somniferum and P. fauriei. Finally, the targeted metabolite profiles from 22 metabolites in the BIA biosynthesis pathway were plotted on another heat map (Figure 6). The overall production of metabolites in P. fauriei was decreased when the plant was in a matured state, whereas other species showed increased production at this stage (Figure 6A). The patterns for individual metabolites in P. somniferum clearly showed that the accumulation of alkaloids increased concurrently with the advancement of plant development, except for that of sanguinarine isoforms. Similarly, in P. fauriei, alkaloid accumulation showed the opposite pattern to that seen in P. somniferum (Figure 6B). Out of 180 transcripts, 120 belonged to 22 KEGG orthologs involved in BIA biosynthesis pathways, and their differential expression was noted in all four species of Papaver (Supplementary Figure S4). Each KO consisted of multiple transcripts, and KOs were also expressed differently at different stages because of the existence of multiple transcript isoforms for the same genes and multiple technology-dependent and bioinformatics statistical method artifacts.

3. Discussion

A large-scale transcriptome of Papaver species’ leaves was sequenced to assess their transcript expression profiles and how these changed over the developmental cycle of the plants. In parallel, systematic bioinformatics analyses revealed the SMB pathways and cytochrome superfamilies that were present in these species’ leaf transcriptomes (Figure 1). Moreover, to reduce the expression bias that occurs during bioinformatics analysis while estimating significant differences in expression between each pair of developmental stages, samples were collected from three individual plants under similar conditions. The assembled transcripts were filtered with five different parameters: the transcripts per million (TPM), mapped read counts, full-length status of transcripts (given by the Trans Decoder tool), coding potential, and peptide length parameters. From this, we obtained a full-length transcriptome and information on which transcripts were significantly differentially expressed with a reduced bias. We also obtained a complete overview of the cytochromes and SMB transcript expression profiles in the studied species while applying the full-length status and peptide length parameter criteria. When compared to the public dataset (i.e., the transcriptomes for P. bracteatum and P. setigerum), the data produced in this study doubled the gene completeness scale of these species’ transcriptomes (Supplementary Figure S1).
Since SMBs and cytochromes are the prime targets for characterizations of molecular pathways in most medicinal and non-model plants selected for metabolite engineering or genetic modification approaches, our results provide initial data on the selection of transcripts among Papaver species to enhance the expression of secondary metabolites involved in the production of various alkaloids (Supplementary File 1 and Figure 2B). In particular, this information could be used to enhance opioid production by developing a transgenic plant or microbial system for selected opioids, similarly to such earlier models as the yeast models that were developed to produce thebaine and hydrocodone from sugar [10] and another yeast model that was developed to produce noscapine and its precursors [11]. Furthermore, most of the opioids previously characterized in Papaver species were produced in the seeds. In this study, the leaves’ transcriptome, especially the co-occurrence heat maps generated for the different species’ BIA biosynthesis, allowed for specific transcripts of particular developmental stages to be identified, which will likely be the most valuable finding of this study (Figure 5 and Supplementary Figure S4) and could help researchers to select the gene-of-interest for their research. However, the complete profiles obtained were transcriptome-wide; this resulted in some discrepancies, such as the absence of CYP80 in Papaver species and its presence in other plants of Ranunculales (Figure 3). Notably, one of the cytochromes involved in the BIA pathway, CYP703 (tyrosine decarboxylase), which also has the characteristic of adding scent to flowers in plants, showed significant differential expression [34]. Additionally, most of the identified cytochromes are involved in plant growth regulation, which could greatly help in the study of various stress responses of plants [21,35,36,37,38]. Similarly, differential expression among developmental stages of SMB transcripts, which are strongly related to plant physiological processes (e.g., K00430 (peroxidase) is an antioxidant enzyme [39], K00588 (caffeoyl-CoA O-methyl transferase) is a lignin biosynthesis enzyme [40], and K13065 (shikimate O-hydroxycinnamoyl transferase) and K13066 (caffeic acid 3-O-methyltransferase) are monolignol biosynthesis enzymes [41,42]), was also observed.
From this basic summary, we propose that this dataset could be highly beneficial for the Papaver research community in the following ways: (1) to predict the putative transcripts and gene structural scaffolds of different genes; (2) to obtain the gene/transcript expression and differential expression profiles among different developmental stages; and (3) to give an overview of the available SMB transcripts and cytochromes in the Papaver species compared to those in other genomes using the comparative co-occurrence heat maps that were obtained. Table 2 provides a particularly useful and detailed list of cytochromes that actively participate in SMB. This will help researchers in the selection of genes for further detailed characterizations, such as those using clones in microbial vectors to characterize the selected SMB pathway, and reveal their correlations with other plant physiological processes. Further, since this dataset is well-constructed with biological replicates, the expression bias was reduced to obtain strong and significant results, which will contribute to the construction of a network of heterogenetic data for Papaver species. Moreover, the implications of this study are not limited to these species; since a wide coverage (~40 Gb per plant) was generated, these data will be useful for multiple applications, and conducting bioinformatics analyses for various applications could facilitate the derivation of new testable hypotheses.
The results of this study also had some technical biases, as most of the cytochromes present in other genomes of the same families were not present in this specific transcriptome, which was possibly due to the following reasons: the other selected plant sequences may have been draft genomes consisting of missing cytochromes; or the SMB transcripts could have been only partially sequenced or not expressed in leaves but expressed instead in other parts of the same plant. This shows the importance of sequencing the complete Papaver transcriptome from different tissues to obtain the comprehensive CYP and SMB transcript profiles of these plants. However, this study produced the first large-scale leaves’ transcriptome for these species, which was sequenced to understand the transcript expressions of three different developmental stages in four species of Papaver. The findings of this study could help to guide researchers in transcript selection for studies of various plant developmental issues or the detailed characterization of SMBs from various developmental stages. This high-throughput dataset should facilitate the derivation of hypotheses for future developmental studies of Papaver plants.

4. Material and Methods
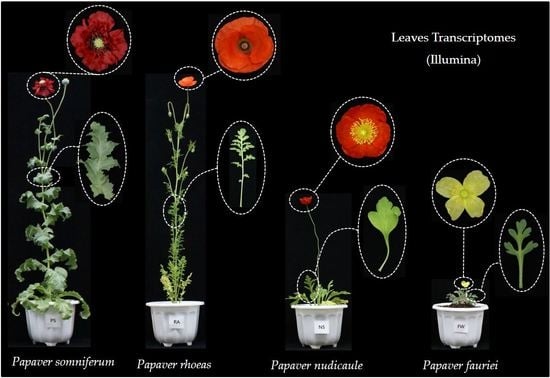
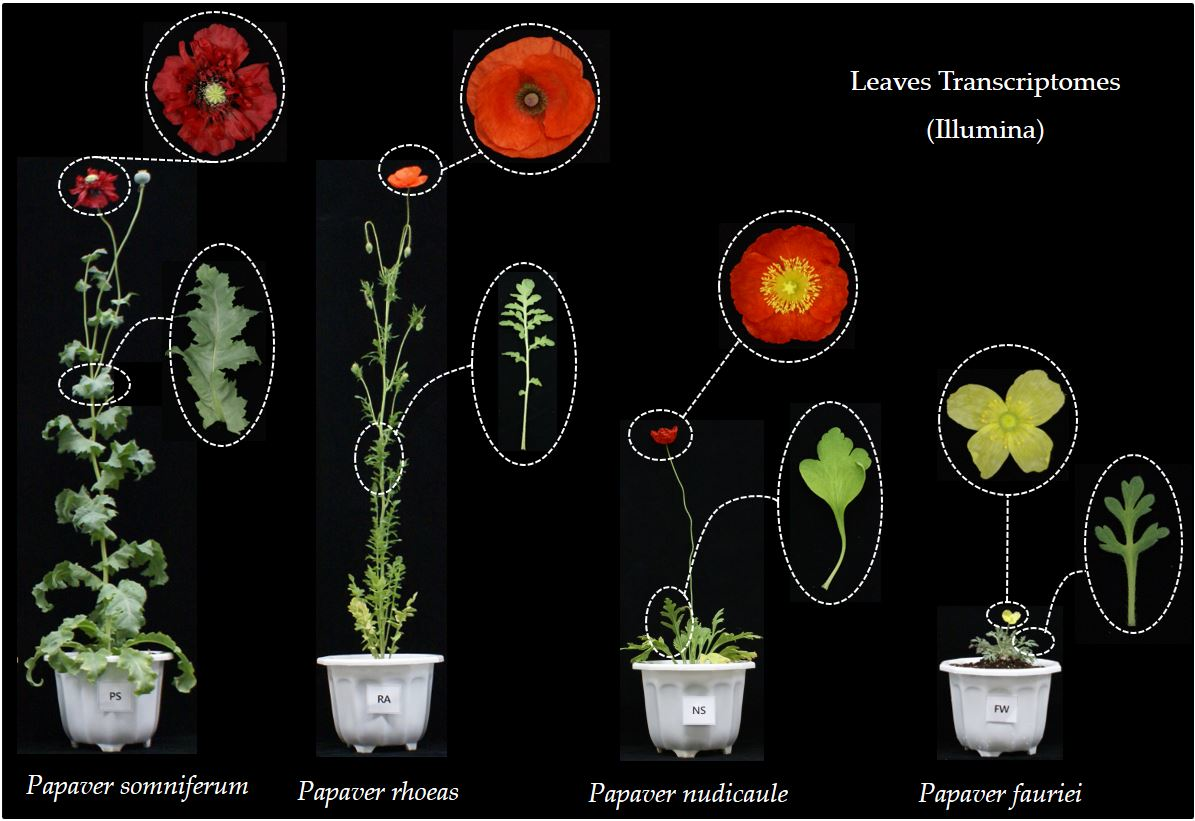
4.1. Plant Samples

Four Papaver species, P. rhoeas (Asia red), P. nudicaule, P. somniferum, and P. fauriei, were grown individually in multiple pots and maintained at 30 °C for 3 months. At three time points (30, 60, and 90 days (and 120 days for P. fauriei only)), individuals were selected for sampling. The leaves of the individual plants were collected for both transcriptome sequencing and targeted metabolomic analyses. The samples collected for transcriptome analysis were immediately frozen in liquid nitrogen and stored at −70 °C in a deep freezer. For each species, the experiments were repeated in triplicate under the same conditions. Phenotypic differences among these plants, i.e., flower color, leaves, and the visual appearance of the plant with flowers, are shown in the Graphical Abstracts.

4.2. Illumina Library Preparation and Sequencing

Total RNA was isolated from the frozen samples using a Qiagen RNA Isolation Kit, and the mRNAs in the total RNA were converted into a library template using the TruSeq RNA Sample Prep Kit v2 (15026495 Rev. F). This procedure included purification, synthesis of the strands, end repair, adapter ligation, and polymerase chain reaction (PCR) enrichment. The enriched libraries were then quantified and used for sequencing with the Illumina Hi-Seq 4000 system. Finally, sequenced reads were processed using sequencing control software, and the outputs were formatted as paired-end fastq files. This entire process was performed by Macrogen Inc. (Seoul, Korea) (http://www.macrogen.com).

4.3. Assembly and Annotation

Total raw reads from each sample underwent preprocessing steps in order to remove contamination, adapter, and low-quality reads using Trimmomatic v0.36 [43]. For each species, the preprocessed reads were assembled using the Trinity v2.2.0 program [44]. After assembly, the following filtering criteria were applied to reduce the assembly artifacts and obtain the full-length transcripts: TPM ≥0.3, reads count ≥5, peptide length ≥75, and full-length status obtained from TransDecoder (https://github.com/TransDecoder/TransDecoder). The selected transcriptomes were annotated with BLAST2GO v.4 [45] using the Plant UniProt database (updated February 2018), with an e-value ≤ 1e-5 and a minimum of 20 sequences with other default values. Ultimately, the completeness of the reference transcriptome was assessed by the BUSCO method using the Embryophyta (ODB9, created date: 13 February 2016) core gene dataset [46].

4.4. LC-QTOF-MS/MS Metabolomic Analysis

First, 2 g of a homogenized leaf sample was taken from the total sample, mixed with 5 mL of ethanol, and subjected to vortexing and sonication to obtain the concentrated (20 mg/mL) extract. Second, the prepared samples were subjected to liquid chromatography–mass spectrometry using a Thermo Scientific Vanquish UHPLC system (ThermoFisher Scientific, Foster City, CA, USA) with a Poroshell 120 PFP (2.1 × 100 mm, 2.7 μm) column (Agilent), and a triple ToF 5600+ mass spectrometer system (Triple ToF MS; SCIEX, Foster City, CA, USA) with a DuosprayTM ion source under universal gradient conditions. This system was calibrated prior to the experiment using blank samples and 18 alkaloid standards (standards provided by Korean Medicine Clinical Trial Center). Furthermore, molecular weight and molecular breakdown information were detected with the aforementioned system and collected using the information dependent acquisition (IDA) scan method in LC-QTOF (HRMS, high-resolution mass spectrometer). Eventually, all of the peaks for each of the standards and similar predictable alkaloid components’ peaks were obtained and annotated with Metlin and isotope MS. All experimental procedures were performed at the Korean Medicine Clinical Trial Center. Multivariate analyses of the data were performed using R.

4.5. Differential Gene Expression

The processed short reads were mapped to the assembled transcriptome using Salmon v0.9.1 [47]. The TPM values obtained from Salmon were subjected to edgeR [48] to obtain the differential expression patterns among individual groups.

4.6. KEGG SMB Proteins

To obtain the existing KEGG SMB transcript profile in the Papaver transcriptome, a KEGG reference dataset was prepared from two major categories of the KEGG pathway database (https://www.genome.jp/kegg/pathway.html), specifically those for the metabolism of terpenoids and polyketides, and those for other SMBs. The complete protein sequences were obtained for these KEGG maps using the following relationships: Maps → KEGG orthologs → Swiss/UniProt. These protein sequences came from the reference dataset for the KEGG database, and were mainly obtained for the characterized genes of the SMB pathway. In the KEGG SMB co-occurrence profiles, heat map color gradients were plotted to represent the normalized values of each KEGG pathway. The values were normalized using the following formula: [number of KEGG KOs with similar transcripts to the reference transcriptome/the total number of KOs in a given pathway] × 100. This normalized value was then plotted on the heat map (KEGG maps versus genomes). In the other co-occurrence profiles, the color codes were represented in a binary manner (present = red; absent = blue).

4.7. Ortholog Analysis and Phylogeny Construction

An ortholog analysis was conducted to compare the sequenced Papaver species to the other two Papaver species (P. bracteatum and P. setigerum) and alkaloid-rich plants (M. cordata, Nelumbo nucifera, Aquilegia coerulea, E. californica, and A. thaliana). The complete protein sequences from these genomes were trimmed based on the length of the sequence (between 10 and 3000 amino acids (AA)). These selected sequences were subjected to an ortholog analysis using the OrthoMCL [49] method with default parameters. Single-copy genes were then aligned using the MAFFT v7.2 [50] program with default parameters. Multiple alignments were initially corrected using the Gblocks v0.91 program [51], and were then used to construct a phylogenetic tree with IQ-TREE v1.5.0 [52]. Finally, the tree was imported to FigTree v1.4.3. (http://tree.bio.ed.ac.uk/software/figtree/).

4.8. Cytochrome Family Analysis

To obtain the complete cytochrome profiles, the transcriptomes were subjected to three types of search: ortholog (OrthoMCL), cluster database at high identity with tolerance (CD-HIT [53]), and profile searches (HMMER [54]). In the ortholog and clustering analyses, the complete transcripts were compared with the CYPED (https://cyped.biocatnet.de/) [55] database, and the PF00067 pre-build hidden Markov model (HMM) profiles for the cytochrome profiles were searched for in the complete transcriptome. The full-length cytochrome transcripts were then obtained using the Transdecoder method (https://github.com/TransDecoder/TransDecoder). The full-length cytochromes were further compared to the other selected genomes from the ortholog and clustering methods. Finally, the full-length cytochromes were named based on their numbers in the CYPED superfamily.

4.9. Data Submission

The complete mRNA sequences were submitted to the GenBank-SRA repository under the Project ID PRJNA476004.

5. Conclusions

In this study, we provided differential expression profiles between Papaver developmental stages and BIA metabolite profiles, along with the cytochrome and SM annotations for the assembled transcripts with reference to the KEGG pathway database. This dataset could be useful for researchers working on detailed characterizations of BIA biosynthesis pathways in Papaver species. Furthermore, these RNA-Seq libraries could provide information useful for re-annotating the Papaver species’ genomes.

Supplementary Materials

Supplementary materials can be found at https://www.mdpi.com/2306-5729/3/4/55/s1.

Author Contributions

Conceptualization, D.K., J.O., and M.J.; Methodology, D.K., I.J.H., M.Y.L., S.-G.L., and S.S.; Formal Analysis, Y.S. and D.K.; Resources, D.K. and J.O.; Data Curation, Y.S., M.Y.L., I.J.H., S.-G.L., and S.S; Writing (Original Draft Preparation), J.O., S.S., M.J., and D.K.

Funding

This study was performed with the support of the National Academy of Agricultural Science (Grant No. PJ01184701), Rural Development Administration, Republic of Korea.

Conflicts of Interest

The authors have declared no conflicts of interest.

References

  1. Trang, T.; Al-Hasani, R.; Salvemini, D.; Salter, M.W.; Gutstein, H.; Cahill, C.M. Pain and Poppies: The Good, the Bad, and the Ugly of Opioid Analgesics. J. Neurosci. 2015, 35, 13879–13888. [Google Scholar] [CrossRef] [PubMed]
  2. Dias, D.A.; Urban, S.; Roessner, U. A Historical Overview of Natural Products in Drug Discovery. Metabolites 2012, 2, 303–336. [Google Scholar] [CrossRef] [PubMed]
  3. Veeresham, C. Natural products derived from plants as a source of drugs. J. Adv. Pharm. Technol. Res. 2012, 3, 200–201. [Google Scholar] [CrossRef] [PubMed]
  4. Jamshidi-Kia, F.; Lorigooini, Z.; Amini-Khoei, H. Medicinal plants: Past history and future perspective. J. Herbmed. Pharmacol. 2018, 7, 1–7. [Google Scholar] [CrossRef] [Green Version]
  5. Mathiyalagan, R.; Yang, D.C. Ginseng nanoparticles: A budding tool for cancer treatment. Nanomedicine 2017, 12, 1091–1094. [Google Scholar] [CrossRef] [PubMed]
  6. Knutsen, H.K.; Alexander, J.; Barregård, L.; Bignami, M.; Brüschweiler, B.; Ceccatelli, S.; Cottrill, B.; Dinovi, M.; Edler, L.; Grasl-Kraupp, B.; et al. Update of the Scientific Opinion on opium alkaloids in poppy seeds. EFSA J. 2018, 16, e05243. [Google Scholar]
  7. Barceloux, D.G. Heroin and the Opium Poppy Plant (Papaver somniferum L.). In Medical Toxicology of Drug Abuse; John Wiley & Sons, Inc.: Hoboken, NJ, USA, 2012; pp. 546–578. [Google Scholar] [CrossRef]
  8. Bernath, J. Poppy: The Genus Papaver; Harwood Academic Publishers: London, UK, 1999; Volume 3, p. 390. [Google Scholar]
  9. Winzer, T.; Kern, M.; King, A.J.; Larson, T.R.; Teodor, R.I.; Donninger, S.L.; Li, Y.; Dowle, A.A.; Cartwright, J.; Bates, R.; et al. Morphinan biosynthesis in opium poppy requires a P450-oxidoreductase fusion protein. Science 2015, 349, 309–312. [Google Scholar] [CrossRef] [PubMed]
  10. Galanie, S.; Thodey, K.; Trenchard, I.J.; Filsinger Interrante, M.; Smolke, C.D. Complete biosynthesis of opioids in yeast. Science 2015, 349, 1095–1100. [Google Scholar] [CrossRef] [PubMed] [Green Version]
  11. Li, Y.; Smolke, C.D. Engineering biosynthesis of the anticancer alkaloid noscapine in yeast. Nat. Commun. 2016, 7, 12137. [Google Scholar] [CrossRef] [PubMed] [Green Version]
  12. Guo, L.; Winzer, T.; Yang, X.; Li, Y.; Ning, Z.; He, Z.; Teodor, R.; Lu, Y.; Bowser, T.A.; Graham, I.A.; et al. The opium poppy genome and morphinan production. Science 2018. [Google Scholar] [CrossRef] [PubMed]
  13. Garcia, S.; Leitch, I.J.; Anadon-Rosell, A.; Canela, M.Á.; Gálvez, F.; Garnatje, T.; Gras, A.; Hidalgo, O.; Johnston, E.; Mas de Xaxars, G.; et al. Recent updates and developments to plant genome size databases. Nucleic Acids Res. 2014, 42, D1159–D1166. [Google Scholar] [CrossRef] [PubMed]
  14. Srivastava, S.; Lavania, U.C. Evolutionary DNA variation in Papaver. Genome 1991, 34, 763–768. [Google Scholar] [CrossRef]
  15. Boke, H.; Ozhuner, E.; Turktas, M.; Parmaksiz, I.; Ozcan, S.; Unver, T. Regulation of the alkaloid biosynthesis by miRNA in opium poppy. Plant Biotechnol. J. 2015, 13, 409–420. [Google Scholar] [CrossRef] [PubMed] [Green Version]
  16. Desgagné-Penix, I.; Farrow, S.C.; Cram, D.; Nowak, J.; Facchini, P.J. Integration of deep transcript and targeted metabolite profiles for eight cultivars of opium poppy. Plant Mol. Boil. 2012, 79, 295–313. [Google Scholar] [CrossRef] [PubMed]
  17. Desgagné-Penix, I.; Khan, M.F.; Schriemer, D.C.; Cram, D.; Nowak, J.; Facchini, P.J. Integration of deep transcriptome and proteome analyses reveals the components of alkaloid metabolism in opium poppy cell cultures. BMC Plant Boil. 2010, 10, 252. [Google Scholar] [CrossRef] [PubMed]
  18. Pathak, S.; Lakhwani, D.; Gupta, P.; Mishra, B.K.; Shukla, S.; Asif, M.H.; Trivedi, P.K. Comparative Transcriptome Analysis Using High Papaverine Mutant of Papaver somniferum Reveals Pathway and Uncharacterized Steps of Papaverine Biosynthesis. PLoS ONE 2013, 8, e65622. [Google Scholar] [CrossRef] [PubMed]
  19. Oh, J.; Shin, Y.; Ha, I.; Lee, M.; Lee, S.-G.; Kang, B.-C.; Kyeong, D.; Kim, D. Transcriptome Profiling of Two Ornamental and Medicinal Papaver Herbs. Int. J. Mol. Sci. 2018, 19, 3192. [Google Scholar] [CrossRef] [PubMed]
  20. Nelson, D.R. Cytochrome P450 diversity in the tree of life. Biochim. Biophys. Acta (BBA) Proteins Proteom. 2018, 1866, 141–154. [Google Scholar] [CrossRef] [PubMed]
  21. Nelson, D.; Werck-Reichhart, D. A P450-centric view of plant evolution. Plant J. 2011, 66, 194–211. [Google Scholar] [CrossRef] [PubMed]
  22. Kanehisa, M. KEGG Bioinformatics Resource for Plant Genomics and Metabolomics. In Plant Bioinformatics: Methods and Protocols; Edwards, D., Ed.; Springer: New York, NY, USA, 2016; pp. 55–70. [Google Scholar] [CrossRef]
  23. Dastmalchi, M.; Park, M.R.; Morris, J.S.; Facchini, P. Family portraits: The enzymes behind benzylisoquinoline alkaloid diversity. Phytochem. Rev. 2018, 17, 249–277. [Google Scholar] [CrossRef]
  24. Durst, F.; Nelson David, R. Diversity and Evolution of Plant P450 and P450-Reductases. Drug Metab. Drug Interact. 1995, 12, 189–206. [Google Scholar] [CrossRef]
  25. Liao, W.; Zhao, S.; Zhang, M.; Dong, K.; Chen, Y.; Fu, C.; Yu, L. Transcriptome Assembly and Systematic Identification of Novel Cytochrome P450s in Taxus chinensis. Front. Plant Sci. 2017, 8, 1468. [Google Scholar] [CrossRef] [PubMed]
  26. Wickett, N.J.; Mirarab, S.; Nguyen, N.; Warnow, T.; Carpenter, E.; Matasci, N.; Ayyampalayam, S.; Barker, M.S.; Burleigh, J.G.; Gitzendanner, M.A.; et al. Phylotranscriptomic analysis of the origin and early diversification of land plants. Proc. Natl. Acad. Sci. USA 2014, 111, E4859. [Google Scholar] [CrossRef] [PubMed]
  27. Devi, B.S.R.; Kim, Y.-J.; Sathiyamoorthy, S.; Khorolragchaa, A.; Gayathri, S.; Parvin, S.; Yang, D.-U.; Selvi, S.K.; Lee, O.R.; Lee, S.; et al. Classification and characterization of putative cytochrome P450 genes from Panax ginseng C. A. Meyer. Biochemistry 2011, 76, 1347–1359. [Google Scholar] [CrossRef] [PubMed]
  28. Subramaniyam, S.; Mathiyalagan, R.; Natarajan, S.; Kim, Y.-J.; Jang, M.-G.; Park, J.-H.; Yang, D.C. Transcript expression profiling for adventitious roots of Panax ginseng Meyer. Gene 2014, 546, 89–96. [Google Scholar] [CrossRef] [PubMed]
  29. Hagel, J.M.; Morris, J.S.; Lee, E.-J.; Desgagné-Penix, I.; Bross, C.D.; Chang, L.; Chen, X.; Farrow, S.C.; Zhang, Y.; Soh, J.; et al. Transcriptome analysis of 20 taxonomically related benzylisoquinoline alkaloid-producing plants. BMC Plant Boil. 2015, 15, 227. [Google Scholar] [CrossRef] [PubMed]
  30. Liu, X.; Liu, Y.; Huang, P.; Ma, Y.; Qing, Z.; Tang, Q.; Cao, H.; Cheng, P.; Zheng, Y.; Yuan, Z.; et al. The Genome of Medicinal Plant Macleaya cordata Provides New Insights into Benzylisoquinoline Alkaloids Metabolism. Mol. Plant 2017, 10, 975–989. [Google Scholar] [CrossRef] [PubMed]
  31. Hori, K.; Yamada, Y.; Purwanto, R.; Minakuchi, Y.; Toyoda, A.; Hirakawa, H.; Sato, F. Mining of the Uncharacterized Cytochrome P450 Genes Involved in Alkaloid Biosynthesis in California Poppy Using a Draft Genome Sequence. Plant Cell Physiol. 2018, 59, 222–233. [Google Scholar] [CrossRef] [PubMed]
  32. Saini, S.; Sharma, I.; Pati, P.K. Versatile roles of brassinosteroid in plants in the context of its homoeostasis, signaling and crosstalks. Front. Plant Sci. 2015, 6, 950. [Google Scholar] [CrossRef] [PubMed]
  33. Moses, T.; Pollier, J.; Thevelein, J.M.; Goossens, A. Bioengineering of plant (tri)terpenoids: From metabolic engineering of plants to synthetic biology in vivo and in vitro. New Phytol. 2013, 200, 27–43. [Google Scholar] [CrossRef] [PubMed]
  34. Gutensohn, M.; Klempien, A.; Kaminaga, Y.; Nagegowda, D.A.; Negre-Zakharov, F.; Huh, J.-H.; Luo, H.; Weizbauer, R.; Mengiste, T.; Tholl, D.; et al. Role of aromatic aldehyde synthase in wounding/herbivory response and flower scent production in different Arabidopsis ecotypes. Plant J. 2011, 66, 591–602. [Google Scholar] [CrossRef] [PubMed] [Green Version]
  35. Morant, M.; Jørgensen, K.; Schaller, H.; Pinot, F.; Møller, B.L.; Werck-Reichhart, D.; Bak, S. CYP703 Is an Ancient Cytochrome P450 in Land Plants Catalyzing in-Chain Hydroxylation of Lauric Acid to Provide Building Blocks for Sporopollenin Synthesis in Pollen. Plant Cell 2007, 19, 1473–1487. [Google Scholar] [CrossRef] [PubMed] [Green Version]
  36. Irmisch, S.; Clavijo McCormick, A.; Günther, J.; Schmidt, A.; Boeckler, G.A.; Gershenzon, J.; Unsicker, S.B.; Köllner, T.G. Herbivore-induced poplar cytochrome P450 enzymes of the CYP71 family convert aldoximes to nitriles which repel a generalist caterpillar. Plant J. 2014, 80, 1095–1107. [Google Scholar] [CrossRef] [PubMed] [Green Version]
  37. Pinot, F.; Beisson, F. Cytochrome P450 metabolizing fatty acids in plants: Characterization and physiological roles. FEBS J. 2010, 278, 195–205. [Google Scholar] [CrossRef] [PubMed]
  38. Li, N.; Xu, C.; Li-Beisson, Y.; Philippar, K. Fatty Acid and Lipid Transport in Plant Cells. Trends Plant Sci. 2016, 21, 145–158. [Google Scholar] [CrossRef] [PubMed] [Green Version]
  39. Mei, W.; Qin, Y.; Song, W.; Li, J.; Zhu, Y. Cotton GhPOX1 encoding plant class III peroxidase may be responsible for the high level of reactive oxygen species production that is related to cotton fiber elongation. J. Genet. Genom. 2009, 36, 141–150. [Google Scholar] [CrossRef]
  40. Zhong, R.; Morrison, W.H.; Himmelsbach, D.S.; Poole, F.L.; Ye, Z.-H. Essential Role of Caffeoyl Coenzyme A O-Methyltransferase in Lignin Biosynthesis in Woody Poplar Plants. Plant Physiol. 2000, 124, 563–578. [Google Scholar] [CrossRef] [PubMed] [Green Version]
  41. Yoon, J.; Choi, H.; An, G. Roles of lignin biosynthesis and regulatory genes in plant development. J. Integr. Plant Boil. 2015, 57, 902–912. [Google Scholar] [CrossRef] [PubMed] [Green Version]
  42. Deng, Y.; Lu, S. Biosynthesis and Regulation of Phenylpropanoids in Plants. Crit. Rev. Plant Sci. 2017, 36, 257–290. [Google Scholar] [CrossRef]
  43. Bolger, A.M.; Lohse, M.; Usadel, B. Trimmomatic: A flexible trimmer for Illumina sequence data. Bioinformatics 2014, 30, 2114–2120. [Google Scholar] [CrossRef] [PubMed]
  44. Haas, B.J.; Papanicolaou, A.; Yassour, M.; Grabherr, M.; Blood, P.D.; Bowden, J.; Couger, M.B.; Eccles, D.; Li, B.; Lieber, M.; et al. De novo transcript sequence reconstruction from RNA-Seq: Reference generation and analysis with Trinity. Nat. Protoc. 2013, 8. [Google Scholar] [CrossRef] [PubMed]
  45. Conesa, A.; Götz, S. Blast2GO: A Comprehensive Suite for Functional Analysis in Plant Genomics. Int. J. Plant Genom. 2008, 2008, 619832. [Google Scholar] [CrossRef] [PubMed]
  46. Waterhouse, R.M.; Seppey, M.; Simão, F.A.; Manni, M.; Ioannidis, P.; Klioutchnikov, G.; Kriventseva, E.V.; Zdobnov, E.M. BUSCO Applications from Quality Assessments to Gene Prediction and Phylogenomics. Mol. Boil. Evol. 2018, 35, 543–548. [Google Scholar] [CrossRef] [PubMed]
  47. Patro, R.; Duggal, G.; Love, M.I.; Irizarry, R.A.; Kingsford, C. Salmon provides fast and bias-aware quantification of transcript expression. Nat. Methods 2017, 14, 417. [Google Scholar] [CrossRef] [PubMed]
  48. Robinson, M.D.; McCarthy, D.J.; Smyth, G.K. edgeR: A Bioconductor package for differential expression analysis of digital gene expression data. Bioinformatics 2010, 26, 139–140. [Google Scholar] [CrossRef] [PubMed]
  49. Li, L.; Stoeckert, C.J.; Roos, D.S. OrthoMCL: Identification of Ortholog Groups for Eukaryotic Genomes. Genome Res. 2003, 13, 2178–2189. [Google Scholar] [CrossRef] [PubMed]
  50. Yamada, K.D.; Tomii, K.; Katoh, K. Application of the MAFFT sequence alignment program to large data—Reexamination of the usefulness of chained guide trees. Bioinformatics 2016, 32, 3246–3251. [Google Scholar] [CrossRef] [PubMed]
  51. Talavera, G.; Castresana, J. Improvement of Phylogenies after Removing Divergent and Ambiguously Aligned Blocks from Protein Sequence Alignments. Syst. Boil. 2007, 56, 564–577. [Google Scholar] [CrossRef] [PubMed] [Green Version]
  52. Nguyen, L.-T.; Schmidt, H.A.; von Haeseler, A.; Minh, B.Q. IQ-TREE: A Fast and Effective Stochastic Algorithm for Estimating Maximum-Likelihood Phylogenies. Mol. Boil. Evol. 2015, 32, 268–274. [Google Scholar] [CrossRef] [PubMed]
  53. Fu, L.; Niu, B.; Zhu, Z.; Wu, S.; Li, W. CD-HIT: Accelerated for clustering the next-generation sequencing data. Bioinformatics 2012, 28, 3150–3152. [Google Scholar] [CrossRef] [PubMed]
  54. Eddy, S.R. Accelerated Profile HMM Searches. PLoS Comput. Boil. 2011, 7, e1002195. [Google Scholar] [CrossRef] [PubMed]
  55. Gricman, Ł.; Vogel, C.; Pleiss, J. Identification of universal selectivity-determining positions in cytochrome P450 monooxygenases by systematic sequence-based literature mining. Proteins Struct. Funct. Bioinform. 2015, 83, 1593–1603. [Google Scholar] [CrossRef] [PubMed]
Figure 1. The systematic bioinformatics analysis to identify the secondary metabolite biosynthesis (SMB) and cytochrome transcripts in the transcriptome of Papaver spp. leaves. The transcriptomes and genomes from 11 plants of the four Papaver species sequenced in this study (red), two Papaver spp. transcriptomes from the NCBI sequence read archive (SRA) repository (black), and four alkaloid-rich genomes and the genome of the model plant Arabidopsis (black) from the NCBI Assembly Repository, were all sequenced. This pipeline was used to assemble and estimate the species-specific and differential transcript expressions of three Papaver developmental stages, and to obtain the cytochrome and KEGG SMB pathway coverage profiles from the assembled transcriptomes. The software and filter criteria used are given in their respective places in the pipeline. The plants listed are Papaver rhoeas (PR), P. nudicaule (PN), P. fauriei (PF), P. somniferum (PS), Papaver bracteatum (PB), Papaver setigerum (PSS), Macleaya cordata (MC), Aquilegia coerulea (AC), Eschscholzia californica (EC), Nelumbo nucifera (NN), and Arabidopsis thaliana (AT). Herein, AT and NN were used as outgroups for the phylogenetic reconstruction. The dotted blue lines represent the direct link between each source and the outputs derived from it. BUSCO, benchmarking universal single-copy ortholog; DEG, differentially expressed gene.
Data 03 00055 g001
Figure 2. Summaries of species-specific and stage-specific differential expression of transcripts in each category: (A) species-specific expression summary; (B) Benzylisoquinoline alkaloid (BIA) transcripts’ differential expression at the developmental stages; (C) summary of complete differentially expressed genes (DEGs); (D) cytochrome DEGs; (E) secondary metabolite biosynthesis (SMB) transcript DEGs. The abbreviations are: Papaver rhoeas (PR), P. nudicaule (PN), P. fauriei (PF), and P. somniferum (PS). The cutoffs used to determine the up- and downregulated transcripts were log2FC ≥1, transcripts per million (TPM) ≥0.3, and reads count ≥5.
Data 03 00055 g002
Figure 3. Complete cytochrome transcriptome profiles were derived from a clustering analysis using the cluster database at high identity with the tolerance (CD-HIT) method and plotted on a co-occurrence heat map to assess the species-specific and common cytochromes. Here, 540 peptides (483 transcripts) are grouped into cytochrome superfamilies from the CYPED database. Some CYPs have multiple numbers, which indicates that the cluster contains the sequences from two superfamilies. For example, CYP71.736 means that this cluster has two superfamily sequences from the CYPED database, specifically CYP71 and CYP736. Color code: red is present, and blue is absent. The CD-HIT method included most of the predicted transcripts from the other two methods (ortholog and profile search methods), as shown in Supplementary Figure S3.
Data 03 00055 g003
Figure 4. Complete secondary metabolite biosynthesis (SMB) pathway coverage profiles, which were derived from an ortholog analysis using the OrthoMCL method and plotted on a co-occurrence heat map. The 2700 transcripts are grouped into 53 KEGG maps. Initially, the transcripts were linked to their KEGG ortholog (KO) sequences, and these orthologs were connected to the KEGG pathways. The coverage of each pathway was calculated and plotted as a percentage (from 0 to 100%). The coverage was calculated using the formula: coverage per each KEGG map = [number of KOs present in transcriptome/total number of KOs] × 100.
Data 03 00055 g004
Figure 5. Overview of the benzylisoquinoline alkaloid biosynthesis pathway (map00950). This heat map includes 183 transcripts with 27 KEGG orthologs (KOs). Transcripts were linked to KOs by assessing the sequence similarity between the KOs and Papaver transcripts, which were obtained from the ortholog analysis. The expression of different components is shown on the heat map in red (transcripts present) and blue (transcripts absent); this information was obtained from the ortholog clusters.
Data 03 00055 g005
Figure 6. LC-QTOF-MS/MS targeted metabolite profiles for 22 metabolites in the benzylisoquinoline alkaloid biosynthesis pathway (map00950). A. Total metabolite content from each plant developmental stage; the dots are outliers, which were identified by the test statistics of the geom_boxplot function in ggplot.; B. Individual metabolite expression profiles from the Papaver species, which were sequenced in this study. Plant species are: Papaver rhoeas (PR), P. nudicaule (PN), P. fauriei (PF), and P. somniferum (PS).
Data 03 00055 g006
Table 1. A summary of the sequencing, assembly, and annotation procedures performed for four Papaver species.
SpeciesPapaver rhoeas (PR)Papaver nudicaule (PN)Papaver fauriei (PF)Papaver somniferum (PS)
Sequenced bases (Gb)69.92 (Gb)61.32 (Gb)78.76 (Gb)54.79 (Gb)
Assembled transcripts (Mb)434,296 (267 Mb)203,097 (157 Mb)280,706 (206 Mb)219,124 (183 Mb)
Selected transcripts (Mb)27,973 (49 Mb)26,371 (50 Mb)34,294 (60 Mb)32,598 (65 Mb)
Blast hits (%)22,041 (78.8%)21,664 (82.2%)27,263 (79.5%)26,872 (82.4%)
Table 2. Summaries of the cytochrome superfamilies that were identified in the Papaver leaves’ transcriptome that participate in the secondary metabolite biosynthesis pathway.
MapPathwayCYP Superfamilies
map00905Brassinosteroid biosynthesisCYP716, CYP749, CYP92, CYP90, CYP724
map00904Diterpenoid biosynthesisCYP701, CYP708.87, CYP82
map00950Isoquinoline alkaloid biosynthesisCYP719, CYP80, CYP82
map00906Carotenoid biosynthesisCYP97, CYP707
map00940Phenylpropanoid biosynthesisCYP84, CYP73
map00460Cyanoamino acid metabolismCYP79
map00966Glucosinolate biosynthesisCYP79
map00941Flavonoid biosynthesisCYP75

