Abstract
The current economical recovery is driven by expansions in many countries, with a global economic growth of 3.6% in 2017. However, some countries are still struggling with vulnerable forms of employment and high unemployment rates. Official statistics in Spain reveal that women and older people constitutes the core of structural unemployment, and are persistently being excluded from employment recovery. This paper contributes with a database that includes jobseekers’ characteristics, enrollment on training initiatives for unemployed and employment contracts for the Valencian region in Spain. Analysing the relation between the involved variables can help researchers to shed light on which characteristics are positively related to employment and then encourage political decision makers to promote initiatives to support vulnerable groups.
Dataset License: CC BY-NC-ND
1. Introduction
According to the most recent national survey carried out by the Spanish Social Research Centre (CIS) on the three main problems stated by Spanish people, 60.7% of respondents indicate that unemployment was one of the most concerning issues. The second most cited problem was corruption and fraud (25.2%). The large difference between unemployment and the other issues pointed out by respondents give insight about current worries for Spanish people, even after taking into account that the unemployment rate declined from 25.77% in 2012 to 16.1% in 2018.
Spanish economy was one of the most affected between EU countries during the financial crisis of 2008 and employment figures were seriously damaged, particularly because of the bursting of the real estate bubble. A decade after one of the biggest crises of the century, the Spanish economy continues to move forward to get out of the economic downturn and recover the welfare and quality of life prior to the crisis. Although a multitude of economic indicators have improved during the last years, unemployment rates are still among the highest in the EU context. According to data from the Spanish Labor Force Survey (Encuesta de Población Activa, EPA), today there are almost twice as many unemployed in Spain as ten years ago. The unemployment rate in 2007 was 8.57%, while today it is almost double that figure. Furthermore, official statistics also remark that unemployment is not distributed homogeneously across regions, age, gender or educational level. Figure 1 depicts how the unemployment rate has evolved in Spain over the last 15 years. The top-left picture shows remarkable differences regarding gender. We can see how women were disfavoured before the 2008 financial crisis, with a gap of 5 points on average compared to men. The crisis alleviated this gap, but the difference between women and men is increasing steadily once the economic recovery is initiated. This situation is mainly explained by those unemployed between 25 and 54 years old (bottom-left picture). We observe no significant difference regarding the unemployment rate between younger (under 25, top-right picture) and older (55 or more, bottom-right picture) people. All in all, people under 25 years old remain as the most vulnerable group, despite its employment recovery is more significant compared to other groups.
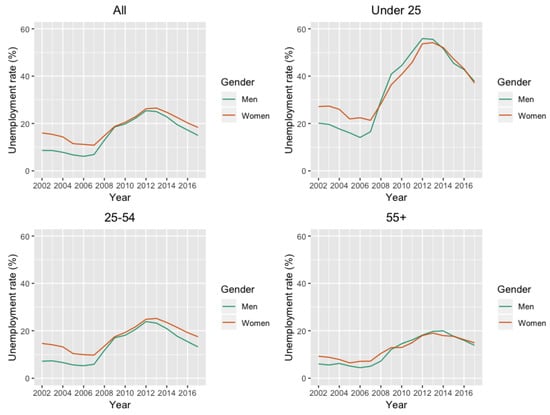
Figure 1.
Evolution of the unemployment rate in Spain. Differences regarding gender and age.
Regarding geographical differences, the Valencian region located in the east coast of the country was one of the most seriously affected by the bursting of the real estate bubble, and still remains among the highest unemployed areas.
Spain has some idiosyncratic particularities which differentiate its labour market behaviour from other markets. For example, Jimeno and Bentolila [1] show that regional wages and relative unemployment are very persistent in Spain compared with the USA and the rest of European countries. Ahn et al. [2] found that Spanish unemployed workers’ willingness to move for work is lower compared with other countries. Another intesting point is the relation between the unemployed and his/her family. Ahn and Ugidos-Olazabal [3] find that family connections in the labour market are important determinants of unemployment duration in Spain. Household heads are much faster in finding a job than non-heads. Recently, Guijarro [4] estimates the relation between the individual’s employment probabilities and her/his participation in active-labour activities promoted by public employment services. The author uses a probit regression model to show that some groups are still persistently excluded from economic and employment recovery. Based on a large official employment database, the paper concludes that people aged 55 and older and females constitute the most vulnerable groups. Only those women with higher education increase their probability of finding a job. Regarding the age, it is worth mentioning the recent initiative on youth unemployment project and dataset CUPESSE (Cultural pathways to economic self-sufficiency and entrepreneurship). This dataset (https://dbk.gesis.org/dbksearch/sdesc2.asp?no=7475&db=e&doi=10.4232/1.13042) is introduced by [5], where the authors show that “there exist numerous and remarkable differences in the socio-economic situation of young people and their parents in Europe, in particular the significant differences with regard to economic self-sufficiency across the two generations”.
Regarding how employment policies and training initiatives can help unemployed, ref. [6] analyse the impact of structural policies and institutions on aggregate unemployment in OECD countries. The research reveals that employment policies play a major role in shaping unemployment patterns. Changes in policies and institutions explain almost two thirds of non-cyclical unemployment changes. However, macroeconomic conditions also matter: negative productivity shocks, deterioration in the terms of trade, increases in long-term real interest rates and negative labour demand shocks are found to increase aggregate unemployment. Recently, ref. [7] analyse how personal characteristics influence formal lifelong learning in 21 European countries. According to these authors, “formal lifelong learning incidence is significantly higher among young, better educated, part-time and temporary workers, and lower among those who changed current job in the last year, employed in small firms and having low-skilled occupations”. Using a dataset drawn from a survey of Thai employees, ref. [8] analyse the relationship between education and employer-provided training, both on-the-job and off-the-job. The authors find a negative relationship between educational attainment and on-the-job training, but a positive relationship between education and off-the-job training. Authors argue that better educated employees have higher marginal costs, maybe because the opportunity costs of the time spent receiving on-the-job training increase with educational attainment.
It is worth mentioning that another way to exit from unemployment is self-employment. Interested readers can refer to [9].
From a macro-level perspective, an interesting line of economic research focuses on how training human capital is crucial in determining innovation activity and the growth rate of an Economy. This way, a possible complementarity between human capital investment and innovation is suggested in [10]. This could explain why firms investing in employee training have higher innovation intensity. On the same line, ref. [11] points out that the main consequence of the complementarity between on-the-job training and R&D investment is the inefficiency in the supply of training. Otherwise, complementarity between human capital and R&D causes the multiplicity of equilibria in growth rate and the low development traps. The same author shows, by extending the research of [10], that human capital composition is important in determining the probability of innovation and the economy’s growth rate [12]. The results demonstrate that technology-general training avoids low development traps when R&D is absent. Another interesting link between training and new technology investment is suggested by [13]. This author finds that employees do not have the right incentives to invest in general training because they assume that part of the productivity gains obtained through training will be ultimately captured by employers. In addition, the inefficiency of training increases when there are investments in technology complementary to the skills of the worker.
This paper aims to provide a large official database on unemployed people [14], focusing on some aspects that could explain the key drivers to success in the job search process. The database cover a period of 4 years (from the beginning of 2012 to the end of 2015), and gives insight about active labour market initiatives in the Valencian region, one of the worst-affected areas regarding unemployment in Spain [4]. The database can help to determine the characteristics of unemployed people in this region, and encourage political decision makers to support those initiatives aligned with the improvement of conditions for vulnerable groups regarding unemployment. All tables comprising the database are delivered in R format. Figures, tables and econometrical models have also been computed using R software [15]. Figures were designed by using the ggplot library [16].
The paper is organised as follows. Section 2 describes in a detailed way the structure of the database and how tables relate to each other. Section 3 is devoted to illustrate the use of the database through a probit model that explains the job search success of Valencian unemployed people. The paper ends with a brief summary of conclusions.
2. Data Description
This section describes the tables included in the database, and highlights those fields or variables which are related to a variable in another table.
The information was gathered from different public institutions related to the Valencian government and encompasses a 4-year period: from the beginning of 2012 to the end of 2015. Note that the information gathered regarding unemployed people is not a sample, but the whole population. Consequently, it corresponds to those that were unemployed during the analysed period in the Valencian region. This period begins when the highest unemployment rate after the financial crisis in 2008 and ends with the emergence of the economical and job recovery in Spain. Therefore, the database can shed light on the relation between job searching success and some characteristics of the unemployed, namely age, gender, educational level, training courses attendance, etc.
The database is composed by 12 tables as depicted in Figure 2. Those unfamiliar with entity-relationship modeling can refer to [17]. The biggest ones are job_seekers, sepe and actions. All these tables include the variable id which identifies the unemployed person considered in the research. While the identity card number was originally included in the database, this variable has eventually been modified to preserve the anonymity of sample participants.
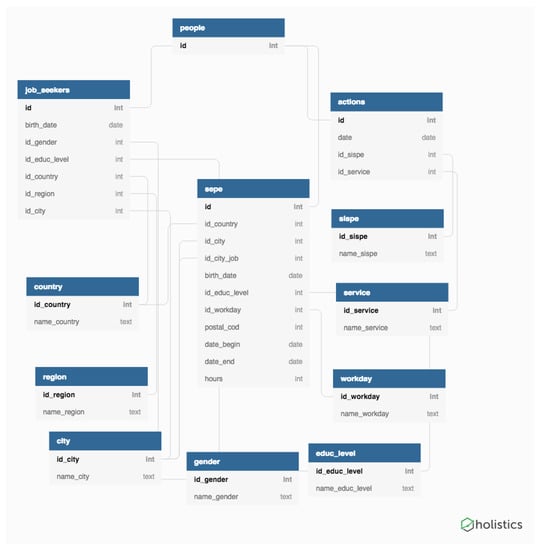
Figure 2.
Database diagram.
Table job_seekers includes information regarding unemployed people searching for a job in the Valencian region. The public institution in charge of registering unemployed people on this region is SERVEF (Servicio Valenciano de Empleo y Formación, Employment and Training Valencian Service), which also offers training courses focused on the improvement of employment prospects. The SERVEF manages employment and training policies for employment, and serves to connect supply and demand in the Valencian labour market. This public institution is responsible for the implementation of policies of the Valencian Government in terms of: intermediation in the labour market, job training, vocational training for employment, and employment promotion. Variables in job_seekers include information related with unemployed: birth date, gender, educational level, home country, home region and home city. All variables but birth date are related to other minor tables in the database, as indicated by those lines connecting tables.
One-to-many relationships between tables A and B are depicted with a 1 in the extreme on the line connecting with table A and a * in the extreme connecting with table B. This indicates that each record in table A may have many linked records in table B. A one-to-one relationship is depicted with a 1 in both extremes of the line. In this case both tables are associated with each other based on only one matching row.
As an illustrative example, the distribution of the educational level for jobseekers appears in Table 1. We can observe some significant differences regarding the educational level of females and males. Men have a higher proportion in low educational levels (58.5% of people with no educational level are men, while 55.2% have attended the primary school). On the other side, women’s share is much more significant in higher education with a proportion around 60% in bachelor, master and doctoral degrees.

Table 1.
Distribution of jobseekers’ educatinal level. Differences regarding gender.
Table sepe in Figure 2 comes from the Spanish Service for Employment (Servicio Público de Empleo Estatal, SEPE), and includes information related with employment contracts. The SEPE is a national institution in charge of registering all employment contracts. It also prepares the statistics on demand and supply of employment, job recruitment procedures, unemployment benefits, and conducts research on the labour market. Each observation in sepe includes the identification of the person employed, birth date, educational level, home country, home city, working city, educational level, working day status, beginning and end date of the contract, and the total hours for temporary contracts. As in the case of job_seekers, those variables with the prefix id link to other minor tables.
Finally, table actions in Figure 2 relates to those training initiatives organised by the SERVEF in which the unemployed were enrolled. These courses take part of the unemployment benefits and are aimed to improve the employment prospects of jobseekers. The topics covered by these training courses and their duration are very diverse, but academics agree on the positive relation between attending to these courses and the probability of exiting unemployment [18,19,20,21]. Variables id_sispe and id_service refer to tables sispe and service, respectively. These tables contain the names of the training services offered by the SERVEF to unemployed.
Regarding the size of the sample, Figure 3 shows the number of different people included in each table along with the people in common with other tables. We have to remark that all people in table actions is also in table jobseekers, because any person attending to actions promoted by the SERVEF must be first registered as a jobseeker. Altogether the number of participants enrolled in actions promoted by SERVEF was 838,643 people. Of those, 429,720 succeed in finding a job (and then, their contracts were registered in table sepe), while 345,923 correspond to unsuccessful people regarding employment search (so not present in sepe). All these 838,643 people were involved in 2,979,665 training activities, which implies that every person was enrolled in 3.55 activities in average.
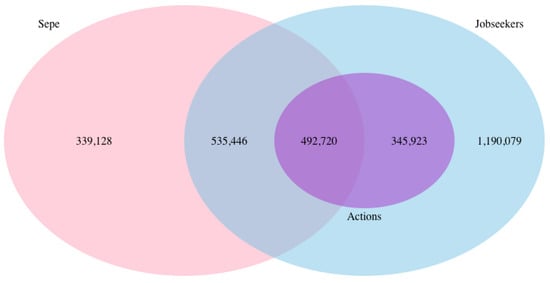
Figure 3.
Distribution of individuals in the 3 main databases: sepe, jobseekers and actions.
Table sepe includes more people than those registered as a jobseeker: 1,367,294. In other words, it is not mandatory to be registered as a jobseeker to sign an employment contract. This way, 339,128 people signing a contract were not listed as jobseekers. On average, people in SEPE signed 4.26 contracts during the analysed period, which shows that temporary contracts are broadly used in the Valencian labour market. According to the official employment statistics, Spain registered 21,501,303 temporary contracts but only 1,929,250 permanent contracts in 2017. Finally, 492,720 jobseekers signed a contract and were enrolled in at least one action from SERVEF during the analysed period, so appearing simoultaneously in all three tables.
An interesting point is to analyse how jobseekers are distributed along age and gender. Figure 4 depicts the number of jobseekers according to these two variables. We can observe that women and men’s distributions are almost symmetrical, with no differences regarding age. The jobseekers table is composed by 1,236,452 women and 1,310,874 men, although the unemployment rate for women is higher than the one registered for men.
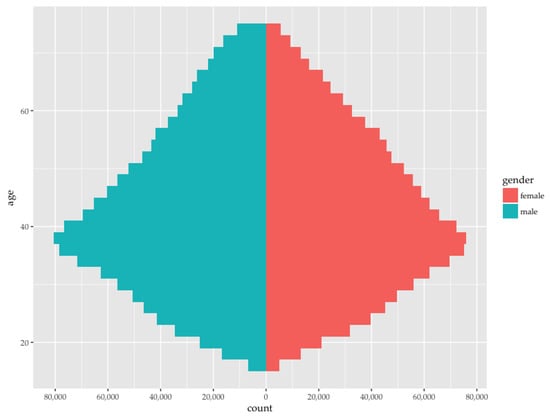
Figure 4.
Population pyramid for jobseekers.
Figure 5 shows the yearly distribution of jobseekers regarding its age and gender. The figure shows some slight differences for the period covered in our analysis. The proportion of young people, around 25 years old, is increasing during this period. We can see how the base of the pyramid is steadily growing, and young women are noticeably becoming more numerous between jobseekers. This could highlight a serious concern for political decision makers, because official figures reveal that, in general terms, women constitute a vulnerable group between unemployed; but more specifically young women are suffering the problem of job exclusion. Therefore, political initiatives should be lead and funded to protect them as a particularly vulnerable group.
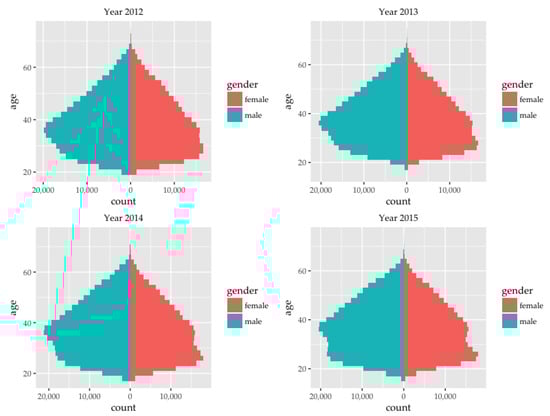
Figure 5.
Yearly population pyramid for jobseekers.
Regarding the number of actions in which unemployed people have been enrolled in, we have analysed differences across age. Figure 6 shows that more than 50% of actions are accomplished by people between 26 and 45 years old. Although young people is the biggest group in the jobseekers’ figures, it is rather surprising to observe just the opposite regarding training courses’ attendance. Figure 6 shows that people 25 years old and below are less willingness than older people to participate in those initiatives promoted by SERVEF to increase their employability prospects. If we distinguish the number of actions accomplished, differences are even more significant. Figure 6 depicts the age distribution for those attending only one action, from two to five actions, and those attending more than 5 actions. The bigger difference is observed for those attending more than five initiatives. We can see this group is mainly composed of people between 26 and 45 years old. It is interesting to note that people 46 year old and over remain quite stable in all three clusters. This way, we can conclude that the loss of interest in attending training initiatives between younger people is mainly covered by people between 26 and 45 years old. It should be analysed what are the reasons that explain the disaffection among young jobseekers, despite training initiatives have been proved to improve the employability prospects in general terms.
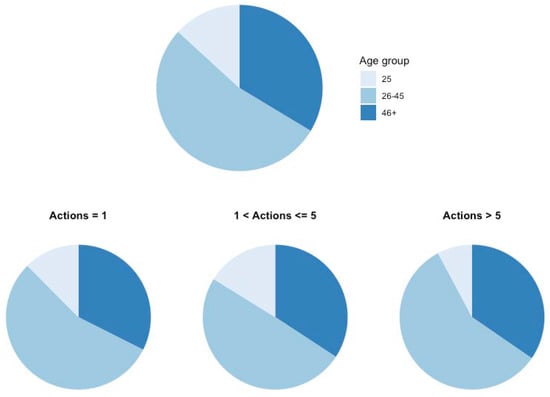
Figure 6.
Age distribution and number of actions registered in the Valencian public employment service.
3. An Econometric Model to Explain Job Search Success
Once the database has been broadly discussed, this section is devoted to address a preliminary analysis to better understand which are the characteristics of those people that succeed exiting unemployment. More specifically, we want to analyse whether attending training initiatives promoted by public employment services has a positive impact on the employment prospects once considered other explanatory variables, i.e., age, gender and educational level.
Our experiment accounts for those people attending some training initiative from the SERVEF in year t. A binary variable in then computed, “jobSearchSuccess”, which checks whether that person has been able to find a job in year (value 1) or not (value 0). This way, we analyse the impact of actions undertaken in 2012 on job search success of 2013; actions in 2013 and job search success in 2014; and actions in 2014 and job search success in 2015. We have also performed a regression model by accounting those actions in the period 2012–2013, and the impact on employability for the period 2014–2015.
It must be noted that all people registered as a jobseeker has at least one action in actions’s table. This is due to the fact that the first thing SERVEF accomplish when anyone is registered as a jobseeker is to include her/him in the actions table as an active jobseeker. This does not necessarily translates into attending more specific activities from SERVEF. Thus, the minimum number of actions for anyone included in actions is 1.
The jobSearchSuccess is explained through a probit model by using age, gender, educational level and number of actions as explanatory variables. Age, educational level and number of actions have been grouped in different dichotomous variables. For example, age has been computed in 5 variables: Age 24 and less, Age 25–34, Age 35–44, Age 45–54 and Age 55+. The first variable is then excluded from the regression analysis.
Probit regression models are a special type of the Generalized Linear Models to explain dichotomous or binary outcome variables. The independent variable Y has a Bernoulli distribution with parameter p. The expected value measures the success probability p. The inverse standard normal distribution of the probability is modeled as a linear combination of the predictors following Equation (1).
The probit function is modelled as a linear combination of the regressors as indicated in Equation (2), where is a vector of unknown parameters.
Finally, the predicted probability can be obtained by the inverse probit transformation (Equation (3)).
Table 2 shows the result of the probit model. Regardless of the period analysed, we can observe that most variables are statistically significant. Regarding the age, the results confirm that it is negatively related with employment prospects. In this case, people aged 55 or more is the most vulnerable group. Another group which is negatively related with job search success are the women. Being a woman means to have less opportunities to find a job. On the contrary, the higher your educational level, the more successful you can be regarding the employment. The only exception are people with a doctoral degree, but in this case the coefficient is not statistically significant because the proportion of people with the highest educational level is very low. Also, as stated previously by the literature, attending training courses and participating in actions promoted by the SERVEF has a positive impact on employability.
Table 2.
Probit model explaining the jobSearchSuccess variable. Coefficients and statistical significance for explanatory variables.
It deserves special consideration how employment prospects have evolved during the years considered in our research. For example, people aged between 25 and 34 years old have improved their chances of finding a job compared to the default level (people younger than 25 years old). In the period 2012/2013 the 25–34 age group reported a coefficient of 0.0522, while in the period 2014/2015 the coefficient was 0.0968. The opposite situation was reported for two other age groups. For those people aged between 45 and 54 years old, their chances of finding a job are lower than those reported for the default level. But the negative coefficient drops from −0.4353 (2012/2013) to −0.3403 (2014/2015). Something similar is observed for people aged between 35 and 44 years old.
Regarding the gender, women have worsened their prospects over time. The probability of exiting unemployment for women is lower in all analysed periods. But their chances have dropped markedly: −0.1679 in 2012/2013, −0.2117 in 2013/2014, and −0.2232 in 2014/2015.
According to our results, the employability gap between different educational levels has been reduced over time.
Finally, the results suggest that only those people attending more than 10 initiatives in SERVEF have significantly improved their chances of finding a job when compared with less active people.
Although the values reported for pseudo might seem low, we have to note that they are aligned with those obtained in recent literature references. For example, the value of pseudo reported by [22] in their most accurate model is 0.083, while models by [23] are around 0.10 and models by [24] vary between 0.05 and 0.15. The highest reported pseudo was obtained in [25], where the Swedish unemployment rate is explained with a pseudo value of 0.35.
4. Conclusions
This paper contributes with a database that includes jobseekers’ characteristics, enrollment on training initiatives for unemployed and employment contracts for the Valencian region in Spain. The database has been provided by a public government institution and includes different variables that can be used in the explanation of job search success for unemployed. We have described the tables involved in the database by using some statisctics, tables and figures. From the econometrical perspective, a probit model has been performed to analyse the relationship between job search success and several explanatory variables. Our results confirm that age is negatively related with employment success. Women constitute a vulnerable group regarding employment prospects, while the educational level has a positive impact on exiting unemployment. According to our results training initiatives promoted by public employment services have a positive impact on employability. Further analysis should be accomplished to identify those training initiatives with a higher and significant impact on employability, and more specifically for those groups suffering from job exclusion. Limitations of this study include the lack of information about wage and fixed term/open ended contracts. This is particularly relevant since (i) temporary workers in Spain are a quite high percentage with respect to other European countries, and (ii) wage may be crucial for accepting job and employability.
Funding
This research received no external funding.
Conflicts of Interest
The author declares no conflict of interest.
Abbreviations
The following abbreviations are used in this manuscript:
| CIS | Centro de Investigaciones Sociológicas (Social Reseach Centre) |
| EPA | Encuesta de Población Activa (Labor Force Survey) |
| EU | European Union |
| SEPE | Servicio Público de Empleo Estatal (Spanish National Empolyment Service) |
| SERVEF | Servicio Valenciano de Empleo y Formación (Employment and Training Valencian Service) |
References
- Jimeno, J.; Bentolila, S. Regional unemployment persistence (Spain, 1976–1994). Lab. Econ. 1998, 5, 25–51. [Google Scholar] [CrossRef]
- Ahn, N.; De La Rica, S.; Ugidos, A. Willingness to move for work and unemployment duration in Spain. Economica 1999, 66, 335–357. [Google Scholar] [CrossRef]
- Ahn, N.; Ugidos-Olazabal, A. Duration of unemployment in Spain: Relative effects of unemployment benefit and family characteristics. Oxf. Bull. Econ. Stat. 1995, 57, 249–264. [Google Scholar] [CrossRef]
- Guijarro, F. Economic recovery and effectiveness of active labour market initiatives for the unemployed in Spain: A gender perspective of the Valencian region. Sustainability 2018, 10, 3623. [Google Scholar] [CrossRef]
- Tosun, J.; Arco-Tirado, J.; Caserta, M.; Cemalcilar, Z.; Freitag, M.; Hörisch, F.; Jensen, C.; Kittel, B.; Littvay, L.; Lukeš, M. Perceived economic self-sufficiency: A country-and generation-comparative approach. Eur. Polit. Sci. 2018, 1–22. [Google Scholar]
- Bassanini, A.; Duval, R. The determinants of unemployment across OECD countries. OECD Econ. Stud. 2007, 42, 7–86. [Google Scholar] [CrossRef]
- Biagetti, M.; Scicchitano, S. The determinants of lifelong learning incidence across European countries (evidence from EU-SILC dataset). Acta Oecon. 2013, 63, 77–97. [Google Scholar] [CrossRef]
- Ariga, K.; Brunello, G. Are education and training always complements? Evidence from Thailand. ILR Rev. 2006, 59, 613–629. [Google Scholar] [CrossRef]
- Dvouletỳ, O.; Mühlböck, M.; Warmuth, J.; Kittel, B. ‘Scarred’ young entrepreneurs. Exploring young adults’ transition from former unemployment to self-employment. J. Youth Stud. 2018, 21, 1159–1181. [Google Scholar] [CrossRef]
- Redding, S. The low-skill, low-quality trap: Strategic complementarities between human capital and R&D. Econ. J. 1996, 106, 458–470. [Google Scholar]
- Scicchitano, S. On the complementarity between on-the-job training and R&D: A brief overview. Econ. Bull. 2007, 15, 1–11. [Google Scholar]
- Scicchitano, S. Complementarity between heterogeneous human capital and R&D: Can job-training avoid low development traps? Empirica 2010, 37, 361–380. [Google Scholar]
- Acemoglu, D. Training and innovation in an imperfect labour market. Rev. Econ. Stud. 1997, 64, 445–464. [Google Scholar] [CrossRef]
- Guijarro, F. Unemployed in Valencian region [Data set]. Zenodo 2018. [Google Scholar] [CrossRef]
- R Core Team. R: A Language and Environment for Statistical Computing; R Foundation for Statistical Computing: Vienna, Austria, 2014. [Google Scholar]
- Wickham, H. ggplot2: Elegant Graphics for Data Analysis; Springer: New York, NY, USA, 2016. [Google Scholar]
- Thalheim, B. Entity-Relationship Modeling: Foundations of Database Technology; Springer: New York, NY, USA, 2013. [Google Scholar]
- Arulampalam, W.; Booth, A.L.; Bryan, M.L. Training in europe. J. Eur. Econ. Assoc. 2004, 2, 346–360. [Google Scholar] [CrossRef]
- Arellano, F.A. Do training programmes get the unemployed back to work? A look at the Spanish experience. Rev. Econ. Apl. 2010, 18, 39–65. [Google Scholar]
- Blázquez, M.; Herrarte, A.; Sáez, F. Políticas de empleo y sus efectos: El caso de la formación dirigida a desempleados. Cuad. Econ. 2012, 35, 139–157. [Google Scholar] [CrossRef]
- Núñez, I.; Livanos, I. Higher education and unemployment in Europe: An analysis of the academic subject and national effects. High. Educ. 2010, 59, 475–487. [Google Scholar] [CrossRef]
- McGuinness, S.; O’Connell, P.J.; Kelly, E. The impact of training programme type and duration on the employment chances of the unemployed in Ireland. Econ. Soc. Rev. 2014, 45, 425–450. [Google Scholar]
- McGuinness, S.; O’Connell, P.J.; Kelly, E.; Walsh, J.R. Activation in Ireland: An evaluation of the national employment action plan. ESRI Res. Ser. 2011, 20. [Google Scholar]
- Kelly, E.; McGuinness, S.; O’Connell, P.J. Literacy, Numeracy and Activation among the Unemployed. ESRI Res. Ser. 2012, 25. [Google Scholar]
- Andrén, T.; Andrén, D. Assessing the employment effects of vocational training using a one-factor model. Appl. Econ. 2006, 38, 2469–2486. [Google Scholar] [CrossRef]
© 2018 by the author. Licensee MDPI, Basel, Switzerland. This article is an open access article distributed under the terms and conditions of the Creative Commons Attribution (CC BY) license (http://creativecommons.org/licenses/by/4.0/).