Abstract
The integration of generative artificial intelligence (AI) in e-commerce is constantly increasing and in different forms, while transforming content creation. Its impact on user experience remains underexplored. This study examines user perceptions of AI-generated e-commerce content, focusing on functionality, aesthetics, and security. A survey was conducted where 223 participants were requested to browse through the pages of an online store developed using ChatGPT and DALL·E and evaluate it, providing feedback through a constructed questionnaire. The collected data was subjected to descriptive statistical analysis, exploratory factor analysis (EFA), and comparative statistical tests to identify key user experience dimensions and possible demographic variances in satisfaction. Factor analysis extracted two main components influencing user experience: “Service Quality and Security” and “Design and Aesthetics”. Further analysis highlighted a slight variation in user evaluations between male and female participants. Although security-related questions were addressed with caution, the rest of the findings indicate that AI-generated content was well-received and highly rated. Clearly, generative AI is a valuable tool for businesses, AI developers, and anyone seeking to optimize AI-driven processes to enhance user engagement. It can be confidently concluded that it positively contributes to the development of a functional and aesthetically appealing e-commerce platform.
1. Introduction
Generative artificial intelligence, through its many advantages such as ease of use, intuitive interface, and performance, has transformed the traditional processes of many industries and domains. By automating content creation, supporting data-driven decisions, and enhancing personalized user experiences, it has a major impact on promoting business model innovation [1,2]. The available generative AI models can be categorized according to various aspects. Categorization based on their input/output forms includes image, video, audio, 3D images, code, scientific text generation from text, etc., as well as text-to-text and text-to-image transformations [3]. The ChatGPT-4 and DALL·E 3 models that were utilized are reshaping content generation, impacting fields such as journalism [4], digital marketing [5], and e-commerce [6]. The implementation of the above models in e-commerce promotes customer engagement by providing personalization, product descriptions, marketing visuals, interactive insights, chatbot interactions, and much more [7]. Despite its increasing adoption and use, the impact of AI-generated content on user experience (UX) remains underexplored, particularly in areas of functionality, aesthetics, and security that this paper focuses on.
AI-generated content plays a significant role in helping a business enhance both efficiency and scalability [8], but its integration process in e-commerce presents crucial challenges related to consumer trust and adoption [9]. It is still undetermined how effective AI-generated content is in influencing purchasing decisions. Preconceived beliefs and biases about the origin of content may impact user’s responses regarding the aesthetics, with some people arguing that human-created content may still be preferred [10]. Although AI tools can improve personalization and automation procedures [11], consumers are often skeptical toward AI-generated content due to various concerns over transparency, data privacy, and security [12].
This study aims to bridge this gap by evaluating user perceptions of AI-generated e-commerce content. Initially, a board game and Role Playing Game (RPG) e-shop was developed with assistance from the most commercial content management system (CMS) platform, WordPress [13], using only AI-generated content (text, visuals, product descriptions, development guide, etc.). The participants explored the online store and provided feedback through a measurement instrument (questionnaire) that was constructed to evaluate their browsing experience. The collected data was then analyzed to identify key dimensions and demographic variations in user satisfaction.
As the general field of AI in e-commerce is quickly expanding [14], this research contributes to the continually growing body of literature on AI-generated content. Findings indicate that the content that was used was well-received by the e-shops visitors in terms of functionality and aesthetics, while minor concerns regarding security and trust were raised. Utilizing generative AI tools contributed positively to the development of a fully functional and appealing e-shop [15]. The aforementioned outcomes provide a direction for businesses and AI developers aiming to improve their AI-generated content strategies and user engagement to maximize their key objective of conversion rates.
2. Literature Review
Generative artificial intelligence (AI) has risen as a transformative force in content creation, with its technologies applied to generate text, image, sound, and various multimedia types [16]. Large language models, such as ChatGPT, and image generation models, like DALL·E, are very proficient in generating quality-focused human-like text and images, enabling applications in e-commerce in various fields, such as marketing, customer service, and personalized content creation [17,18]. These tools are utilized by businesses to strengthen their efficiency and scalability by assisting in the creation of various types of content such as advertisements, product descriptions, articles, posts, visual elements, etc. [19]. After evaluating the available models, ChatGPT-4 and DALL·E 3 were adopted for this study. The current generative AI research and applications emphasize the importance of each of them, especially in creating language-based and image-based content. Both AI tools are widely used, commercially available, and designed to support e-commerce professionals and enthusiasts in creating artistic digital work. Their prompt-driven structure made them an excellent choice for the iterative prompt engineering refinement that this research adopted and tested. Another notable benefit was that both textual and visual content creation needs were addressed within a single AI environment. The aspect of using tools from the same provider (OpenAI) reduced the dependence on different platforms, simplified integration, ensured compatibility, improved efficiency, and decreased the overall development costs.
AI-generated content has substantial benefits, including reduced creation time and costs needed, enhanced personalization, and faster work completion while providing high output quality [20,21]. Although those systems cannot replace a human team yet, their capabilities are diverse, and their adoption effectiveness depends on their operator’s knowledge [22]. The generative AI market is expected to reach a valuation of USD 62.72 billion by 2025 and exhibits an annual growth rate of 41.52% from 2025 to 2030 [23]. Its use in e-commerce continually gains popularity with various adoption levels. According to recent data, 48% of organizations state that they are experimenting with AI solutions, 29% have fully implemented them, and only 3% have no intention to use them in the future [24].
User experience (UX) plays a significant role in influencing user satisfaction and ultimately the popularity and success of an e-commerce platform [25]. Factors such as user interface design, the quality of formatting and pictures, etc., are highly important in determining customer engagement [26]. Classical evaluation acceptance models suggest focusing on perceived ease of use, usefulness, social influence, etc. [27]. The above factors are all closely related to the quality of an e-shop’s content, especially among the age group that this paper focuses on [28]. Recent studies show that integrating AI technologies and features leads to increased engagement, retention, and conversion rates in e-commerce apps [29]. In some cases, even in-store AI applications positively influence customers’ shopping experience and purchase intentions [30]. On the other hand, poor implementation of AI systems, for example, when they provide inaccurate information or exhibit performance failure, can frustrate users and lead to disappointment [31,32]. Thus, more research is required to discover how to create the best user experience by utilizing a combination of both AI and human capabilities.
Trust and security concerns are common among users when interacting with AI-generated content due to various risks such as privacy breaches, data misuse, unauthorized access, etc. [33]. Basic AI-generated content like product descriptions and images are questioned in terms of accuracy, as consumers have valid concerns about manipulative AI-driven marketing tactics [34]. The appearance and aesthetics of an online platform in terms of color choices, pictures, visuals, website design, etc., influence consumer behavior and perception on trust [35,36,37]. Another element that shapes confidence in consumers is the disclosure of AI tool usage in the content creation process, as they are more likely to trust platforms that are transparent and acknowledge AI use [38,39].
Most of the current literature examines AI components such as machine learning, natural language/image processing, automation, etc., rather than exploring their combined impact. There is limited research available on how these new technologies influence overall e-business performance using various metrics like revenue growth, efficiency, or in this case, customer satisfaction. Studies on generative AI and its impact on user experience in e-commerce are steadily increasing, demonstrating expanded curiosity about these revolutionary solutions. A major part of this study focuses on two important dimensions: firstly, the quality of the created content, including product descriptions, product pictures, and visual assets, and how it affects customer engagement and trust; and secondly, the performance and capabilities of the generative AI models, in particular its accuracy and adaptability in a demanding e-commerce environment. These two dimensions aim to bridge the gap between theoretical advancements and practical applications. Few of the available studies explore user assessments and their perceptions after interacting with AI-generated content, particularly in a simulation environment, creating a large gap in our knowledge of real-world usability. There is a great risk that even the most effective models will not be capable of creating a connection with human users, especially when their outputs are biased, out of context, or seem impersonal. Therefore, this study utilizes a mixed-methods approach on examining user perception on AI-generated content across three major components: functionality, with a focus on usability and practical value; aesthetics, with a focus on design flow and visual appeal; and security, with a focus on data privacy and user trust. By experimenting within a simulated e-shop environment, this research evaluates the immediate user reactions. It aims to address gaps by presenting a survey-based evaluation that is independent of strict traditional frameworks and also to contribute to both academic and commercial fields (developers and business professionals) regarding the applications of generative AI in e-commerce.
3. Materials and Methods
This study was conducted in three phases, as shown in Figure 1: (a) the preparation of the platform’s content, (b) the development of the e-shop, and (c) the evaluation questionnaire with its data analysis. To prepare the AI content for phase one, OpenAI’s ChatGPT-4 and DALL·E 3 were utilized to generate all textual and visual components necessary. The first tool was primarily used to create custom prompts for generating all elements, an in-depth implementation guide, and all descriptive or informative text. The second tool was used for generating or editing all visual features. The e-store presentation—from the selection of colors and fonts to its functional features—was strictly proposed or designed by these AI models with the aim of supporting objectivity in evaluating the AI-generated e-commerce content. Thus, the aforementioned resources were exclusively used for the platform’s development; no AI tools were used to analyze or interpret the research data.

Figure 1.
Workflow of the study.
3.1. Development of the AI-Generated E-Shop
As aforementioned, the industry of board games and RPGs was preferred as it is mostly associated with creative visuals and gripping narratives [40]. The content management system that was selected for e-shop development was WordPress, to facilitate rapid creation [41] and leverage its extensive range of available plugins [42]. The AI models implemented during the process are ChatGPT-4, which is capable of achieving human-equivalent performance levels [43], and DALL·E 3, which is skilled at creating high-quality images in a variety of styles [44]. Using custom prompts, ChatGPT-4 was utilized to generate a comprehensive step-by-step guide to support the development process by providing detailed instructions and suggestions throughout the creation of the virtual shop. In addition to generating the prompts for DALL·E 3, it produced outputs for all required textual components, such as descriptions, categories, and general content. Meanwhile, DALL·E 3 was employed to generate outputs for all the necessary visual components, including logos, banners, and general image content.
To ensure accurate and contextually appropriate content generation, structured input was provided to both ChatGPT-4 and DALL·E 3. Initially, the final prompt that was used for generating product descriptions (through continuous prompt refinements) was highlighting the tone, length (150–200 words), and structure of the content, as well as the need for SEO and persuasive language tailored for e-commerce use. It was suggested to use sources available on the internet to collect information about the game (e.g., number of players, duration, and game type) and select appropriate keywords targeting both search visibility and the intended audience. Additionally, a two-sentence summary was requested to serve as an attention-grabbing snippet for the top of the product page. Game pictures were collected from the internet and edited with the help of the model in order to optimize them for e-commerce use. The rest of the platform’s images were created through customized prompts for each case. They were tailored to reflect the theme, unique atmosphere, and core elements of each individual visual need.
To support the e-shop’s functionality, aesthetics, and security, the model suggested the following plugins and features: WooCommerce, an open-source plugin that is used by more than eight million stores [45] and provides the necessary means to transform a website into an e-commerce business, was installed. Elementor was selected as the main page builder due to its popularity and ease of use. Storefront, an official WooCommerce theme that is used by more than 100.000 websites [46] and is highly optimized for creating e-commerce stores, was proposed. As for the platform’s template, Brandstore was adopted, because it offers easy and seamless integration with WooCommerce [47], and the AI model considered it to be the most suitable option for the e-shop’s product range. WPForms was added as an excellent tool for creating various contact forms. For security, Wordfence Security—Firewall, Malware Scan, and Login Security—was recommended as it is one of the most popular and reliable plugins of its kind. UpdraftPlus: WP Backup and Migration Plugin was recommended as it is one of the most well-known and reputable solutions for backing up the website’s content on the market. For Search Engine Optimization (SEO) management, Yoast SEO, perhaps the most popular plugin in its category, with over ten million active installations, was suggested [48].
For the creation of a Frequently Asked Questions (FAQ) section, Easy Accordion–Responsive Accordion FAQ Builder and Product FAQ was deployed. To enhance the website’s loading speed and reduce the server’s load, WP Fastest Cache was added. For analytics handling, the model recommended Google Analytics for WordPress by MonsterInsights, one of the most widely used plugins of its kind. OptinMonster was installed to streamline customer email collection and integrate smoothly with multiple platforms. The model also advised us to add Google’s reCAPTCHA as an additional protection measure against bots and spam, which confirms that only real users can submit information in the site’s forms [49]. The Tawk.to Live Chat plugin was recommended as it is one of the most well-known and trustworthy tools for providing real-time support for customers and integrating a chatbot with automated knowledge-based question-and-answer functionality. To improve website accessibility, the One Click Accessibility plugin was recommended, as it helps comply with the legally recognized Web Content Accessibility Guidelines (WCAG) accessibility standard while also serving as a means of inclusion [50].
3.2. Research Design
The quantitative research approach was chosen to conduct this study. A method widely used for analyzing numerical data to identify relationships and patterns. Its main advantages are objectivity, the ability to test hypotheses and conduct comparative analyses, ease of visualization, and suitability for assessing perceptions among a large number of participants [51]. To collect data from respondents across different geographic locations, an online customized questionnaire was employed. The questions were closed-ended, and a five-point Likert scale was applied due to its ease of understanding and effectiveness in measuring opinion levels. The available response options were as follows: Strongly Disagree, Disagree, Neither Agree nor Disagree, Agree, and Strongly Agree. It was designed to provide an effective evaluation of the AI-generated e-commerce platform, focusing on the site’s aesthetics, functionality, and security. All raw responses used in the analysis are available in the Supplementary Materials (Dataset S1).
3.3. Questionnaire Structure and Administration
For the convenience of the respondents, the questionnaire presented in Table 1, consists only of 26 questions and was divided into five thematic sections. Section A includes the necessary demographic information such as gender, age, education level, occupation, annual income, and shopping habits (purchase frequency, monthly spending amount, and online shopping experience). Section B contains questions related to website navigation and design, including ease of navigation, layout design, general aesthetics, colors, fonts, images, graphics, and other elements. Section C includes questions regarding content and functionality, such as product descriptions and images, loading speed, and technical issue presence. Section D focuses on additional features and security, examining factors like feature adequacy, communication methods, personal data security, and trust. Lastly, Section E is composed of questions about user satisfaction and their rating, including overall satisfaction, purchase intention, recommendation intention, and a five-star rating. For reliability reasons, its content was designed based on questions already used by previous researchers, with minor adjustments where necessary.

Table 1.
Structure of the questionnaire: question formulation, thematic section, and source.
3.4. Sampling and Data
The non-probability sampling was preferred for this study, a technique where some population groups have a higher possibility of being included than others. The convenience sampling method was chosen, meaning that all participants were selected based on availability, accessibility, and mostly their willingness to be involved in the research. The main advantages of this process are ease of implementation, immediacy, fast data collection, and minimal cost requirements [64]. With no specific exclusion criteria, the target population consisted of internet users who engage in online shopping. The questionnaire was developed on the Google Forms platform, due to its ease of use, familiarity among respondents, and free accessibility.
Social networks and groups related to board games and RPGs were employed to distribute the questionnaire, as well as individuals from the researcher’s professional and personal circle. The data collection period lasted one week, from October 7 to October 13, 2024, and the total number of respondents was 223. Participants were instructed to visit the online store, browse through its pages, and then respond to the evaluation questions. To ensure anonymity, no personal information such as names or email addresses was collected. The extracted data was analyzed using IBM SPSS Statistics, version 29. There were no missing values since all responses in the form were set to mandatory, so no data cleaning was required.
Several statistical methodologies were used throughout this data analysis. In order to confirm the data’s suitability for factor analysis, reliability testing was performed, which included Cronbach’s alpha, MSA index, KMO and Barlett’s test. After validating their eligibility, this study used one-way ANOVA to look at differences across various categories. A detailed Pearson correlation coefficient matrix was employed to determine linear correlations between continuous variables. Also, independent samples t-tests were performed to compare means between different user groups. To find latent variable structures, exploratory factor analysis (EFA) was also carried out. Principal component analysis with varimax rotation was used to optimize the components’ interpretability. Every test was conducted strictly in accordance with its corresponding assumptions about scale of measurement, homogeneity of variance, and normality.
4. Results
4.1. Demographics and Purchasing Behavior
The following observations can be made after the descriptive analysis of demographic characteristics and purchasing habits, as indicated in Table 2: The sample primarily consists of young adults and middle-aged individuals (18–39 years old), with a slightly higher percentage of male participants. The majority of respondents have university or postgraduate education and are employed in the private sector. Most participants have 3–10 years of experience in shopping online and make purchases one to three times per month, which indicates significant familiarity with e-commerce platforms. Regarding yearly earnings, respondents mainly belong to the EUR 5000–EUR 20,000 range, with a standard deviation of 1.061, indicating some variance but with most participants falling within middle-income categories. This distribution is also reflected in their spending behavior, as the majority of them reported spending between EUR 50–EUR 100 per month on online purchases.

Table 2.
Descriptive statistics of demographic characteristics and purchasing behavior. Categorical distribution of demographic characteristics and purchasing behavior.
4.2. Evaluation of the Online Store
According to the survey results demonstrated in Figure 2, users had a generally positive experience while browsing the AI-generated board game e-shop. The majority of them found the website easy to navigate, with 61.4% agreeing and 29.6% strongly agreeing, while 59.2% agreed and 27.4% strongly agreed that it was user-friendly. Feedback concerning appearance was positive: 51.6% agreed and 23.8% strongly agreed that the website’s design was aesthetically pleasing, with product images and graphics receiving similarly high ratings. The page’s performance and functionality were also well-received. Almost half of the users reported that the store’s pages load fast, and the absence of technical issues was confirmed with 48.9% strongly agreeing and 43% agreeing. A total of 51.6% of the participants agreed that the additional features were sufficient, while 23.3% neither agreed nor disagreed. Users expressed more mixed feelings about security- and trust-related issues. While 48.4% agreed and 22.4% strongly agreed that they felt safe to purchase from the store, some respondents had reservations, as 32.2% stated that they neither agree nor disagree that their personal data was kept secure. Overall, 60.1% agreed and 22.9% strongly agreed that they felt satisfied from their user experience, 56.5% agreed that purchasing from the store was a good choice, and 53.4% stated they would recommend the store to other people. As for their star rating, the largest portion of users awarded four (44.8%) or five stars (40.8%), demonstrating high levels of satisfaction.
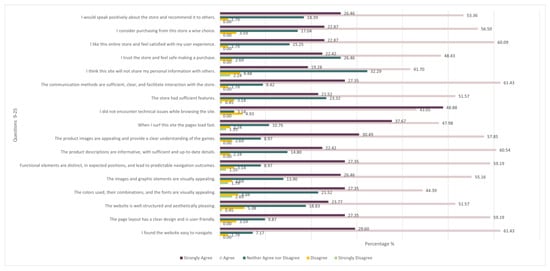
Figure 2.
Percentage distribution of respondents’ perceptions of their user experience on the AI-generated e-commerce platform.
Based on data detailed in Table 3, it is evident that the mean values across all answers are relatively high, ranging from 3.71 to 4.36. The average star rating assigned is 4.24, which indicates that users are generally satisfied with the online store experience. Most responses are clustered around the variable’s means, demonstrating a narrow distribution. The range of standard deviation rates, between 0.637 and 0.941, is considered moderate to low. Question 18, “I did not encounter technical issues while browsing the site”, has the highest mean value (4.36), indicating that the absence of technical problems is the most positively rated feature of the website. On the other hand, Question 21, “I think this site will not share my personal information with others”, has the lowest mean value (3.71), suggesting that data security concerns remain an issue for a significant portion of users.

Table 3.
Descriptive statistics for user experience evaluation. Frequency distribution of responses for user experience evaluation.
4.3. Correlation Analysis of Key Variables
The correlations between the e-shop’s evaluation were analyzed using Pearson’s correlation coefficient, a process that assesses the strength and direction of relationships between variables [65]. As expected, due to the nature of the variables, questions 23–26 exhibit strong correlations (ranging from 0.608 to 0.744, p = 0.000), as they all measure satisfaction with overall user experience. Similarly, an expected strong correlation was found between shopping frequency (Q6) and purchase amount (Q7) (r = 0.726, p = 0.000). The strongest correlation (r = 0.731, p = 0.000) appears between easy navigation (Q9) and clear design (Q10), suggesting that users who had no trouble navigating the site were also pleased with its design. Likewise, questions 21 and 22 (personal data security and overall trust) show a strong association (r = 0.700, p = 0.000). Other notable correlations are between user-friendliness (Q10) and an aesthetically pleasing design (Q11), with r = 0.680 and p = 0.000, and between overall design quality (Q11) and colors/fonts (Q12), with r = 0.658 and p = 0.000. The above highlight that a website’s appearance and its ease of use strongly impact user experience.
Overall, there are moderate correlations between design- and content-related variables with p = 0.000, suggesting to some extent that a website’s design influences users’ perception of content, for example, in the pairs of questions 10 and 19 (clear design–feature sufficiency), with r = 0.431; 15 and 19 (product descriptions–feature sufficiency), with r = 0.422; 14 and 23 (functional elements–user satisfaction), with r = 0.415; and 10 and 16 (clear design–product images), with r = 0.396. Weak but statistically significant correlations (p = 0.000) were identified between product images and loading speed (Q13–17, r = 0.190), colors and fonts with loading speed (Q12–17, r = 0.195), and technical stability with decision to purchase (Q18–24, r = 0.215). For a detailed view of the correlations among all measured variables, the full Pearson correlation matrix is provided in Appendix B (Figure A9).
4.4. Factor Analysis and Reliability Testing
The data file was examined, factors were extracted, and variables were assigned accordingly. A reliability test was then performed to determine whether further factor processing was necessary. The analysis was based on questions 9 to 22, which assess various aspects of user experience. Questions 23–26 were excluded, as they were considered outcomes of the experience, functioning better as dependent variables. The criteria used to evaluate the suitability of the data file for factor analysis were as follows: the existence of strongly correlated variables in the correlation matrix, a Kaiser–Meyer–Olkin (KMO) index greater than 0.6, a significance level (sig.) lower than 0.05, and a Measure of Sampling Adequacy (MSA) index greater than 0.6.
The analysis explored how the variables are correlated, assessing significance levels using Sig. (one-tailed). In most variable pairs, the p-value is 0.000 (p < 0.05), while in four pairs, the p-values are 0.001 and 0.002 (also p < 0.05). Thus, there is strong evidence to reject the null hypothesis of no correlation between the variable pairs, confirming that the correlations are statistically significant. The determinant value is 0.001, which is relatively low, indicating that the variables in the table are not linearly independent and that multicollinearity exists between them. This may present complications for the analysis; however, this outcome was expected, as the questions explore related aspects of user experience.
From Table 4, it is derived that the KMO index is 0.897, which is greater than 0.6. Bartlett’s test of sphericity results in 1512.140 with 91 degrees of freedom. The significance level (Sig.) is < 0.001, which is less than 0.05, leading to the rejection of the null hypothesis of uncorrelated variables. The above values indicate that the data exhibit a high degree of adequacy for factor analysis.

Table 4.
KMO and Barlett’s test.
From the Anti-image Covariance and Correlation examination, the MSA values along the diagonal of the Anti-image correlation matrix range between 0.943 and 0.829. All scores are greater than 0.6, suggesting that the variables provide a good representation of the underlying factors, confirming their suitability for factor analysis.
Table 5 shows the initial eigenvalues: numerical indicators that represent the percentage of variance each factor explains. The analysis identified two key factors, which together explain approximately 55.09% of the variance after rotation. While this percentage is not exceptionally high, it is considered satisfactory. Variance explanations that exceed 50% are considered generally acceptable when dealing with questionnaire-based data [66].

Table 5.
Initial eigenvalues and percentage of variance explained.
Table 6 presents the loadings of each variable after applying the rotation method, a process that highlights the new and more structured relationship patterns among them. For variables that load onto two factors, the higher loading value is selected. The first factor consists of questions 11, 12, 13, 10, 22, and 9, and it includes aspects such as navigation, usability, aesthetics, visual appeal, and trust. A possible label for this factor would be “Design and Aesthetics”. The second factor consists of questions 17, 20, 18, 15, 16, 19, 14, and 21, and it groups items involving functionality, performance, content quality, communication, and security. A fitting label for this factor would be “Service Quality and Security”. For the items that were loaded in both factors, the one with the highest loading was regarded as the primary. Although 0.50 is a typical threshold for factor loadings, elements with somewhat lower loadings were kept in the final structure because they were theoretically relevant and somewhat close to this cutoff. Particularly, loadings for Distinct Functional Elements and Personal Data Security were slightly below 0.50, despite the fact that they are theoretically significant components of the user experience. The existing literature supports their inclusion, and the satisfactory Cronbach’s alpha values show that there were no effects on the reliability and the consistency of the components. The decision to retain those items was deemed appropriate given the exploratory nature of this study.

Table 6.
Factor loadings of variables after rotation.
After assigning the variables to their factors, a Cronbach’s alpha coefficient test was conducted to determine their consistency. The first factor had a Cronbach’s alpha of 0.867, and the second had a Cronbach’s alpha of 0.838. Therefore, both values show high reliability. Given that α > 0.6, as well as the adequacy of the other indices mentioned above, such as the presence of strong correlations between variables, Bartlett’s Test of Sphericity with Chi-square = 1512.140 with p < 0.01 (p < 0.05), Kaiser–Meyer–Olkin = 0.897 (KMO > 0.6), Measure of Sampling Adequacy ranging from 0.829 to 0.943 (MSA > 0.6), factor loadings ranging from 0.462 to 0.819 (indicators > 0.4), and the two factors explaining approximately 55.09% of the variance (Total Variance Explained > 50%), the extraction of the two factors is confirmed.
All key information regarding the questions that defined the two factors are summarized in Table 7. In the first factor (Design and Aesthetics), the highest mean value (4.19) is observed for the question “I found the website easy to navigate”, while the lowest mean value (3.90) corresponds to the question “The colors used, their combinations, and the fonts are visually appealing”. In the second factor (Service Quality and Security), the highest mean value (4.36) is recorded for the question “I did not encounter technical issues while browsing the site”, whereas the lowest mean value (3.71) corresponds to the question “I think this site will not share my personal information with others”. The range of standard deviation reflects a moderate variation in answers. The lowest (0.637) is for “I found the website easy to navigate”, which points to high responder agreement. The highest (0.941) is for “The colors used, their combinations, and the fonts are visually appealing”, which suggests more variability.

Table 7.
Summary of factor characteristics.
4.5. Correlations Between Demographics and Evaluation Questions
It was deemed appropriate to examine the correlations and differences between demographic characteristics and evaluation questions. For this analysis, the statistical tests t-test and one-way ANOVA were applied. To analyze the correlation between questions, the two factors extracted in the previous section were used, as they had been validated through factor analysis. For comparisons requiring e-shop evaluation, a new variable (M_review) was formed, representing the overall user experience instead of just using the star ratings from question 26. This variable was constructed by calculating the average score of questions 23 to 26. The above approach offers a more reliable measurement, as it is based on a larger dataset and accounts for multiple dimensions of user satisfaction.
The only statistically significant difference observed was in gender, with women rating Design and Aesthetics and Overall User Experience higher than men. Table 8 shows that the sample size of male respondents is 14 units larger; however, the sizes are sufficiently close and adequate for comparison. In “Design and Aesthetics”, the mean score for women is slightly higher than that of men, with p = 0.013, which is lower than the significance level of 0.05, demonstrating that this difference is statistically significant. In the “Service Quality and Security”, the mean score for women is also slightly higher than that of men, but with p = 0.067, which is greater than the significance level of 0.05, an outcome that proves that this difference is not statistically significant. Regarding the “Overall User Experience”, the mean score for women is slightly higher than that of men, with p = 0.036, which is below the significance level of 0.05, a result confirming that this difference is statistically significant. The relationship between the remaining demographic data (age, education, occupation, annual income, shopping frequency, spending amount, and years of experience) and the evaluation questions was similarly examined using the one-way ANOVA test, but no statistically significant difference was observed. Thus, gender was the only variable in the demographics that affected the evaluation factors.

Table 8.
Correlations between gender and evaluation questions.
5. Discussion
The purpose of this study was to evaluate an online store developed with the assistance of generative AI language models. The generated content was reviewed and analyzed by user perceptions and satisfaction data through a customized questionnaire. Respondents were first invited to browse the website and then complete a user experience survey. During development, emphasis was placed on functionality, appearance, and content to ensure that the e-shop appeared as realistic as possible and comparable to similar platforms in the industry.
Selecting a content management system is an important decision for businesses that want to enter e-commerce [67]. WordPress was chosen for being an excellent option for beginners with no extensive technical experience and due to its user-friendly interface and low learning curve [68]. The vast number of available free plugins [42] was another crucial advantage among its competitors and served as a beneficial feature that contributed to creating a visually appealing and feature-rich website. Another important decision was determining the AI model that would best align with the project’s objectives. ChatGPT-4 was selected for its advanced image generation capabilities via DALL·E, as well as its flexibility and consistency in producing general website content [69]. To generate ChatGPT-4 responses, custom prompts were designed to achieve the best possible results, which are tailored to the specific industry. A step-by-step guide was also generated to assist in various phases of the development process, including detailed instruction and suggestions.
To conduct this study, some hosting expenses were required, and to avoid any additional costs during the implementation of the store using WordPress, resorting to free resources was necessary. This decision may have affected the website’s performance, as no premium features, such as plugins and services, were utilized. Moreover, the implementation of its latest developments is extremely challenging, often making certain techniques outdated within a brief period of time due to the rapid and dynamic advancements in the field of artificial intelligence.
The sample of 223 participants, although sufficient, does not fully represent the general population. The convenience sampling method used presents a major drawback—potential bias—as participants may not be representative of all consumers, with a large portion coming from the researcher’s personal and professional network. A limitation of the study is that participants’ frequency of engagement with board games and RPGs was not recorded. This information could have offered useful context for interpreting their responses. Future studies should consider including this variable to better capture user familiarity with the product category. Moreover, no interviews were conducted and no open-type questions were used, and the study relied exclusively on quantitative analysis. The time that was allocated for evaluation may not have been sufficient to assess comprehensively the level of user satisfaction, as respondents only visited the e-shop once before answering the questionnaire. The experiment was conducted in a controlled environment and not in genuine purchasing conditions. As a result, the findings may not fully reflect the actual user experience in a realistic shopping context.
Examining the employment of different CMS platforms to develop the e-shop could contribute to a better understanding of how different systems affect user experience. The exclusive use of free tools in WordPress may have influenced the store’s performance and the way that it was accepted by the respondents, so future research should focus on integrating more premium features and plugins. This approach would allow useful performance comparisons between free and paid solutions. This also applies to investigating the use of different AI models available and their paid or free versions. This method can offer a balanced overview of the advantages and disadvantages of each model. At the same time, the integration of new technological advancements is essential to ensure up-to-date results. Additionally, further research could be beneficial, potentially incorporating qualitative elements and expanding the participant sample to derive more precise conclusions.
6. Conclusions
To examine the existence of relationships between various survey questions, Pearson’s correlation coefficient was used to determine the strength of these relationships. The results indicated strong positive correlations between ease of navigation and a user-friendly interface, personal data security and perceived trustworthiness, and a user-friendly interface and an aesthetically pleasing design. Moderate correlations were observed between feature sufficiency and a clear design, as well as clear design and informative product descriptions. That fact suggests that a website’s design can influence users’ perceptions of content to some extent.
A reliability analysis was conducted to assess if the data were suitable for factor extraction, resulting in the formation of two factors. The first factor consists of six questions and relates to navigation, usability, aesthetics, visual appeal, and trust, and it could be labeled “Design and Aesthetics”. The second factor contains eight questions and covers functionality, performance, communication, content quality, and security, and it could be labeled “Service Quality and Security”. T-tests and one-way ANOVA were applied to explore potential relationships, analyzing the factors that were previously extracted, alongside a new variable created from the average scores of questions 23 to 26. This new construct represents the overall experience better than just using a simple star rating. No statistically significant differences were found in the evaluation scores, except for the “Design and Aesthetics” factor and the new rating variable in relation to gender, where women rated the store slightly higher than men.
Most of the participants were satisfied with their user experience in the online store. It is worth noting that knowing the content was created exclusively using AI means did not negatively affect the respondents’ review. The majority found the website user-friendly and easy to navigate, with agreement rates exceeding 88%. Components including the design, the colors, and the fonts were identified as aesthetically appealing. The functional elements were considered distinct and intuitively structured. Product descriptions and images were deemed informative and received positive feedback. The loading speed and the absence of technical issues were identified as some of the most satisfactory features. Respondents were cautious about security issues, and a significant segment of them raised concerns about the safety of their personal data. Generally, users had a fulfilling experience browsing the store and intend to recommend it to other people. Their positive perception of the platform was confirmed by the average rating of 4.24 stars that was given. It can be concluded that users’ perceptions of the online store were uniform, regardless of demographic characteristics, indicating a consistent level of satisfaction across different user groups. Thus, it can be validated that the generative AI models used created content that promoted the development of a fully functional and highly aesthetically appealing e-commerce platform.
Supplementary Materials
The following supporting information can be downloaded at: https://www.mdpi.com/article/10.3390/data10060089/s1, Dataset S1: Raw questionnaire responses collected via online survey.
Author Contributions
Validation, G.F.F. and I.A.; Writing—original draft, C.S.; Supervision, V.S. All authors have read and agreed to the published version of the manuscript.
Funding
This research received no external funding.
Informed Consent Statement
Participation in this study was voluntary and anonymous. Informed consent was obtained from all respondents, and through the provided instructions, they were also informed that the collected data would be used exclusively for the purposes of this research. Completion of the questionnaire was considered as providing informed consent for the use of their responses in the study.
Data Availability Statement
The data presented in this study are available in the Supplementary Materials (Dataset S1).
Acknowledgments
This study was supported by ChatGPT-4 and DALL·E by OpenAI. More specifically, these models were employed exclusively for the development of a fully functional AI-generated e-commerce platform, as outlined in Section 3, with the aim of examining users’ experience and perceptions of its utilization thereafter. Thus, all e-shop content was strictly suggested or generated by the AI models to ensure an objective evaluation of its performance.
Conflicts of Interest
The authors declare no conflict of interest.
Abbreviations
The following abbreviations are used in this manuscript:
| AI | Artificial Intelligence |
| RPG | Role Playing Game |
| UX | User Experience |
| CMS | Content Management System |
| SEO | Search Engine Optimization |
| WCAG | Web Content Accessibility Guidelines |
| FAQ | Frequently Asked Questions |
| KMO | Kaiser–Meyer–Olkin |
| MSA | Measure of Sampling Adequacy |
| EFA | Exploratory Factor Analysis |
Appendix A
Appendix A presents some screenshots from the e-commerce platform that was developed for this study, to illustrate its functionality, design, navigation, security, and aesthetics. The e-shop was created with AI-generated content, including images, text, descriptions, etc., as well as a step-by-step guide with instructions and recommendations in every stage of the development.
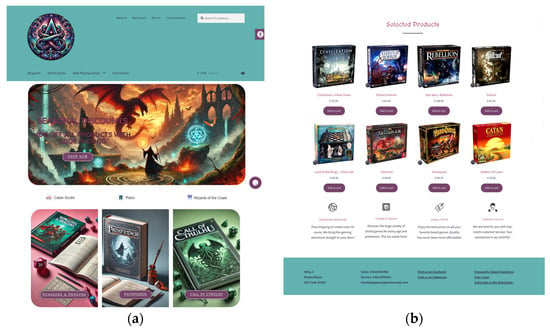
Figure A1.
(a) Upper section of the homepage; (b) lower section of the homepage.
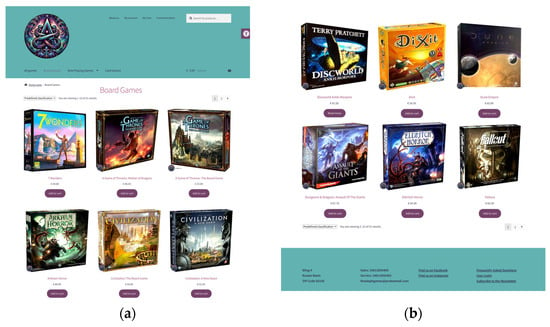
Figure A2.
(a) Upper section of the Board Games page; (b) lower section of the Board Games page.
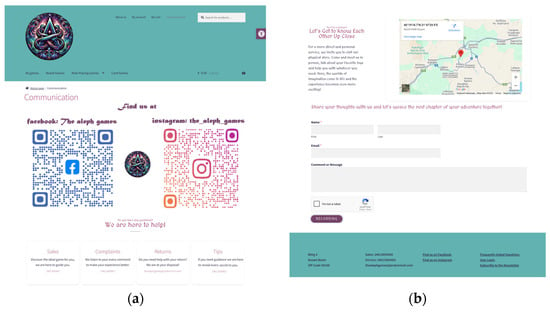
Figure A3.
(a) Upper section of the Communication page; (b) lower section of Communication page.
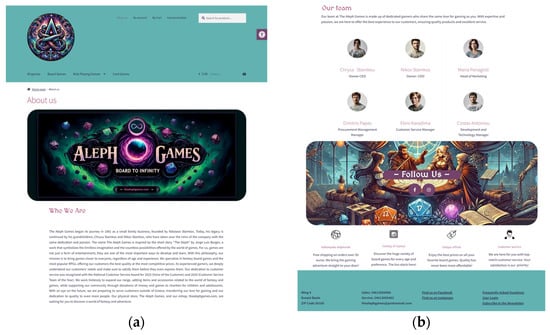
Figure A4.
(a) Upper section of the About us page; (b) Lower section of the About us page.
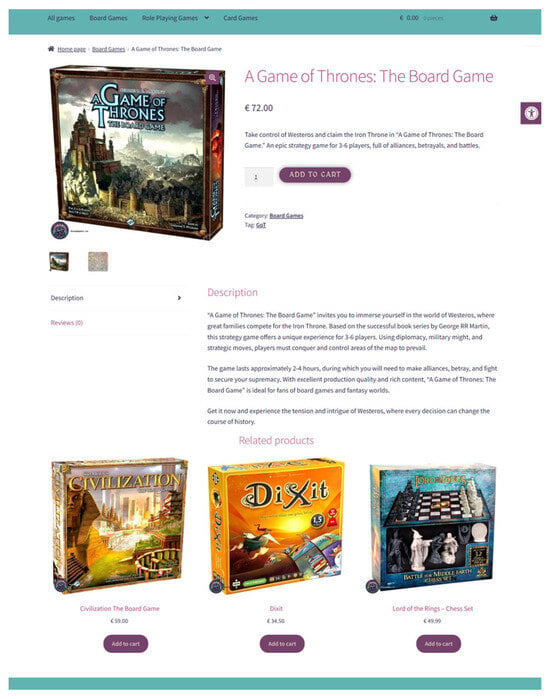
Figure A5.
Sample product page.
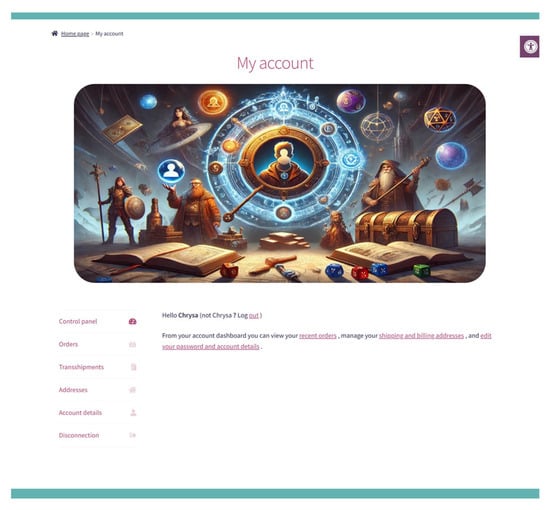
Figure A6.
My account page.

Figure A7.
Newsletter page.
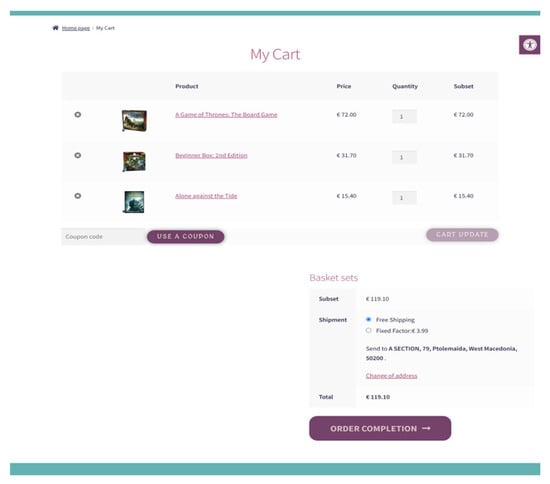
Figure A8.
My cart page.
Appendix B

Figure A9.
Pearson correlation matrix.
References
- Kanbach, D.K.; Heiduk, L.; Blueher, G.; Schreiter, M.; Lahmann, A. The GenAI Is out of the Bottle: Generative Artificial Intelligence from a Business Model Innovation Perspective. Rev. Manag. Sci. 2024, 18, 1189–1220. [Google Scholar] [CrossRef]
- Bi, Q. Analysis of the Application of Generative AI in Business Management. Adv. Econ. Manag. Res. 2023, 6, 36. [Google Scholar] [CrossRef]
- Gozalo-Brizuela, R.; Garrido-Merchan, E.C. ChatGPT Is Not All You Need. A State-of-the-Art Review of Large Generative AI Models. arXiv 2023, arXiv:2301.04655. [Google Scholar]
- AlQaruty, S.; Qaruty, R.A.; Al-Tkhayneh, K.M.; Hadi, S.A.; Ellala, Z.K. The Role of Artificial Intelligence in the Media Content Industry (Chat GPT as a Model). In Proceedings of the 2024 International Conference on Multimedia Computing, Networking and Applications (MCNA), Valencia, Spain, 17–20 September 2024; pp. 50–56. [Google Scholar]
- Patil, D.; Rane, N.L.; Rane, J. Applications of ChatGPT and Generative Artificial Intelligence in Transforming the Future of Various Business Sectors|Deep Science Publishing. Available online: https://deepscienceresearch.com/index.php/dsr/catalog/book/11/chapter/81 (accessed on 11 March 2025).
- Vayadande, K.; Pednekar, C.B.; Khune, P.A.; Prabhavalkar, V.S.; Dange, V.R. GPT-3- and DALL-E-Powered Applications; Wiley: Hoboken, NJ, USA, 2024; pp. 329–341. [Google Scholar] [CrossRef]
- Cui, Y.G.; van Esch, P.; Phelan, S. How to Build a Competitive Advantage for Your Brand Using Generative AI. Bus. Horiz. 2024, 67, 583–594. [Google Scholar] [CrossRef]
- Xu, M.; Niyato, D.; Kang, J.; Xiong, Z.; Guo, S.; Fang, Y.; Kim, D.I. Generative AI-Enabled Mobile Tactical Multimedia Networks: Distribution, Generation, and Perception. IEEE Commun. Mag. 2024, 62, 96–102. [Google Scholar] [CrossRef]
- Teodorescu, D.; Aivaz, K.-A.; Vancea, D.P.C.; Condrea, E.; Dragan, C.; Olteanu, A.C. Consumer Trust in AI Algorithms Used in E-Commerce: A Case Study of College Students at a Romanian Public University. Sustainability 2023, 15, 11925. [Google Scholar] [CrossRef]
- Darda, K.M.; Cross, E.S. The Computer, A Choreographer? Aesthetic Responses to Randomly-Generated Dance Choreography by a Computer. Heliyon 2023, 9, e12750. [Google Scholar] [CrossRef] [PubMed]
- Raji, M.A.; Olodo, H.B.; Oke, T.T.; Addy, W.A.; Ofodile, O.C.; Oyewole, A.T. E-Commerce and Consumer Behavior: A Review of AI-Powered Personalization and Market Trends. GSC Adv. Res. Rev. 2024, 18, 066–077. [Google Scholar] [CrossRef]
- Kumar, A.; Garine, R.; Soni, A.; Arora, R. Leveraging AI for E-Commerce Personalization: Insights and Challenges from 2020. 2024. [Google Scholar] [CrossRef]
- Historical Yearly Trends in the Usage Statistics of Content Management Systems, March 2025. Available online: https://w3techs.com/technologies/history_overview/content_management/all/y (accessed on 11 March 2025).
- Bawack, R.E.; Wamba, S.F.; Carillo, K.D.A.; Akter, S. Artificial Intelligence in E-Commerce: A Bibliometric Study and Literature Review. Electron. Mark. 2022, 32, 297–338. [Google Scholar] [CrossRef]
- Ghaffari, S.; Yousefimehr, B.; Ghatee, M. Generative-AI in E-Commerce: Use-Cases and Implementations. In Proceedings of the 2024 20th CSI International Symposium on Artificial Intelligence and Signal Processing (AISP), Babol, Iran, 21–22 February 2024; pp. 1–5. [Google Scholar]
- Feuerriegel, S.; Hartmann, J.; Janiesch, C.; Zschech, P. Generative AI. Bus. Inf. Syst. Eng. 2024, 66, 111–126. [Google Scholar] [CrossRef]
- Brown, T.B.; Mann, B.; Ryder, N.; Subbiah, M.; Kaplan, J.; Dhariwal, P.; Neelakantan, A.; Shyam, P.; Sastry, G.; Askell, A.; et al. Language Models Are Few-Shot Learners. In Proceedings of the 34th Conference on Neural Information Processing Systems Vancouver, Vancouver, BC, Canada, 6–12 December 2020; pp. 1877–1901. [Google Scholar]
- Ramesh, A.; Pavlov, M.; Goh, G.; Gray, S.; Voss, C.; Radford, A.; Chen, M.; Sutskever, I. Zero-Shot Text-to-Image Generation. In Proceedings of the 38th International Conference on Machine Learning, Virtual, 18–24 July 2021. [Google Scholar] [CrossRef]
- Fui-Hoon Nah, F.; Zheng, R.; Cai, J.; Siau, K.; Chen, L. Generative AI and ChatGPT: Applications, Challenges, and AI-Human Collaboration. J. Inf. Technol. Case Appl. Res. 2023, 25, 277–304. [Google Scholar] [CrossRef]
- Noy, S.; Zhang, W. Experimental Evidence on the Productivity Effects of Generative Artificial Intelligence. Science 2023, 381, 187–192. [Google Scholar] [CrossRef] [PubMed]
- Huang, Y.; Lv, S.; Tseng, K.-K.; Tseng, P.-J.; Xie, X.; Lin, R.F.-Y. Recent Advances in Artificial Intelligence for Video Production System. Enterp. Inf. Syst. 2023, 17, 2246188. [Google Scholar] [CrossRef]
- Kshetri, N.; Dwivedi, Y.K.; Davenport, T.H.; Panteli, N. Generative Artificial Intelligence in Marketing: Applications, Opportunities, Challenges, and Research Agenda. Int. J. Inf. Manag. 2024, 75, 102716. [Google Scholar] [CrossRef]
- Generative AI—Worldwide | Statista Market Forecast. Available online: http://frontend.xmo.prod.aws.statista.com/outlook/tmo/artificial-intelligence/generative-ai/worldwide (accessed on 11 March 2025).
- Highlights from the Second Edition: State of Commerce. Available online: https://www.salesforce.com/eu/resources/research-reports/state-of-commerce/ (accessed on 11 March 2025).
- Wasilewski, A. Functional Framework for Multivariant E-Commerce User Interfaces. J. Theor. Appl. Electron. Commer. Res. 2024, 19, 412–430. [Google Scholar] [CrossRef]
- Hassna, G.; Rouibah, K.; Benjamin Lowry, P.; Paliszkiewicz, J.; Mądra-Sawicka, M. The Roles of User Interface Design and Uncertainty Avoidance in B2C Ecommerce Success: Using Evidence from Three National Cultures. Electron. Commer. Res. Appl. 2023, 61, 101297. [Google Scholar] [CrossRef]
- Venkatesh, V.; Morris, M.G.; Davis, G.B.; Davis, F.D. User Acceptance of Information Technology: Toward a Unified View. MIS Q. 2003, 27, 425–478. [Google Scholar] [CrossRef]
- Marso. The Effect of Perceived Ease of Use and Perceived Usefulness on Trust, Loyalty of E-Commerce Customers. In Proceedings of the 19th International Symposium on Management (INSYMA 2022), Surabaya, Indonesia, 5 December 2022; pp. 796–804. [Google Scholar] [CrossRef]
- Nama, P. Enhancing User Experience in Mobile Applications through AI-Driven Personalization and Adaptive Learning Algorithms. World J. Adv. Eng. Technol. Sci. 2021, 3, 083–094. [Google Scholar] [CrossRef]
- Abed, M.E.; Castro-Lopez, A. The Impact of AI-Powered Technologies on Aesthetic, Cognitive and Affective Experience Dimensions: A Connected Store Experiment. Asia Pac. J. Mark. Logist. 2023, 36, 715–735. [Google Scholar] [CrossRef]
- Peng, Y.; Wang, Y.; Li, J.; Yang, Q. Impact of AI-Oriented Live-Streaming E-Commerce Service Failures on Consumer Disengagement—Empirical Evidence from China. J. Theor. Appl. Electron. Commer. Res. 2024, 19, 1580–1598. [Google Scholar] [CrossRef]
- Zhang, R.W.; Liang, X.; Wu, S.-H. When Chatbots Fail: Exploring User Coping Following a Chatbots-Induced Service Failure. Inf. Technol. People 2024, 37, 175–195. [Google Scholar] [CrossRef]
- Wang, Y.; Pan, Y.; Yan, M.; Su, Z.; Luan, T.H. A Survey on ChatGPT: AI-Generated Contents, Challenges, and Solutions. IEEE Open J. Comput. Soc. 2023, 4, 280–302. [Google Scholar] [CrossRef]
- Jiang, X.; Wu, Z.; Yu, F. Constructing Consumer Trust through Artificial Intelligence Generated Content. Acad. J. Bus. Manag. 2024, 6, 263–272. [Google Scholar] [CrossRef]
- Kormann, R.J.L.; Tezza, R.; Kieling, A.P. Analysis of the Influence of the Color Aesthetic Element on Trust in Mobile Commerce Interfaces. Des. E Tecnol. 2024, 14, 51–61. [Google Scholar] [CrossRef]
- Marwan, A.; Harkim, H.; Sugiharto, B. The Impact of Visual Marketing on Purchasing Behavior in E-Commerce: A Case Study in The Fashion Industry. Gold. Ratio Data Summ. 2024, 4, 1022–1031. [Google Scholar] [CrossRef]
- Sunarmie; Pamungkur; Elliyana, E. Optimal Website Design Strategy in E-Commerce. J. Prod. Oper. Manag. Econ. 2024, 4, 64–76. [Google Scholar] [CrossRef]
- Han, S.; Hong, S.; Choi, J.; Jung, Y. A Study on Consumer Perceptions of Artificial Intelligence Generated Content (AIGC) and Artificial Intelligence Disclaimer (AID) Based on Content Value and Format. Gyeongyeong Jeongbohak Yeongu 2024, 26, 187–216. [Google Scholar] [CrossRef]
- Shin, D.; Zaid, B.; Biocca, F.; Rasul, A. In Platforms We Trust? Unlocking the Black-Box of News Algorithms through Interpretable AI. J. Broadcast. Electron. Media 2022, 66, 235–256. [Google Scholar] [CrossRef]
- Zagal, J.P.; Rick, J.; Hsi, I. Collaborative Games: Lessons Learned from Board Games. Simul. Gaming 2006, 37, 24–40. [Google Scholar] [CrossRef]
- Iqbal, M.; Noman, M.; Talpu, S.; Manzoor, A.; Muneeb Abid, M. An Empirical Study of Popular Content Management System—Wordpress vs Drupal vs Joomla. ICTACT J. Manag. Stud. 2020, 6, 1214–1219. [Google Scholar] [CrossRef]
- Lin, J.; Sayagh, M.; Hassan, A.E. The Co-Evolution of the WordPress Platform and Its Plugins. ACM Trans. Softw. Eng. Methodol. 2023, 32, 19:1–19:24. [Google Scholar] [CrossRef]
- OpenAI; Achiam, J.; Adler, S.; Agarwal, S.; Ahmad, L.; Akkaya, I.; Aleman, F.L.; Almeida, D.; Altenschmidt, J.; Altman, S.; et al. GPT-4 Technical Report. arXiv 2023, arXiv:2303.08774. [Google Scholar] [CrossRef]
- Malhar, S.M. DALL. E 2. Int. J. Sci. Res. Comput. Sci. Eng. Inf. Technol. 2023, 9, 48–56. [Google Scholar] [CrossRef]
- Automattic WooCommerce. Available online: https://wordpress.org/plugins/woocommerce/ (accessed on 11 March 2025).
- Storefront|WordPress Theme Directory. Available online: https://wordpress.org/themes/storefront/ (accessed on 11 March 2025).
- Brandstore—Astra. Available online: https://wpastra.com/templates/brandstore-02/ (accessed on 11 March 2025).
- Yoast Yoast SEO. Available online: https://wordpress.org/plugins/wordpress-seo/ (accessed on 11 March 2025).
- Gutub, A.; Kheshaifaty, N. Practicality Analysis of Utilizing Text-Based CAPTCHA vs. Graphic-Based CAPTCHA Authentication. Multimed. Tools Appl. 2023, 82, 46577–46609. [Google Scholar] [CrossRef] [PubMed]
- Vollenwyder, B.; Petralito, S.; Iten, G.H.; Brühlmann, F.; Opwis, K.; Mekler, E.D. How Compliance with Web Accessibility Standards Shapes the Experiences of Users with and without Disabilities. Int. J. Hum.-Comput. Stud. 2023, 170, 102956. [Google Scholar] [CrossRef]
- Johnston, R.; Harris, R.; Jones, K.; Manley, D.; Wang, W.W.; Wolf, L. Quantitative Methods I: The World We Have Lost—Or Where We Started From. Prog. Hum. Geogr. 2019, 43, 1133–1142. [Google Scholar] [CrossRef]
- Al-Qeisi, K.; Dennis, C.; Alamanos, E.; Jayawardhena, C. Website Design Quality and Usage Behavior: Unified Theory of Acceptance and Use of Technology. J. Bus. Res. 2014, 67, 2282–2290. [Google Scholar] [CrossRef]
- Mpinganjira, M. An Investigation of Perceived Service Quality in Online Shopping: A Hierarchical Approach. J. Appl. Bus. Res. JABR 2015, 31, 115–130. [Google Scholar] [CrossRef]
- Thielsch, M.T.; Blotenberg, I.; Jaron, R. User Evaluation of Websites: From First Impression to Recommendation. Interact. Comput. 2014, 26, 89–102. [Google Scholar] [CrossRef]
- Nia, M.R.; Shokouhyar, S. Analyzing the Effects of Visual Aesthetic of Web Pages on Users’ Responses in Online Retailing Using the VisAWI Method. J. Res. Interact. Mark. 2020, 14, 357–389. [Google Scholar] [CrossRef]
- Cyr, D.; Head, M.; Lim, E.; Stibe, A. Using the Elaboration Likelihood Model to Examine Online Persuasion through Website Design. Inf. Manage. 2018, 55, 807–821. [Google Scholar] [CrossRef]
- Liang, R.; Wang, J.; Zhang, H. Evaluation of E-Commerce Websites: An Integrated Approach under a Single-Valued Trapezoidal Neutrosophic Environment. Knowl. Based Syst. 2017, 135, 44–59. [Google Scholar] [CrossRef]
- Bleier, A.; Harmeling, C.M.; Palmatier, R.W. Creating Effective Online Customer Experiences. J. Mark. 2019, 83, 98–119. [Google Scholar] [CrossRef]
- Caldarini, G.; Jaf, S.; McGarry, K. A Literature Survey of Recent Advances in Chatbots. Information 2022, 13, 41. [Google Scholar] [CrossRef]
- Sohaib, O.; Kang, K. Assessing Web Content Accessibility of E-Commerce Websites for People with Disabilities. In Proceedings of the 25th International Conference on Information Systems Development, Katowice, Poland, 24–26 August 2016. [Google Scholar]
- Ingaldi, M. E-Service Quality Assessment According to Hierarchical Service Quality Models. Manag. Syst. Prod. Eng. 2022, 30, 311–318. [Google Scholar] [CrossRef]
- Cachero-Martínez, S.; Vázquez-Casielles, R. Building Consumer Loyalty through E-Shopping Experiences: The Mediating Role of Emotions. J. Retail. Consum. Serv. 2021, 60, 102481. [Google Scholar] [CrossRef]
- Chang, H.H.; Chen, S.W. Consumer Perception of Interface Quality, Security, and Loyalty in Electronic Commerce. Inf. Manag. 2009, 46, 411–417. [Google Scholar] [CrossRef]
- Bhardwaj, P. Types of Sampling in Research. J. Pract. Cardiovasc. Sci. 2019, 5, 157. [Google Scholar] [CrossRef]
- Schober, P.; Boer, C.; Schwarte, L.A. Correlation Coefficients: Appropriate Use and Interpretation. Anesth. Analg. 2018, 126, 1763–1768. [Google Scholar] [CrossRef] [PubMed]
- Hair, J.F. Multivariate Data Analysis, 8th ed.; Cengage: Andover, Hampshire, 2019; ISBN 978-1-4737-5654-0. [Google Scholar]
- Patel, S.K.; Suthar, F.; Patel, S.; Prajapati, J. A Comparison of Top-Rated Open-Source CMS—Joomla, Drupal, and WordPress for E-Commerce Website. In Computer Vision and Robotics; Shukla, P.K., Singh, K.P., Tripathi, A.K., Engelbrecht, A., Eds.; Springer Nature: Singapore, 2023; pp. 157–167. [Google Scholar]
- Cabot, J. WordPress: A Content Management System to Democratize Publishing. IEEE Softw. 2018, 35, 89–92. [Google Scholar] [CrossRef]
- Kalla, D.; Smith, N.; Samaah, F.; Kuraku, S. Study and Analysis of Chat GPT and Its Impact on Different Fields of Study. Int. J. Innov. Sci. Res. Technol. 2023, 8, 827–833. [Google Scholar] [CrossRef]
Disclaimer/Publisher’s Note: The statements, opinions and data contained in all publications are solely those of the individual author(s) and contributor(s) and not of MDPI and/or the editor(s). MDPI and/or the editor(s) disclaim responsibility for any injury to people or property resulting from any ideas, methods, instructions or products referred to in the content. |
© 2025 by the authors. Licensee MDPI, Basel, Switzerland. This article is an open access article distributed under the terms and conditions of the Creative Commons Attribution (CC BY) license (https://creativecommons.org/licenses/by/4.0/).