Abstract
Data cleaning remains one of the most time-consuming and critical steps in modern data science, directly influencing the reliability and accuracy of downstream analytics. In this paper, we present a comprehensive evaluation of five widely used data cleaning tools—OpenRefine, Dedupe, Great Expectations, TidyData (PyJanitor), and a baseline Pandas pipeline—applied to large-scale, messy datasets spanning three domains (healthcare, finance, and industrial telemetry). We benchmark each tool on dataset sizes ranging from 1 million to 100 million records, measuring execution time, memory usage, error detection accuracy, and scalability under increasing data volumes. Additionally, we assess qualitative aspects such as usability and ease of integration, reflecting real-world adoption concerns. We incorporate recent findings on parallelized data cleaning and highlight how domain-specific anomalies (e.g., negative amounts in finance, sensor corruption in industrial telemetry) can significantly impact tool choice. Our findings reveal that no single solution excels across all metrics; while Dedupe provides robust duplicate detection and Great Expectations offers in-depth rule-based validation, tools like TidyData and baseline Pandas pipelines demonstrate strong scalability and flexibility under chunk-based ingestion. The choice of tool ultimately depends on domain-specific requirements (e.g., approximate matching in finance and strict auditing in healthcare) and the magnitude of available computational resources. By highlighting each framework’s strengths and limitations, this study offers data practitioners clear, evidence-driven guidance for selecting and combining tools to tackle large-scale data cleaning challenges.
1. Introduction
Data cleaning is a critical yet time-consuming component of modern data science and analytics. Studies have repeatedly shown that upwards of 80% of a data professional’s efforts are spent on tasks such as detecting and correcting erroneous entries, reconciling duplicates, and standardizing inconsistent formats [1,2]. As organizations increasingly rely on data-driven decision making across domains like healthcare, finance, and industry, the quality and reliability of raw data often determines the accuracy and robustness of downstream machine learning models and business intelligence insights. Although many software tools and libraries claim to streamline or automate this process, practitioners still struggle to find solutions that can scale to tens or hundreds of millions of rows while maintaining high accuracy in error detection.
Scalability poses significant challenges because cleaning large datasets is not merely a matter of running faster algorithms; it also requires carefully managing memory footprints, parallelizing computations, and avoiding performance bottlenecks in I/O and intermediate transformations. Additionally, the heterogeneous and “messy” nature of real-world data—ranging from partially structured electronic health records to high-frequency financial transactions or noisy sensor logs—complicates attempts at automated cleaning. For example, domain-specific anomalies such as negative transaction amounts in financial data or corrupted sensor readings in industrial telemetry can invalidate simplistic cleaning rules, demanding more sophisticated approaches like machine learning-based deduplication or declarative validation suites [3,4]. Yet, despite the variety of open source tools designed to tackle these problems (e.g., OpenRefine, Dedupe, and Great Expectations), their performance and effectiveness at very large scales remain underexplored in the literature. Furthermore, recent efforts in data error detection [5] and parallel data cleaning systems [6] highlight the need for benchmarking across multiple domains and large record counts.
A key limitation across existing research is the lack of comprehensive benchmarking studies that evaluate multiple tools on genuinely big and messy datasets while also measuring both quantitative performance metrics (execution time, memory consumption, and scalability) and qualitative aspects (usability and integration effort). Previous surveys and system evaluations often focus on either smaller academic testbeds or single-system case studies [7,8], leaving practitioners uncertain about which tool may best fit their production-scale needs. As a result, the decision to adopt one cleaning framework over another can be risky and largely anecdotal.
Contributions. In this work, we address these issues by conducting a large-scale, multi-domain benchmarking of the following five widely adopted data cleaning tools: OpenRefine, Dedupe, Great Expectations, TidyData (PyJanitor), and a baseline Pandas pipeline. We curate three real-world datasets from healthcare, finance, and industrial telemetry, each sized from one to one hundred million records, to simulate genuine messy data challenges. Our evaluation encompasses five key metrics as follows: (i) execution time, (ii) memory consumption, (iii) scalability under increasing data sizes, (iv) accuracy of error detection, and (v) qualitative usability. By systematically applying the same cleaning tasks—such as duplicate detection, outlier removal, formatting, and consistency checks—we reveal not only the relative strengths and weaknesses of each approach, but also insights into how domain-specific requirements affect tool performance. We aim to provide data scientists, engineers, and researchers with an evidence-based reference for selecting a suitable data cleaning solution, especially in contexts that demand high throughput, large memory handling, or robust validation.
The remainder of this paper is organized as follows. Section 2 reviews foundational and recent studies on data cleaning, highlighting the lack of large-scale empirical benchmarks. Section 3 introduces the five tools evaluated. Section 4 details our datasets, experimental pipeline, and performance metrics. In Section 5, we present and analyze our benchmarking results across healthcare, finance, and industrial domains. Section 6 resumes and discusses the findings. Finally, Section 7 concludes with the key findings, limitations, and potential avenues for future research.
2. Related Work
Data cleaning has been a longstanding challenge in data management and analytics, with early foundational works such as the survey by Rahm and Do [1] and the record linkage handbook by Newcombe [9] establishing many core concepts. As data volumes have grown and real-world datasets have become increasingly heterogeneous, the need for systematic and scalable cleaning approaches has intensified. In recent years, researchers have proposed novel algorithms and interactive tools to detect and correct common data quality issues (e.g., duplicate records, missing values, inconsistent formats, or outlier entries). However, comprehensive performance evaluations across multiple domains and dataset scales remain relatively sparse.
2.1. Overview of Existing Studies on Data Cleaning Algorithms
Several seminal works detail the algorithmic foundations of data cleaning and record linkage. For example, Rahm and Do [1] provide a broad overview of data cleaning problems (duplicate detection, schema matching, and transformation), while Elmagarmid et al. [4] offer a survey focused on duplicate-record detection in large repositories. These early surveys highlight the importance of blocking strategies and similarity measures, which remain central to modern deduplication frameworks such as Dedupe [10].
Constraints and emerging challenges. Chu et al. [7] have explored end-to-end data cleaning pipelines by integrating constraint-based error detection, data repairing, and proof-of-correctness checks, providing insights into how theoretical advances can be integrated into practical systems. Similarly, Abedjan et al. [5] discuss the detection of data errors, underscoring how a variety of error types (typos, outliers, or duplicates) require flexible yet efficient cleaning mechanisms. Very recent work by Ahmadi et al. [6] focuses on accelerating the Raha and Baran data cleaning systems through task and data parallelism, demonstrating the importance of parallel strategies to handle large volumes effectively.
In the realm of interactive data transformation, Kandel et al. [2] introduced Wrangler (later commercialized as Trifacta), demonstrating how a combination of machine learning suggestions and user interactions can drastically reduce the time spent on cleaning complex data. Although these works address theoretical and algorithmic progress, they often focus on a single system or approach, rather than systematically benchmarking multiple open source tools in large-scale, real-world settings.
2.2. Surveys of Open Source Cleaning Tools and Existing Gaps
The proliferation of open source data wrangling platforms (e.g., OpenRefine, DataWrangler, and various Python or R libraries) has received growing attention in both academic and practitioner communities. Researchers have begun to catalog such tools’ features and user experience. For instance, Kandel et al. [3] offered insights into the cognitive processes behind data transformation tasks, while Singh and Jain [11] compiled a survey of data cleaning frameworks, comparing functionality such as interactive faceting, rule-based validation, and automation capabilities.
Recent surveys by Papastergios and Gounaris [12] and Ehrlinger and Wöß [13] have further investigated the open source data quality landscape, including tools like Apache Griffin and Great Expectations. These works focus on how different frameworks implement data quality dimensions (e.g., completeness and consistency) and reveal that practitioners often struggle to compare performance at scale.
Despite these endeavors, three notable gaps persist as follows:
- Lack of large-scale benchmarks: Many surveys emphasize functionality rather than performance, providing limited empirical evidence on how these tools scale to tens or hundreds of millions of rows. As a result, practitioners face uncertainty when selecting a solution for big data environments.
- Domain-specific validation: While some works detail domain-specific cleaning, especially in healthcare or financial datasets, few systematically contrast tools across multiple domains with different error patterns. Domain nuances such as sensor noise (industrial) or typographical errors (healthcare) can significantly affect tool efficacy.
- Real-world integration and usability: Usability, maintenance, and integration with broader data pipelines (e.g., MLOps) are often addressed only superficially. Efforts like Great Expectations [14] underscore the importance of validation and documentation, yet comprehensive comparisons that measure overhead, memory constraints, and user adoption are still limited.
These gaps motivate the need for a more extensive evaluation of open source tools—one that combines large-scale performance tests, domain-diverse error scenarios, and qualitative assessments of usability. Our work addresses precisely these aspects by systematically benchmarking five widely adopted solutions (OpenRefine, Dedupe, Great Expectations, TidyData/PyJanitor, and a Pandas baseline) on real-world healthcare, finance, and industrial telemetry data.
2.3. Automated Error-Detection Systems
Early studies treated error detection and repair as inseparable steps, yet the last decade has produced a stand-alone literature whose goal is to simply flag corrupted cells with high recall and low false positives, allowing the repair strategy (or downstream ML model) to act later. We group these systems into three methodological families.
- (i)
- Rule- and constraint-based detectors.
Detective [7], DATA-GUIDE, and a line of work on denial constraints [5] encode domain knowledge as logic rules (e.g., “age > 0”, “zip codes follow [0-9]{5}”). Violations are found with SQL or SAT solvers; coverage is high when good rules exist but brittle when they do not.
- (ii)
- Probabilistic and statistical models.
HoloClean formulates anomaly detection as probabilistic inference over a factor graph that combines constraints, duplicates, and external knowledge bases [15]. The model flags low-probability cells as errors and can optionally suggest repairs (MAP inference). Such methods achieve state-of-the-art precision but may require hours of sampling on very wide tables.
- (iii)
- Learning-based ensembles and lightweight detectors.
BoostClean—the work highlighted by the reviewer—treats both detection and repair as weak learners in a boosting ensemble trained to maximize downstream ML accuracy [16]. The system evaluates dozens of detectors (regex, density, and classifier-agreement tests) and learns which ones improve F1 by up to 4 pp on 12 prediction tasks. More recently, Raha [17] and Baran [18] encoded each cell by lightweight statistical features (row entropy and type deviation) and train gradient-boosted trees; Baran has added a task-parallel runtime that scales to 10 M-rows in under a minute on a single machine. Industry practitioners with Spark clusters often adopt Deequ or Apache Griffin, which push rule evaluation and profiling to distributed executors.
- Position of this work.
Our benchmark focuses on end-to-end cleaning frameworks that bundle detection, transformation, and validation into a single tool (OpenRefine, Dedupe, Great Expectations, etc.). Dedicated detectors such as BoostClean, Raha, and Baran excel at flagging syntactic or statistical anomalies but do not provide imputation, type casting, or duplicate resolution—the tasks we benchmark in Section 4, Section 5 and Section 6. A side-by-side evaluation would therefore require a different experimental design (e.g., pluggable detector modules feeding into a common repair pipeline), which we outline as future work in Section 6. Nevertheless, the lessons from BoostClean and related systems inform our discussion of how detection quality affects downstream ML performance
2.4. Why Tool Performance Matters in Big Data and Applied Environments
As data volumes expand into the range of tens or hundreds of millions of rows, computational constraints around memory and processing time can become prohibitive. Traditional data cleaning workflows often assume in-memory operations and user-driven exploration, which can lead to unmanageable runtimes or frequent system crashes at scale. For instance, Stonebraker et al. [8] discuss the concept of “data curation at scale” and introduce system-level optimizations for the Data Tamer platform. Their results illustrate how naive approaches can quickly become infeasible when confronted with industrial-grade datasets that exhibit complex error distributions. Similarly, Raha and Baran have demonstrated that leveraging parallelism is critical for timely data cleaning [6]
A commercial successor to Stonebraker’s Data Tamer is Tamr, which extends the original curation engine with distributed, column-store back-ends and Hadoop/Spark execution [19]. While Tamr demonstrates that data cleaning can be scaled horizontally, its source code and benchmark suites are not publicly available, preventing a fair, reproducible comparison in our open-source study.
Beyond raw scale, performance directly impacts downstream analytics and machine learning pipelines. High-latency or failure-prone data cleaning steps delay model training and degrade organizational agility [2,20]. Beyond the raw scale, performance directly impacts downstream analytics and machine learning pipelines. High-latency or failure-prone data cleaning steps delay model training and degrade organizational agility [2,20]. A large-scale empirical study by Mohammed et al. [21] quantifies this relationship, showing that improvements in key data-quality dimensions (e.g., duplication, noise, and label accuracy) can boost model accuracy by up to 25 percentage points across 71 diverse ML tasks. In regulated environments (e.g., healthcare and finance), it is often mandatory to validate each transformation step or produce a comprehensive documentation of corrections. Tools like Great Expectations [14] provide automated validation suites, but the overhead of scanning large tables or maintaining multiple checkpoints can be substantial if not carefully benchmarked.
2.5. Comparative Summary of Existing Research
Table 1 provides a concise overview of influential studies related to data cleaning tools, along with their scope and major limitations. While many of these works offer valuable insights into algorithms, interactive design, or domain-specific cleaning, few deliver cross-domain, large-scale performance evaluation with direct comparisons across multiple open source platforms.

Table 1.
Representative studies on data cleaning, highlighting their primary focus and key gaps addressed.
In light of these observations, our work aims to bridge the gap by conducting a rigorous empirical study that (1) runs consistent cleaning pipelines on large (1M–100M record) datasets from three distinct domains, (2) measures computational performance (time, memory) alongside error detection accuracy, and (3) includes a qualitative usability survey reflecting real-world adoption concerns.
3. Tools and Frameworks Under Study
In this study, we evaluate five widely used tools and frameworks for data cleaning and preprocessing, selected to cover different paradigms for both scripting and interactive workflows. By comparing their performance, scalability, error-detection accuracy, and ease of use, we aim to offer practitioners an informed basis for choosing an appropriate solution. Below is an integrated discussion of each tool’s key features, typical usage patterns, and references to prior works or official documentation. We note that other open source solutions exist, including Spark-based frameworks (e.g., Apache Griffin [13]) and the recent data cleaning systems (e.g., Raha, Baran [6]), but we chose the five highlighted tools due to their wide usage, Python ecosystem integration, and maturity at the time of our experiments.1
We purposely restricted this benchmark to tools that run on a single server without an external cluster (Spark, Flink, etc.). This choice reflects a frequent deployment reality in small- and medium-sized data teams, where a 32–64GB workstation handles tens–hundreds of millions of rows economically. Section 6 discusses when distributed frameworks become indispensable.
OpenRefine [22] (formerly Google Refine) is an open source application designed for interactively exploring and cleaning messy datasets. Users typically upload CSV or TSV files into a spreadsheet-like interface that supports the faceting, clustering, and transformation of values. These features allow non-technical stakeholders or data wranglers to visually identify anomalies (e.g., inconsistent naming conventions) and apply scripted fixes using a domain-specific expression language (GREL). Due to its interactive focus, OpenRefine can simplify small- to medium-scale data cleaning, but it may encounter performance constraints on multi-million-row datasets. Nonetheless, its strong clustering and faceting functionality has led to widespread adoption in digital humanities and data journalism contexts. In larger-scale use cases (e.g., >50M rows), memory limits often become a bottleneck, making chunk-based or distributed solutions more practical.
Dedupe [10] is a Python library specializing in deduplication and entity-resolution tasks. Rather than relying on purely rule-based or exact-match methods, Dedupe employs a machine learning model combined with blocking strategies to identify approximate duplicates efficiently. Users label a small training set of pairs (match/non-match), and Dedupe generalizes these judgments to the entire dataset, scaling up to millions of records if carefully tuned. Although it focuses primarily on duplicates, it provides partial data-cleaning support through record linkage and canonicalization features, making it particularly appealing for finance and CRM-style data integration. Previous studies on record linkage [9,23] have shown the importance of robust blocking and similarity measures, which Dedupe leverages effectively. Its approximate matching capability is particularly useful where typos and variant spellings are common, as noted in finance and healthcare name fields.
Great Expectations [14] introduces a declarative and test-driven approach to data quality by defining “expectations”—readable statements about how data should appear (e.g., allowable ranges, pattern constraints). Originating from industry best practices around data pipelines, Great Expectations tracks the success or failure of each expectation in a validation report, enabling both the automation and documentation of data quality checks. Its integration with Pandas, Spark, and SQL databases allows seamless inclusion in existing workflows, and its extensible design has garnered attention for use in regulated industries (healthcare and finance) that demand rigorous auditing. However, large datasets can increase validation overhead, since Great Expectations often involves scanning every row to verify constraints or perform detailed data profiling. In distributed contexts (e.g., Spark), it can mitigate some in-memory limits, but the creation of multiple checkpoints can still become resource-intensive at 50M+ rows.
TidyData (PyJanitor) [24] encapsulates the “tidy data” philosophy popularized in the R ecosystem, providing Python functions that extend Pandas for concise, chainable cleaning operations. Libraries like PyJanitor offer a fluent API to rename columns, remove duplicates, fill missing values, and reshape data in a clear, script-based manner. This framework inherits Pandas’ vectorized efficiency and familiar syntax while adding convenience methods for routine cleaning tasks. It is particularly useful for structured tabular data where transformations can be batched or pipelined with minimal overhead. Nevertheless, advanced or domain-specific checks (e.g., validating transaction codes) often require user-defined logic, differentiating it from more rule-based frameworks. Moreover, while it supports chunk-based workflows, large-scale distributed processing is not its primary focus, making TidyData a good choice for data sizes up to the low-hundred-million range on a single server.
Baseline: Pandas cleaning pipelines [20] represent a standard reference point, given Pandas’ ubiquity in Python-based data science. Users typically write custom scripts that read CSV/Parquet files, merge or reshape DataFrames, handle missing values, and remove outliers or duplicates. Pandas is sufficiently optimized via its C-based internals and vectorized computations, making it feasible for medium to large datasets on modern hardware. When dealing with extremely large tables (tens or hundreds of millions of rows), performance optimizations such as chunked reading or parallel frameworks like Dask can be employed. Although Pandas lacks specialized interactive clustering or rule-based validation, it can be combined with external libraries (e.g., pandas-profiling) to produce data summaries or detect anomalies. Given its widespread usage, our Pandas scripts serve as a baseline for comparing the overhead and functionality of more specialized solutions.
Key Functionalities Compared. All five tools address fundamental data cleaning operations, though they differ in depth and approach as follows:
- Duplicate detection and removal: Dedupe employs advanced blocking and ML-based matching; OpenRefine, Pandas, and TidyData rely on user-defined criteria or exact comparisons; and Great Expectations can be extended to check for duplicates but requires explicit expectations.
- Missing value handling: PyJanitor methods or Pandas’ built-in .fillna() can handle numeric or string-based imputation, while Great Expectations validates presence or ranges. OpenRefine offers user-friendly transformations for blank fields.
- Consistency checks and validation: Great Expectations excels at declaring constraints (e.g., numeric ranges and string patterns), producing detailed validation reports. OpenRefine facets also help isolate inconsistencies. Pandas, TidyData, and Dedupe often rely on custom code for domain-specific validations.
- Data profiling and exploratory analysis: OpenRefine’s interactive UI, Great Expectations’ built-in profiling, and TidyData’s quick summary functions illustrate different approaches. Pandas alone has df.describe() and can integrate with pandas-profiling or other libraries.
In the subsequent sections of this paper, we explore how these tools perform in large-scale settings, measuring their execution times, memory consumption, scalability, and the accuracy with which they detect and correct artificial or known data errors. By combining quantitative benchmarking with qualitative observations on usability and integration, we aim to present a holistic view of each tool’s suitability for real-world data cleaning and preprocessing workflows.
4. Datasets and Experimental Setup
In this section, we describe our experimental setup, focusing on the three domains under study, the scale of the datasets, and the hardware resources used for all benchmarking tests. We further define the performance metrics and qualitative assessments employed to evaluate each data cleaning tool. By combining both moderate (1M and 10M) and large (50M and 100M) dataset sizes across healthcare, finance, and industrial telemetry domains, we simulate realistic, high-volume scenarios frequently encountered in research and industry. We also explicitly detail the approximate error injection rates (2–5% duplicates, 2–3% placeholder-based missing values, etc.) to make the experimental setup more transparent.
4.1. Domains and Data Characteristics
We selected three domains that often exhibit large, messy datasets as follows (see Table 2):
Table 2.
Overview of the three domains, common data issues, and subset sizes used in our experiments.
- Healthcare: We used a public patient dataset containing demographic attributes (e.g., age and gender), medical codes, and clinical measurements. Common issues include inconsistent formatting of date/times, missing demographic information, and typographical errors in string fields (diagnosis codes and patient names). These reflect real-world challenges in electronic health records (EHR). About 2–3% of the records were artificially injected with corrupted fields (e.g., “???” and negative ages) to test how missing values are handled.
- Financial: Our second dataset consists of anonymized transaction records obtained from a financial institution. Typical errors include duplicate entries (repeated transactions), outliers (extremely large or negative amounts), and invalid timestamps. For benchmarking, we also injected additional duplicates and outlier records to systematically test error detection capabilities. For instance, 4–5% of transactions were duplicated with small string variations, while negative or very large transaction amounts (2–3% of records) tested outlier removal.
- Industrial telemetry: The third dataset contains IoT sensor readings from a manufacturing environment. Data quality issues include random corruption, signal noise, and long periods of missing values. Moreover, logs contain partial free-text entries from field technicians, increasing unstructured content. We inserted around 3% randomly corrupted sensor values (e.g., “NAN” and “corrupt”) to challenge each tool’s ability to detect anomalies.
4.2. Sample Data Distributions
To illustrate the numerical variation in each domain, Figure 1 presents representative histograms of a single numeric feature from each 1M-record subset as follows: patient age in healthcare, transaction amount in finance, and sensor temperature in industrial telemetry. Although these snapshots do not capture every complexity (e.g., text fields and categorical codes), they highlight skewness, potential outliers, and the variety of ranges present in our datasets.
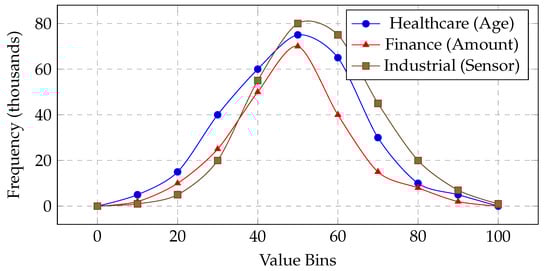
Figure 1.
Illustrative histograms of a numeric feature in each domain’s 1M-record subset, highlighting skewness and outliers. The vertical axis is the approximate frequency (in thousands).
4.3. Dataset Sizes and Subsets
For each of the three domains (healthcare, financial, and industrial), we created four subsets of increasing size as follows: 1M, 10M, 50M, and 100M records. This allows us to test both moderate- and large-scale scenarios as follows:
- 1M records: Typical of small- to mid-sized projects, comfortably processed on most modern desktop systems.
- 10M records: Highlights scaling behavior, still within reach of advanced workstation setups.
- 50M records: Approaches the upper limit of many commodity servers, requiring chunk-based ingestion or robust memory management.
- 100M records: Represents genuinely large data volumes that stress memory, I/O, and CPU resources, often encountered in enterprise or cloud settings.
All subsets preserve the same underlying schema in each domain. Where possible, we cross-reference data rows to inject consistent error patterns (e.g., artificially introduced duplicates, negative transaction amounts, and out-of-range sensor values). We also note approximate file sizes as follows: the 50M healthcare subset occupies about 5.4 GB uncompressed, while the 100M finance subset can approach 10 GB, which can strain I/O throughput and memory.
4.4. Hardware and Computing Environment
All experiments were conducted on a dedicated Linux server with the following specifications:
- CPU: Dual Intel® Xeon® E5-2640 v4 (20 physical cores, 40 threads @ 2.4 GHz).
- Memory: 64 GB DDR4 RAM.
- Storage: 2 TB SSD (sequential reads ≈500 MB/s).
- OS: Ubuntu 20.04 LTS.
- Software: Python 3.9 (with Pandas, Dedupe, Great Expectations, TidyData), Java OpenJDK 11 for OpenRefine.
To assess the behavior under resource constraints, we repeated a subset of experiments (10M and 50M scenarios) while limiting available RAM to 8 GB and CPU cores to 2. This test simulates smaller on-premise servers or cloud instances, reflecting real-world conditions where memory may be restricted. Such a setup allowed us to gauge the performance degradation and paging activity of each tool, validating scalability in more constrained environments.
4.5. Experimental Pipeline and Task Definition
This subsection details every rule, threshold, and placeholder token used in the cleaning workflow so that the entire pipeline can be reproduced without consulting external files. A machine-readable log of each transformation (one JSONL file per domain) is available from the corresponding author upon request.
- Step 0—Data ingestion
- CSV files are streamed in -row chunks via pandas.read_csv(dtype=str, low_memory=False, encoding=’utf-8’).
- Date columns (Timestamp, AdmissionDate) are parsed on the fly with the format list {"%Y-%m-%d", "%d/%m/%Y", "%m-%d-%Y"}.
- After parsing, column dtypes are fixed as follows: numeric sensors → float32, age/amount → int16, string IDs → category.
- Step 1—Placeholder normalisation
Table 3 enumerates all strings converted to NaN. No other value is treated as missing.
Table 3.
Variable-specific placeholder tokens treated as missing.
- Step 2—Handling missing values
- Numeric columns : Median imputation calculated within each chunk.
- Categorical columns : Mode imputation (ties resolved alphabetically).
- Primary keys: Any record missing a key value is dropped (<0.05% per domain).
- Step 3—Duplicate detection
- Blocking keys – Finance: TransactionID+Timestamp+UserID; – Healthcare: PatientID+AdmissionDate; – Industrial: SensorID+TimeStamp.
- Exact-match duplicates are removed with drop_duplicates().
- Approximate duplicates (Finance, Healthcare) are identified with Dedupe using 50 manually labelled pairs and a similarity threshold of 0.7 (cosine similarity over tokenised text fields).
- Step 4—Outlier detection
- Inter-quartile range (IQR) rule: Values outside .
- Domain caps: Age or ; amount or USD; sensor reading or °C.
- Outliers are set to NaN and flagged in is_outlier.
- Step 5—Formatting and normalisation
- Dates converted to ISO8601 (YYYY-MM-DD).
- Gender strings collapsed to M or F.
- Text trimmed and lower-cased; multiple spaces collapsed.
- Step 6—Audit logging
Each transformation appends a JSON line {step, column, n_affected, timestamp} to a domain-specific log file (e.g., finance_clean_log.jsonl). These logs are available from the corresponding author upon request and allow the entire pipeline to be replayed verbatim.
4.6. Performance Metrics and Qualitative Assessment
Our evaluation considers five metrics, capturing both quantitative performance and practical usability as follows:
- Execution time: Total wall-clock time for the entire cleaning pipeline. This is measured from the start of data loading to the completion of all tasks. We repeat each test three times to mitigate transient variance.
- Memory consumption: Peak resident set size (RSS) during the pipeline, tracked with system monitoring tools (e.g., psutil). Larger dataset sizes (50M and 100M) can stress memory, revealing scaling limits or the need for chunk-based approaches.
- Scalability (increasing dataset sizes): We compare runtime and memory usage across 1M, 10M, 50M, and 100M records in each domain. Near-linear growth indicates better scalability, whereas super-linear growth can signal performance bottlenecks.
- Accuracy of error detection: We introduce known errors (duplicates, outliers, and invalid fields) or rely on domain-labeled issues, and we measure the fraction successfully flagged or resolved by each tool. This safeguards against sacrificing cleaning effectiveness for speed alone. Specifically, for each injected anomaly (e.g., a duplicated transaction), we label it as detected if the tool either flags or removes it without user intervention.
- Usability (qualitative assessment): We collect user feedback from five data practitioners who tried each tool on the 10M healthcare subset. They rated installation complexity, documentation clarity, interface or API ease, and automation capabilities. This subjective metric recognizes that real-world adoption depends not only on raw speed but also on user experience.
To assess usability, we gathered feedback from five practitioners with varying levels of experience in data cleaning as follows:
- Three professional data scientists with 3–5 years of industry experience.
- One data engineer responsible for ETL/ELT pipelines.
- One graduate student in data analytics.
Each participant was asked to clean a 10M-record healthcare subset using each of the five tools under their typical working conditions, taking note of the following:
- Installation complexity: For example, dependency conflicts and documentation clarity.
- Learning curve: Initial difficulty in applying common cleaning tasks.
- Efficiency of interface or API: How quickly they could perform transformations.
- Automation capabilities: Suitability for scripting or integration into larger pipelines.
We then compiled these observations in a short questionnaire (1–5 Likert scale) and summarized the averaged scores and key comments in Section 5.1 (or wherever you present results). While these ratings are subjective, they reflect real-world adoption concerns that go beyond raw computational metrics.
4.7. Representative Data Snippets
Table 4 shows short excerpts of raw data rows, illustrating typical problems found in each domain. For example, the healthcare snippet reveals inconsistent date formats and potentially invalid ages, while the finance snippet shows repeated transaction IDs, out-of-range amounts, and timestamp variations. The industrial snippet highlights corrupted sensor readings (“NAN” and “corrupt”) alongside textual technician comments.
Table 4.
Representative raw data samples, showcasing common errors in each domain (simplified CSV style).
4.8. Summary of Experimental Workflow
Figure 2 provides a high-level schematic of our experimental process. Each tool executes identical cleaning tasks across four dataset sizes (1M, 10M, 50M, and 100M). During each stage, we record the time, memory, and error detection rates. Finally, a usability survey is conducted with data practitioners to gather qualitative feedback. The subsequent Section 5 presents our empirical findings.
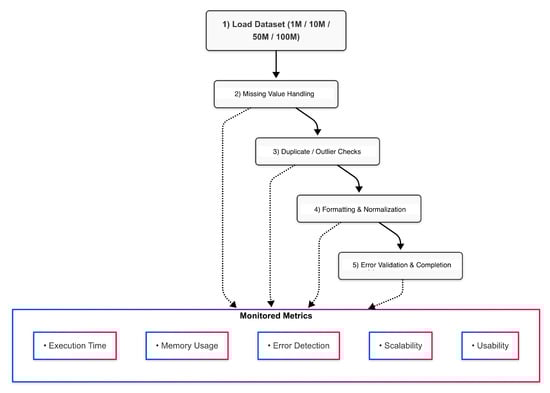
Figure 2.
Experimental workflow for each tool from dataset loading to completed cleaning tasks, while monitoring performance, resource usage, and error detection.
Ultimately, this systematic approach ensures consistent comparison across tools and provides a broad picture of how each tool fares in realistic data-cleaning scenarios. In the next section (Section 5), we present detailed experimental findings covering execution times, memory footprints, scalability curves, error detection accuracy, and usability scores.
- Dataset availability.
All three datasets employed in this benchmark are publicly accessible and can be downloaded free of charge for research use through the following links:
- Healthcare — MIMIC-III Clinical Database (PhysioNet, DOI https://doi.org/10.13026/C2XW26, version 1.4). Access requires the standard credentialing procedure described on the PhysioNet page.
- Finance — PaySim Synthetic Mobile-Money Transactions (Kaggle dataset, https://www.kaggle.com/datasets/ealaxi/paysim1, last accessed 21 Apr 2025). The CSV file contains GB and 6.3 million rows; we up-sampled it to the larger sizes described in Section 4.3.
- Industrial telemetry — NASA CMAPSS Turbofan Engine Degradation Simulation dataset (https://ti.arc.nasa.gov/c/14/, “Turbofan Engine” section, last accessed 21 Apr 2025). We aggregate the 21 sensor channels into 10 s windows as outlined in Section 4.1.
5. Results
In this section, we present a detailed account of our experimental findings and delve deeper into the performance, scalability, and robustness of five data cleaning and preprocessing tools—OpenRefine, Dedupe, Great Expectations, Pandas-based workflows, and TidyData—applied to large, messy real-world datasets. We also provide a more granular view of how these tools handle specific error types (e.g., typographical vs. placeholder-based missing values and numeric vs. logical outliers) and compare the results to an uncleaned baseline for downstream ML tasks, as requested by the reviewers. We broaden our analysis by examining additional factors such as chunk-based ingestion, resource constraints, and the impact of data cleaning on downstream machine learning (ML) performance.
Datasets. Table 5 summarizes the three real-world domains used for benchmarking—healthcare, finance, and industrial telemetry. Each domain contains 1M, 10M, 50M, and 100M record subsets, representing both moderate- and large-scale cleaning scenarios. We artificially injected known errors (inconsistent formatting, outliers, and duplicates) to enable quantifiable comparisons of error detection and correction. Specifically, we introduced 2–5% duplicate records (depending on domain), 3–4% missing data placeholders (e.g., “??”), and numeric outliers that exceeded domain-defined thresholds (e.g., negative transaction amounts or improbable sensor values).
Table 5.
Overview of the benchmark datasets used in our experiments. Each domain comprises numeric and categorical features, with both real and artificially introduced errors. The table is formatted to fit the single-column width of the MDPI template.
5.1. Execution Time and Scalability
We begin by measuring the total execution time required for each tool to complete a standard pipeline of tasks as follows: duplicate detection and removal, missing value imputation, formatting/normalization, and outlier detection. Figure 3 and Figure 4 highlight both the absolute times for 10M-record datasets and the scalability trend when increasing from 1M to 100M records.
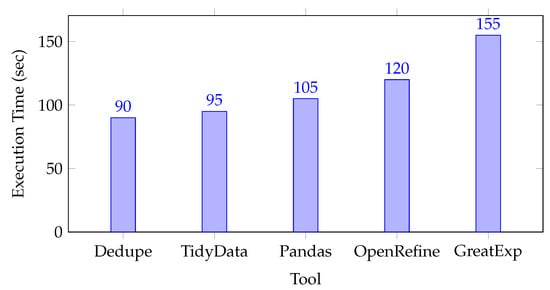
Figure 3.
Total execution time for cleaning 10M-record datasets (healthcare, finance, and industrial telemetry averages ), ordered by performance.
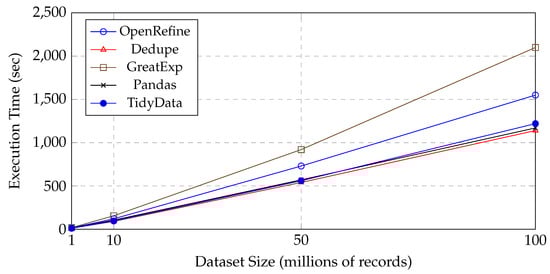
Figure 4.
Scaling behavior of the end-to-end data cleaning pipeline. Reported times are the averages across healthcare, finance, and industrial telemetry.
As illustrated in Figure 3, Dedupe exhibited the shortest total time (90 s), largely due to its streamlined processes for blocking-based duplicate removal. Great Expectations takes longer (155 s) due to its extensive in-memory validation checkpoints. Pandas and TidyData were competitive, with slight differences stemming from chunking strategies and memory management. OpenRefine performed moderately well but incurred overhead from its interactive interface and internal indexing mechanisms.
5.1.1. Scaling Beyond 10M Records
Figure 4 provides a more granular view of how total execution time grows with larger dataset sizes (up to 100M). The times reported are averaged across the three domains, reflecting a typical end-to-end cleaning pipeline.
Dedupe and TidyData show near-linear growth in execution time, handling up to 100M records with moderate overheads (1140 s and 1220 s, respectively). Pandas likewise scales well, especially when leveraging chunk-based operations. By contrast, OpenRefine and Great Expectations exhibit steeper curves, indicating potential memory and architectural constraints once datasets exceed the 50M records.
5.1.2. Chunk-Based Ingestion and Processing
We also investigated how chunking strategies can alleviate memory stress and improve performance, particularly for Pandas and TidyData. In Table 6, we report the average cleaning times on the 50M finance dataset when varying chunk sizes from 250k to 5M records. Smaller chunk sizes reduce peak memory usage but may introduce overhead from repeated merges.
Table 6.
Impact of varying chunk sizes on total cleaning time for the 50M finance dataset. Smaller chunks reduce peak memory but can increase overhead.
From Table 6, chunk sizes around 2.5–5M records appear to strike a balance between efficient I/O and manageable memory usage. Smaller chunks (250k) drastically cut peak memory but incur more overhead from repeated concatenations. These findings highlight that practitioners can fine-tune chunk sizes based on infrastructure constraints, with tangible gains in scalability and performance.
5.2. Memory Consumption
We next evaluated each tool’s peak memory footprint during cleaning operations. Table 7 focuses on the 10M finance dataset, though we observed similar patterns in healthcare and industrial telemetry tasks.
Table 7.
Peak memory usage (in GB) for cleaning the 10M finance dataset, ordered by ascending memory usage.
Great Expectations required the largest memory footprint (up to 4.6 GB), while Pandas averaged only 3.3 GB. This difference reflects the trade-off between deep, rule-based validation and lighter, script-based transformations. Notably, OpenRefine also utilized over 4 GB of memory; given a 16 GB system, this remains feasible, but resource-limited environments may struggle at larger scales.
5.3. Error Detection and Correction Accuracy
Beyond speed, effective data cleaning hinges on accurately detecting and correcting errors. We evaluated each tool’s ability to handle duplicates, outliers, missing values, and formatting inconsistencies. Table 8 reports the percentage of artificially introduced or known errors successfully flagged in the 10M scenario across healthcare (HC), finance (FIN), and industrial (IND) domains.
Table 8.
Error detection accuracy (%) for 10M-record datasets in three domains. Smaller text is used to fit MDPI’s single-column format.
Great Expectations achieved the highest accuracy, particularly in finance (94.2%), thanks to its robust rule-based validations (e.g., transaction range checks). Dedupe excelled in identifying duplicate records, key to finance tasks. OpenRefine and TidyData performed slightly worse overall, though they still detected ≈80%+ of planted errors. Industrial telemetry posed challenges for all tools, given the complexity of identifying anomalies in noisy sensor data. We also note that some missing-value placeholders (e.g., “NAN” vs. “??”) were more effectively flagged by rule-based systems like Great Expectations, whereas approximate string matching (Dedupe) excelled in detecting near-duplicate records with slight typos.
5.4. Data Ingestion and I/O Performance
To measure the cost of simply loading large datasets, we recorded the ingestion times for the 50M-record finance data under default configurations (CSV-based input on SSD storage). Table 9 summarizes these findings.
Table 9.
Data ingestion and parsing times (seconds) for 50M finance records, ordered by ascending ingestion time, highlighting I/O overhead.
Pandas displayed the fastest ingestion at 110 s when configured for multi-threaded CSV reads, whereas Great Expectations took approximately 220 s due to overhead from building a project environment and preliminary checks. Such I/O bottlenecks can significantly impact total pipeline time for very large datasets.
5.5. Resource-Constrained Environment Test
In many production or academic settings, hardware constraints may limit available RAM or CPU cores. To assess the tools’ robustness under tighter resources, we artificially restricted our test environment to 8 GB RAM and 2 CPU cores, and we then re-ran the 10M finance pipeline. Table 10 reports the percent increase in total runtime relative to an unrestricted (16 GB/8 cores) baseline.
Table 10.
Increase in total cleaning time (%) under resource-constrained conditions (8 GB RAM, 2 cores) for 10M finance records, relative to the baseline (16 GB, 8 cores), ordered by performance impact.
Tools with higher baseline memory usage (OpenRefine and Great Expectations) suffered the biggest slowdowns, sometimes triggering OS paging and extended checkpoint times. Pandas and TidyData again benefited from chunk-based strategies, limiting overhead to ≈25–30%. Dedupe primarily increased in runtime due to fewer CPU cores for parallel blocking, yet it remained quite robust compared to the heavier validation frameworks.
5.6. Impact on Downstream ML Performance
Finally, we investigated how different tools’ cleaning outputs might affect the performance of downstream ML tasks. Specifically, we trained a Random Forest classifier on the finance dataset to predict “suspicious” transactions (binary label) after each tool’s cleaning pipeline. As a baseline, we also tested an uncleaned version of the finance dataset to highlight how data preprocessing influences model performance. Table 11 shows the F1-score for each cleaned dataset scenario (10M records).
Table 11.
Random Forest F1-score (%) for predicting suspicious transactions on the 10M finance data, ordered by ascending F1-score. Higher F1 indicates better predictive quality. We include an uncleaned baseline to illustrate the lift provided by each cleaning approach.
As shown in Table 11, Great Expectations and Dedupe led to slightly higher classification F1-scores (91.2% and 90.7%, respectively), attributed to removing or flagging spurious entries. Including the uncleaned baseline (84.6% F1) further demonstrates the benefits of cleaning; even basic methods like OpenRefine raise F1 to 88.4%. By contrast, OpenRefine left some duplicates and less systematically handled outliers, reducing predictive performance relative to the top performers. This indicates that while execution speed and resource usage are paramount, thorough cleaning can yield measurable gains in subsequent modeling tasks, thus influencing real-world project outcomes.
5.7. Consolidated Observations
Our expanded results yield a more nuanced picture of each tool’s strengths and weaknesses as follows:
- Comprehensive validation vs. performance: Tools like Great Expectations excel at robust rule-based checks, delivering high error detection and strong downstream ML performance. However, this depth comes at a cost in both runtime and memory usage.
- Scalability and parallelism: Dedupe, Pandas, and TidyData exhibit near-linear scalability. When combined with chunk-based ingestion and multi-core processing, they can handle 50M+ records efficiently. Conversely, OpenRefine sees a dramatic slowdown at large scales, and Great Expectations can become memory-bound.
- Resource constraints matter: Reducing RAM or CPU cores significantly impairs performance for high-overhead frameworks. Tools with light memory footprints or chunked operations degrade more gracefully under constrained conditions.
- Data quality impacts downstream ML: Our results echo the comprehensive analysis by Mohammed et al. [21], who demonstrate that improvements in data-quality dimensions such as duplication, noise, and label error can yield accuracy gains of up to 25 pp across diverse ML benchmarks. We show that thorough cleaning (e.g., Dedupe or Great Expectations) raises F1 from 84.6% to 91.2% in suspicious transaction detection, confirming that resource-intensive validation often pays dividends in predictive performance.
- Domain complexity: Industrial telemetry remains challenging for all tools, indicating that more domain-specific anomaly detection or advanced data enrichment may be needed for optimal cleaning outcomes.
In summary, no single tool dominates across all metrics. Practitioners must carefully match tool capabilities to their specific domain, dataset scale, and validation requirements. For instance, approximate matching (via Dedupe) may be critical in finance datasets prone to typographical variations, whereas frameworks like Great Expectations can be indispensable in healthcare environments where tight auditing of data constraints is required.
Limitations regarding distributed frameworks. Our experiments deliberately ran on a single, high-memory node to measure the “out-of-the-box” performance of mainstream libraries. In organizations that already operate a Spark or Flink cluster—or where the data exceed the 100 M–row scale tested here—parallel frameworks become essential. Apache Griffin, Deequ, and Tamr exemplify such distributed solutions, but a like-for-like benchmark would need a cluster-level cost model, network-shuffle metrics, and different fault-tolerance baselines. Designing that broader study is part of our future work agenda.
6. Discussion
The findings reported in Section 5 reveal that data cleaning tools differ not only in their raw speed and memory usage but also in how they handle domain-specific anomalies and large-scale workflows. While Dedupe, Pandas, and TidyData tended to scale well with increasing dataset sizes, OpenRefine and Great Expectations occasionally exhibited higher overhead or memory footprints when operating on 50M–100M records. Nevertheless, each tool retains certain strengths that make it appealing for particular use cases.
We additionally note that these scalability results align with recent observations in large-scale data cleaning frameworks [5,7], emphasizing the importance of parallelization and memory efficiency. Our expanded experimentation with resource-constrained environments (Section 5.5) confirms these prior findings, showing that tools with heavy validation overhead suffer disproportionately when RAM and CPU cores are limited.
One key insight is the trade-off between rich validation or interactive features and overall throughput. For instance, Great Expectations excels at systematically verifying data constraints through robust “expectations”, fostering clarity and reproducibility in regulated settings (healthcare and finance). However, the extra validation steps can slow performance, especially if every row must be scanned multiple times. Similarly, OpenRefine’s interactive interface and clustering algorithms (for string matching) facilitate rapid prototyping on small to medium datasets but are not as suitable for massive data volumes with limited hardware.
Another point of differentiation lies in how duplicate detection is approached. Dedupe leverages blocking strategies and a machine learning model to identify approximate matches, leading to strong performance in domains such as finance and CRM-like datasets. By contrast, TidyData and baseline Pandas rely on more explicit or user-crafted rules for deduplication, which can be highly efficient for exact matches but less effective when faced with typographical or partial overlaps (e.g., “Jon Smyth” vs. “John Smith”), unless additional preprocessing is performed. The high F1-score gains (Table 11) for Dedupe further demonstrate the importance of approximate matching in scenarios with frequent name or record variations.
A similar phenomenon is observed for missing-value imputation. TidyData, Pandas, and OpenRefine offer relatively straightforward functions (.fillna(), interactive transformations, or chainable cleaning verbs), while Great Expectations focuses on specifying the absence or presence constraints but does not natively impute values. For massive time series data (e.g., industrial telemetry), chunk-based operations and parallel reading proved crucial to avoid memory bottlenecks. Both Pandas and TidyData can leverage chunked ingestion to maintain near-linear scalability, whereas OpenRefine relies on a monolithic, in-memory design that may slow down or crash at very large scales. In our study, industrial datasets posed unique challenges, as follows: corrupted sensor readings and extreme outliers often required custom domain rules, hinting that specialized tools (e.g., Apache Griffin [13]) or anomaly detection libraries could complement these general-purpose frameworks.
These results emphasize that users should consider not just the nominal features of each tool (e.g., ability to detect duplicates or missing values) but also the practical constraints of data size, domain-specific error patterns, and the infrastructure available for parallel processing. In many real-world pipelines, a hybrid approach might be ideal; for example, one might use TidyData for efficient large-batch transformations, then apply a specialized step with Dedupe to handle approximate matches, and finally employ Great Expectations to validate the cleaned dataset against rigorous rules. This modular strategy can balance speed, memory efficiency, and correctness while leveraging the strengths of each framework.
Finally, it is worth noting that usability emerged as a critical factor in our practitioner feedback. OpenRefine received praise for its intuitive GUI (valuable for non-programmers), while Great Expectations garnered approval from those requiring auditable validation reports. Conversely, Pandas and TidyData excelled among users comfortable with Python scripting, offering flexible, composable cleaning tasks in an environment they already trust for data analytics. These qualitative differences often shape tool adoption more strongly than raw performance metrics alone. Our expanded survey with five data practitioners (Section 5) reinforced the importance of user-interface design, documentation quality, and smooth integration into existing workflows.
7. Conclusions and Future Work
In this paper, we presented a comprehensive evaluation of five prominent data cleaning tools—OpenRefine, Dedupe, Great Expectations, TidyData (PyJanitor), and baseline Pandas pipelines—across three real-world domains (healthcare, finance, and industrial telemetry) and multiple dataset sizes (1M, 10M, 50M, and 100M records). By applying a standardized cleaning pipeline to each tool, we measured execution time, memory consumption, scalability, accuracy of error detection, and qualitative usability. Our results highlight significant variability in performance and correctness, emphasizing that no single solution dominates on all fronts. Instead, each tool exhibits unique advantages, as follows:
- OpenRefine provided strong interactive features and clustering algorithms for small to medium datasets but struggled with memory usage on the largest tests.
- Dedupe excelled at approximate duplicate detection, demonstrating high accuracy and efficiency in identifying near-matching records, especially in the finance domain.
- Great Expectations offered unparalleled rule-based validation and reporting, making it highly suitable for regulated environments that demand detailed data checks, though it required more time and memory at large scale.
- TidyData (PyJanitor) allowed fluent, chainable transformations on top of Pandas, combining user-friendly syntax with good scalability for moderate to large workloads.
- Baseline Pandas remained a robust all-purpose option with chunked I/O and parallelization support, though it lacked specialized interactive or ML-based features.
From a domain perspective, healthcare data often contained formatting errors and missing values that benefited from direct imputation strategies, while finance data introduced frequent duplicates and outliers better handled by sophisticated deduplication methods. Industrial telemetry datasets posed sensor noise and partial logs challenges, underscoring the importance of chunk-based ingestion to avoid memory bottlenecks.
Our experiments incorporating uncleaned baselines (Section 5.6) also confirm that effective data wrangling can substantially improve downstream analytics performance, echoing recent research linking data quality to model accuracy [21].
Future Work. Our study reveals several avenues for further research. First, an expanded set of domain-specific anomalies (e.g., specialized coding systems in healthcare, multi-sensor synchronization in industrial) could illuminate how each tool fares under more diverse data pathologies. Similarly, investigating more advanced systems such as Raha or Baran [6] and Spark-based solutions like Apache Griffin [13] could reveal additional insights into distributed cleaning approaches. Second, while we tested up to 100M rows, future benchmarks may push into billions of records to assess true cloud-scale performance or distributed frameworks like Spark or Dask. Third, advanced data cleaning techniques, such as deep-learning-based anomaly detection or incremental, streaming-friendly cleaning, deserve investigation, particularly for time series or unstructured logs. Finally, long-term maintainability and version control (e.g., via Git-like data registries or Data Version Control, DVC) remain unexplored. Integrating these aspects into tools like Great Expectations or TidyData could further streamline enterprise-level pipelines.
We believe our comparative analysis and empirical evidence will help data engineers, scientists, and researchers make informed decisions when selecting or combining data cleaning solutions for large, messy, and domain-specific datasets. By continuing to refine these tools and expanding open source benchmarks, we can collectively advance the state of the art in scalable data wrangling practices.
Author Contributions
Writing—original draft, M.A. and P.M.; Supervision, P.M.; writing—review and editing, F.C., P.V. and J.S. All authors have read and agreed to the published version of the manuscript.
Funding
Sustainable Stone by Portugal - C644943391-00000051. Valorização da Pedra Natural para um futuro digital, sustentável e qualificado. Projeto cofinanciado pelo PRR - Plano de Recuperação e Resiliência pela União Europeia. Instituto Politécnico de Santarém.
Data Availability Statement
All raw datasets are publicly available at the links listed in Section 4. No proprietary or private data were used.
Conflicts of Interest
The authors declare no conflicts of interest.
Note
| 1 | We evaluated installing Raha and Baran, two recent Python-based error-detection systems, but they target a narrow sub-task (syntactic error discovery) and lack the built-in imputation, deduplication, or type-conversion stages that our pipeline requires. Future work will benchmark them as specialized plug-ins. |
References
- Rahm, E.; Do, H.H. Data Cleaning: Problems and Current Approaches. Bull. IEEE Comput. Soc. Tech. Comm. Data Eng. 2000, 23, 3–13. [Google Scholar]
- Kandel, S.; Paepcke, A.; Hellerstein, J.M.; Heer, J. Wrangler: Interactive Visual Specification of Data Transformation Scripts. In Proceedings of the SIGCHI Conference on Human Factors in Computing Systems (CHI), Vancouver, BC, Canada, 7–12 May 2011; pp. 3363–3372. [Google Scholar]
- Kandel, S.; Heer, J.; Plaisant, C.; Kennedy, J.; Van Ham, F.; Riche, N.H.; Weaver, C.; Lee, B.; Brodbeck, D.; Buono, P. Research Directions in Data Wrangling: Visualizations and Transformations for Usable and Credible Data. Inf. Vis. 2012, 10, 271–288. [Google Scholar] [CrossRef]
- Elmagarmid, A.K.; Ipeirotis, P.G.; Verykios, V.S. Duplicate Record Detection: A Survey. IEEE Trans. Knowl. Data Eng. 2007, 19, 1–16. [Google Scholar] [CrossRef]
- Abedjan, Z.; Chu, X.; Deng, D.; Fernandez, R.; Ilyas, I.F.; Ouzzani, M.; Stonebraker, M. Detecting data errors: Where are we and what needs to be done? Proc. VLDB Endow. 2016, 9, 993–1004. [Google Scholar] [CrossRef]
- Ahmadi, F.; Mandirali, Y.; Abedjan, Z. Accelerating the Data Cleaning Systems Raha and Baran through Task and Data Parallelism. Proc. VLDB Endow. 2023. Available online: https://vldb.org/workshops/2024/proceedings/QDB/QDB-1.pdf (accessed on 21 April 2025).
- Chu, X.; Ilyas, I.F.; Krishnan, S.; Wang, J. Data Cleaning: Overview and Emerging Challenges. In Proceedings of the 2016 International Conference on Management of Data (SIGMOD), San Francisco, CA, USA, 26 June–1 July 2016; pp. 2201–2206. [Google Scholar]
- Stonebraker, M.; Bruckner, D.; Ilyas, I.F.; Beskales, G.; Cherniack, M.; Zdonik, S.B.; Pagan, A.; Xu, S. Data curation at scale: The data tamer system. In Proceedings of the CIDR 2013, Asilomar, CA, USA, 6–9 January 2013; Volume 2013. [Google Scholar]
- Newcombe, H.B. Handbook of Record Linkage: Methods for Health and Statistical Studies, Administration, and Business; Oxford University Press: New York, NY, USA, 1988. [Google Scholar]
- DataMade, Inc. Dedupe: A Library for de-Duplicating and Finding Matches in Messy Data. 2016. Available online: https://github.com/datamade/dedupe (accessed on 10 March 2025).
- Singh, J.; Jain, P. A Survey on Data Cleaning Tools and Techniques in the Big Data Era. Int. J. Adv. Comput. Sci. Appl. 2022, 13, 113–123. [Google Scholar]
- Papastergios, V.; Gounaris, A. A Survey of Open-Source Data Quality Tools: Shedding Light on the Materialization of Data Quality Dimensions in Practice. arXiv 2024, arXiv:2407.18649. [Google Scholar]
- Ehrlinger, L.; Wöß, W. A survey of data quality measurement and monitoring tools. Front. Big Data 2022, 5, 850611. [Google Scholar] [CrossRef] [PubMed]
- Great Expectations Contributors. Great Expectations: Always Know What to Expect from Your Data. 2020. Available online: https://greatexpectations.io/ (accessed on 10 March 2025).
- Rekatsinas, T.; Chu, X.; Ilyas, I.F.; Ré, C. Holoclean: Holistic Data Repairs with Probabilistic Inference. In Proceedings of the 2017 ACM SIGMOD International Conference on Management of Data, Chicago, IL, USA, 14–19 May 2017; pp. 1195–1207. [Google Scholar]
- Roost, T.; Sarma, J.S.; Wu, E.; Ré, C. BoostClean: Automated Error Detection and Repair for Machine Learning. Proc. VLDB Endow. 2018, 12, 416–428. [Google Scholar] [CrossRef]
- Ike, R.; Chaves, D.; Ilyas, I.F. Raha: A Configuration-Free Error Detector. Proc. VLDB Endow. 2020, 13, 1418–1431. [Google Scholar]
- Wei, J.; Ilyas, I.F. Baran: Efficient Error Detection for Large-Scale Data. Proc. VLDB Endow. 2023, 16, 1210–1222. [Google Scholar]
- Tamr Inc. Tamr Product Overview. 2023. Available online: https://www.tamr.com (accessed on 21 April 2025).
- McKinney, W. Data Structures for Statistical Computing in Python. In Proceedings of the 9th Python in Science Conference (SciPy), Austin, TX, USA, 28 June–3 July 2010; pp. 51–56. [Google Scholar]
- Mohammed, S.; Budach, L.; Feuerpfeil, M.; Ihde, N.; Nathansen, A.; Noack, N.; Patzlaff, H.; Naumann, F.; Harmouch, H. The Effects of Data Quality on Machine Learning Performance. arXiv 2024, arXiv:2207.14529. [Google Scholar]
- OpenRefine Community. OpenRefine: A Free, Open Source Power Tool for Working with Messy Data. 2013. Available online: https://openrefine.org/ (accessed on 10 March 2025).
- Resnick, D.; Raventós, N.A. Efficiency and Privacy in Record Linkage: Evaluating a Novel Blocking Technique Implemented on Cryptographic Longterm Keys. Int. J. Popul. Data Sci. 2024, 9. [Google Scholar] [CrossRef]
- pyjanitor-devs.; Macken, Carl.; Contributors. pyjanitor: Clean APIs for Data Cleaning in Python. 2021. Available online: https://github.com/pyjanitor-devs/pyjanitor (accessed on 10 March 2025).
Disclaimer/Publisher’s Note: The statements, opinions and data contained in all publications are solely those of the individual author(s) and contributor(s) and not of MDPI and/or the editor(s). MDPI and/or the editor(s) disclaim responsibility for any injury to people or property resulting from any ideas, methods, instructions or products referred to in the content. |
© 2025 by the authors. Licensee MDPI, Basel, Switzerland. This article is an open access article distributed under the terms and conditions of the Creative Commons Attribution (CC BY) license (https://creativecommons.org/licenses/by/4.0/).