Abstract
As a member of the North American Free Trade Agreement, the Mexican Ministry of Environment and Natural Resources publishes the Pollutant Releases and Transfers Registry of Substances annually, in accordance with the Official Mexican Norm Standard NOM-165-Semarnat-2013. This registry comprises 19 datasets (one per year, from 2004 to 2022). These have not preserved the same structure and categorical values, making it difficult to avoid their fusion with other datasets and conduct exploratory studies. These datasets contain (a)data on substances released and transferred to the environment and (b) data on producer facilities. They do not include additional data to make any other kind of query. Users must create adapted versions of these datasets while achieving isolated analyses. This paper describes a method for integrating the Pollutant Release and Transfer Registry dataset, enhanced with facilities data and cancer classification from the International Agency for Research on Cancer, to produce an improved and augmented public data source for academic or research purposes. The obtained database contains geospatial information, which enabled us to analyze the dataset at the state or municipal level to create digital products that can be used to inform decisions about environmental pollution.
Dataset: [Zenodo] [https://doi.org/10.5281/zenodo.17100697] [17100697]
Dataset License: CC BY 4.0
1. Introduction
Pollutant releases and transfers of substances to the environment are a worrying and regulated issue in Mexico [1,2,3,4,5], Canada [6,7,8,9,10], and the United States of America [11,12], as members of the North American Free Trade Agreement [13,14,15].
In Mexico, the Ministry of Environment and Natural Resources [16] (Semarnat, by its Spanish acronym) collects data on the amount of pollutant substances released and transferred to the environment and publishes an annual report called the Mexican Pollutant Releases and Transfers Registry [17] (RETC, by its Spanish acronym). The RETC is an environmental policy instrument that annually acquires and disseminates information about pollutant releases and transfers of 200 substances, in accordance with the Official Mexican Norm (NOM-165-Semarnat-2013) [18].
This governmental registry yields two datasets: pollutant releases and transfers, along with the facilities that produce them. Facilities across multiple industrial sectors generate these pollutant substances, which are subject to reporting under the current legal framework.
However, the 19 annual reports from the RETC, produced from 2004 to 2022, have different field formats and inconsistent values, requiring preprocessing and additional processing to be useful for data analysis.
The raw version of RETC, even after adjustments, is only helpful for conducting annual retrospective studies, limiting the insights it provides to users. Initially, these datasets were limited to substances released or transferred to the environment and to information on producer facilities. On the other hand, the International Agency for Research on Cancer (IARC)1 publishes reports of possibly human cancer-producing substances, classified by level of certainty (IARC group), based on international cancer research works. These reports aim to support multidisciplinary research and health studies to analyze causes and prevention, using realistic data. The IARC, based on the expertise of cancer specialists and health evidence, maintains control over the levels of cancer certainty associated with pollutant substances in human environments.
The objective of this paper is to describe a method for obtaining an enhanced and augmented version of the RETC, from 2004 to 2022, which helps produce analyses of carcinogenic substances classified, released, and transferred into the Mexican territory, focusing on spatial and temporal needs. We explain the method applied to acquire, prepare, merge, and make this data available to the scientific community interested in researching domains such as the environment, pollutant releases, and health, among other topics. The obtained database can be used to generate digital products based on the researcher’s knowledge, thereby improving the informed decision-making process.
Figure 1 illustrates our proposed three-stage methodology for obtaining a version of the RETC dataset enriched with IARC cancer classification data. In the first stage (Data acquisition), we acquired the raw datasets from the RETC and IARC repositories, obtaining the facilities (), pollutant releases and transfers (), and IARC substances () datasets. In the second stage (Data curation), we applied preprocessing and imputation tasks to obtain three datasets: facilities (), pollutant releases and transfer (), and IARC substances (). In the final stage (Data integration), we merged these datasets to produce an enhanced version of the RETC dataset with cancer classification groups () for all locations in Mexico. The obtained dataset () enables users to analyze the quantities of releases and transfers of substances associated with specific cancer classification groups in a spatial (national, state, and municipal) or temporal (years from 2004 to 2022) manner.
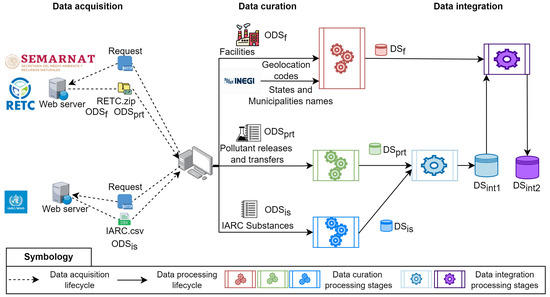
Figure 1.
Methodological stages for the production of the integrated dataset for RETC.
In the literature, there exist similar datasets for other countries that have been used to analyze pollutant releases [19,20] to water, air, or soil [21,22,23,24]; to detect risk zones [25,26,27]; or to analyze the pollutant releases for a specific substance, like arsenic [25,28,29,30] or benzene [31,32,33], which are considered carcinogenic to humans according to the IARC classification [28,29].
The obtained version of the Mexican RETC dataset opens new directions for exploring potential challenges in cancer risk levels, accounting for both spatial and temporal aspects; e.g., it could be merged with the National Statistical Directory of Economic Units (DENUE, by its Spanish acronym [34]) to analyze pollutant releases and transfers made by mines located at a given location in Mexico [35]. Similarly, it could be merged with groundwater quality indicator data [36] to detect heavy metals released into the Mexican groundwater, considering the incorporation of in situ measurements [37].
2. Materials and Methods
The raw version of the RETC dataset serves as the main guide in this work; as is, it cannot be used for extensive analysis or integration without first being prepared, cleaned, and enriched. The proposed method for obtaining the enhanced version of the RETC dataset is described next.
2.1. Data Acquisition
We acquired two public datasets from Semarnat (facilities and pollutant releases and transfers) by using the National Tsunami Warning System tool (Sinat: http://sinat.semarnat.gob.mx/retc/retc/RETC_2004-2022.zip (Do not request by HTTPS protocol, just use HTTP), accessed on 10 September 20252, by its Spanish acronym of Semarnat). The raw data from these datasets were packed into the “RETC_2004-2022.zip” file (RETC.zip in Figure 1). To obtain the IARC data, we downloaded a comma-separated value (CSV) file of the IARC substances, available on the IARC webpage: https://monographs.iarc.who.int/list-of-classifications, accessed on 10 February 2025.
The compressed file from Semarnat contains 19 spreadsheet files, each with separate sheets for facilities and pollutant releases and transfers. These spreadsheets were split into the obtained facilities dataset () and the obtained pollutant releases and transfers dataset (), each composed of 19 CSV files. The 19 files of the obtained facilities dataset contain 24 fields, as described in Table A1. On the other hand, the 19 files of the pollutant releases and transfers dataset have 20 fields, as described in Table A2. The IARC substances dataset () was contained in the file “List of Classifications—IARC Monographs on the Identification of Carcinogenic Hazards to Humans.csv” (IARC.csv in Figure 1). This file contains seven fields, as shown in Table A3, which describe the IARC classification of substances from Volumes 1 to 136 [38]. The Data acquisition section in Figure 1 illustrates the process applied to obtain the three original datasets.
- Facilities dataset:The obtained facilities dataset () comprises 19 CSV files in raw format that require data preparation, imputation, and consolidation into a single, homogenized dataset. A facility is an organization (public or private) with some economic activity (commercial, industrial, services, etc.) that produces pollutant releases (to air, water, or soil) or transfers (to sewerage, co-processing, final disposal, incineration, recycling, reuse, treatment, and other destinations) of substances. For this work, we employed a six-stage methodology to address the inconsistencies identified in the dataset (duplicated data, different values for the same field, or unaccepted symbols). Figure 2 shows how the passes through the six processing stages () and produces a new version of the dataset (called ) for each stage until the consolidated dataset is obtained (). In this pipeline, i denotes the stage of the data curation life cycle.
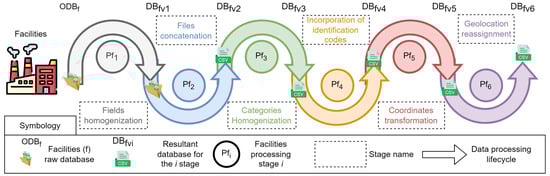 Figure 2. Data curation life-cycle processes for the obtained Facilities dataset.
 - Pollutant Releases and Transfers dataset: The obtained pollutant releases and transfers dataset () reports the amounts of pollutant releases and transfers by facilities from 2004 to 2022. It contains 19 CSV files in raw format that require data preparation, imputation, and consolidation into a single, integrated, and homogenized dataset. It consists of 20 fields, as described in Table A2. For this curation, we applied a five-stage methodology to address the inconsistencies identified in . Figure 3 shows how the passed through the five processing stages () and produced a new version of the dataset (called ) for each stage until the consolidated dataset was obtained (). The i index corresponds to the number of the processing stage.
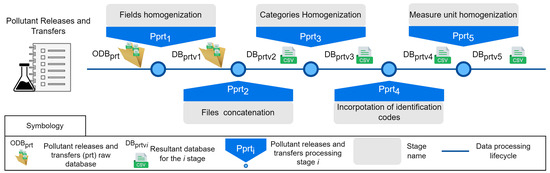 Figure 3. Data preparation life-cycle processes for the obtained pollutant releases and transfers dataset.
2.2. Data Curation
We refer to data curation as the required processes for preparing, adapting, imputing, or fixing data into the original datasets (, , and ), previous to the integration processes. By analyzing the records and files for the facilities () and pollutant releases and transfers () datasets, we noted they have different fields, different granularities, different data categories, and different structures in fields for other years; thus, these must be homogenized. Then, we defined three processes to obtain a polished version of each dataset, as described next. All stages of the data curation life cycle were implemented in Python using the pandas and numpy libraries.
2.2.1. Field Homogenization
In this section, we describe the first stage of the data curation life-cycle processes presented as stages and in Figure 2 and Figure 3, respectively. This preprocessing stage is similar across both datasets; however, we used separate implementations because their structures differ.
- Facilities Stage : We observed differences by analyzing the numbers and names of the fields in the CSV files; some annual reports have missing fields, different field numbers, or different names referring to the same field. By comparing these differences, we identified three distinct formats and created three corresponding groups (, , and ). These groups contain the years’ values in the same format.
By comparing these groups, we detected missing fields. Table 1 shows the number of fields not included per group and which fields were incorporated with a default value. Inserting one missing field of into the dataset represented a modification of 85.6% (43,582 records updated) of the 50,908 total records, with representing a modification of 8.18% (4166 records updated) and representing a modification of 6.2% (3160 records updated).

Table 1.
Incorporated fields per group of the obtained facilities dataset.
Additionally, for each group, we introduced a new field, year, representing the publication year for the RETC dataset.
The year field was crucial for the whole integration process because it is an important field that relates the registering data of pollutant releases and transfers with facilities over a period of time.
As a result, each of the 19 parts of the dataset now has 25 fields, of which 15 fields (60%) were not modified during this process, 9 (36%) were imputed, and 1 (4%) was considered new data. Of the 9 imputed fields, we inserted the corresponding missing fields into the facilities’ yearly report records, organized by group. The missing fields of were inserted from 2006 to 2011 and 2013 to 2022, not in 2012 (as described in Table 1).
The Semarnat activity field was added in 17 files ( and ), which represent 91.81% of the updated records of this field but account for only 3.67% of the total dataset. Table A6 describes the fields for the resultant dataset (), the percentage of records updated for each field, and the percentage that these changes represent for the obtained dataset ().
As a result, we computed that the modifications made to the facilities dataset during this process accounted for 12.57% of the resulting dataset (). Furthermore, 87.42% of the original dataset content was not modified. However, the integration process could not proceed unless we added the missing fields. To homogenize the fields’ names and column positions, we renamed all fields and sorted them following the field numbers presented in Table A1.
- Pollutant Releases and Transfers Stage : We also analyzed the fields from the 19 Pollutant Releases and Transfers annual reports and identified the same discrepancies as in the facilities dataset. By comparing these discrepancies, we identified three distinct formats and created three corresponding groups (, , and ). These groups contain the years’ values in the same format. By comparing these groups, we detected missing fields. Table 2 shows the number of missing fields per group and which fields were incorporated with a default value. Inserting one missing field of into the dataset represented a modification of 82.4% (141,629 records updated) of the 171,860 total records, with representing a modification of 9.11% (15,667 records updated) and representing a modification of 8.47% (14,564 records updated).
Table 2. Incorporated fields for the dataset.
Additionally, for each group, we introduced a new field, year, representing the publication year for the RETC dataset. As a result, each of the 19 parts of the dataset now has 21 fields, of which 18 fields (85.71%) were not modified during the curation process, 2 fields (9.52%) were imputed, and 1 field (4.76%) was newly added. For the two imputed fields, we inserted the corresponding missing values into the records for each dataset group. The missing fields of were inserted in the years 2004 to 2011 and 2013 to 2022, not in 2012 (as shown in Table 2).
The substance group field was updated in 18 files ( and ), representing 91.52% of the total updates for this field, which accounted for 4.35% of the total dataset. We updated 9.11% of the municipality name field, which represented 0.43% of the total dataset. Table A7 describes the fields for the resultant dataset (), the percentage of records updated for each field, and the percentage that these changes represented for the obtained dataset (). As a result, the modifications made for the dataset in this curation process represented 4.79% of the original dataset.
2.2.2. File Concatenation
We consolidated the 19 files for the Facilities () and Pollutant Releases and Transfers () datasets. We describe the file concatenation process required in the following list:
- Facilities dataset Stage : We read the 19 CSV files (), assuming they have the same field names and order, and concatenated them. As a first step, the 2004 data was used as the base to concatenate the other files at the end (2005 to 2022 CSV files). As a result, we obtained a single file () containing 50,908 records, which could be used as a dataset.
- PRT dataset Stage : When the 19 dataset files () had the same field names and order, we concatenated them as we did for the facilities dataset. We obtained the dataset, which can serve as an independent dataset and contains 171,860 records.
During these processes, we did not modify any content in the datasets.
2.2.3. Category Homogenization
After analyzing the fields’ values of both previous datasets ( and ), we observed that some field values could be considered as categories3. Nevertheless, because the RETC registration process is manually executed by the responsible facility (a human operator), the fields contained data inconsistencies (the exact value was recorded in different ways), which prevented processes such as filtering, grouping, or clustering. In this process, we created consistent catalogs for each categorical field and updated the dataset content accordingly. The catalogs used for category homogenization were applied to state name, municipality’ name, and sector’ name fields, as described next.
- State name: There are 32 states in Mexico. We analyzed the state name field in the and datasets. However, the dataset contains 64 values for the state name field because each state had two format names: uppercase and camel case (i.e., DURANGO and Durango). In some specific cases, the state names were larger (i.e., COAHUILA as Coahuila de Zaragoza) or were updated (i.e., Distrito Federal as Ciudad de Mexico). We defined a consistent and official catalog of states by using the states’ names according to the National Institute of Statistics and Geography (INEGI, by its Spanish acronym)4. During , we updated the values of the state name field in following the process described previously. In this process, we updated 164,451 records (95.68%) of the 171,860 total records for this field. Considering the total of 21 fields, this update accounted for 4.55% of the dataset.
- Municipality name: In Mexico, each state is divided into different municipalities (political and legal jurisdictions). The state with the fewest municipalities is Baja California Sur (5), and that with the most is Oaxaca (570)5 In the dataset (), the values of the municipality name field have multiple versions: uppercase, camel notation, abbreviations, extra blank spaces, and names with or without accents. To tackle this inconsistency, we created a comprehensive, official municipal name catalog for each state based on INEGI data. Then, we matched this municipality name catalog with the municipality name field in , removing blank spaces and special characters and converting the content to lowercase. Then, we updated the values in by using the corresponding value of the municipality’s name catalog. However, some municipalities’ names did not match and required a manual update. In this homogenization process, we updated 16,580 records (32.56%) of the original 50,908 records. As in the state name field, the field now contains content similar to the original values but in a homogenized, usable format for analysis.
- Sector name: We detected several typos and extra blank spaces between characters in the values in the sector name field. To solve these inconsistencies, we created a catalog with the 11 official sectors’ names of the Unique Environmental License (LUA, by its Spanish acronym)6 [39] managed by Semarnat, as shown in Table 3.
Table 3. Sector names obtained from the Semarnat description.
The facilities dataset includes additional categories, which were also added to the catalog of sector names, as shown in Table 4. Then, we matched for coincidences in and the obtained catalog of sector names. Finally, we replaced the sector names with the catalogs’ values. However, the dataset required a manual verification and updating of some values that did not match. In this homogenization process, we updated 30,750 (60.4%) of the original 50,908 records.
Table 4.
Additional sector names found in the facilities dataset.
For the Pollutant Releases and Transfers dataset called , we applied the same processes to resolve the inconsistencies detected in the facilities dataset. For this homogenization process, we updated 101,691 (59.17%) of the total of 171,860 records in the field. Considering the 21 fields, this update accounted for 2.81% of the entire dataset.
Figure 4 presents the breakdown of updated records in the Facilities (F) and Pollutant Releases and Transfers datasets. The values homogenized for both datasets were over 50%. However, these preprocessing stages did not alter the original value; they only applied a homogenized value based on a catalog.
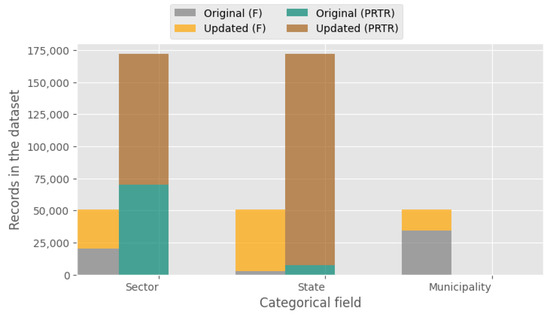
Figure 4.
Breakdown of updated records in the Facilities (F) and Pollutant Releases and Transfers datasets.
2.2.4. Incorporation of Identification Codes
In Mexico, other public federal agencies like the National Water Commission (CONAGUA, by its Spanish acronym)7 and INEGI publish other public datasets like the Water Quality and National Statistical Directory of Economic Units datasets. These datasets include official geospatial codes for states and municipalities (cve_ent and cve_mun respectively) assigned by INEGI. In this process, we augmented the previously defined catalogs of state and municipal names, incorporating geospatial codes to identify regions in the Mexican territory with greater accuracy.
- Facilities dataset Stage : We added the state and municipality geospatial codes as fields ( and , respectively), producing the dataset (described in Table A4). This addition was also crucial for the entire integration process because the cve_ent and cve_mun fields became common across facilities and pollutant release and transfer datasets; thus, they relate these datasets to accurate geolocation of state and municipality names.At this point, the facilities dataset contains 27 fields. In this manner, the dataset produced by this process could be integrated with another public dataset by intersecting the geospatial codes.
- PRT dataset Stage : We incorporated a new field with the state geolocation code called (described in Table A4) by using the geolocation codes of INEGI to identify regions in the Mexican territory. As a result, the dataset () now contains 22 fields.
2.2.5. Facility Location
The following processes were only applied to the Facilities dataset.
- Coordinate Transformation ()
The original geolocation values of facilities have different formats for the north latitude and west longitude fields: some in Degrees, Minutes, Seconds (DMS) format and others in Decimal Degrees (DD) format. To homogenize all the geolocation values as a unique format, we transformed the coordinates from DMS to DD format using Equation (1):
We added the computed north latitude and west longitude in DD format to records originally in DMS format. These records are identified by adding two metadata fields in the dataset (): indmsformat and dmsdefaultvalue (described in Table A4). Among the 50,908 records in , 3697 (7.26%) were in DD format (indmsformat = false) and did not require transformation, 369 (0.72%) contained default or invalid location values (dmsdefaultvalue = true) and were not considered in this transformation process, and 46,842 (92.01%) were transformed from the DMS to DD format (indmsformat = true). To manage these metadata fields and compute locations, we included four new fields in the dataset: , , , and , which are also described in Table A4. As a result, at this point, the dataset has 33 fields.
- Geolocation Reassignment ()
We also observed several errors in the original geolocation values for facilities regarding whether they were inside or outside Mexico. We added three more metadata fields to indicate whether the locations were in Mexican territory (inmexico), in their corresponding state (instate), or in their corresponding municipality (inmunicipality) to identify records that required a default location value. We detected that some facilities’ locations were not in Mexican territory ( = ) and others were outside their corresponding state ( = ) or municipality ( = ) as registered in the original records. To solve these inconsistencies, we used the public geospatial shape data from INEGI8 in the form of polygons in shape files to localize the facilities in the Mexican coordinate polygon. These inconsistencies may have been generated during the facility registration process; the responsible person may have entered an invalid position, entered incorrect values, or set a common default value, such as a non-specific region name. We assigned a default municipality location value to the records with a default location position and to the out-of-limits records. The default location values were obtained from the official municipal names published by INEGI. We also added data from Google Maps (Latitude and Longitude) for all municipalities’ names. Finally, we used the state and municipality codes to assign the geolocation value. In this process, we added two more fields to the facilities dataset: municipalitylatitude and municipalitylongitude (described in Table A4). As a result, at this time, the has 40 fields. With this update, minor inconsistencies (related to the DMS symbols) were corrected in 12 records. These inconsistencies were resolved manually before completing this process. Of the original 50,908 records in , 45,213 (88.81%) had corresponding municipality polygons and did not require the addition of a default location. On the other hand, the number of records that required the addition of a default location at the municipality level was 2951 (5.79%), that at the state level was 779 (1.53%), and that at the national level was 1965 (3.85%).
Figure 5 shows the facilities’ locations at the national level before and after applying the location correction process. The red points in Figure 5a represent the facilities wrongly located outside of Mexico or their corresponding state or municipality. The corrected facilities’ locations in the resultant dataset are illustrated in Figure 5b.
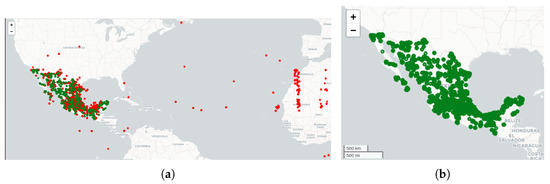
Figure 5.
(a) Original facility locations. Green dots indicate facilities with accurate geolocation, whereas red dots mark those with incorrect or mismatched coordinates. (b) Corrected facility locations.
- Measurement Unit Homogenization ()
This process was applied to the dataset. The unit field refers to the unit used to measure the amount of the pollutant substance released or transferred to the environment. This field has several categorical values: ‘kg’, ‘g’, ‘g/año’, ‘kg’, ‘kg/año’, ‘ton’, and ‘ton/año’. There are multiple labels for the proportion weight/year (i.e., g and g/año both mean grams per year). The amount of released or transferred substance is registered in the water, air, soil, sewerage, co-processing, final disposal, incineration, recycle, reuse, treatment, and others fields. To homogenize these numbers at the same scale, the values of these fields were converted, taking into account the ‘kg/año’ (kg/year) measuring unit as the base, producing a new version of the dataset called as follows:
- To convert grams (categories ‘g’ and ‘g/año’) to ‘Kg/año’, we divided the fields’ value by 1000 and updated the category value to ‘Kg/año’. In this manner, we updated the values of 315 records (0.18%) and applied the corresponding conversion to the pollutant release fields affecting the following records: 313 for and 2 for .
- To convert tons (categories ‘ton’ and ‘ton/año’) to ‘Kg/año’, we multiplied the fields’ value by 1000 and updated the category value to ‘Kg/año’. We updated the values of 56,122 records (32.65%). We applied the corresponding conversion to the pollutant release fields affecting the following records: water (31,724), air (22,026), soil (591), sewerage (1675), finaldisposition (1356), incineration (15), others (384), recycling (713), sewageforreuse (104), and treatment (368).
- We updated the category values of ‘Kg’, ‘kg’, and ‘kg/año’ to ‘Kg/año’ (Kg/year). The 115,423 records (67.16%) were updated, and no conversion was applied to other fields.
By analyzing amount released or transferred fields, we detected that the default value for was 0, and for groups and , there was a blank space. Considering that contains 82.4% of the total records and that we required numerical values for sum operations and conversions, we set the default values for and to 0, too.
2.2.6. Incorporated New Fields
During the six stages of the preprocessing methodology, we added 12 fields to the original dataset to improve its content, solve inconsistencies, and manage the updates, as illustrated in Table A4.
2.2.7. Inconsistency Detection
Additional minor but critical errors were finally detected in the NRA field in the and datasets. As we mentioned previously, the NRA code is a unique identification assigned by Semarnat to facilities that are authorized to emit pollutants. This field, along with the year and sector name fields, appears in the facilities and PRT datasets.
- The NRA code must not include blank spaces. Given this restriction, we corrected 16 records by removing excess blank spaces in the dataset. Additionally, we detected black spaces and removed them from .
- The original RETC dataset must have one record per facility per year. Still, by grouping records by the and fields in , we identified facilities with duplicate records per year. These duplicated records may have been inserted in error instead of the real facility record. However, these inconsistencies were removed from the dataset to prevent future conflicts during integration. As a result, at this point, the dataset has 50,906 records. The 36 fields of the resultant facilities dataset () are described in Table A5.
2.2.8. IARC Substances Dataset
We define IARC substances as agents identified by the IARC monographs to prevent causes of human cancer. These include chemicals, physical and biological agents, pharmaceuticals, complex mixtures, occupational exposures, and other exposures of everyday life [40]. These agents are contained in the following IARC cancer classification groups [38]:
- 1: Carcinogenic to humans (129 agents);
- 2A: Probably carcinogenic to humans (96 agents);
- 2B: Possibly carcinogenic to humans (321 agents);
- 3: Not classifiable as to its carcinogenicity to humans (499 agents).
In the IARC reports, some agents are listed but have not yet been assigned to a group. For these agents, we assigned a value of “Without group” in the group field. For data consistency, we added a new classification group, “Not Considered”, to refer to substances in the RETC dataset that are not included in the IARC agent classification.
To prepare this dataset, we processed the original CSV file provided by the IARC. This file contains 1114 substances with 7 well-defined fields (CAS No., Agent, Group, Volume, Volume publication year, Evaluation year, and Additional information), as previously described in Table A3. A key feature of this dataset is that it is highly supervised and well-maintained; therefore, it does not contain noise (such as empty records or incorrect values treated as inconsistent).
For our purposes and according to the structure of the fields in the RETC datasets, we reduced the IARC substances dataset to three fields: CAS No., Substance name, and Group.
Since the Official Mexican Norm standard (NOM-165-Semarnat-2013 [18]) requires facilities to provide information about the 200 pollutant substances, those records of the IARC substances dataset containing these substances were selected. The dataset was filtered according to the CAS Number (cas) field, which is the common field between the IARC substances and the pollutant releases and transfer () datasets. As a result, we obtained the ready-to-use IARC substances dataset ().
2.3. Dataset Integration
As a result of preprocessing during the data curation stage, we obtained three separate datasets from the acquired data. The first one includes the facilities data (, as described in Table A1); the second one describes the pollutant releases and transfers (, as described in Table A2); and the last one describes the IARC substances (, as described in Table A3).
The last step in our methodology is to integrate these three curated and consolidated datasets to obtain an enhanced, augmented version of the Mexican RETC dataset with cancer classification groups. The integration process consists of two main sub-processes, executed autonomously through programming scripts, without human intervention:
- Integration of pollutant releases and transfers and IARC substances: It is the required process to join the last version of the pollutant releases and transfers dataset () with the IARC substances dataset () to produce a new dataset ( in Figure 1).
- Integration of the RETC dataset with cancer classification groups: It is the required process to join the dataset obtained in the previous integration process () with the last version of the facilities database () to produce an enhanced and augmented database ( in Figure 1) as the final product (the enhanced and augmented Mexican RETC dataset with cancer classification groups).
- Integration of Pollutant Releases and Transfers and IARC Substances
Algorithm 1 outlines the process for incorporating the IARC cancer classification groups obtained from the IARC substances dataset () into the pollutant releases and transfers dataset (). This joining was based on the shared values of the CAS Number (cas field) across both datasets. As a result, we obtained the dataset, composed of 23 fields (21 from and 2 from ) and 171,860 records. Figure 6 illustrates the number of records assigned to the IARC groups and their percentage of the total records.
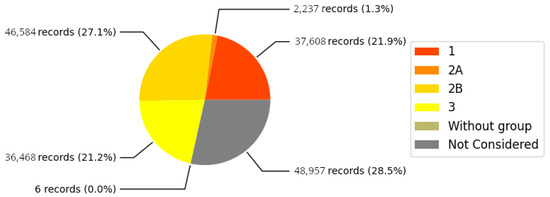
Figure 6.
Number of records classified by IARC group in .
- Integration of RETC Datasets with Cancer Classification Groups
Algorithm 2 shows the required process to integrate the 33 fields from the facilities dataset () with the 23 fields from the dataset. The joining was based on the values of the common fields for both datasets: environmental registration number (nra field), the reported year of the pollutant facility (year field), the state geolocation code (cve_ent field), and the industrial sector of the facility (sector name field).
| Algorithm 1 Incorporation of the IARC group into the pollutant releases and transfers dataset. |
|
| Algorithm 2 Integration process for the pollutant releases and transfers with IARC cancer group classification and the facilities datasets. |
|
As a final result, we obtained an enhanced and augmented dataset for pollutant releases and transfers with the IARC classification groups () from 2004 to 2022 for the whole Mexican territory. Figure 7 illustrates the dataset field status: (a) incorporated during the curation and integration processes; (b) imputed during the curation process; (c) not updated by the proposed methodology.
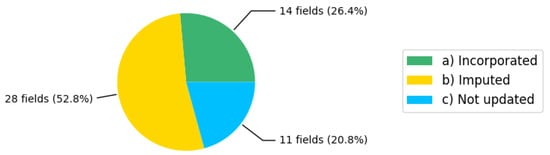
Figure 7.
Fields status of the dataset.
3. Data Records
Although the data used to obtain the Mexican RETC dataset with the IARC cancer classification groups () are public, shared by Semarnat and IARC, respectively, it is important to mention that the facilities’ data, described within , can be considered sensitive. Thus, two versions of this dataset were created:
- —Contains all values for all fields in a clear form; however, values of latitude and longitude fields of facilities were mapped to the geolocation of their corresponding municipality (the location of the facility) to prevent the exact geolocation of the facilities. Access to this version with the sensitive data can be requested by email to the corresponding author.
- —Contains all the fields but anonymizes the sensitive fields of facilities. Data from facilities were anonymized using hashing, preserving the consistency of the entire dataset. The anonymized fields (16) are nra, facility name, street name, colony name, external number, internal number, between street 1, between street 2, locality name, postal code, industrial park name, computed latitude, computed longitude, north latitude, west longitude, UTMX coordinate, and UTMY coordinate. The values for the remaining fields are presented in a clear format. This dataset is publicly available as follows:
- Dataset identifier: https://doi.org/10.5281/zenodo.17100697
- Dataset correspondence: hugogreyesa@gmail.com
- Title: RETC20042022-IARC136
- Publisher: Zenodo
- Publication year: 2025
The public dataset comprises 53 fields (columns) and 171,860 records (rows), covering data from 2004 to 2022 for the 32 Mexican states. Each record contains (a) pollutant releases and transfers of a substance, (b) facility data, and (c) its IARC classification group.
4. Technical Validation
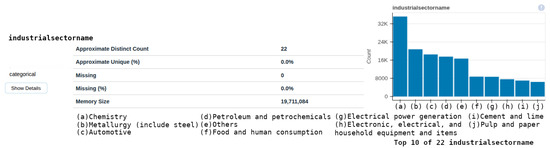
The dataset generated through the proposed data curation and integration method includes (a) homogenized categorical fields (state, municipality, and industrial sector name), (b) the IARC cancer classification group, and (c) the geolocation of facilities in Mexican territory. These features enable straightforward querying and facilitate diverse exploratory studies, enhancing the overall utility of the dataset for end users. We used the Python dataprep library to generate an exploratory data analysis (EDA) report. This report and the code used in this paper are available at GitHub repository at https://github.com/hgreyesa/paper_RETC-IARC accessed on 2 November 2025. Figure 8 presents the EDA for the industrialsectorname field. As you can see, the dataprep tool identifies this field as categorical, detects its 22 distinct values (described previously in Table 3 and Table 4), and sorts them to provide the top 10. The dataprep report shows all the fields included in the dataset.
The dataset can also be used for diverse analyses that involve only data on polluting substances.
The anonymized version of the dataset () can be used to conduct spatial (national, state, and municipality levels), temporal (from 2004 to 2022), or by industrial sector (by relations on facilities data) analyses for substances released or transferred, as well as their health risks to the environment (based on the IARC group).
It is essential to note that the dataset contains several fields related to substances, facilities, pollutants, locations, and industrial sectors, which can be used to augment or enrich it with additional data from external sources.
For example, it can be merged with other datasets that share the same geospatial codes to increase the applicability and reuse of these data, like the Mexican datasets from the National Statistics Directory of Economic Units (DENUE) [34] or the National Water Commission (CONAGUA) [36].
4.1. Exploratory Results
We validated the obtained dataset by conducting diverse analyses. For example, using spatial data, we can identify the Mexican state with the most records of pollutant releases and transfers. Figure 9 displays an interactive national-level map showing the number of geolocated records across Mexico’s states, with the “Estado de Mexico” having the most records. Additionally, the dataset allows for the detection of the number of records at the state and municipality levels, along with a list of substances released into the environment by their facilities.
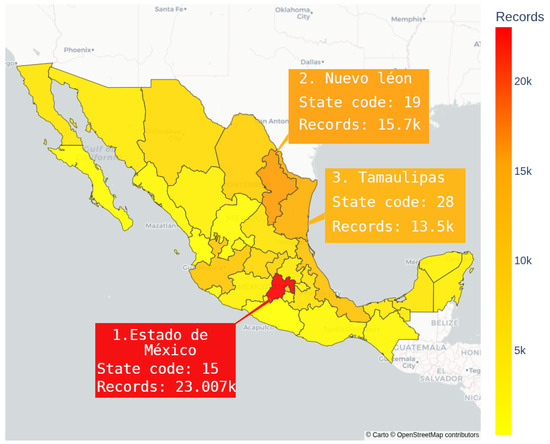
Figure 9.
Number of records of released and transferred substances by state for the 2004 to 2022 period, including the top three states with more records.
In addition to the spatial values, the resultant dataset contains categorical values that end users can use to group records and perform fundamental analyses. For example, Figure 10 illustrates the number of records in the resultant dataset by industrial sector, showing that the Chemistry sector has the highest number of releases and transfers in Mexico. With this information, it is possible to continue analyzing the types of substances reported for this industrial sector and its corresponding cancer classification groups. These results are the same as the EDA presented in Figure 8 but with an English translation.
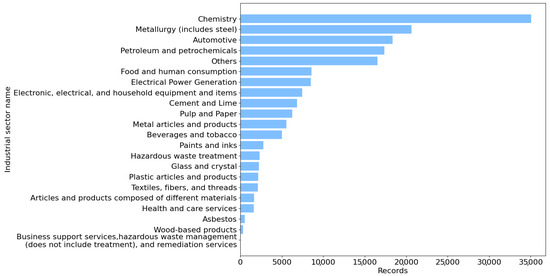
Figure 10.
Number of records of pollutant releases and transfers in the resultant dataset by industrial sector name for the 2004 to 2022 period.
Additionally, using the resultant dataset, we grouped the data by combining RETC-related fields with IARC groups to produce specific analyses. Figure 11 displays an interactive map showing the number of records for IARC group 1 substances released and transferred at the state level. Again, the “Estado de Mexico" had the highest amount of records of IARC group 1 substances. Extending this insight, we can obtain the list of IARC group 1 substances and the type of release or transfer to the environment, including amounts.
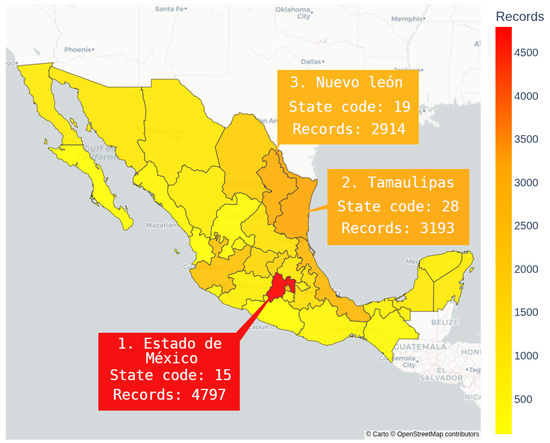
Figure 11.
Numberof records of IARC group 1 released and transferred substances by state for the 2004 to 2022 period, including the top three states with more records.
4.2. Carcinogenic Substances (IARC 1) Released into the Air in Mexico
To validate the dataset’s usability, we conducted a case study based on an exploratory analysis of carcinogenic substances (IARC group 1) and found 22 substances classified as IARC 1 in the obtained database. We summed the three types of emissions and the eight types of transfers for each substance to identify the top 10 IARC 1 substances reported in Mexico (See Figure 12).
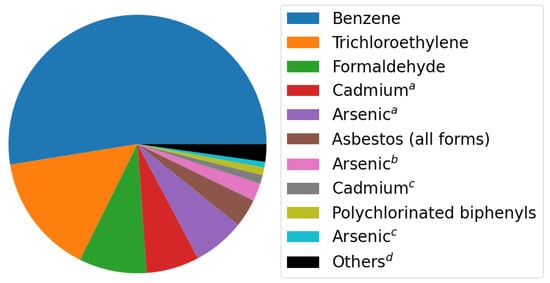
Figure 12.
Top ten IARC group 1 substances reported in Mexico. a: respirable dust, fumes, and vapors; b: compounds; c soluble compounds; d: other substances.
To detect the most significant type of emission or transfer among the top substances, broke down the top five substances by type. As you can see in Figure 13, the major releases were made in the air.
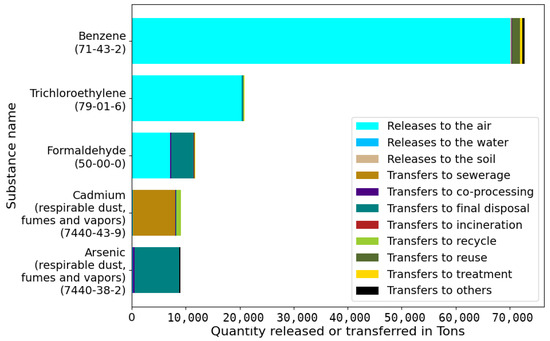
Figure 13.
Breakdown of type of emission or transfer by substance.
To facilitate data interpretation for decision makers, we can explore the data by grouping it by the benzene substance (the top-emitted substance in the air) at the state and municipality levels. Figure 14a shows that Tabasco is the state with the most air emissions in Mexico, and its municipality, Comalcalco (see Figure 14b), accounted for the most emissions.
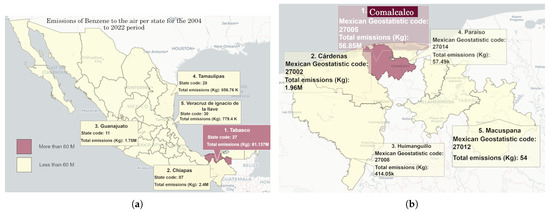
Figure 14.
(a) Top five states by emissions of benzene in air; (b) Top five emissions per Municipality in Tabasco State.
None of the above examples can be reconstructed using the original RETC dataset. They served as validation of the dataset’s consistency, yielding valuable and promising insights. The enhanced Mexican RETC with the IARC classification groups dataset does not require any additional changes for this kind of analysis.
5. Discussion
This work presents a Mexican enhanced dataset of pollutant releases and transfers, along with their IARC cancer classifications, obtained by applying the methodology described in this paper. However, this work focuses on preprocessing and data fusion; we did not collect the data in situ or receive the data from the facilities. We used only the data reported to Semarnat for the Mexican facilities. The datasets used in this work were collected from data published by Semarnat and the IARC. This database currently includes geospatial codes used by other Mexican databases; we are working to incorporate these databases by using these codes to increase their applicability.
Currently, we are using the dataset we obtained to create several digital products (e.g., reports, maps, graphs, charts, and tables), which are yielding promising insights. Currently, we obtain these products by executing programming scripts tailored to the specific needs of expert physicians and toxicologists. We are developing a Web platform for the widespread dissemination of information on the dataset’s use and produced products. We believe this will lead to interesting research collaborations for practical use cases.
As it stands, the obtain dataset enables diverse analyses of carcinogenic substances classified, released, and transferred to the environment within Mexican territory, accounting for both spatial and temporal requirements. However, since the dataset contains some fields in common with other domains, it can be enhanced and augmented with datasets from those domains, including Mexican or international datasets. In this regard, we are working to integrate the DENUE and CONAGUA datasets for the same period (2004–2022), focusing on geospatial codes at the state and municipal levels.
Semarnat publishes two new versions of RETC datasets per year, and the IARC updates its reports one or multiple times per year. Nevertheless, at this time, the proposed methodology only considers datasets available from Semarnat and the IARC through 2024.
Assuming that both the Semarnat and IARC datasets have maintained the same field structure for the past 10 years, the proposed methodology can be applied to new versions of these datasets to update the current version of the obtained dataset.
Author Contributions
Conceptualization, J.L.G.-C. and J.C.; methodology, I.L.-A.; software, H.G.R.-A. and M.C.-S.; validation, H.G.R.-A., M.C.-S. and I.L.-A.; formal analysis, H.G.R.-A. and M.C.-S.; investigation, H.G.R.-A.; data curation, H.G.R.-A.; writing—original draft preparation, H.G.R.-A.; writing—review and editing, I.L.-A. and M.C.-S.; visualization, I.L.-A. and H.A.-M.; supervision, I.L.-A.; project administration, J.C. and J.L.G.-C. All authors have read and agreed to the published version of the manuscript.
Funding
This research was funded by the Secretariat of Science, Humanities, Technology and Innovation (SECIHTI) through the project “Unificación de Servicios de Ciencia de Datos para la Construcción de un Concetrador, Distribuidor y Buscador Nacional de Datos e Información Estratégica”, grant number MADTEC-2025-M-478.
Data Availability Statement
The dataset, with the anonymized sensitive facilities’ data, is publicly available as a repository in Zenodo https://doi.org/10.5281/zenodo.17100697.
Acknowledgments
Hugo G. Reyes-Anastacio acknowledges funding from the Secretariat of Science, Humanities, Technology and Innovation (SECIHTI) postdoctoral fellowship for the project titled “Desarrollo e implementación de un sistema inteligente de vigilancia para el Observatorio de Riesgos Ambientales en contextos vulnerables del bajío mexicano”. Melesio Crespo-Sanchez acknowledges funding from the SECIHTI postdoctoral fellowship for the project titled “Desarrollo de modelos de inteligencia artificial para identificar zonas de alta vulnerabilidad por cáncer y agentes contaminantes en México”.
Conflicts of Interest
The authors declare no conflicts of interest.
Appendix A. Datasets Description
Appendix A.1. Dataset Field Descriptors
Table A1.
Field descriptions for the obtained facilities dataset ().
Table A1.
Field descriptions for the obtained facilities dataset ().
| # | Field Name | Description |
|---|---|---|
| 1 | Main Activity | Category that identifies the activity carried out by the facility |
| 2 | Semarnat Activity | Category assigned by Semarnat to describe the activity carried out by the facility |
| 3 1 | Street name | The proper noun with which the road is identified |
| 4 | Environmental code | Environmental code assigned by Semarnat: (https://dsiappsdev.semarnat.gob.mx/formatos/DGGCARETC/FF-SEMARNAT-033-Licencia-Ambiental-Unica.docx accessed on 10 September 2025) that represents the sector or subsector required for an application for a Single Environmental License |
| 5 1 | Postal code | The five-digit code defined by the Mexican Postal Service that is used to identify and locate geographical areas of the country and the post office that is responsible for the reception and distribution of mail (postal matter) in said area |
| 6 | NAICS Code | North American Industrial Classification System (NAICS) code to which the facility belongs (region) |
| 7 1 | Colony name | Proper name with which the human settlement is identified. A locality is almost attached to a city or town, which functions as part of it, which is why it generally has some of its services, equipment, and authority |
| 8 1 | UTMY Coordinate | Latitude coordinate value using the Universal Transverse Mercator (UTM) coordinate system |
| 9 1 | UTMX Coordinate | Longitudinal coordinate value using the UTM system |
| 10 | NAICS description | Description of the code found in the NAICS code field |
| 11 1 | Between Street 1 | A street that, being in front of the facility, is located on the left side |
| 12 1 | Between Street 2 | A street that, being in front of the facility, is located on the right side |
| 13 | State name | Name of the United Mexican State where the facility that released the substance is located |
| 14 1 | Latitude | The distance that exists between the facility and the equator, measured on the meridian that passes through the location point |
| 15 1 | Locality name | Name assigned to a locality by law or custom |
| 16 1 | Longitude | The distance that exists between the facility and the Greenwich meridian, measured on the parallel that passes through the location point |
| 17 | Municipality name | Name of the municipality where the facility that released the substance is located. |
| 18 1 | Facility name | Name of the facility that reports the pollutant released or transferred |
| 19 1 | Environmental registration number | Identifier that Semarnat generates for the “facility” of the Physical or Legal Person (applicant) obliged to carry out some procedure in environmental matters, which relates it to the RFC of the applicant and the municipality where it is located, unique, and non-transferable. |
| 20 1 | Internal identification number | The numerical value that identifies an address within a property |
| 21 1 | External identification number | The numerical value that identifies one or more properties on a road |
| 22 | Industrial park name | The geographically delimited surface designed especially for the settlement of the industrial plant in adequate conditions of location, infrastructure, equipment, and services, with permanent administration for its operation |
| 23 | Industrial sector name | Name of the industrial sector: (https://biblioteca.semarnat.gob.mx/janium/Documentos/Ciga/libros2009/CG009816.pdf accessed on 10 September 2025) to which the facility belongs. |
| 24 | Industrial subsector name | Name of the industrial subsector to which the facility belongs |
1 Sensitive facility data.
Table A2.
Field descriptions for the obtained Pollutant Releases and Transfers dataset ().
Table A2.
Field descriptions for the obtained Pollutant Releases and Transfers dataset ().
| # | Field Name | Description |
|---|---|---|
| 1 | Emission of the substance to water | Substance in any physical state released, directly or indirectly, to water |
| 2 | Emission of the substance to air | Substance in any physical state released, directly or indirectly, to air |
| 3 | Emission of the substance to soil | Substance in any physical state released, directly or indirectly, to soil |
| 4 | State name | Name of the United Mexican State where the facility that released the substance is located |
| 5 | Substance group | Group that identifies the substance |
| 6 | Municipality name | Name of the municipality where the facility that released the substance is located |
| 7 | Substance name | Name of the substance emitted or transferred by the facilities subject to reporting. This substance must be found within the list of 200 substances of interest for the NOM-165-Semarnat-2013 |
| 8 2 | Facility name | Name of the facility that reports the pollutant release |
| 9 | Name of the industrial sector | Name of the industrial sector (https://biblioteca.semarnat.gob.mx/janium/Documentos/Ciga/libros2009/CG009816.pdf accessed on 10 September 2025) to which the facility belongs |
| 10 | CAS Number | A unique number assigned by the Chemical Information Service (CAS), a division of the American Chemical Society, to every uniquely identifiable substance |
| 11 2 | Environmental registration number | Identifier that Semarnat generates for the “facilities” of the Physical or Legal Person (applicant) obliged to carry out some procedure in environmental matters, which relates it to the RFC of the applicant and the municipality where it is located, unique, and non-transferable |
| 12 | Substance transfer to final disposal | Transfer of substances to a site that is physically separated from the facility that generated them to deposit or permanently confine waste in sites and facilities whose characteristics allow for the prevention of their release into the environment and the consequent effects on the health of the population and the ecosystems and their elements |
| 13 | Substance transfer to incineration | Transfer to reduce the volume and decompose or change the physical, chemical, or biological composition of solid, liquid, or gaseous waste through thermal oxidation in which all combustion factors, such as temperature, retention time, and turbulence, can be controlled to achieve efficiency and effectiveness and meet pre-established environmental parameters. This definition includes pyrolysis, gasification, and plasma but only when the combustible byproducts generated in these processes are subjected to combustion in an oxygen-rich environment |
| 14 | Substance transfer to others | Transfer labeled as other |
| 15 | Substance transfer to recycling | Transfer of substances to transform waste through processes that allow its value to be restored, thereby avoiding its final disposal if this restitution favors energy and raw material savings without harm to health, ecosystems, or their elements |
| 16 | Substance transfer to treatment | Transfer of substances to carry out physical, chemical, biological, or thermal procedures, through which the characteristics of the waste are change and its volume or danger is reduced |
| 17 | Substance transfer to sewage | Transfer of substances to discharge, infiltrate, deposit, or inject wastewater into a receiving body or sewer |
| 18 | Substance transfer to reuse | Substances are transferred for using previously used material or waste without a transformation process |
| 19 | Substance transfer to co-processing | Transfer of substances for their environmentally safe integration of waste generated by an industry or known source as an input to another production process |
| 20 | Measure unit | Measurement unit used to report the release of a pollutant substance |
2 Sensitive facility data.
Table A3.
Field descriptions for the obtained IARC substances dataset ().
Table A3.
Field descriptions for the obtained IARC substances dataset ().
| # | Field | Description |
|---|---|---|
| 1 | CAS No. | A unique number assigned by the Chemical Information Service (CAS), a division of the American Chemical Society, to every uniquely identifiable substance |
| 2 | Agent | Name of the substance |
| 3 | Group | Represents the group assigned to the substance by the IARC based on the existing scientific evidence for carcinogenicity |
| 4 | Volume | Edition of the monograph where the substance was included |
| 5 | Volume publication year | Represents the publication year of the IARC monographs where the substance was included |
| 6 | Evaluation year | Year when the IARC recollects information about the substance to evaluate it and determine its group |
| 7 | Additional Information | Contains additional information to justify the assigned group or comments to clarify updates of the IARC group value |
Appendix A.2. Fields in the Original Datasets
Table A4.
List of new fields incorporated into the consolidated facilities dataset ().
Table A4.
List of new fields incorporated into the consolidated facilities dataset ().
| Field | Field Name in Dataset | Description |
|---|---|---|
| Year | year | Represents the year of publication of the RETC dataset |
| State code | cve_ent | A two-digit code that identifies the geostatistical Mexican state in which the facility is located (values from 01 to 32). This code was incorporated based on the state’s name and the key assigned by the INEGI to identify each Mexican state uniquely |
| Municipality code | cve_mun | A three-digit code that identifies the geostatistical municipality in which the facility is located (values from 001 to 553; not all 570 municipalities have RETC registers). This code was incorporated based on the municipality’s name and the key assigned by the INEGI to identify each municipality in Mexico. |
| Are the location values in DMS format? | indmsformat | A boolean value that is true if the latitude and longitude values were captured in the Degree Minutes and Seconds (DMS) format and false otherwise, used to identify which records require the Decimal Degrees (DD) transformation process |
| Do the location values have a default value? | dmsdefaultvalue | A boolean value that is true if the latitude and longitude contain invalid values or a default value and false otherwise, used to identify which records require the Decimal Degrees (DD) transformation process |
| Are the location values in Mexico? | inmexico | A boolean value that is true if the latitude and longitude are located in the Mexican territory () and false otherwise. It is used to identify which records require the set default location value process. |
| Are the location values in their corresponding state? | instate | A boolean value that is true if the latitude and longitude are located in the Mexican state (), as determined using the state code and the INEGI Mexican states shape/polygon, and false otherwise. It is used to identify which records require the set default location value process. |
| Are the location values in their corresponding municipality? | inmunicipality | A boolean value that is true if the latitude and longitude are located in the municipality () of the Mexican state, as determined using the municipality code and the INEGI Mexican municipality shape/polygon, and false otherwise. It is used to locate which records require the set default location value process. |
| Computed latitude | computedlatitude | The result of applying decimal degree transformation to the latitude if the value of the field is true; otherwise, it contains the original latitude registered in the RETC dataset. |
| Computed longitude | computedlongitude | The result of applying decimal degree transformation to the longitude if the value of the field is true; otherwise, it contains the original longitude registered in the RETC dataset. |
| Obtained municipality latitude | municipalitylatitude | The latitude value obtained by querying the municipality and state names to the Google Maps API if the value of is true; otherwise, the valid latitude is captured or transformed |
| Obtained municipality longitude | municipalitylongitude | The longitude value obtained by querying the municipality and state name to the Google Maps API if the value of is true; otherwise, the valid longitude is captured or transformed |
Appendix A.3. Field Status for the Updated Datasets
Table A5.
Field descriptions for the resultant facilities dataset ().
Table A5.
Field descriptions for the resultant facilities dataset ().
| # | Field | Field Name in Dataset | Status | # | Field Name | Field Name in Dataset | Status |
|---|---|---|---|---|---|---|---|
| 1 | Main Activity | mainactivity | Not updated | 19 | UTMY Coordinate | utmxcoordinate | Partially updated |
| 2 | Street name | street | Not updated | 20 | UTMX Coordinate | utmycoordinate | Partially updated |
| 3 | Postal code | postalcode | Not updated | 21 | SCIAN description | sciandescription | Partially updated |
| 4 | Colony name | colony | Not updated | 22 | Between Street 1 | betweenstreet1 | Partially updated |
| 5 | State name | statename | Not updated | 23 | Between Street 2 | betweenstreet2 | Partially updated |
| 6 | Latitude | northlatitude | Not updated | 24 | Industrial subsector name | industrialsubsectorname | Partially updated |
| 7 | Locality name | localityname | Not updated | 25 | Year | year | New |
| 8 | longitude | westlongitude | Not updated | 26 | State code | cve_ent | New |
| 9 | Municipality name | municipalityname | Not updated | 27 | Municipality Code | cve_mun | New |
| 10 | Facility name | facilityname | Not updated | 28 | Are the location values in DMS format? | indmsformat | New |
| 11 | Environmental registration number | nra | Not updated | 29 | Do the location values have a default value? | dmsdefaultvalue | New |
| 12 | Internal identification number | internalnumber | Not updated | 30 | Are the location values in Mexico? | inmexico | New |
| 13 | External identification number | externalnumber | Not updated | 31 | Are the location values in their corresponding state? | instate | New |
| 14 | Industrial park name | industrialparkname | Not updated | 32 | Are the location values in their corresponding municipality? | inmunicipality | New |
| 15 | Industrial sector name | industrialsectorname | Not updated | 33 | Computed latitude | computedlatitude | New |
| 16 | Semarnat activity | semarnatactivity | Partially updated | 34 | Computed longitude | computedlongitude | New |
| 17 | Environmental code | enviromentalcode | Partially updated | 35 | Obtained municipality latitude | municipalitylatitude | New |
| 18 | NAICS Code | naicscode | Partially updated | 36 | Obtained municipality longitude | municipalitylongitude | New |
Table A6.
Status of fields for the facilities dataset .
Table A6.
Status of fields for the facilities dataset .
| Field Name | Status | % of Updated Records in the Field | % of the Updated Content of the DataBase | Field Name | Status | % of Updated Records in the Field | % of the Updated Content of the DataBase |
|---|---|---|---|---|---|---|---|
| Main Activity | Not Updated | 0 | 0 | Latitude | Not Updated | 0 | 0 |
| Semarnat Activity | Partially updated | 91.81 | 3.67 | Locality name | Not Updated | 0 | 0 |
| Street name | Not Updated | 0 | 0 | longitude | Not Updated | 0 | 0 |
| Environmental code | Partially updated | 8.18 | 0.32 | Municipality name | Not Updated | 0 | 0 |
| Postal code | Not Updated | 0 | 0 | Facility name | Not Updated | 0 | 0 |
| NAICS Code | Partially updated | 8.18 | 0.32 | Environmental registration number | Not Updated | 0 | 0 |
| Colony name | Not Updated | 0 | 0 | Internal identification number | Not Updated | 0 | 0 |
| UTMY Coordinate | Partially updated | 6.2 | 0.24 | External identification number | Not Updated | 0 | 0 |
| UTMX Coordinate | Partially updated | 6.2 | 0.24 | Industrial park name | Not Updated | 0 | 0 |
| NAICS description | Partially updated | 8.18 | 0.32 | Industrial sector name | Not Updated | 0 | 0 |
| Between Street 1 | Partially updated | 85.6 | 3.42 | Industrial subsector name | Partially updated | 14.39 | 0.57 |
| Between Street 2 | Partially updated | 85.6 | 3.42 | Year | New | 100 | 4 |
| State name | Not Updated | 0 | 0 |
Table A7.
Field status of the pollutant releases and transfers dataset ().
Table A7.
Field status of the pollutant releases and transfers dataset ().
| Field Name | Status | % of Updated Records in the Field | % of the Updated Content of the Dataset | Field Name | Status | % of Updated Records in the Field | % of the Updated Content of the Dataset |
|---|---|---|---|---|---|---|---|
| Emission of the substance to water | Not Updated | 0 | 0 | Substance transfer to final disposal | Not Updated | 0 | 0 |
| Emission of the substance to air | Not Updated | 0 | 0 | Substance transfer to final incineration | Not Updated | 0 | 0 |
| Emission of the substance to soil | Not Updated | 0 | 0 | Substance transfer to others | Not Updated | 0 | 0 |
| State name | Not Updated | 0 | 0 | Substance transfer to recycle | Not Updated | 0 | 0 |
| Substance group | Partially updated | 91.52 | 4.35 | Substance transfer to treatment | Not Updated | 0 | 0 |
| Municipality name | Partially updated | 9.11 | 0.43 | Substance transfer to sewerage | Not Updated | 0 | 0 |
| Substance name | Partially updated | 0 | 0 | Substance transfer to reuse | Not Updated | 0 | 0 |
| Facility name | Not Updated | 0 | 0 | Substance transfer to co-processing | Not Updated | 0 | 0 |
| Name of the industrial sector | Not Updated | 0 | 0 | Measure unit | Not Updated | 0 | 0 |
| CAS Number | Not Updated | 0 | 0 | year | New | 100 | |
| Environmental registration number | Not Updated | 0 | 0 |
Notes
| 1 | The cancer agency of the World Health Organization. |
| 2 | These links correspond to Mexican government institutions. These sites have issues with their SSL certificates (outdated). Web browsers automatically attempt to access them by using the https protocol, but the links only respond correctly when accessed via http (non-secure protocol). Then, users must manually ensure they are using the http protocol and accept access to these pages without an SSL certificate. |
| 3 | Categorical values of the field can be used for filtering and grouping. |
| 4 | The INEGI is an autonomous public agency responsible for regulating and coordinating the National System of Statistical and Geographical Information, as well as for collecting and disseminating information about Mexico in terms of territory, resources, population, and economy; Available online at this link: https://www.inegi.org.mx/rnm/index.php/catalog/78/download/3300 accessed on 10 September 2025. |
| 5 | Data available from the INEGI: https://cuentame.inegi.org.mx/territorio/division/default.aspx?tema=T accessed on 10 September 2025. |
| 6 | The LUA is an official authorization based on the regulation for the operation and functioning of fixed sources under federal jurisdiction regarding the atmosphere. |
| 7 | https://www.gob.mx/conagua accessed on 15 September 2025. |
| 8 | Available for download: http://geoportal.conabio.gob.mx/metadatos/doc/html/dest2018gw.html accessed on 10 September 2025 http://geoportal.conabio.gob.mx/metadatos/doc/html/muni_2018gw.html accessed on 10 September 2025. These links correspond to Mexican government institutions. These sites have issues with their SSL certificates (outdated). Web browsers automatically attempt to access them by using the https protocol, but the links only respond correctly when accessed via http (non-secure protocol). Then, users must manually ensure they are using the http protocol and accept access to these pages without an SSL certificate. (Do not request by HTTPS protocol, just use HTTP) see Note 2. |
References
- García Arrazola, R.; Rojas, O.; Rodarte Ramón, H.; Martínez Sandoval, P.; Ramiréz, R. RETC (Registro de Emisiones y Transferencia de Contaminantes) como un instrumento para elevar la competitividad de las empresas en México. Investig. Ambient. Cienc. Política Pública 2010, 2, 41–44. [Google Scholar]
- Pacheco-Vega, R. Non-State Actors and Environmental Policy Change in North America: A Case Study of the “Registro de Emisiones y Transferencia de Contaminantes” (RETC) in Mexico. Pik Rep. 2001, 352. [Google Scholar]
- Gobierno del Estado de Jalisco. Reetc: Registro Estatal de Emisiones y Transferencia de Contaminantes. 2008. Available online: https://semadet.jalisco.gob.mx/medio-ambiente/calidad-del-aire/registro-estatal-de-emisiones-y-transferencia-de-contaminantes (accessed on 10 September 2025).
- Gobierno del Estado de Tabasco. Retc: Registro de Emisiones y Transferencia de Contaminantes. 2008. Available online: https://tabasco.gob.mx/retc (accessed on 10 September 2025).
- Gobierno del Estado de Guanajuato. RETC: Registro de Emisiones y Transferencia de Contaminantes Guanajuato. 2024. Available online: https://smaot.guanajuato.gob.mx/sitio/informacion-sobre-tramites/98/Registro-de-Emisiones-y-Transferencia-de-Contaminantes-(RETC)-de-Guanajuato (accessed on 10 September 2025).
- Government of Canada. Pollutant Release and Transfer Register: Organization for Economic Co-Operation and Development. 2024. Available online: https://www.canada.ca/en/environment-climate-change/corporate/international-affairs/partnerships-organizations/pollutant-release-transfer-registers.html (accessed on 20 September 2025).
- Wine, O.; Hackett, C.; Campbell, S.; Cabrera-Rivera, O.; Buka, I.; Zaiane, O.; DeVito, S.; Osornio-Vargas, A. Using pollutant release and transfer register data in human health research: A scoping review. Environ. Rev. 2014, 22, 51–65. [Google Scholar] [CrossRef]
- Berthiaume, A. Unveiling under-utilized public data on Canadian industrial pollutant transfers and disposals. J. Air Waste Manag. Assoc. 2024, 74, 664–684. [Google Scholar] [CrossRef]
- Johnston Edwards, S.; Walker, T.R. An overview of Canada’s National Pollutant Release Inventory program as a pollution control policy tool. J. Environ. Plan. Manag. 2020, 63, 1097–1113. [Google Scholar] [CrossRef]
- Berthiaume, A. Use of the National Pollutant Release Inventory in environmental research: A scoping review. Environ. Rev. 2021, 29, 329–339. [Google Scholar] [CrossRef]
- United States Environmental Protection Agency. Toxics Release Inventory (TRI) Around the World. Available online: https://www.epa.gov/toxics-release-inventory-tri-program/tri-around-world (accessed on 20 September 2025).
- IIngwersen, W.W.; Li, M.; Young, B.; Vendries, J.; Birney, C. USEEIO v2.0, the US environmentally-extended input-output model v2.0. Sci. Data 2022, 9, 194. [Google Scholar] [CrossRef] [PubMed]
- Varady, R.G.; Colnic, D.; Merideth, R.; Sprouse, T. The US-Mexican Border Environment Cooperation Commission: Collected perspectives on the First Two years. J. Borderl. Stud. 1996, 11, 89–119. [Google Scholar] [CrossRef]
- Villareal, M.; Fergusson, I.F. The North American Free Trade Agreement (NAFTA). 2017. Available online: https://ecommons.cornell.edu/server/api/core/bitstreams/223a1bce-953b-428f-a271-c806405361de/content (accessed on 20 September 2025).
- Jacott, M.; Reed, C.; Winfield, M. The Generation and Management of Hazardous Wastes and Transboundary Hazardous Waste Shipments Between Mexico, Canada and the United States Since NAFTA: A 2004 Update; Texas Center for Policy Studies: Austin, TX, USA, 2004. [Google Scholar]
- Semarnat. Secretaría de Medio Ambiente y Recursos Naturales. 2024. Available online: https://www.gob.mx/semarnat (accessed on 15 September 2025).
- Semarnat. Registro de Emisiones y Transferencia de Contaminantes (RETC). 2024. Available online: http://sinat.semarnat.gob.mx/retc/retc/index.php (accessed on 10 September 2025). (Do not request by HTTPS protocol, just use HTTP, see note 2).
- Diario Oficial de la Federación. Norma Oficial Mexicana NOM-165-Semarnat-2013: Que Establece la Lista de Sustancias Sujetas a Reporte Para el Registro de Emisiones y Transferencia de Contaminants. 2014. Available online: https://biblioteca.semarnat.gob.mx/janium/Documentos/Ciga/agenda/DOFsr/DO3231.pdf (accessed on 10 September 2025).
- Qian, H.; Ren, F.; Gong, Y.; Ma, R.; Wei, W.; Wu, L. China Industrial Environmental Database 1998–2015. Sci. Data 2022, 9, 259. [Google Scholar] [CrossRef] [PubMed]
- Tian, X.; Liu, Y.; Xu, M.; Liang, S.; Liu, Y. Chinese environmentally extended input-output database for 2017 and 2018. Sci. Data 2021, 8, 256. [Google Scholar] [CrossRef]
- Chakraborti, L.; Shimshack, J. Environmental disparities in urban Mexico: Evidence from toxic water pollution. Resour. Energy Econ. 2022, 67, 101281. [Google Scholar] [CrossRef]
- Aguilera, A.; Bautista, F.; Gutiérrez-Ruiz, M.; Ceniceros-Gómez, A.; Cejudo, R.; Goguitchaichvili, A. Heavy metal pollution of street dust in the largest city of Mexico, sources and health risk assessment. Environ. Monit. Assess. 2021, 193, 193. [Google Scholar] [CrossRef] [PubMed]
- Geissen, V.; Ramos, F.; de J. Bastidas-Bastidas, P.; Díaz-González, G.; Bello-Mendoza, R.; Huerta-Lwanga, E.; Ruiz-Suárez, L. Soil and water pollution in a banana production region in tropical Mexico. Bull. Environ. Contam. Toxicol. 2010, 85, 407–413. [Google Scholar] [CrossRef]
- Orta-García, S.; Ochoa-Martinez, A.; Carrizalez-Yáñez, L.; Varela-Silva, J.; Pérez-Vázquez, F.; Pruneda-Álvarez, L.; Torres-Dosal, A.; Guzmán-Mar, J.; Pérez-Maldonado, I. Persistent organic pollutants and heavy metal concentrations in soil from the Metropolitan Area of Monterrey, Nuevo Leon, Mexico. Arch. Environ. Contam. Toxicol. 2016, 70, 452–463. [Google Scholar] [CrossRef]
- Briseño-Bugarín, J.; Araujo-Padilla, X.; Escot-Espinoza, V.; Cardoso-Ortiz, J.; Torre, J.; López-Luna, A. Lead (Pb) Pollution in Soil: A Systematic Review and Meta-Analysis of Contamination Grade and Health Risk in Mexico. Environments 2024, 11, 43. [Google Scholar] [CrossRef]
- Castrezana Campos, M. Geografía del cáncer de mama en México. Investig. Geogr. 2017, 93. [Google Scholar] [CrossRef]
- Wang, S.; Mulligan, C. Occurrence of arsenic contamination in Canada: Sources, behavior and distribution. Sci. Total Environ. 2006, 366, 701–721. [Google Scholar] [CrossRef]
- Razo, I.; Carrizales, L.; Castro, J.; Díaz-Barriga, F.; Monroy, M. Arsenic and heavy metal pollution of soil, water and sediments in a semi-arid climate mining area in Mexico. Water Air Soil Pollut. 2004, 152, 129–152. [Google Scholar] [CrossRef]
- Osuna-Martínez, C.; Armienta, M.; Bergés-Tiznado, M.; Páez-Osuna, F. Arsenic in waters, soils, sediments, and biota from Mexico: An environmental review. Sci. Total Environ. 2021, 752, 142062. [Google Scholar] [CrossRef]
- Bhattacharya, P.; Welch, A.; Stollenwerk, K.; McLaughlin, M.; Bundschuh, J.; Panaullah, G. Arsenic in the environment: Biology and chemistry. Sci. Total Environ. 2007, 379, 109–120. [Google Scholar] [CrossRef]
- Hilpert, M.; Mora, B.; Ni, J.; Rule, A.; Nachman, K. Hydrocarbon release during fuel storage and transfer at gas stations: Environmental and health effects. Curr. Environ. Health Rep. 2015, 2, 412–422. [Google Scholar] [CrossRef] [PubMed]
- Weisel, C. Benzene exposure: An overview of monitoring methods and their findings. Chem.-Biol. Interact. 2010, 184, 58–66. [Google Scholar] [CrossRef]
- Hsieh, P.; Shearston, J.; Hilpert, M. Benzene emissions from gas station clusters: A new framework for estimating lifetime cancer risk. J. Environ. Health Sci. Eng. 2021, 19, 273–283. [Google Scholar] [CrossRef]
- INEGI National Statistical Directory of Economic Units. 2024. Available online: https://en.www.inegi.org.mx/app/descarga/?ti=6 (accessed on 11 November 2024).
- Sohrabizadeh, Z.; Sodaeizadeh, H.; Hakimzadeh, M.; Taghizadeh-Mehrjardi, R.; Ghanei Bafghi, M. A statistical approach to study the spatial heavy metal distribution in soils in the Kushk Mine, Iran. Geosci. Data J. 2023, 10, 315–327. [Google Scholar] [CrossRef]
- CONAGUA National Water Commission (CONAGUA): Water Quality in Mexico. 2024. Available online: https://www.gob.mx/conagua/articulos/calidad-del-agua (accessed on 20 September 2024).
- Ali, H.; Khan, E.; Ilahi, I. Environmental chemistry and ecotoxicology of hazardous heavy metals: Environmental persistence, toxicity, and bioaccumulation. J. Chem. 2019, 2019, 6730305. [Google Scholar] [CrossRef]
- Samet, J.; Chiu, W.; Cogliano, V.; Jinot, J.; Kriebel, D.; Lunn, R.; Beland, F.; Bero, L.; Browne, P.; Fritschi, L.; et al. The IARC monographs: Updated procedures for modern and transparent evidence synthesis in cancer hazard identification. JNCI J. Natl. Cancer Inst. 2020, 112, 30–37. [Google Scholar] [CrossRef] [PubMed]
- Semarnat. Licencia Ambiental úNica (LUA), Actualización de LAU y Licencia de Funcionamiento en la Zona Metropolitana del Valle de México y Sectores de Tratamiento de Residuos Peligrosos, petróLeo y Petroquímica a Nivel Nacional. 2020. Available online: https://dsiappsdev.semarnat.gob.mx/datos/portal/publicaciones/proc/715-DGGCARETC/09._Actualizacion_de_lau_y_lf.pdf (accessed on 10 November 2024).
- IARC. Monographs on the Evaluation of Carcinogenic Risks to Humans; World Health Organization, International Agency for Research on Cancer: Lyon, France, 2014. [Google Scholar]


Disclaimer/Publisher’s Note: The statements, opinions and data contained in all publications are solely those of the individual author(s) and contributor(s) and not of MDPI and/or the editor(s). MDPI and/or the editor(s) disclaim responsibility for any injury to people or property resulting from any ideas, methods, instructions or products referred to in the content. |
© 2025 by the authors. Licensee MDPI, Basel, Switzerland. This article is an open access article distributed under the terms and conditions of the Creative Commons Attribution (CC BY) license (https://creativecommons.org/licenses/by/4.0/).