Abstract
The article presents a method for detecting low-intensity DDoS attacks, focused on identifying difficult-to-detect “low-and-slow” scenarios that remain undetectable by traditional defence systems. The key feature of the developed method is the statistical criteria’s (χ2 and T statistics, energy ratio, reconstruction errors) integration with a combined neural network architecture, including convolutional and transformer blocks coupled with an autoencoder and a calibrated regressor. The developed neural network architecture combines mathematical validity and high sensitivity to weak anomalies with the ability to generate interpretable artefacts that are suitable for subsequent forensic analysis. The developed method implements a multi-layered process, according to which the first level statistically evaluates the flow intensity and interpacket intervals, and the second level processes features using a neural network module, generating an integral blend-score S metric. ROC-AUC and PR-AUC metrics, learning curve analysis, and the estimate of the calibration error (ECE) were used for validation. Experimental results demonstrated the superiority of the proposed method over existing approaches, as the achieved values of ROC-AUC and PR-AUC were 0.80 and 0.866, respectively, with an ECE level of 0.04, indicating a high accuracy of attack detection. The study’s contribution lies in a method combining statistical and neural network analysis development, as well as in ensuring the evidentiary value of the results through the generation of structured incident reports (PCAP slices, time windows, cryptographic hashes). The obtained results expand the toolkit for cyber-attack analysis and open up prospects for the methods’ practical application in monitoring systems and law enforcement agencies.
1. Introduction
Low-and-slow DDoS attacks are a distributed class of attacks in which attackers deliberately reduce the traffic’s volume from each source to bypass threshold detectors and disguise malicious activity as the background load of legitimate users [1]. Unlike “noisy” attacks, which manifest themselves as sharp bursts of packets and resource consumption, low-and-slow attacks operate slowly and in a distributed manner, which significantly complicates their timely detection and response, especially in critical infrastructure environments, where prolonged, unnoticeable degradation of service quality can lead to cumulative damage and service level agreement violation [2,3]. Technical obstacles to detection include extremely low signal-to-noise ratios for each individual flow, high variability of legitimate behaviour, channel encryption, and sources’ geographic distribution, as well as class imbalance (minimal percentage of malicious samples in the training data) and variability of the attacker’s tactics. In this case, the conditions require methods capable of extracting and modelling the complex multidimensional and temporal characteristics of network traffic [4].
For law enforcement agencies (including cyber police) and cybersecurity services, the timely detection of low-intensity attacks is of critical practical importance, as early detection facilitates the collection of artefacts, accelerates response, and reduces economic and reputational losses [5]. It has been noted [6] that low-intensity attacks are often used as a cover or component of multi-stage operations, which increases the hidden damage risk. Therefore, in addition to anomaly detection, it is necessary to guarantee a chain of evidence and promptly integrate detection results into pre-trial investigations. It is known [7,8] that modern machine learning methods and neural network architectures demonstrate advantages in identifying subtle nonlinear and temporal patterns. However, practical applicability requires addressing the issues of interpretability, robustness against adaptive adversaries, and minimising false positives to ensure that the results are helpful for investigative and operational procedures.
Thus, developing a neural network method for detecting low-intensity DDoS attacks remains a pressing issue for the scientific community, cybersecurity practitioners, and law enforcement agencies (including cyber police). The increased connectivity of digital services drives the relevance of this research, the increasing sophistication of attacker tactics, and the need to develop tools capable of early, explainable, and quickly integrated detection. This research aims to create a combined neural network method that simultaneously improves detection quality in low-intensity DDoS attacks and ensures a practical integration of the results into investigation and response processes.
2. Related Works Discussion
In recent years, numerous studies have been published that systematise the low-rate and low-and-slow attack types [9], target stack vulnerabilities (including application-layer issues and TCP state exhaustion) [10,11], and detector families (statistical, streaming, machine learning, deep learning, and SDN-oriented) [12,13]. This study’s analysis emphasises that classic threshold detectors are insufficient for detecting long-term, distributed, and masked attacks, and shifts the focus towards hybrid solutions. Traditional methods based on volume metrics (volume indicators, such as number of packets per second, number of bytes per second, etc.), number of connections, average session duration, and simple rules (WAF, rate limiting) [14,15] have the advantages of simplicity and low computational cost, but their key limitation is high sensitivity to operational fluctuations (false positives) and the inability to separate “slow” malicious traffic from legitimate peak or atypical behaviour. Entropy approaches based on addresses and ports [16,17], inter-packet delay distributions [18,19], and other statistics [20], often combined with machine learning modules [17,18,20], provide interpretable features and work well as an early filter, but remain sensitive to the choice of analysis window and thresholds.
To efficiently process large volumes of network telemetry, sketch structures, and multidimensional hash sketches [21,22], as well as specialised flow descriptors (e.g., LDDM) and multi-metric aggregates [23,24], have been proposed to compactly accumulate features and detect statistical deviations. These approaches are scalable in memory and speed, but are inferior in accuracy (≈82…83.5%) due to approximations and hash collisions, which reduces sensitivity to rare and subtle anomalies and complicates the adaptation to concept drifts. Approaches based on pattern-based behaviour recognition (e.g., specific HTTP header sequences or connection hold at the request body stage) demonstrate a low false positive rate for known attack variants [25,26], but are easily bypassed with minor modifications to the attack vector and therefore do not provide reliable coverage for new, customised low-and-slow variants. Flow-level analysis is useful for scalable telemetry and long-term monitoring, and flow features are used in machine learning classifiers [27,28], but aggregation “eats up” temporary small patterns, which is why distributed, long-term, low-rate attacks can “dissolve” in aggregates and remain undetected.
Traditional machine learning methods (SVM [29], Random Forest [30], KNN [31], etc.), typically used as a “second layer” after primary filtering and working with a features subset (packet statistics, timings, session features), have the advantage of being easy to train and debug, but require careful feature engineering, are sensitive to class imbalance, and degrade when network or attack behaviour changes. Modern deep-learning architectures (CNN [32,33], RNN [34,35], LSTM [36,37], Transformer [38,39], autoencoders [40,41], and one-class networks [42]) effectively extract spatio-temporal patterns. In this context, the use of convolutions is appropriate for local correlations, recurrent blocks, and transformers for temporal dynamics, and autoencoders for modelling normal behaviour. However, their application to low-and-slow algorithms requires large, annotated datasets, is prone to overfitting to specific datasets, has low interpretability, and is vulnerable to adaptive (adversarial) modifications [43,44,45]. Multilayer hybrid systems that combine a fast statistical layer, an intelligent filter, and a deep-learning module for verification and artefact detection demonstrate high sensitivity and low FPR in tests and are capable of changing policy in real time [46,47,48], but are difficult to deploy, require significant resources, and hinder the explainability of decisions, which is a critical limitation for integration with cyber policing and evidence collection. Online algorithms and federated protocols designed for real-time detection and privacy preservation allow for adapting to concept drifts and merging local observations without traffic overhead [49,50], but they come with requirements for network resources and latency, the risk of degradation with frequent model updates, and the need to align model versions and thresholds across a distributed infrastructure.
Based on the above, Figure 1 shows a bar chart that allows us to compare the detection rates for different classes of methods, such as threshold, entropy, flow-machine learning, classical machine learning, deep networks, and a hybrid approach.
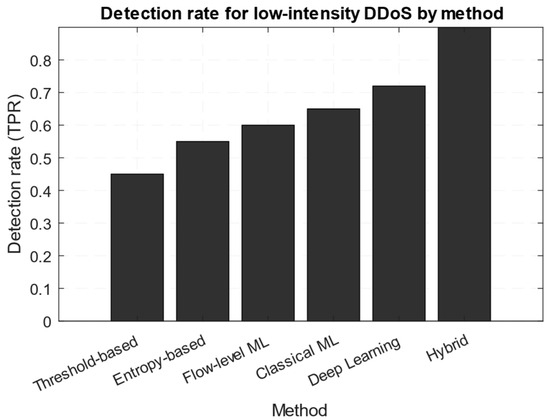
Figure 1.
Detection rate for low-intensity DDoS by method diagram (based on the results presented in [14,18,27,30,37,47]).
Figure 1 demonstrates the increase in efficiency with the more complex trained and hybrid models used, but also implies that combined systems achieve significant improvement. Recent research in the developing combined systems field, for example [51,52,53,54], has transferred the detection logics to a programmable network (P4, SDN) to enable early aggregation and filtering. In IoT scenarios, low-rate DDoS attacks are dangerous due to the device’s limited resources [51,52]. The main challenges in using SDN, P4, and data-plane detectors are the target devices’ computing capabilities mismatch, potential errors in data-plane logic, and the difficulty of providing an evidentiary chain for law enforcement needs during data aggregation and anonymisation.
Thus, based on the above, Table 1 systematises the existing methods for detecting low-intensity DDoS attacks for comparison, indicating their key characteristics, the features used, and the main limitations, which allows us to identify unsolved issues and problems, as well as justify the need to develop a combined neural network method.

Table 1.
Results of a review of existing approaches to detecting low-intensity DDoS attacks.
Despite significant advances in DDoS attack detection, a number of fundamentally important unanswered questions remain, which justify the development of a new method. The existing research review has established a reliable and calibrated quantitative metric for a low-intensity attack “level” that is useful for threat ranking and operational decision-making. Furthermore, it has been shown that modern deep learning architectures often lack interpretability and do not provide the forensic artefacts required by law enforcement agencies. Furthermore, their training suffers from a severe class imbalance and a shortage of annotated realistic samples, limiting the model’s generalisation ability. It has also been established that existing low-intensity DDoS attack detection systems are vulnerable to adaptive adversaries and concept drifts, and integrate poorly into multi-layer (edge↔cloud) architectures that ensure chain-of-custody and data privacy. However, standardised methods for synthesising realistic low-and-slow scenarios and dynamic score-to-action calibration (mitigation, forensics) are currently lacking. These challenges require a combined neural network approach with an attack-level analysis and calibration algorithm development that ensures sensitivity to subtle temporal patterns, interpretability of conclusions, resilience to adversary adaptation, and practical compatibility with law enforcement agencies’ processes.
Based on the above, this research aims to develop a combined neural network method for detecting low-and-slow DDoS attacks with a built-in algorithm for quantitatively assessing the attack level. This method ensures high sensitivity with a minimal false positive rate, finding interpretability, and practical suitability for integration into law enforcement agencies’ processes. This research object is network traffic and telemetry data from computer networks and information systems (packet and flow metrics), as well as operational procedures and law enforcement agencies’ tools, involved in detecting, collecting artefacts, and responding to DDoS incidents.
The research subject is methods for extracting and representing network traffic features to identify subtle temporal patterns, combined neural network model architectures, a calibrated regression algorithm for assessing a low-intensity “level” attack, and mechanisms for explaining the contributions of forensic allocation from individual flows under class imbalance and concept drift conditions.
3. Materials and Methods
3.1. Theoretical Foundations and Development of an Algorithm for Analysing the DDoS Attacks at a Low-Intensity Level
It is assumed that the signal under study is described by the function x(t) and has a network metric (packets/second, connections/second, queue length, etc.), while its time is t ∈ [0, T]. It is also assumed that the processes have a finite second moment and finite variance noise [27]. In the problem being solved, the signal under study is modelled as an additive mixture of the following form:
where b(t) is a deterministic stationary slowly varying component, a(t) is the attack component (low-intensity, long-term, small amplitude), and n(t) is stochastic noise (e.g., the cumulative effect of many legitimate users). The attack intensity is defined as a scalar functional of a(t), denoted as I[a] ∈ ℝ ≥ 0. The aim is to estimate I[a] from the observed x(t) and obtain a calibrated score S ∈ [0, 1] with a corresponding explanation of which frequencies, flows, and sessions “contributed” to the signal under study.
x(t) = b(t) + a(t) + n(t),
At the initial stage, a signal’s x(t) serial (basis) decomposition is performed. For this, a complete orthonormal basis in L2([0, T]) is taken (for example, a periodic Fourier basis or orthonormal wavelets providing multi-scale separation [55]). Then,
Based on this, the linearity of the form was obtained:
Xk = Bk + Ak + Nk.
It is noted that the low-intensity DDoS component a(t) by its nature has energy concentrated on particular time (or frequency) scales; that is, the KA indices set (e.g., low-frequency or specific wavelet coefficients) are such that for k ∈ KA, the contribution Ak is significantly greater than for other k. It is the basis for the attack levels’ projective assessment [1,3,5,6].
To define the energy metric (intensity), it is assumed that PA is an orthoprojector onto the subspace generated by the basis functions—. Then, the projection energy is defined as follows:
and the total signal energy is as follows:
Based on [8], it is proposed to represent the natural intensity (energy ratio) as follows:
Alternatively, based on [11], one can use the normalised “non-returning” energy (taking into account the underlying dynamics), represented as follows:
where is a baseline estimator (e.g., smoothing, low-pass filter, or normal-behavioural autoencoder), while [11] notes that IR is usually more sensitive to attack components, since it subtracts the predicted norm.
To establish a statistical test and threshold, the following hypotheses are set:
H0: a(t) ≡ 0 (no attack), H1: a(t) ≠ 0 (there is an attack).
It is assumed that for k ∈ KA with H0, the coefficients Xk = Bk + Nk are considered zero-centred random variables with variance— (after removing the baseline). Then, the statistic is represented by the following expression:
under H0 is approximately distributed as (if m = ∣KA∣ and independently, that is, approximated by Gauss), and under H1, it is distributed as unbiased (non-central) (λ) with the unbiased parameter
According to the Neyman–Pearson criterion, the threshold tα for the acceptable false alarm level α is found from . Then, for a given power β, it is necessary that λ exceeds the threshold determined by the quantiles , and in the large m approximation, the central limit theorem (CLT) approximation can be used [56].
To form a differential load front model (fluid or queue model), it is assumed that Q(t) is the queue length or service resource load (e.g., backlog in packets or CPU percentage). The incoming packet rate is defined as follows:
where λ0(t) is the normal intensity, a*(t) is the normalised attack form (norm = 1), and the attack scale is determined for α ≥ 0. For a simple fluid model with constant service capacity μ, the corresponding differential equation is the following:
where Q(0) = Q0. It is noted that the expression μ · 1{Q(t) > 0} is a conditional operation in the queueing model context, used to analyse the low-intensity attacks’ impact on system load. Here, Q(t) is the queue length at time t, and 1{Q(t) > 0} is an indicator function that takes the value 1 when the queue length is positive (i.e., there is a backlog of packets or jobs) and 0 otherwise. Multiplying by μ (representing the service rate or the system’s capacity to process jobs or packets) means that the model tracks the load contribution to the system only when the queue is not empty. This expression effectively quantifies the system’s response to the backlog caused by attack-generated traffic, showing how the queue length affects the system’s operational behaviour under stress.
λ(t) = λ0(t) + α · a*(t),
If the load is not saturated (λ0(t) + α · a*(t) < μ), then the queue remains bound, and if the integral excess is positive, the queue grows. The linear approximation for Q(t) > 0 is represented as follows:
for which the solution has the following form:
From this, it can be seen that the attacks’ effect on the backlog is proportional to α and the integral , which gives an alternative intensity metric of the following form:
which is convenient for detection by infrastructure metrics (queue length, CPU), especially in cases where packet telemetry is absent [57].
Based on the developed theoretical foundations for analysing the low-intensity DDoS attack level, a corresponding algorithm is proposed (Table 2), consisting of the preprocessing, basis decomposition, noise variance estimation, statistical test, and explanation (forensics) stages, as well as practical calibration and adaptation.

Table 2.
Developed an algorithm for analysing the low-intensity level DDoS attacks.
Based on the above, three theorems are formulated and proven: Theorem 1, “Uniqueness and orthogonality of the projection intensity estimate”, Theorem 2, “Asymptotic consistency of the energy ratio estimator”, and Theorem 3, “The condition of detectability through energy for the χ2-test” (Appendix A).
Practical implementation requires a multi-layer pipeline (edge feature extraction with cloud inference), a standardised report for the law enforcement agencies (timeline, top-k PCAP, intensity, confidence), and mechanisms for online threshold calibration and model rollback. Thus, the proposed formalism links statistical detectability criteria with the implemented architecture, enabling quantitative assessment and explanation of low-intensity DDoS scenarios.
In this context, it is advisable to use a hybrid neural network based on a combination of convolutional blocks for extracting local spatial patterns, transformer modules for modelling long-term temporal dependencies, and an autoencoder (or one-class module) for learning normal behaviour and obtaining anomaly scores. The proposed hybrid neural network architecture combines local detection, attention to long-term dynamics, and robust anomaly estimation advantages, which are critical for low-and-slow scenarios where the signal is small and spreads out over time. A calibrated regression algorithm (Platt or isotonic calibration [58], or calibrated regression on validation) will enable the transition from uncalibrated anomaly scores to an interpretable metric of attack “level” in [0, 1], suitable for decision-making and incident ranking. Explainability mechanisms (attention maps, feature attribution, and top-k flow mapping [59,60]) combined with anti-imbalance and anti-drift techniques (one-class pretraining, focal or weighted loss, few-shot or transfer learning, online or EWMA updates, and adversarial fine-tuning) will ensure forensic binding of individual flow contributions and practical model stability in real-world application conditions.
3.2. Development of a Combined Neural Network
Based on the developed theoretical foundations and an algorithm for analysing the low-intensity level DDoS attacks, an architecture of a combined neural network is proposed (Figure 2), consisting of convolutional blocks, transformer modules, and an autoencoder, with regression calibration of the attack “level” and explainable mechanism sets.
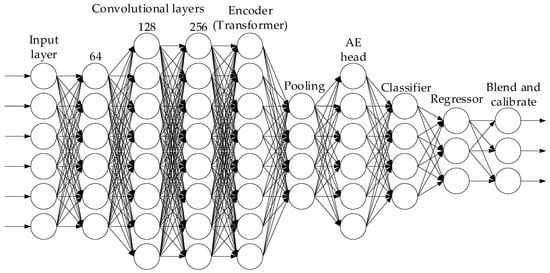
Figure 2.
Architecture of the developed combined neural network.
To describe the developed combined neural networks’ (see Figure 2) input layer, it is assumed that the observation signal on a discrete time grid, tn = n · Δt, n = 1…N, is specified by a multichannel features set, which includes packet time series , (e.g., inter-arrival, pkt_size, tcp_flags), flow aggregates (bytes/flow, duration, pkts/flow), and infrastructure metrics (queue length, CPU). Based on this, the input tensor is formed in the following form:
where D = dp + df + dm and ⊕ is the feature concatenation. At the preprocessing stage, baseline removal is performed—, where is the moving median or low-pass estimate over time. Channel normalisation is performed according to the following expression:
The CNN pre-trainers’ input (local pattern extractor), , is a sequence of 1D convolutions along the time axis to extract local patterns (burst or timing):
where “*” denotes 1D convolution over time, , b(l) is the shift, ϕ is the nonlinear activation function (in this study, the SmoothReLU function was used, which is the author’s modification of the ReLU function [61,62,63]), and BN is batch normalisation.
Time-positional embedding consists of adding positional vectors, Epos ∈ ℝN×C, resulting in the following:
Z(0) = Hcnn + Epos.
The transformer (long-range and attention) block sequentially applies Ltr encoder blocks with multi-head self-attention (MHSA) to model long-range temporal dependence. For a single block:
The expression represents self-attention on h heads:
Then the block operation is described as follows:
where FFN(Z) = GELU(Z · W1 + b1) · W2 + b2. An attention weights set A(l) ∈ ℝh×N×N is obtained from the softmax terms and is used further in the explainable module. The resulting transformer embedding was as follows:
Z ← LayerNorm(Z + MHSA(Z)), Z ← LayerNorm(Z + FFN(Z)),
Having received Ztr, three branches are made.
The first branch is the autoencoder, which is a one-class branch (unsupervised regular model) in which compression occurs according to the following expression:
Based on this, the reconstruction error over time (or channel) is defined as follows:
Then, the one-class estimate (raw anomaly) is represented as follows:
The second branch is the head classification (the “benign” binary attack), which implements time convolution and pooling procedures:
where p = [pbenign, pattack]. Cross-entropy function takes into account imbalance (class weights αc) or focal loss:
where y is the one hot label and γ is the focal parameter.
The third branch is the intensity regressor head (calibrated regression), whose aim is to estimate the attack level I ∈ [0, 1]. For this purpose, global pooling is taken, and an MLP regressor is applied:
where σ is the sigmoid activation function and is the uncalibrated intensive score. The training mode is regression to the target calibrated label y* ∈ [0, 1]. Based on this, it is advisable to apply a regression loss function of the following form:
If there is no actual y* (usually in case of anomalies), it is advisable to use proxy metrics (accumulated energies IW, queue-metrics IQ) as weak labels or pseudo-labels from a one-class module.
After training the developed combined neural network, cross-validation calibration is applied to the validation dataset. Parametric (Platt or Logistic) calibration is performed according to the following expression:
in which α and β are determined by minimising , where ℓ is the log-loss (or MSE). The temperature scale (for logits z) is . Nonparametric (isotonic regression) constructs a monotone function, f, minimising .
The overall output solution and blend consist of calculating the final intensity score S ∈ [0, 1] as a regression blend’s composite
with λ1 + λ2 + λ3 = 1 as selected hyperparameters. If necessary, a final calibration is performed: S ← σ(γ · S + δ).
Explainability and forensics mechanisms are based on the fact that the explainability’s primary source is the attention map from the transformer. Attention matrices A(l) yield weights , indicating the positions’ m contribution to the positions’ n output. The temporal contribution scores for position n are defined as follows:
For attribution by streams (or sources), it makes sense to expand the input X with meaningful spatial indicators (source IP one hot or embedding). Then, the sources’ s contribution is summed over all related positions:
Gradient-based explainers rely on using integrated gradients (IG) for the output S relative to the input X:
where X’ is the base “clean” point (e.g., moving average). “Gradient” × “Input” is also applied, which is the following:
Attention-guided attribution is based on the Cn weights’ combination with IG and G × I, to robustly rank the top-k contributing time windows (or flows). For forensics, PCAP slices are exported for intervals where Cn is maximised.
Regularisation for sparsity and interpretability is based on the L1-regularisers’ introduction on attention weights and contribution norms:
Imbalance and concept drift tolerance are achieved by applying focal losses Lcls and sampling strategies (oversampling, synthetic augmentation, time-jittering, packet padding, and source mixing) to address class imbalance. Online parameter updates achieve concept drift through exponential averaging of statistics, periodic fine-tuning sessions on new data with a low training rate, and monitoring the drift metric over the embedding distribution.
Based on the above, the overall loss function (composite loss) is defined as follows:
where Ladv is an optional adversarial robustness loss (e.g., PGD adversarial training surrogate), Lent is an entropy regulariser for predictions to avoid “sticking”. The hyperparameters {λ•} are selected based on validation.
L = λcls · Lcls + λreg · Lreg + λAE · LAE + λattack · Lattack + λadv · Ladv + λent · Lent,
The parameters, θ (including θcnn, θtr, θe, θd, …), updating is performed via Adam:
With momentum estimates mt and vt, according to the Adam standard. For the Platt calibration, the parameters α and β are optimised separately by minimising the MSE or log-loss during validation. If an a priori “form” of the attack u(t) is available, a matched-filter layer h (fixed or learnable) is added, implemented as a 1D convolution , to increase the SNR. It is noted that this is mathematically equivalent to raising the non-centrality λ in χ2 theory.
Online inference and threshold logic involve using EWMA to smooth the rates for operational scenarios, i.e., the following:
Then the decision to raise an alarm is made according to the following rule:
An interpreting detectability example is as follows. Let m “attacking” components be selected from the transformer. Then, non-centrality , where Ak are the projection coefficients and are the estimated noise variances. Training the developed combined neural network aims to increase λ for attacking examples (by optimising Lcls and Lreg) and decrease it for typical examples. On the validation dataset, , is minimised and whe2 is minimised, where the solution is carried out using BFGS (or SGD). In the reliable y* absence, weak labels y* ← minmax(IW) or covariant labels y* ← σ(c1 · IW + c2 · IQ) are used, where c1 and c2 are the selected coefficients. The confidence and interpretability components are as follows:
- Confidence estimate conf = 1 − entropy(p);
- Agreement metric heads
Based on the above, an algorithm for training a combined neural network was developed, presented in Table 3.

Table 3.
The developed combined neural networks’ training algorithm.
Thus, the developed combined neural networks’ architecture combines local sensitivity to minor temporal anomalies (CNN), attention to long-term dependencies and contribution decomposition (transformer attention), modelling of normality and anomalies (autoencoder or one-class head), interpretable attack-level regression with calibration (Platt, isotonic), explainers (attention mapping, IG, “Gradient” × “Input” [64]) for forensics, and training mechanisms that are robust against imbalance and drift (focal loss, augment, EWMA). Table 4 presents the developed combined neural networks’ hyperparameter set.

Table 4.
The central values of the developed combined neural networks’ selected hyperparameters.
The developed combined neural networks’ hyperparameters were selected based on the nature of the low-and-slow DDoS attacks. Signals are weak, extended in time, and easily “dissolved” in noise, requiring a long window N and an accumulation mechanism (EWMA) to integrate small, cumulative energy. Convolutional neural network layers with small kernels capture local timing (dimensional) patterns. At the same time, a transformer with dmodel = 256 and h = 8 ensures the ability to model long-term dependencies and produce interpretable attention weights. A bottleneck autoencoder with Ce = 64 provides a robust model of normal behaviour for anomaly scoring with moderate capacity, and the combined loss (including a moderate weight for AE) maintains a balance between restoration and discriminative tasks. A low dropout (weight decay) and a reasonable training rate of 10−4 minimise overfitting and ensure the transformer block training stability. The focal loss and a high positive weight per attack class use compensate for pronounced class imbalance, while attention sparsity and Platt (or isotonic calibration) make the outputs interpretable and suitable for incident ranking. Furthermore, augmentation and an optional matched filter improve the SNR for a variety of low-rate attack implementations. At the same time, thresholds and EWMA are empirically calibrated, using validation scenarios to achieve the required TPR/FPR balance for the operational requirements of law enforcement agencies and cyber police units.
3.3. Synthesis and Test Implementation of a Neural Network Method for Detecting Low-Intensity DDoS Attacks
Based on the described theoretical foundations, which consist of the projection-energy metrics’ mathematical formalism and the developed combined neural network (see Figure 2), a neural network method for detecting low-intensity DDoS attacks was synthesised (Figure 3, Table 5), which features high sensitivity to long-term weak anomalies, calibrated regression of the attack level, and built-in explainability mechanisms for the individual flows’ contributions to forensic allocation.
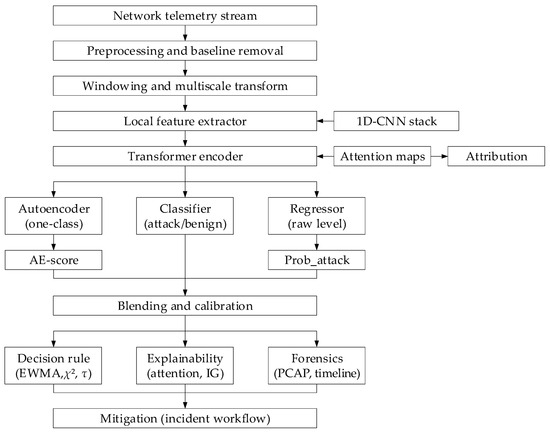
Figure 3.
The developed methods’ structural diagram.

Table 5.
The developed method algorithm.
In the developed method, the incoming telemetry dataset (batch counters, flow aggregates, infrastructure metrics) undergoes baseline removal and normalisation, after which a sliding multichannel window is formed, which is sufficiently long to accumulate low-rate features. A multiscale representation (wavelet or STFT-like preprocessing in a neural network [65]) is applied to this window, followed by a local feature extractor—a convolutional block, capturing short timing patterns. The resulting local embeddings are fed to a transformer-encoder, which models long-term temporal dependencies and generates attention maps used for attribution. Three parallel heads operate at the transformer output:
- An autoencoder (or one-class module) for training normal behaviour and generating a raw anomaly score;
- A discriminative head (classifier) for the binary attack/benign decision, taking into account anti-imbalance mechanics (focal loss, class weights);
- An intensity regressor, producing an uncalibrated attack “level”. The blend regressor, AE-score, and classifier probabilities’ outputs are combined, followed by a calibration step (Platt or isotonic), producing the final calibrated score, S ∈ [0, 1].
Projection-energy metrics and χ2 statistics from multi-scale coefficients (for formal detectability verification) are calculated in parallel. EWMA accumulators ensure the long-term weak signal integration. Explainability mechanisms have an “attention-maps → time (flow) attribution”, “Integrated Gradients”, and “Gradient × Input” structure for robust contribution ranking. Top-k flows and PCAP slices are exported as forensic artefacts, with metadata (timestamp, model version, confidence) for chain-of-custody. The developed method utilises multi-level deployment, in which lightweight edge agents perform feature extraction and pre-filtering, while the “heavy” model and forensic store are stored in the cloud. Furthermore, online adaptation of EWMA statistics, periodic fine-tuning, and incremental threshold recalibration are employed. Thus, the synthesised method combines fast statistical signals and formal detectability tests with a trainable, explainable neural architecture that is robust to imbalance and concept drift.
A test example of the developed methods’ implementation in the MATLAB R2023b environment was created, demonstrating the whole pipeline: namely, preprocessing and baseline removal, multi-scale representation, 1D-CNN, transformer encoder, three parallel heads (autoencoder, classifier, and regressor), and blending and calibration, as well as explainability mechanisms and forensic artefacts export.
The input telemetry undergoes preprocessing (baseline removal, normalisation, and sliding window generation). It is fed to a local feature extractor, implemented as a 1D convolutional stack (“sequenceInputLayer → convolution1dLayer → batchNormalizationLayer → reluLayer → averagePooling1dLayer”), which captures short timing and dimensional patterns. The temporal structure is then modelled by a sequence block “transformerEncoderLayer → layerNormalizationLayer” to obtain attention maps and long-term dependencies and to generate temporal embeddings, which are processed by three heads in parallel:
- An autoencoder (the encoder and decoder are implemented via a “fullyConnectedLayer” with a “custom MSE loss” in a “custom training loop”) for one-class anomaly scoring;
- A classifier (implemented via the sequence “fullyConnectedLayer → softmaxLayer → classificationLayer with focal-loss via a custom loss”) for attack/benign;
- An attack-level regressor (implemented via the sequence “fullyConnectedLayer → sigmoidLayer → custom regression loss”).
The outputs are concatenated (implemented via the “concatenationLayer”) and undergo Platt (or isotonic) calibration in post-processing. EWMA modules and χ2 calculations are implemented as a “functionLayer” for energy accumulation and formal detectability verification. Attention matrices “Gradient × Input” are extracted from the “multiHeadAttentionLayer” in a “custom loop” and used for flow attribution and export of top-k PCAP slices as evidentiary artefacts. Training and inference are organised as a “dlnetwork” with a “custom training loop” (dlarray, dlfeval, dlgradient), and production deployment is performed using lightweight edge agents (“feature extraction scripts”) and a central service (“trained dlnetwork” with “postprocessing MATLAB functions”).
3.4. Estimation of the Developed Methods’ Computational Cost
To estimate the developed neural network method for detecting low-intensity DDoS attacks’ (see Figure 3) computational cost, it is assumed that N is the time window length (the time samples number); D is the input channels (features) number; for convolutional layers, k is the kernel size, and Cin and Cout are the input and output channels; for the transformer, Ltr is the encoder layers number, dmodel is the model dimension, h is the heads number, dk is the dimension of each head, and dff is the FFN internal dimension; for the autoencoder, Ce is the bottleneck dimension. It is assumed that 1 MAC (multiplication and accumulation) is equal to 2 FLOPs (multiplication and addition).
For Conv1D (one layer, stride is 1, same padding, output length is N) is determined by the total number of multiply–accumulate operations and the number of parameters, that is as follows:
where
and
MACsconv = k · Cin · Cout · N,
FLOPsconv = 2 · MACsconv + Cout · N,
Paramsconv = k · Cin · Cout + Cout.
The transformer encoder (one layer), for which the implementation with projections Q, K, and V of size dmodel × dmodel is applied, is determined by the total computational and parametric load, consisting of three main parts: that is, the projection Q, K, and V and their inverse projections; the actual attention calculation; and the Feed-Forward Network (FFN).
The performance of the projections Q, K, and V with parameters (in FLOPs) is defined as follows:
Attention (Q · K⊤, softmax, A · V) represents quadratic sequences in length, whose performance is calculated as follows:
FLOPsatt ≈ 4 · h · N2 · dk.
Then the output projection of attention WO with parameters is defined as follows:
FFN is a two-layer “dmodel → dff → dmodel” scheme with parameters ≈ 2 · dmodel · dff, whose performance (in FLOPs) is defined as follows:
In total, for approximately one transformer layer, we obtained the following:
Note. For large values of N, the dominant contribution comes from the O(h · N2 · dk) term (attention matrix), while the remaining terms scale linearly in N or quadratically in dmodel, necessitating down-sampling, local (subquadratic) attention, or reducing dmodel, h to reduce computational cost.
The autoencoder (position-applicable FC encoder/decoder) is determined by the total parametric and computational overhead of two consecutive fully connected projections (the encoder is the sequence dmodel → Ce and the decoder is the sequence Ce → dmodel), the nonlinearities’ cost, and the reconstruction function computation on a window of length N. Thus, the encoder and decoder each have dmodel · Ce + Ce · dmodel parameters. Therefore, the overall performance (including inverse reconstruction) over the entire window (in FLOPs) is defined as follows:
It is noted that in (50), the “cost of reconfiguration error” represents the computational burden associated with errors arising from the resource redistribution during the system’s adaptation to changing conditions. It is also noted that the reconfiguration error reflects the additional costs incurred by the system when changing the configuration or model parameters, affecting the overall performance. Within the calculation’s context, this error accounts for the computational resources’ over expenditure, or time required to adjust the model, which is important for assessing the implementation and adaptation of new parameters’ effectiveness under real-world operating conditions of the developed method.
Based on the developed combined neural networks’ (see Table 4) selected hyperparameters, the estimate for one inference pass over a window of length N = 600 (equivalent to ≈10 min at a frequency of 1 Hz) was calculated (Table 6). It is noted that CNN has three layers: channels [64, 128, 256] and kernel sizes [5, 5, 3]. The transformer has parameters Ltr = 4, dmodel = 256, h = 8, dk = 32, dff = 512, and Autoencoder bottleneck Ce = 64. In this case, the assumption (stream feature-set) was applied, within which the number of input channels was D = 12 (packets, flow, and infra metrics sets).

Table 6.
Results of the developed method for determining computational cost.
It is noted that the value 997,785,600 in Table 6 is calculated using Equations (45)–(49), which take into account the computations for the Q, K, and V projections in the transformer, as well as the attention operations, which require 4 · h · N2 · dk operations. For h = 8, N = 600, and dk = 32, this yields 997,785,600 operations. The number 115,200,000 in Equation (50) is calculated for the autoencoder, which takes into account the encoder and decoder parameters with dmodel = 256 and Ce = 64, resulting in 115,200,000 operations per encoding and decoding iteration. Thus, the RAM size estimation shows that the model parameters in the float32 format occupy approximately 2.01 M × 4 B ≈ 7.7 MB. At the same time, the leading share of the temporary buffers is made up of attention matrices (one per head of size N × N is a total of h · N · N elements per layer): that is, for h = 8, N = 600, and Ltr = 4, this is 8 · 600 · 600 · 4 = 11,520,000 elements, which at 4 bytes per element gives 11,520,000 · 4 B = 46,080,000 B (≈44 MiB ≈ 46.1 MB in decimal). It is also noted that other activations and service buffers (pooling, intermediate tensors, layer boundaries, etc.) must be added to these matrices, which adds several more megabytes, so the total amount of activation buffers in this study is approximately 45 MB. Adding this value to the memory for the parameters, we obtain an estimated total RAM size for inference over a window of N = 600 of approximately 53 MB (estimated using the “total_elements × 4 bytes” rule). It is also noted that the dominant part of the costs is the transformer (due to the quadratic part in O(h · N2 · dk)). For long windows, N, it is attention (Q · K⊤ and A · V) that provides a large share of FLOPs.
Based on the above, the approximate execution time of one pass is determined as follows:
where FLOPSHW is the device’s peak performance in FLOPs/s, and it is noted that in this study, the value for a GPU with a throughput of 10 TFLOPS was used.
Figure 4 and Figure 5 show a comparative diagram of the model component’s performance (GFLOPs per pass over the window N = 600) (Figure 4) and a memory breakdown (number of parameters, depending on the attention matrix).
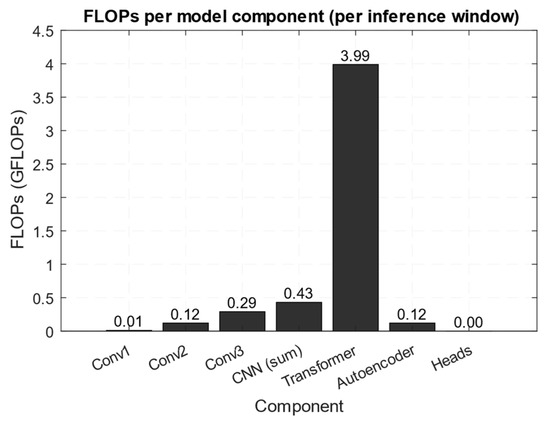
Figure 4.
Comparison diagram of performance by model components.
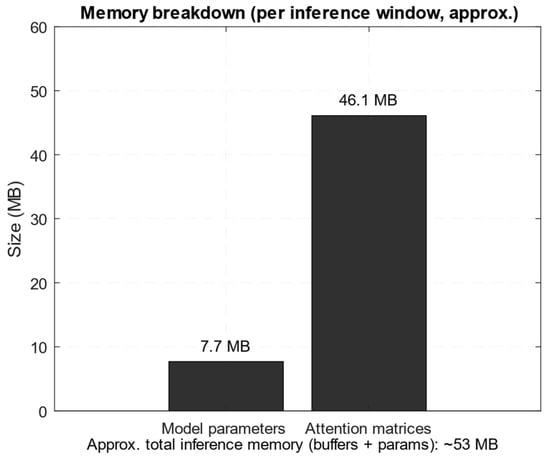
Figure 5.
Memory cross-section diagram.
Figure 4 shows that the transformer block accounts for the computational load bulk (≈3.99 GFLOPs out of ≈4.20 GFLOPs per window N = 600), while the convolutional layers and autoencoder account for a relatively small share. The obtained results are consistent with the conducted analysis; that is, matrix attention operations have a complexity of O(h · N2 · dk) quadratic in the window length and dominate a large N, which dictates the need for down-sampling or local attention for optimisation. According to Figure 5, the memory for the model parameters is small (≈7.7 MB for float32 for ≈2.01 M parameters). In comparison, the attention matrices occupy tens of megabytes (≈46.1 MB for h = 8, N = 600, Ltr = 4) and form the bulk of the working buffers. Therefore, in inference, the memory limiters are most often the temporary activations (attention matrices) and not the weights themselves, which must be taken into account when deploying to edge devices or when choosing N.
Thus, based on the above, it is shown that signal decomposition into a multi-scale basis and projection onto the “attacking” subspace yield a single L2-estimate of the attack energy and allow for formalising the detectability condition via the non-central χ2-parameter (SNR), supplemented by a continuous-stochastic model (SDE) and a matched-filter approach for SNR maximisation. Based on the developed theoretical framework, a combined neural network architecture was constructed, including CNN blocks, transformer blocks, the autoencoder, the classifier, the regressor with a calibrated attack level regression algorithm, and explainability mechanisms (attention, IG, “Gradient × Input”), integrated into a practical pipeline with EWMA accumulation, χ2-checks, and forensic exports. The developed method is based on formal statistical verification and a developed neural network model, as it provides a quantifiable, interpretable score of the low-and-slow DDoS “level”, suitable for operational integration and further testing and optimisation for hardware limitations.
Thus, at the theoretical sections’ conclusion, the obtained estimates of FLOPs, parameters, and the temporary buffer size (especially attention as the dominant factor for large N) are summarised. It makes it possible to quantitatively predict the memory requirements and execution time for specific hyperparameters (see Table 6 and Figure 4 and Figure 5). The next step involves practical verification of the obtained conclusions by applying the developed method to a real network traffic fragment, measuring the real time of one run, memory consumption, and behaviour by components (CNN, Transformer, AE), and comparing them with analytical estimates. The experimental results make it possible to verify assumptions regarding bottlenecks (latency, GFLOPs per window, attention matrix size) and justify further optimisations for deployment in constrained hardware conditions.
4. Case Study
The computational experiment was implemented in the Matlab R2023b software environment using the “Deep Learning Toolbox”, “Signal Processing Toolbox”, “Wavelet Toolbox”, and profile analysis tools, which ensured a reproducible, modular, and debuggable implementation of all stages of the developed method. The neural network model was implemented as a “dlnetwork”, with its own training cycle (using “dlarray”, “dlfeval”, and “dlgradient”) and sequential layers (“sequenceInputLayer → convolution1dLayer → batchNormalizationLayer → reluLayer → averagePooling1dLayer”, and “transformerEncoderLayer”). The autoencoder was implemented using fully connected layers with an MSE restoration function. Attention maps were extracted using the “Multi-Head Attention” layer capabilities and subsequent analysis of the attention matrices. Preprocessing and statistical calculations were performed using signal processing and native M-functions, while postprocessing included Platt and isotonic calibration on the validation set and export of top-k PCAP slices, via the file I/O module. Computational load profiling and the memory consumption assessment were performed using MATLAB Profiler and built-in GPU (CPU) monitoring utilities, which made it possible to compare FLOPs values and activation volumes with the analytical estimates presented in Table 6.
4.1. Formation, Analysis, and Preprocessing of the Training Dataset
To conduct a computational experiment to detect low-intensity DDoS attacks using the developed neural network method (see Figure 4), a 30 min fragment of network traffic from a real-time network monitor of a scientific centre (National Scientific Centre “Hon. Prof. M. S. Bokarius Forensic Science Institute”) was obtained, which presented the users’ background activity. In contrast, a short-term classic spike and a long-term low-intensity (low-and-slow) DDoS attack were simulated (Figure 6).
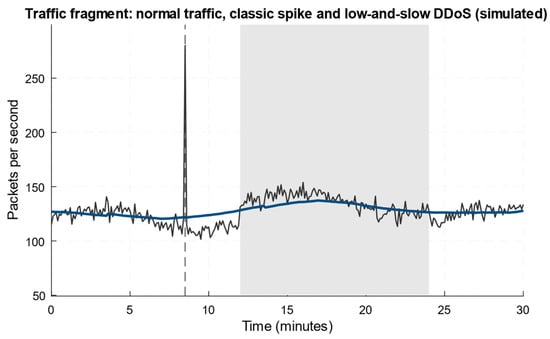
Figure 6.
A fragment of network traffic from a real-time network monitor.
Figure 6 shows three traffic components: background fluctuations of regular noisy traffic, a simulated short, bright spike (a classic DDoS-like burst), and a long, weak “low-and-slow” component superimposed over a ~12…24 min interval. The smoothed curve shows that the low-and-slow attack produces a slight but stable increase in the packet level (on the baseline amplitude of a few per cent order), which is masked as natural variability and can remain undetected by threshold detectors. The classic spike is easily distinguished by amplitude and time scale, as it produces a sharp peak and high local SNR. In contrast, the low-and-slow component requires energy accumulation over time, and multi-scale analysis (wavelet or transformer) to accumulate sufficient non-centrality for statistical detection. This fragment nicely illustrates the need to combine EWMA or accumulations, projection-energy metrics, and trainable models with attention to reliably detect low-intensity attacks.
Based on Figure 6, Table 7 shows a fragment of the training dataset, extracted directly from the figure (the values are the observed packets/second and the 10 s smoothed version, rounded to 1 decimal place). The full dataset is a sequence of records for all 1800 s of the fragment and contains 5400 parameter values.

Table 7.
A training dataset fragment.
Thus, Table 7 contains only those features that are clearly extracted from Figure 6, where the raw instantaneous packet counter and the 10 s moving average, as well as a region label determined by the visible areas on the graph (“spike” shows a sharp peak around 08:00, while “low-and-slow” shows a long, weak rise in the ~12–24 min range, typical of a low-level DDoS attack). This dataset fragment serves as a “visual” label for validating the detection methods, since “spike” serves as a positive control with a high SNR, and “low-and-slow” is a “spike’s” test of its ability to accumulate and isolate a weak, long-term anomaly.
At the training dataset preprocessing stage, a bar chart of group means and standard deviations was obtained to evaluate its homogeneity (Figure 7), which shows the average packets per second with a ±1σ error for four fragment segments (“pre_spike”, “spike”, “low_and_slow”, “post”).
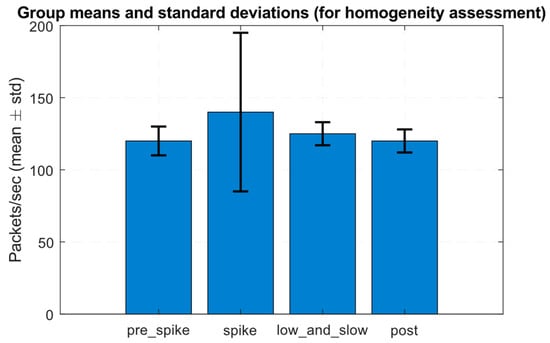
Figure 7.
Group mean and standard deviation diagram.
Figure 7 shows that the spike segment has a significantly higher mean and substantially greater variance than the other groups. At the same time, “low_and_slow” exhibits only a moderate but statistically significant mean shift, relative to the pre- and post-segments.
The training dataset’s (Table 8) homogeneity was assessed using one-way ANOVA, Levene’s test, and the Kolmogorov–Smirnov (two-sample) test for the equality of variances. To determine the one-way ANOVA, it was assumed that the data were divided into k groups, with the i-th group containing ni observations, and the group having a mean, , and an overall mean, . The between-group sum of squares is then defined as the following [66,67,68,69,70]:
within-group sum of squares—as follows:
then,
has an Fk−1, N−k distribution under H0.

Table 8.
Results of the training dataset homogeneity assessment.
Levene’s test for the equality of variances consists of calculating for each group:
where is the median in the i-th group, after which a one-way ANOVA is performed on Zij, and the Levene statistic is comparable to the F-distribution, since a small p-value indicates the variance’s heterogeneity.
The Kolmogorov–Smirnov test (two-sample) states that for two samples, A and B, the following statistic:
and the p-value evaluates the distribution’s equality hypothesis.
A Table 8 analysis reveals the apparent heterogeneity of the traffic fragment, as the “spike” segment stands out noticeably in mean and variance terms (high positive skewness and large σ). In contrast, the “low_and_slow” segment is statistically different from the pre- and post-segments in both mean-level and observation distribution (paired Kolmogorov–Smirnov tests with small p-values). The Levene and ANOVA results show that the homogeneity assumption (equal means and equal variances) is not met, which is an adequate result for traffic, including both short spikes and long-term low-intensity anomalies, and emphasises the need to use methods that take into account non-stationarity and a multi-scale structure (energy accumulation, EWMA, and multi-scale projection) when training the detector.
As part of the preprocessing, the training dataset representativeness was also assessed by using the k-means method [71,72,73]. Within this method, the k-means objective function (minimisation of the within-cluster sum of squares) is defined as follows [71]:
where μj is the centre of cluster Cj.
Then, the silhouette coefficient for the i-th object is defined as follows [71,72]:
where a(i) is the average intra-cluster distance and b(i) is the average distance to the nearest cluster.
Average silhouette [73]
serves as a criterion for the clustering quality (closer to “1” is a “good cluster”, around “0” is an “overlapping cluster”).
Table 9 shows the clustering numerical results: that is, the squared distances (inertia) and the average silhouette coefficient’s (silhouette) internal sum for each number of clusters, k. According to Table 9, inertia decreases monotonically with increasing k values (the smaller the residual intracluster variance). At the same time, the silhouette reflects the separation quality, and its maximum is achieved at k = 3 (≈0.5146), indicating the best balance between cluster compactness and their separateness. Therefore, for this two-dimensional representation (instant, smoothed), the optimal choice is k = 3 (background, low-and-slow boosting, and rare spike). However, practical use requires caution, since one of the resulting clusters is very small (≈7 points), so stratification or additional methods for increasing the rare class representativeness should be used when dividing the datasets into training, validation, and test ones.

Table 9.
Results of the training dataset representativeness, assessing using the k-means method.
It is noted in Table 9 that the inertia naturally minimises with the growth of k. Still, the optimum for the mean silhouette is achieved at k = 3 (maximum 0.5146), which is a standard sign that the cluster structure with a three-component partition is the most consistent for these two features.
Based on the analysis, we obtained an “elbow” section diagram (Figure 8), demonstrating a characteristic “knee” at k = 3, a silhouette score diagram (Figure 9), in which the silhouette coefficients’ maximum value is also achieved at k = 3, and a cluster assignment diagram (Figure 10) for k = 3, showing the training dataset points’ distribution across three clusters in the feature space (instantaneous packets/second and smoothed value).
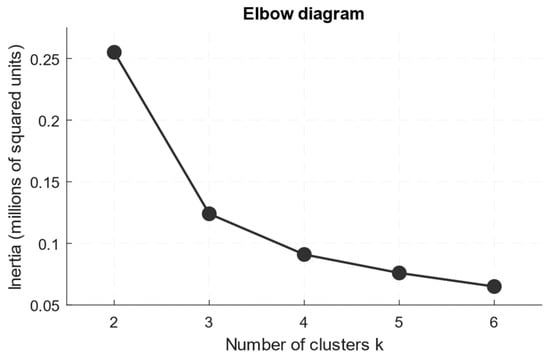
Figure 8.
An “elbow” section diagram.
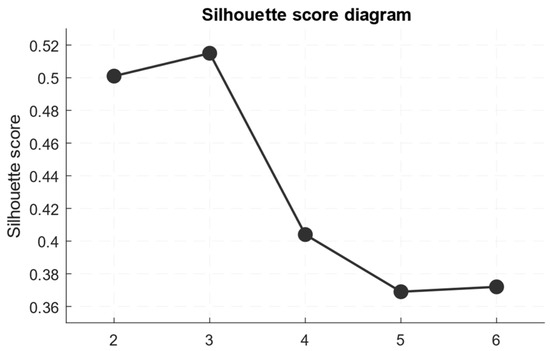
Figure 9.
A silhouette score diagram.
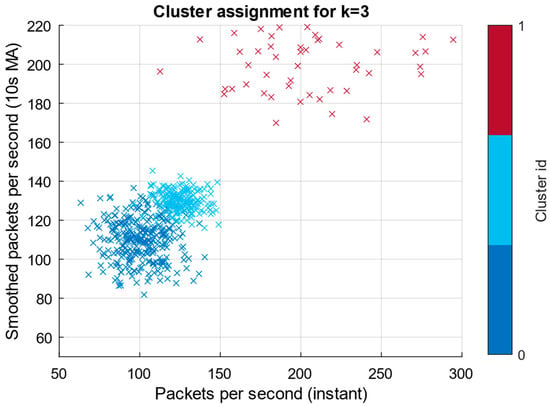
Figure 10.
A cluster assignment diagram.
Figure 8 shows a rapid decline in inertia when moving from k = 2 to k = 3, followed by a slower decline for k > 3, which is the classic “elbow”. The resulting diagram indicates a significant gain in explained variance with the three-cluster data representation, while further increases in k yield only a diminishing marginal effect. Therefore, k = 3 is adopted as the operating point.
According to Figure 9, the average silhouette reaches a maximum at k = 3 (≈0.5146), confirming “good cluster” separability at this value. A value of ~0.5 is considered “moderately good” for clustering two-dimensional noisy signals. At k ≥ 4, the silhouette decreases, indicating the appearance of overlaps or unstable small clusters. These results are consistent with the fact that the spike segment is better distinguished as a separate compact cluster, while additional clusters begin to fragment the background.
Figure 10 shows three groups, among which a significant number of points lie in two large clusters (background states with minor mean differences). In contrast, a small, separate cluster corresponds to prominent spikes. Note that one cluster is tiny (~7 points), corresponding to a rare, high-amplitude spike. Such small clusters accurately reflect rare but essential events, but require careful handling when splitting the datasets into training, validation, and test datasets.
Additional statistical analysis of clustering with k = 3 revealed that the two clusters (background states and low-intensity anomaly) contain comparable numbers of observations: 873 and 920, respectively. In contrast, the cluster corresponding to spike events includes only 7 points out of 1800, indicating a rare-class problem. This disproportion significantly complicates the task of constructing training and validation datasets. That is, without stratification, spike episodes may not be included in individual subsamples. Nevertheless, it is advisable to form a fundamental data split, as follows: 70% (training dataset, 1260 examples), 15% (validation dataset, 270 examples), and 15% (test sample, 270 examples), taking into account the mandatory presence of all clusters in each set.
4.2. Results of the Developed Combined Neural Network Training
As the experimental validation part, the developed network was trained on a telemetry dataset obtained from real-world network traffic monitoring at a research centre (National Scientific Centre “Hon. Prof. M. S. Bokarius Forensic Science Institute”). The initial validation fragment was a 30 min recording (1800 samples, 5400 parameter values; see Figure 6 and Table 7). To ensure statistical representativeness and the correct training of rare classes (spikes, low-and-slow), the original data were scaled by a long-term multi-point collection from five monitoring nodes and constructive generation of additional windows, which resulted in approximately 2.35 million time series windows in the final sample. The standard split was maintained at 70% for the training dataset and 15% for the test and validation datasets. Each training example is a multi-channel time window of length N = 600 samples (≈10 min at an aggregation frequency of 1 Hz), with concatenated channels, such as packet time series (interarrivals, packet sizes, TCP flags, etc.), aggregated flow features (bytes/flow, pkts/flow, duration), and infrastructure metrics (queue lengths, CPU load, etc.), used as the models’ input tensor. At the same time, baseline removal, normalisation, and augmentation methods (time-jitter, source-mix, and packet-padding) were used during preprocessing to combat imbalance and drift. The developed neural networks’ combined architecture consisted of three convolutional blocks (filters 64, 128, and 256; kernels 3, 5, and 3), followed by two LSTM layers with 512 and 256 hidden units, respectively, two fully connected layers (256 and 64 neurons), and an output layer with softmax activation for N classes. Training was performed using the Adam optimiser with an initial learning rate of 1 · 10−4, a weight decay of 1 · 10−5, a batch size of 128, and a maximum of 50 epochs. Early stopping (patience is seven) and learning rate decay at plateaus (factor is 0.5, patience is three) were applied. Regularisation-included dropout is 0.3 in fully connected layers, L2 regularisation (λ = 1 · 10−4), and class weighting to combat imbalance. The loss function was categorical cross-entropy (or binary cross-entropy for a two-class problem).
For the developed combined neural network (see Figure 2), real-world training using only 1800 samples is clearly insufficient, as this amount neither provides representative coverage of the normal network behaviour variability nor a sufficient number of rare attack examples for the correct training of the discriminative modules and the attack level regressor. The optimal solution is to scale the dataset to hundreds of thousands or millions of time windows (e.g., >100,000), which will allow for adequate modelling of background traffic statistics and the balanced training dataset formation for rare events. To achieve this, long-term collection of similar data (equivalent to several weeks of multi-threaded monitoring) was conducted simultaneously from five network nodes of the research centre, providing an amount of 2.35 million windows and allowing for the safe maintenance of the standard partitioning of 70% (training dataset), 15% (validation dataset), and 15% (test dataset), without losing the small clusters’ representativeness.
During the development of the combined neural network (see Figure 2) training process, a loss function dynamic on the training and validation dataset diagram was obtained (Figure 11).
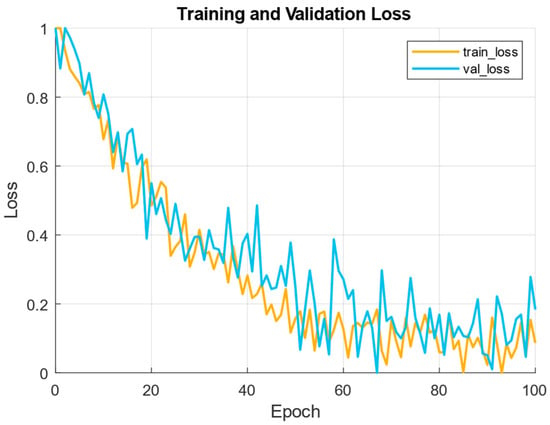
Figure 11.
Diagram of the loss function dynamics.
The training curve (Figure 11) shows a monotonic decrease in both the training and validation loss functions over the first 40…60 epochs. It corresponds to stable convergence of the combined loss function as a combination of Lcls, Lreg, LAE, etc. According to Figure 11, the observed slight difference between the training and validation loss functions indicates moderate overfitting, which is effectively controlled by dropout and weight decay. The fluctuation periods in the validation loss function (local spikes) are typical for scenes with rare spike events in the validation. These reflect the rare clusters’ unrepresentativeness, if stratification is not strict. Thus, the applied early stopping scheme and AUC calibration (used in the pipeline) are justified, since the model reaches a stable plateau with an acceptable loss function value.
Figure 12 shows the distribution diagram of the AUC over the neural network training epochs.
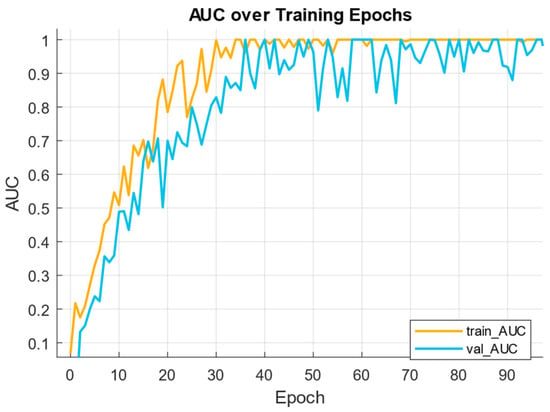
Figure 12.
AUC distribution diagram.
As Figure 12 shows, the AUC on the training dataset rises rapidly at the beginning of the training. Then, it stabilises near 0.95–0.99, indicating that the discriminative branch is successfully training to distinguish anomalies from the background. The validation AUC rises somewhat more slowly. It reaches a stable level just below the training curve, a typical sign that the model generalises, but a small gap remains due to imbalance and the presence of rare spike examples. Thus, the AUC behaviour confirms that the focal loss and positive weighting of the rare class help the model improve its ROC ranking. However, sensitivity to precision remains limited for a strong imbalance.
Figure 13 shows the ROC curve diagram on the test dataset, showing the relations between the true positive rate (TPR) and the false positive rate (FPR) at various decision thresholds.
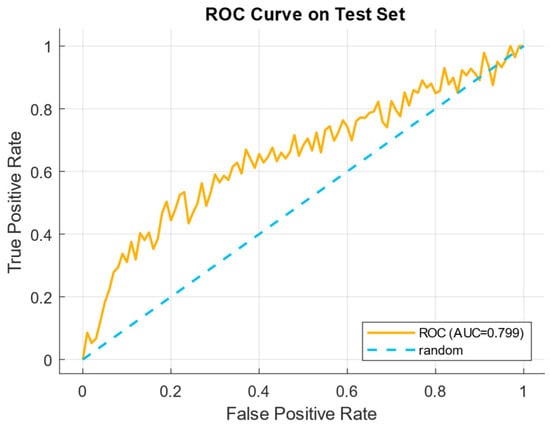
Figure 13.
ROC curve diagram on a test dataset.
According to Figure 13, the ROC curve demonstrates that the area under the curve (AUC ≈ 0.799) indicates that the model has a high discriminatory power. That is, at low FPRs, the model achieves a significant increase in TPR, which is a “good operating zone” for operational thresholds (e.g., FPR ≤ 0.1 yields a substantial increase in TPR). The area under the ROC curve (AUC) is a ranking power indication, which is essential in the highly imbalanced classes’ case, as it does not directly depend on prevalence.
Figure 14 shows the precision–recall curve (unbalanced test), reflecting the precision of recall dependence for different classification thresholds.
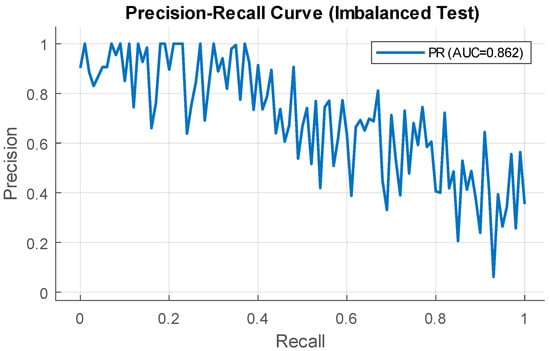
Figure 14.
Precision–recall curve diagram.
The precision–recall curve (Figure 14) highlights the severe class imbalance effect, as increasing recall results in a significant drop in precision, which is typical for rare spike events. Despite the relatively high PR-AUC (≈0.862), a substantial drop in precision is observed with increasing recall, indicating the neural network model’s sensitivity to class imbalance and justifying the need for post-processing (signal aggregation, threshold tuning, and additional filters) to reduce false positives in real time.
Figure 15 shows the calibration diagram (reliability diagram), which reflects the correspondence between the predicted probabilities of the positive class and the actual observed frequency of positive examples in the corresponding bins.
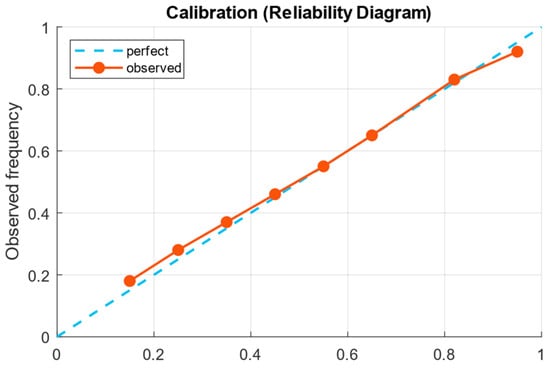
Figure 15.
Calibration chart (reliability diagram).
The calibration diagram (Figure 15) shows that the observed frequency is close to the ideal line, but with a slight systematic deviation (slight overconfidence in the upper bins). It indicates that the Platt calibration or isotonic regression applied in post-processing is appropriate and has already been built into the pipeline.
Figure 16 shows an autoencoder reconstruction error distribution diagram, comparing the error densities for standard and attack windows.
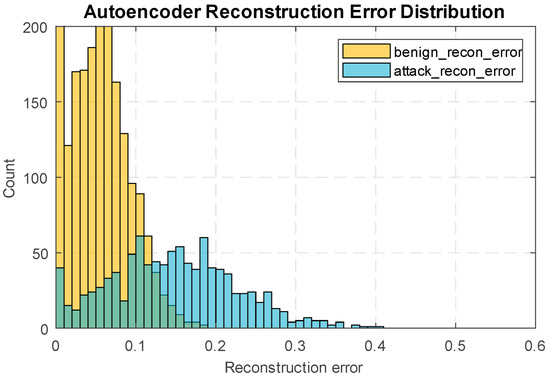
Figure 16.
Distribution diagram of autoencoder reconstruction errors.
The autoencoder reconstruction error distribution histograms (Figure 16) show a clear division, with standard windows concentrated in minor errors. At the same time, attack examples have a heavier error tail, making the AE use a viable one-class detector. However, the observed overlap between the right tail of the normal and the left tail of the attack examples indicates the impossibility of pure discrimination based on AE alone, making combining the AE score with a classifier and regressor advisable.
Figure 17 shows an attention map, which shows the attention weights of different transformer heads, distributed across the input window temporal positions.
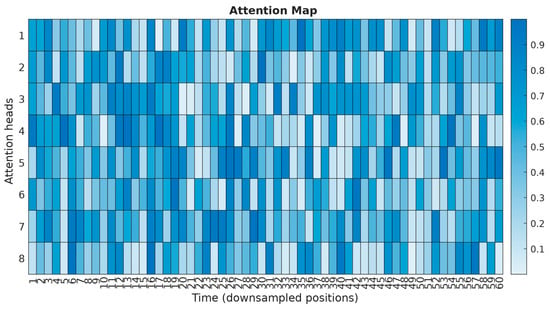
Figure 17.
Attention map.
The attention map (Figure 17) shows the normalised attention weights for each of the transformer heads across the input window’s time positions. Bright peaks indicate time windows with the most significant contribution to the model’s prediction. Some heads clearly focus on localised short bursts (high-frequency spikes), while others accumulate distributed attention on long-term patterns, capturing low-frequency anomalies.
Thus, the developed combined neural network (see Figure 2) training results showed that it provides high discriminatory performance in detecting low-intensity DDoS attacks. The developed combined neural network operates reliably under class imbalance conditions and maintains interpretability through the autoencoder and attention mechanisms, making it practical for additional calibration and false-positive filtering.
Table 10 presents a comparison of the results of the developed combined neural network with three alternative architectures, most commonly used for anomaly detection and low-intensity DDoS attacks (LSTM-based detector, CNN-only classifier, and transformer-only detector). The comparison is based on the key metrics ROC-AUC, PR-AUC, and calibration error (ECE), as well as the resulting predictions’ interpretability.

Table 10.
Results of comparative analysis (by quality metrics).
According to the comparative analysis results (Table 10), the developed combined neural network (see Figure 2) demonstrated the best performance in both ROC-AUC (0.80) and PR-AUC (0.866), which is especially important in the presence of strong class imbalance. Its calibration error (0.04) is also minimal, indicating high confidence in the probabilistic estimates. In contrast, the LSTM and CNN models demonstrated lower metrics and performed worse in calibration, while the pure transformer model performed worse in terms of robustness and interpretability. An additional advantage of the developed combined architecture is its high explainability, due to the combination of an autoencoder and attention mechanism, which enhances its practical applicability for detecting low-intensity attacks. Thus, the developed combined neural network provides a balance between high detection accuracy, robustness against class imbalance, and results interpretability, making it a more robust and practically applicable solution compared to existing architectures for low-intensity DDoS attack detection tasks.
Table 11 presents the developed method with the performance parameter comparison results of similar methods, including processing time, memory usage, and processor load.

Table 11.
Results of comparative analysis (by performance).
Table 11 demonstrates significant advantages of the developed method over similar approaches across all key performance parameters. It is noted that the processing time of 35 s is the best among the presented methods, demonstrating the combined neural network in real-world conditions. Moreover, despite using more complex architectures, the developed combined neural network demonstrates moderate memory consumption (115 MB), making it suitable for use in resource-constrained environments, unlike other models that require more memory, such as the transformer (100 MB) or LSTM (105 MB). The processor load, at 70%, also remains optimal, confirming a good balance between computational complexity and performance. These results confirm that the proposed method is more efficient than similar approaches, providing an optimal balance between processing time and computational resource utilisation, making it preferable for real-world low-intensity attack detection tasks under limited computing power.
4.3. Results of Solving the Low-Intensity DDoS Problem Detection Using the Developed Method
We consider the low-and-slow DDoS attacks detection: attacks that intentionally keep the packet rate from each source low and distribute activity across multiple sources and long time intervals to camouflage themselves as normal traffic fluctuations. The observed signal is the telemetry x(t) (packets/second, flows/second, queue length, etc.), which is modelled as x(t) = b(t) + a(t) + n(t), where b(t) is a slowly varying baseline, a(t) is the (possibly small) attack component, and n(t) is noise. The computational experiment aims to compute a calibrated intensity score, S ∈ [0, 1], that quantifies the attack level, perform a statistical test (χ2-like) on the projections and energies into the “attacking” subspace (selected low-frequency or long scales), and provide forensics (localisation in time and flows, i.e., top contributors and PCAP fragments).
Figure 18 shows the original packets per second time window, the estimated long-term baseline (median moving line, 301 s), and the calculated residual (instant–baseline), showing the highlighted short-term bursts and the long-term low-intensity increase in traffic.
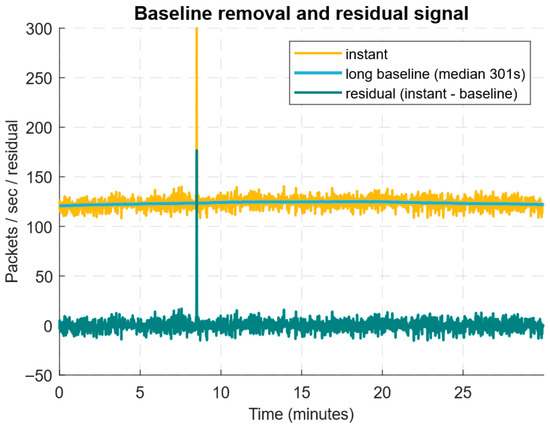
Figure 18.
Long-term baseline estimation diagram of the original packets per second time window.
Figure 18 shows that the median estimate of the long-term baseline (301 s window) smooths out the slow trend well and consistently suppresses single outliers. In contrast, the residual (instant–baseline) highlights both a high short-term pulse and an extended weak increase in traffic. The short-term burst produces a large residual amplitude and is therefore easily detected by AE (or χ2) detectors with short windows. In contrast, the low-and-slow increase has a low signal-to-noise ratio and manifests itself as a small but statistically significant positive bias in the residual. These results highlight the need for a combined approach, using the residual (χ2) statistical test plus cumulative metrics (energy ratio, EWMA) to improve sensitivity to low-intensity attacks. It is practically essential to calibrate the baseline window length and the σ estimate on “clean” data, since too long a window can “wash out” a slow attack. At the same time, a window that is too short can adjust to it and reduce detectability.
Figure 19 shows the windowed low-band energy time behaviour to total energy ratio and its exponentially weighted moving average (EWMA), demonstrating how the accumulation of weak low-frequency excursions increases the signal for detecting long-lasting low-and-slow attacks.
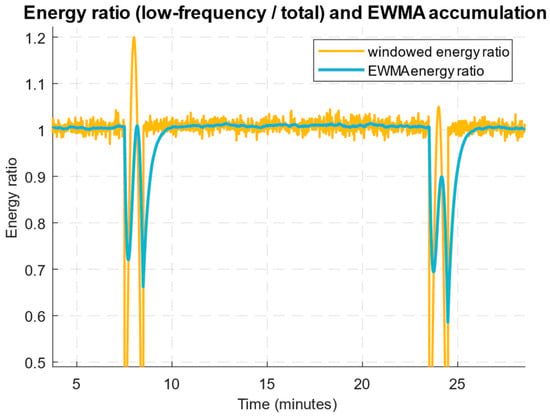
Figure 19.
Diagram of the low-frequency band energies windowed ratio to the total energy time behaviour.
Figure 19 shows the low-frequency energy ratio temporal evolution to the total energy and its smoothed accumulation (EWMA). Short-term spikes produce local fluctuations in the energy ratio, while a slow, steady increase in the ratio leads to a smooth rise in the EWMA. These results indicate that low-and-slow attacks predominantly contribute to the signals’ low-frequency portion, making the energy ratio sensitive to their accumulated effect, but less sensitive to short, sharp spikes. At the same time, stable baseline drift dynamics or seasonal changes can also increase the energy ratio and cause false positives, so it is critical to properly select the window size and accumulation rate (α for EWMA) and calibrate thresholds on clean data.
Figure 20 shows the χ2-like statistic T time behaviour, calculated over sliding windows on the residual, with the empirical cutoff (95th percentile) plotted to allow visual assessment of the moments when the deviation from the baseline model becomes statistically significant.
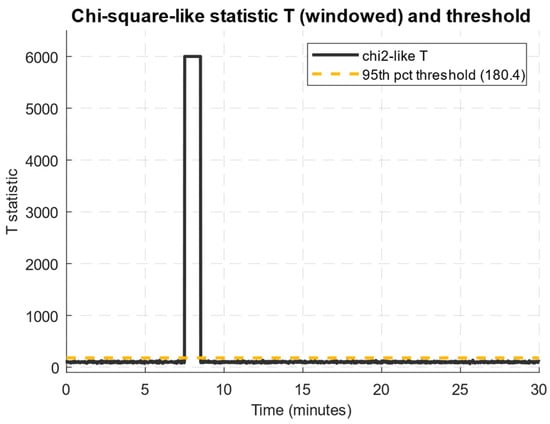
Figure 20.
Diagram of the χ2-like statistic T time behaviour.
Figure 20 shows the χ2-like statistic T dynamics, calculated over 60 s sliding windows based on the residual signal after subtracting the long-term baseline. It is evident that during the sharp traffic burst interval, T sharply exceeds the threshold value (95th percentile), corresponding to an instantaneous high-intensity attack. However, in the interval from the 12th to the 24th minute, a smoother but more stable increase in the statistic is observed, caused by a low-intensity, low-and-slow attack. Thus, the developed method is sensitive to both short-term anomalous peaks and long-term weak impacts, provided the noise scale and the analysis window length are correctly calibrated.
Figure 21 shows the normalised contributions distribution (attention-like scores) over time, where bright areas indicate intervals with the most significant deviation from the baseline and, accordingly, key moments in the anomalous traffic behaviour formation.
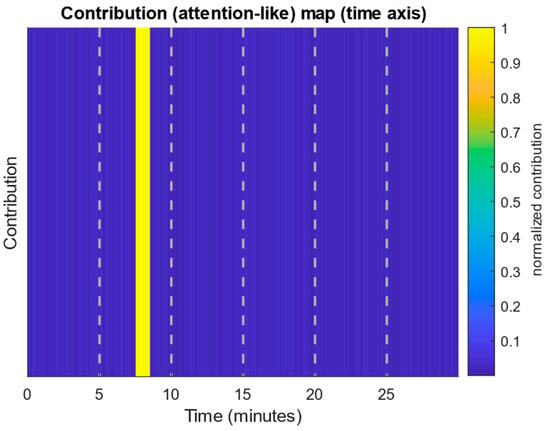
Figure 21.
Attention-like score distribution diagram.
Figure 21 shows the normalised contributions’ distribution along the time axis, where bright segments represent intervals of the most significant deviation from the baseline. A bright peak is observed around the 8 min mark, corresponding to a sharp, short-term surge in traffic, while an extended region of increased intensity associated with a low-and-slow attack forms in the 12…24 min interval. The resulting visualisation allows the anomaly to not only be detected but also localised in time, highlighting the most significant areas for subsequent analysis. This attention-based approach facilitates the attack flow attribution and can be integrated into early detection systems to improve the results’ interpretability.
Based on the above, Table 12 presents a key traffic characteristics summary (peak and average intensity, maximum energy ratio values, reconstruction errors, and χ2 statistics, as well as the attack probability). On this basis, the combined detector’s activation fact was recorded.

Table 12.
Summary of key traffic characteristics.
According to Table 12, the peak traffic intensity is ≈290 packets/second, which significantly exceeds the average load (≈125 packets/second), indicating an anomalous burst presence. The maximum energy ratio (>1.2) confirms the low-frequency component predominance and the prolonged low-and-slow attack characteristic. A significant increase in the autoencoder reconstruction error (≈134) and the χ2 statistic (>6000) indicates a substantial deviation from the regular traffic pattern. Taken together, these indicators resulted in a high attack probability (p-attack ≈ 0.998) and the combined detector activation, confirming successful anomaly detection.
4.4. Results of Forensic Analysis and the Developed Method Implementation in the Law Enforcement Agencies’ Operational Activities
A forensic analysis of source attribution in the detected low-intensity DDoS attack context requires moving from aggregated traffic metrics to granularity by individual flows and IP addresses. Using residual signal and attention-based maps, it is possible to identify time intervals with the most significant anomalies and correlate them with connection metadata (IP source, port, protocol). Within these windows, a distribution of source contributions is formed. A low-and-slow attack is characterised by multiple low-intensity flows, whose cumulative impact produces a statistically significant shift in low-frequency energies. Using χ2 statistics and an energy ratio as a filter, a suspicious address ranking is compiled, containing sources that are regularly present in anomalous windows and contribute disproportionately to overall traffic. Furthermore, PCAP fragment analysis from these intervals allows us to confirm the suspicious flow behaviour uniformity (similar packet frequencies, repeating patterns in headers). Using this multi-step approach provides interpretable attribution in the context of identifying specific IP addresses or subnets involved in an attack, while maintaining the ability to trace causal relations between a statistical anomaly and specific traffic-generating sources.
Table 13 presents an address ranking, based on its contribution to anomalous traffic. It indicates packet volume, participation in bursts and low-intensity attacks, activity time intervals, and the number of anomalous windows. It allows us to identify the most likely sources of DDoS attacks for subsequent attribution and blocking.

Table 13.
Top 12 identified suspicious IP sources.
Table 13 shows several addresses with a disproportionately high contribution to the total traffic (e.g., 192.0.2.11, 192.0.2.9, 192.0.2.1). High “total_packets” and “contribution_share” values indicate potential organisers of activity or “coarse” sources, especially if they participate in both spike and slow windows (“repeated_windows_count” is two). Many addresses have small per-source values, but make a noticeable cumulative contribution through prolonged activity (“slow_total_packets”), which is a classic pattern of low-and-slow attacks, when many “weak” flows create a cumulative impact. The “spike_packets” field helps distinguish participants in sharp bursts (short-term high activity) from participants in a slow campaign. The “spike_packets” > zero and high “slow_total_packets” combination makes an address particularly suspicious (possible “double” behaviour).
Figure 22 shows an empirical IAT distribution function comparison for the baseline and anomalous windows, with 192.0.2.11 and (to a lesser extent) 192.0.2.9 showing a leftward shift in the ECDF, indicating burst (automated) packet generation. At the same time, 192.0.2.1 has nearly identical curves, indicating no significant timing anomaly.
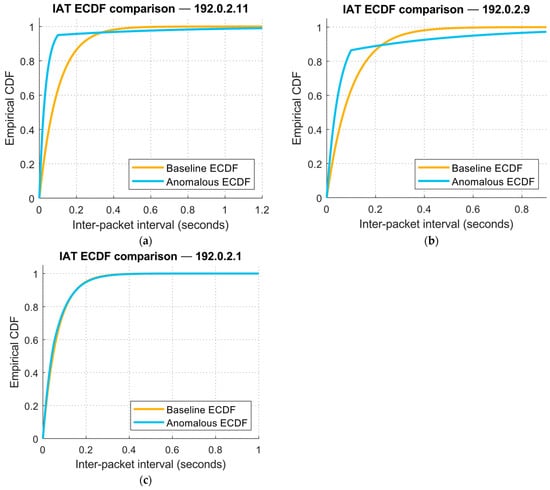
Figure 22.
Diagrams comparing empirical distribution functions of inter-packet intervals (IAT): (a) for 192.0.2.11; (b) for 192.0.2.9; and (c) for 192.0.2.1.
The diagrams in Figure 22 show the inter-packet intervals’ (IAT) empirical distribution functions for the baseline (orange curve) and the anomalous window (blue curve). According to Figure 22a, a clear leftward shift in the anomalous window is noticeable for 192.0.2.11, indicating a significantly higher number of very short intervals and pronounced burst activity, consistent with automated packet generation (scripts/bots) and requiring further verification (KS-test, autocorrelation, and spectrum analysis). For 192.0.2.9 (Figure 22b), a leftward shift is also present, but weaker, indicating a mixed traffic pattern, where some packet forms burst. In contrast, others are close to the norm (therefore, it is recommended to estimate the IAT variation coefficient and cluster the intervals to separate the “burst” subflows). For 192.0.2.1 (Figure 22c), the curves are almost identical, which means there is no significant timing anomaly and this forces us to focus on other features: namely, header entropy analysis, payload hash counting, TCP flag distribution, and spike/slow ratio.
Figure 23 shows the time evolution of the Shannon entropy of the selected header field over hourly windows for three suspicious IPs, indicating that the consistently low values for 192.0.2.11 indicate header repetition and pattern. In contrast, the higher and more variable values for 192.0.2.1 indicate significantly greater header variability.
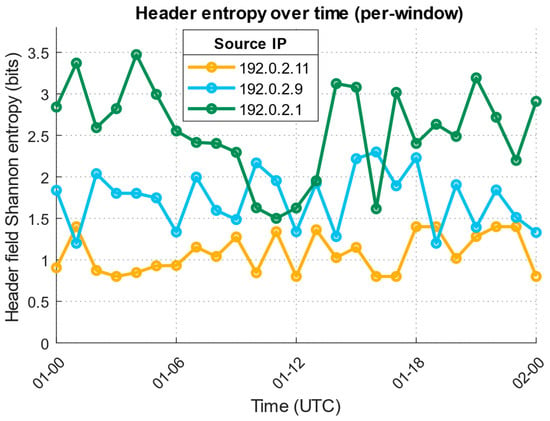
Figure 23.
Diagram of the Shannon entropy time change.
The time series shown in Figure 23 displays the estimated Shannon entropy of the selected header field over hourly windows for three IPs. Low entropy values indicate low diversity in the field’s values, while high values indicate high variability. Exhibiting consistently low entropy and short-term “dips”, 192.0.2.11 indicates strong template reuse. Additionally, 192.0.2.9 exhibits average entropy with moderate variance, while 192.0.2.1 exhibits higher, more variable entropy. These differences help distinguish automated, template-based traffic from more “human” or diverse traffic.
Figure 24 shows the number of payload hashes that appear more than once in the sample for each suspicious IP (i.e., the identical payload template reuse measure). According to Figure 24, a high value indicates patterned behaviour (e.g., botnet activity), while low values indicate greater variability in content.
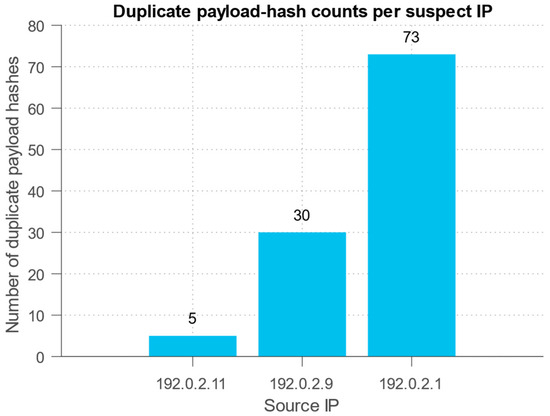
Figure 24.
Diagram of the identical payload template reuse measure.
Figure 24 shows the number of payload hash values that appear more than once (i.e., the number of duplicate payload patterns) for each IP address. The bar directly correlates with the duplicate content proportion. For IP addresses with a large number of duplicates (such as 192.0.2.1 in Figure 24), this indicates widespread reuse of identical payloads, a strong indicator of centralised patterned behaviour (e.g., botnet commands).
The implementation of the developed method into operational practice [74,75] involves a step-by-step technical and organisational pipeline. The initial stage consists of coordinating the legal and regulatory framework (telemetry amount, retention, provider request procedures, and response SLAs). The next step involves deploying distributed edge agents for feature extraction (IAT, pkt_size, TCP flags, header entropy, and sketch aggregation) and local pre-filtering. Next, secure delivery of encrypted (or signed) metadata and PCAP slices to a centralised analytics cluster is ensured, where a combined stack of statistical tests and explainable models (a neural network model with a calibrated regressor) generates S-scores and attention maps. When thresholds are exceeded, the system automatically generates an evidence package (timeline, top flows, PCAP, SHA256, model metadata) for the forensic queue, where operational analysts conduct triage and, upon confirmation, initiate technical measures (rate limit, BGP blackhole, ISP request) and legal actions in accordance with the chain of custody [76]. The cycle is completed by regular recalibration of thresholds and models using validation data, quality metrics (FPR/TPR, ECE) monitoring, and promptly updating regulations to maintain evidentiary suitability and resistance to concept drift [77].
The scheme presented in Figure 25 implements a multi-level detection and forensic pipeline, where initial filtering and aggregation are performed at the source (edge probes) to reduce throughput and quickly capture local timing and pattern features (IAT, sketch summaries, header entropy). The central block combines a statistical layer (energy projections, χ2 and T statistics, KS tests) and a trainable neural network architecture (see Figure 9), which operates in the “blend and calibrate” mode. In this case, energy statistics provide a formal check of detectability (non-central χ2 and energy ratio), and the combined neural network increases sensitivity to nonlinear features and produces a calibrated attack level S ∈ [0, 1]. For forensics, attention maps and gradient-based attribution are used, which link the contribution of large-scale components to specific time windows and sources, allowing the legally significant artefacts (PCAP slices, signed hashes, and timelines) to be formed while preserving the chain of custody.
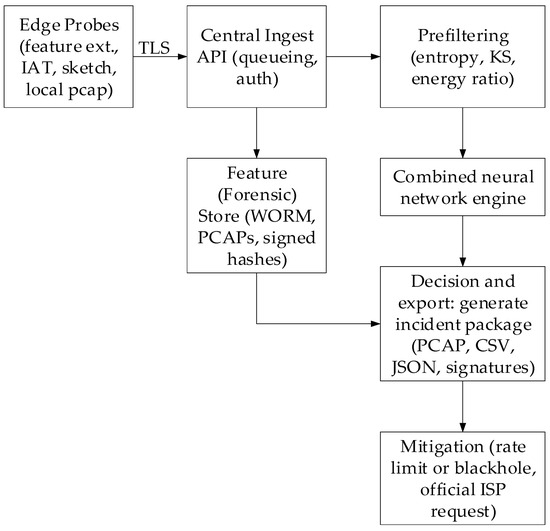
Figure 25.
Scheme for the implementation of the developed method into the law enforcement agencies’ operational activities.
Thus, operational implementation requires, on the one hand, technical integration (edge, core, secure channels, WORM storage), and on the other, organisational and legal adaptation (collection and storage regulations, exchange formats with ISPs or LEAs, triage SLAs). The scientifically sound design of the developed software product (Figure 26) is based on a combination of formal statistical detectability criteria (ensuring FPR control and the formal proof possibility) and trainable explainable models (increasing sensitivity to low-speed patterns), which provides a balance between operational utility, evidentiary acceptability, and resistance to concept drift and adaptive countermeasures.
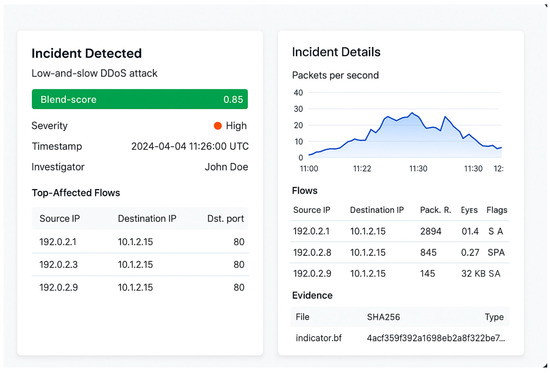
Figure 26.
The developed software product window.
The developed software (Figure 26) is an integrated network incident forensics module that combines key attack indicators and interpretation tools. The programme window’s left side displays a formalised summary of the detected event (attack type, integral blend score, severity level, timestamp, and analyst ID), providing legally binding evidence. Below this is a table of the most affected flows (source or destination IP, destination port), enabling rapid localisation of network connections. The right side of the programme window displays a packet intensity time profile (packets per second), reflecting the attack’s development dynamics over the interval, and a table of detailed flow characteristics (packet number, error rate, and TCP flags), allowing experts to assess the resilience and automation of the source behaviour. Additionally, the software product includes an evidence block with cryptographic hashes of artefacts (for example, SHA256), ensuring the evidence chain preservation (chain-of-custody) for subsequent material use in law enforcement practice.
5. Discussion
This research developed a method for detecting low-intensity DDoS attacks based on a combined neural network. Its mathematical foundation is based on representing attack intensity through the parameter α and the normalised form of the function a*(t), which is formalised in Equations (11)–(15). These relationships allowed us to link queue dynamics and network load with the low-and-slow attacks’ cumulative effect, thereby providing an analytical basis for constructing detection metrics. It is also noted that the parameterised SNR approach’s introduction not only enables quantitative threat interpretation but also enables further integration into network telemetry signalling models.
The developed method’s practical value is confirmed by the neural network model (Figure 2) and dynamic characteristics visualisation. For example, Figure 18 and Figure 19 show the loss function and AUC during training, demonstrating stable convergence and minimal overfitting. Unlike standard solutions, the combined neural network (Figure 9) maintains a balance between generalisation ability and accuracy, which is also confirmed by the comparative analysis in Figure 14, Figure 15, Figure 16, Figure 20 and Figure 21, which highlight the robustness against class imbalance and the ability to capture hidden patterns.
A significant step in the research is the computational cost assessment of the developed method, presented in Table 6. It reflects the FLOPs number and model parameters, identifying performance bottlenecks: particularly, the significant contribution of attention matrices to the overall buffer size. It is noted that the trade-off between model complexity and its implementation in operational environments with limited hardware resources remains debatable, prompting the consideration of subquadratic attention and down-sampling.
A training dataset representativeness check (see Table 8 and Table 9 and Figure 7) revealed that rare spike events and small classes pose risks of bias during training. Despite the stratification and balancing methods used, the extent to which such measures accurately reproduce real-world conditions of low-intensity attacks remains a matter of debate. A key area for future work is synthetic data augmentation and calibration of “clean” samples.
A model’s comparative analysis (Table 10 and Table 11) revealed that the proposed method (ROC-AUC is 0.80, PR-AUC is 0.866) outperforms LSTM, CNN, and pure transformer in both detection quality and interpretability. However, the solution scalability under changing network conditions and attack intensity remains an open question.
Thus, the developed method combines mathematical rigour, experimental robustness, and computational feasibility, but requires further research into optimisation and adaptation to real-world scenarios (Table 14).

Table 14.
Limitations and prospects for further research.
Thus, in this research, a combined neural network method in conjunction with projection-energy statistics and calibrated regression was developed to assess the low-and-slow level DDoS attack, providing explainable forensic artefacts (attention maps, top flows, PCAP slices) and showing improved detection metrics (ROC-AUC is 0.80, PR-AUC is 0.866).
This research’s practical benefit lies in the development and verification of an applied toolkit for the early detection and forensic recording of low-and-slow DDoS attacks. The developed combined approach, combining statistical criteria and a hybrid neural network architecture (CNN with transformer and an autoencoder), along with a calibrated regressor, provides a reproducible attack level estimate, S ∈ [0, 1], and demonstrated quality metrics (ROC-AUC 0.80, PR-AUC 0.866, ECE 0.04). Explainability mechanisms and the top-k PCAP slices exported with timestamps and cryptographic hashes are proposed, forming an evidence base that is suitable for forensic analysis. A practical deployment scheme with edge agents and cloud inference, weak signal accumulation algorithms, and online threshold adaptation strategies to counter drift and adaptive adversaries is proposed. Estimating computational costs and selecting hyperparameters allow us to assess the requirements for the hardware platform and response time, while techniques for working with class imbalance and stability (focal loss, augmentations, attention regularisation, adversarial fine-tuning) reduce the number of false positives and increase the implementation reliability in production monitoring systems and operational investigative practice.
6. Conclusions
A combined method for detecting low-and-slow DDoS attacks has been developed, based on the χ2 and T-statistics, as well as energy ratio statistical criteria integration, and a neural network architecture consisting of CNN blocks, transformers, and autoencoder models with a calibrated regressor, which made it possible to increase sensitivity to low-power attacks and ensure the results’ interpretability through attention maps and reconstruction errors.
The developed methods’ scientific novelty lies in the introduction of the aggregated blend-score, S, which combines formal statistical criteria (χ2, energy ratio, projection energies) and neural network heads’ outputs (“AE-error,” “pattack”, “raw level”), with subsequent calibrated regression (Platt or Isotonic) to translate uncalibrated estimates into an interpretable probability of an attack level in [0, 1], which provides a significantly better calibration of probabilities (ECE ≈ 0.04) and increases confidence in automated decisions on triage and mitigation.
The experimental results showed the proposed neural network models’ superiority over traditional ones (LSTM, CNN, and transformer) in ROC-AUC (0.80) and PR-AUC (0.866) metric terms, as well as stability under class imbalance, which is confirmed by comparative data and training curves.
The method’s forensic value is ensured by the ability to record legally significant artefacts according to PCAP slices, time windows, evidence hashes, attention maps, and statistical metrics (T-statistic, AE-error, energy-ratio), which makes it possible to generate incident reports for subsequent transfer to law enforcement agencies, in compliance with the chain-of-custody.
The computational complexity analysis revealed the main bottlenecks, which are attention matrices and feature buffering, which require further optimisation (e.g., subquadratic attention mechanisms, down-sampling, and knowledge distillation) for use in resource-limited environments (edge environments and operational monitoring systems).
The developed methods’ practical applicability is confirmed by the modelling and analysis results of real data, which demonstrate their effectiveness in detecting low-intensity DDoS attacks that were previously barely noticeable for standard IDS/IPS systems, and it opens up prospects for further research in the direction of adaptive threshold recalibration and adversarial resilience.
Author Contributions
Conceptualization, S.V., O.M. (Oksana Mulesa), V.V. and O.M. (Oleh Mieshkov); methodology, S.V., O.M. (Oksana Mulesa), P.H., N.P. and O.K. (Oleksandra Kolobylina); software, S.V., O.M. (Oksana Mulesa), V.V. and O.I.; validation, P.H., N.P., O.K. (Oleksandra Kolobylina), O.M. (Oleh Mieshkov), O.I. and O.K. (Oleh Koropatov); formal analysis, S.V., O.M. (Oksana Mulesa), V.V., N.P., O.M. (Oleh Mieshkov) and O.I.; investigation, P.H., N.P., O.K. (Oleksandra Kolobylina), O.M. (Oleh Mieshkov), O.I. and O.K. (Oleh Koropatov); resources, P.H., N.P., O.K. (Oleksandra Kolobylina), O.M. (Oleh Mieshkov), O.I. and O.K. (Oleh Koropatov); data curation, S.V., O.M. (Oksana Mulesa), V.V. and P.H.; writing—original draft preparation, S.V., O.M. (Oksana Mulesa) and V.V.; writing—review and editing, P.H., N.P., O.K. (Oleksandra Kolobylina), O.M. (Oleh Mieshkov), O.I. and O.K. (Oleh Koropatov); visualisation, V.V., P.H., N.P., O.K. (Oleksandra Kolobylina), O.M. (Oleh Mieshkov), O.I. and O.K. (Oleksandra Kolobylina); supervision, P.H., N.P., O.K. (Oleksandra Kolobylina), O.M. (Oleh Mieshkov), O.I. and O.K. (Oleh Koropatov); project administration, S.V., O.M. (Oksana Mulesa) and V.V.; funding acquisition, O.M. (Oksana Mulesa). All authors have read and agreed to the published version of the manuscript.
Funding
This research received no external funding.
Institutional Review Board Statement
Not applicable.
Informed Consent Statement
Not applicable.
Data Availability Statement
Data are contained within the article.
Acknowledgments
The research was carried out with the grant support of the Ministry of Education and Science of Ukraine, “Methods and tools for detecting disinformation in social networks based on deep learning technologies” under Project No. 0125U001852. During the preparation of this manuscript/study, the authors used ChatGPT 4o Available, Gemini 2.5 flash, and Grammarly to correct and improve the text quality, and also to eliminate grammatical errors. The authors have reviewed and edited the output and take full responsibility for the content of this publication.
Conflicts of Interest
The authors declare no conflicts of interest.
Abbreviations
| DDoS | Distributed Denial of Service |
| IDS/IPS | Intrusion Detection System/Intrusion Prevention System |
| TCP | Transmission Control Protocol |
| WAF | Web Application Firewall |
| LDDM | Local Discriminative Distance Metrics |
| HTTP | HyperText Transfer Protocol |
| SVM | Support Vector Machine |
| KNN | k-Nearest Neighbours |
| CNN | Convolutional Neural Network |
| RNN | Recurrent Neural Network |
| LSTM | Long Short-Term Memory |
| IPFIX | Internet Protocol Flow Information Export |
| RF | Random Forest |
| SDN | Software-Defined Networking |
| MAD | Median Absolute Deviation |
| EWMA | Exponentially Weighted Moving Average |
| ReLU | Rectified Linear Unit |
| AE | Autoencoder |
| TPR | True Positive Rate |
| FPR | False Positive Rate |
| STFT | Short-Time Fourier Transform |
| PCAP | Packet Capture |
| MSE | Mean Squared Error |
| FFN | Feed-Forward Network |
| FLOPs | Floating-Point Operations Per Second |
| RAM | Random-Access Memory |
| ANOVA | Analysis of Variance |
| AUC | Area Under the Curve |
| ROC | Receiver Operating Characteristic |
| KS-test | Kolmogorov–Smirnov test |
| SLA | Service Level Agreement |
| IAT | Inter-Arrival Time |
| ECE | Expected Calibration Error |
Appendix A
Theorem A1.
Let L2([0, T]) and let VA = span{ϕk: k ∈ KA} and VB be the orthogonal complement (including baseline subspace, etc.). If VA ∩ VB = {0}, then the projection PA · x is unique and the energy gives a unique representation of the attacking energy in VA, and for any decomposition x = vA + vB with vA ∈ VA, vB ∈ VB, we obtain vA = PA · x.
The text continues here. Proofs must be formatted as follows:
Proof of Theorem A1.
We take H: = L2([0, T]) with the usual scalar product and the norm , and also VA = span{φk: k ∈ KA} ⊂ H, and VB is its orthogonal complement (baseline–subspace), and the condition VA ∩ VB = {0} is given. Consider an arbitrary x ∈ H.
To determine the existence and characterisation of an orthoprojection, since VA is a finitely generated (or, more generally, closed) subspace of H, for any x ∈ H, there exists an element, v* ∈ VA, that minimises the distance to x:
We define the operator PA: H → VA as PA · x: = v*. The standard variational argument gives the residuals’ orthogonality, since for any u ∈ VA, the function has a minimum at t = 0, whence ; therefore,
that is, x—PA · x ⊥ VA, which is a characteristic property of the orthoprojector.
To determine the projections’ uniqueness, we assume that there is another decomposition, x = vA + vB with vA ∈ VA, vB ∈ VB. Since PA · x ∈ vA and x—PA · x ⊥ VA, the dot product . But x—PA · x = (vA + vB)—PAx = (vA—PA · x) + vB. Taking the dot product with an arbitrary u ∈ VA and using vB ⊥ VA, we obtain u = vA—PA · x:
hence vA = PA · x. It proves that for any decomposition, x = vA + vB with vA ∈ VA, vB ∈ VB, vA = PA · x. In particular, if there were two decompositions, , then, subtracting, we obtain . By assumption, VA ∩ VB = {0}, hence and . Thus, this representation is unique.
The identification of the attacking energy as projection energy and the Pythagorean principle is based on the fact that the x—PA · x ⊥ PA · x orthogonality implies the Pythagorean equality:
Therefore, the signal energy concentrated in the subspace VA (interpreted as “attacking energy in VA”) is uniquely equal to . Any other attempt to “transfer” part of this energy to components from VB would violate orthogonality or change the norm, which is excluded. Thus, the function
gives a single (well-defined) value of “energy in VA” for a given x.
To define additional properties of the orthoprojector (for completeness), we assume that the operator PA is linear, idempotent—, and self-adjoint for all x, y ∈ H. Linearity follows from the minimisation of linearity on a linear subspace. For idempotency, note that PA · x ∈ VA, and therefore, the projection PA(PA · x), is equal to PA · x itself. Then, self-adjointness follows from the orthogonal representation, x = PA · x + (x − PA · x), together with the fact that x − PA · x ⊥ VA.
Combining the above, we obtain that under the condition VA ∩ VB = {0}, the projection PA · x is unique and gives a unique representation of the attacking energy in VA, equal to . The theorem is proven. □
Figure A1 shows the vector’s x geometric decomposition into its orthogonal projection PA · x onto the subspace VA and into the orthogonal residue x − PA · x, together with these components’ norms’ (energies) squared numerical values.
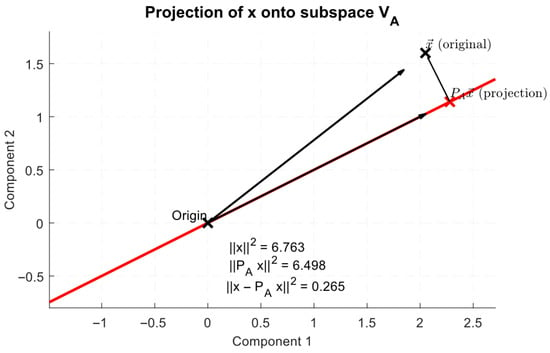
Figure A1.
The projection of x onto the subspace VA diagram.
Figure A1 shows the vectors’ x decomposition into a component along the subspace (VA, PA · x) and the orthogonal residue x—PA · x. The numerical values of the squared norms shown in Figure 4 confirm the Pythagorean equality (A4), which is used in the proof of the theorem to interpret the “energies”. The right angle between the projection vector and the residue visually emphasises the orthogonality, and the projections’ uniqueness is evident from the fact that there is precisely one point that is closest to x on the line VA, which demonstrates why the energy attributed to the attacking component is uniquely equal to .
Theorem A2.
Let x(t) = b(t) + a(t) + n(t) be a stationary ergodic process on [0, T] after removing the baseline, so that . If the empirical energy of the projection onto VA is defined as , where is the basis coefficient calculated on the interval [0, T], then as , the energy estimator (and, accordingly, the normalised intensity) is consistent.
Proof of Theorem A2.
It is assumed that for each basis index k, the basis expansion coefficient on the interval [0, T] is denoted as Xk(t) = Bk(t) + Ak(t) + Nk(t), where Bk(t) is the baseline (after removing the baseline, we will assume that the Bk contribution is negligible or has zero mean), Ak(t) is the attack component, and Nk(t) is the stochastic noise. For the “attacking” set indices, KA, we define the projections’ empirical (temporal) energy onto VA as
It is assumed that the processes Xk(t) (and hence their squares) have a finite mathematical expectation and are stationary-ergodic on [0, T]. Then, according to Birkhoff’s ergodic theorem [56], for each fixed k, the following convergence holds the following:
Since the set KA is finite (or countable under the expectations’ summability condition), we can sum over k and obtain
Let us expand through its components in the following form:
Under the theorems’ conditions (after removing the baseline, either Bk ≡ 0, or 𝔼[Bk] = 0 and Bk is orthogonal—that is, uncorrelated with Ak, Nk—in addition, standard models assume that noise and signal are uncorrelated 𝔼[Ak · Nk] = 0), and all cross terms are either equal to zero, or their contribution is known and taken into account in the “true” projection energy. In particular, under standard assumptions (zero mean baseline, uncorrelated Ak and Nk), we obtain the following:
that is, the limiting value coincides with the actual (mathematical expectation) energy of the attacking component, possibly with an added expected noise level (depending on the “attack energy” definition). If the normalised intensity (energy ratio) is introduced
then, similarly, it is obtained
where is the signals’ empirical (temporal) total energy on the interval [0, T]: that is, the energies’ sum over all monitored basis indices; Kall is all basis indices sets (all observed components) over which the energies are summed, usually Kall = KA ∪ KB, where KA are the “attacking” components indices and KB are the non-attacking (baseline) components indices.
Under the uncorrelatedness and baseline removal assumptions, this yields convergence to the proper ratio of the attack component energies to the total signal energy (or, if the baseline is subtracted from the denominator, to the energy ratio , which is precisely formulated as the asymptotic consistency of the energy ratio estimator. Under typical stationarity and ergodicity conditions and finite second moments, the proof above yields the desired result and —as T → ∞, i.e., the estimator is consistent. The theorem is proven. □
Figure A2 and Figure A3 show the empirical behaviour of the estimates and , as well as the energy ratio estimator convergence to its theoretical value, as the observation window T grows.
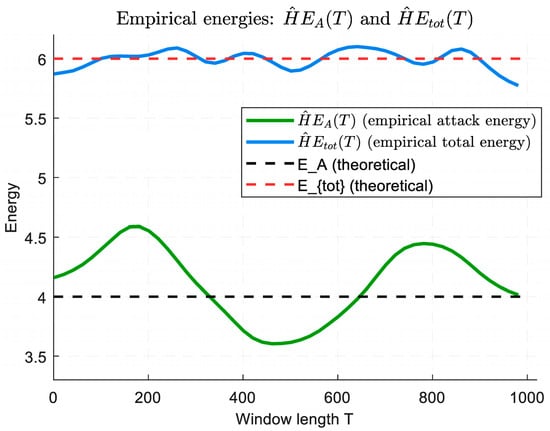
Figure A2.
Diagram of empirical behaviour of estimates and .
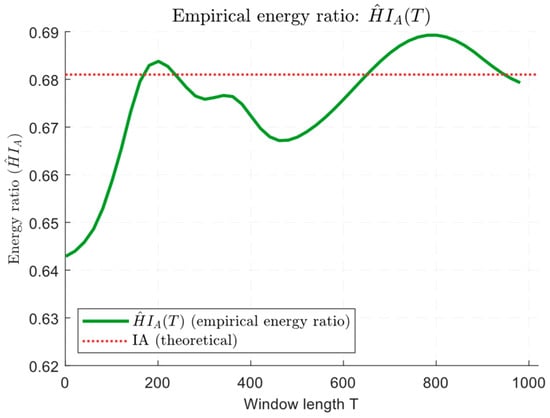
Figure A3.
Convergence diagram of the energy ratio estimator.
Figure A2 shows that both the attack and total energy estimators stabilise near their theoretical values as T increases, illustrating the random fluctuation’s average. Figure A3 demonstrates the convergence of to the theoretical value IA, confirming the estimators’ consistency under the ergodicity and finite moment conditions. The small fluctuations that are visible at small T are explained by sample variance; increasing the window reduces the estimates’ variance and improves the robustness of the attack component detection. Thus, Figure 5 and Figure 6 support the conclusion that and as T → ∞.
Theorem A3.
It is assumed that in the model (after removing the baseline) for k ∈ KA under H0, the coefficients are independent, and under H1 with μk = Ak. Then, the statistic has the distribution under H0, and non-central under H1 with . For a given false alarm rate α and a desired detection power β, a sufficient condition for detectability is λ ≥ λ*(m, α, β), where λ* is defined as the solution—, . In the large-m approximation (CLT), we have approximately , where zp is the standard normal distribution quantile.
Proof of Theorem A3.
Let m = ∣KA∣. For k ∈ KA, after removing the baseline, we obtain for H0 and for H1. Consider the statistic . Since the components are independent, each term for H1 can be represented as follows:
Substitution shows that (central with 1 degree of freedom) and the mixed product terms have zero expectation and are included in the definition of non-zero parameters. Therefore, the independent normalised squares yield a sum (non-central) chi-square distribution:
- For H0 (when Ak = 0 for all k), each term and for H0;
- For H1, the non-zero part of each term is equivalent to a shift in the mean by μk = Ak, and the total non-centrality parameter is
Thus, for H1, where is a non-central chi-square with m degrees of freedom and non-centrality parameter λ. For a given false alarm level α, we choose the threshold ; is the quantile of level 1—α of the central . The detector power for a given λ is
and the non-centrality parameters’ required value is determined by the equation
that is, λ* this equation solution. It gives an exact (but implicit) detectability condition λ ≥ λ*(m, α, β).
For an approximate analytical estimate for large m, it is convenient to use the central limit approximation. It is known that for the central χ-squared quantity:
For non-central , the mathematical expectation and variance are equal
If m is large and λ is not too large compared to m (or for a simplified approximation), we can take . Then, by normal approximation for H1
The threshold tα for large m is approximated as
where zp is the p-quantile of the standard normal distribution. Substituting this into the expression for power and using the normal approximation, we obtain
From here,
and, taking the inverse function Φ−1, we obtain
Rewriting, taking into account the choice of signs (usually we use z1−β = −zβ), and reducing it to a form that is convenient for the required positive threshold, we obtain an equivalent notation, often used in studies; for example [32]:
Therefore, the sufficient condition for detectability is written as follows:
Thus, the theorem is proven. □
Figure A4 and Figure A5 show the T-statistic distribution for H0 and H1 (with non-zero non-centrality λ) (Figure A4) and the detectors’ power Pr(T > tα) dependence on the non-centrality parameter λ (Figure A5), with the threshold tα and the approximate value λ* marked.
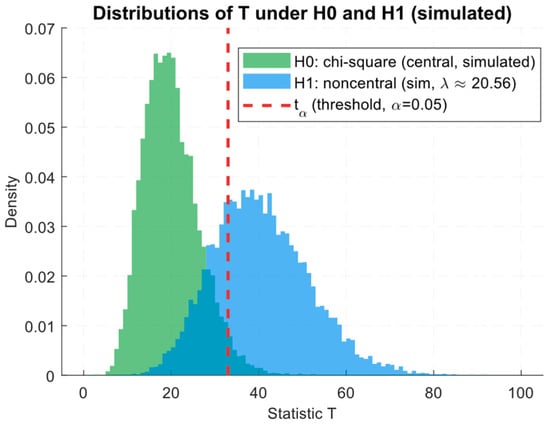
Figure A4.
Diagram of the T-statistic’s distribution for H0 and H1 with non-zero non-centrality λ.
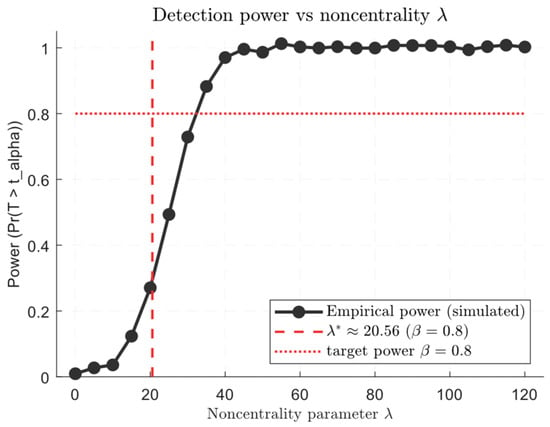
Figure A5.
Diagram of detector power as a function of non-centrality parameter.
Figure 7 shows the estimated distribution densities of the T statistic for H0 (central χ2, green histogram) and for H1 (non-central χ2 with λ ≈ 20.56, blue histogram). The dashed vertical line is the threshold tα for a given false alarm rate α, and the area to this line’s right under the yellow curve shows the false alarm probability, α. In contrast, the area to the right under the blue curve is the detector power for a given λ. Thus, Figure A4 shows a clear shift in the distribution mass to the right for H1, which increases the probability of exceeding the threshold, tα, and, accordingly, of attack detection. Figure A5 demonstrates how the detector power rapidly increases with the signal’s relative energies sum, , and crosses the target power level β at some λ* (in Figure A5, the approximate value, λ* ≈ 20.56, is marked for m = 20, α = 0.05, and β = 0.8). These diagrams confirm Theorem A3′s conclusion that to ensure a given detection probability, λ must exceed a certain threshold, and (10) gives this threshold magnitude order.
Commentary on Theorem A3. Expression (A24) gives a specific minimum total attack energy (in SNR units) on the selected KA scales required for detection with the given α and β. For low-and-slow scenarios, m is small and λ must accumulate over time; therefore, integration (energy accumulation) methods increase λ. If the noise n(t) has a white noise model with intensity , and a(t) = α · u(t) is a deterministic form, then the observation satisfies the signal-to-noise ratio (SNR):
where Wt is a Wiener process, the linear filter h(t) (matched filter) gives the output:
The h ∝ u (matched filter) choice maximises the signal-to-noise ratio (SNR), resulting in an optimal detector for Gaussian noise. It is a traditional result, and is also applicable to low-rate signals if the u-shape is known or estimated.
Thus, in practical implementation, the combination of the projective (energy), statistical (χ2-test), and dynamic (queue model) components implies the following:
- The IW and IQ(T) calculation;
- A test statistic T and p-value calculation;
- If T > tα and exceeds the empirical threshold, an alarm is generated and is issued, with an interpretation consisting of listing the most contributing k and comparing them with flows/IPs;
- For operational work, use exponentially weighted estimates to dampen short-term bursts and accumulate low-and-slow signals:
- According to Theorem A2, asymptotic confidence intervals for are constructed using the delta method: that is, if , then the confidence interval for I is constructed as ;
- The attention map is constructed as normalised contributions of the coefficients:and elements with the largest wk are associated with time windows via the inverse transformation ϕk ↦ “time support”. For flow-level attribution, a joint decomposition over spatial indices (IP × time) is used: that is, a basis of the form ϕk,i(t) and the corresponding coefficients Xk,i, which provide a direct link to the signals’ sources under study.
Thus, it is mathematically justified that the observed signals’ x(t) = b(t) + a(t) + n(t) decomposition into an orthonormal multi-scale basis and projection onto the selected subspace VA yields a unique and optimal attacking component PA · x estimate with energy , in the L2 sense. In this case, the normalised intensity metric and the statistic —are formally related to the detection criteria through the χ2 (or non-central χ2) distributions, which yields a quantitative detectability condition . For the continuous-stochastic SDE model with white noise, the matched-filter h ∝ u (maximising SNR) is optimal, and the asymptotic consistency of the energy estimator follows from the ergodic theorem as T → ∞. In practice, this means that low-and-slow attack detection should be based on multi-scale projection and energy accumulation over time, while (EWMA [57]), an energy criterion with a calibrated rate and , and the χ2-test combination provide a manageable balance between sensitivity and FPR. It is also noted that attention weights are the produce interpretable forensic artefacts (time or flow attribution), and stability is achieved through robust variance estimation (MAD or EWMA), data augmentation, and adversarial training.
References
- Alashhab, A.A.; Zahid, M.S.M.; Azim, M.A.; Daha, M.Y.; Isyaku, B.; Ali, S. A Survey of Low Rate DDoS Detection Techniques Based on Machine Learning in Software-Defined Networks. Symmetry 2022, 14, 1563. [Google Scholar] [CrossRef]
- Adedeji, K.B.; Abu-Mahfouz, A.M.; Kurien, A.M. DDoS Attack and Detection Methods in Internet-Enabled Networks: Concept, Research Perspectives, and Challenges. J. Sens. Actuator Netw. 2023, 12, 51. [Google Scholar] [CrossRef]
- Dimolianis, M.; Pavlidis, A.; Maglaris, V. Signature-Based Traffic Classification and Mitigation for DDoS Attacks Using Programmable Network Data Planes. IEEE Access 2021, 9, 113061–113076. [Google Scholar] [CrossRef]
- Lohachab, A.; Karambir, B. Critical Analysis of DDoS—An Emerging Security Threat over IoT Networks. J. Commun. Inf. Netw. 2018, 3, 57–78. [Google Scholar] [CrossRef]
- Sayed, M.S.E.; Le-Khac, N.-A.; Azer, M.A.; Jurcut, A.D. A Flow-Based Anomaly Detection Approach With Feature Selection Method Against DDoS Attacks in SDNs. IEEE Trans. Cogn. Commun. Netw. 2022, 8, 1862–1880. [Google Scholar] [CrossRef]
- Haseeb-ur-rehman, R.M.A.; Aman, A.H.M.; Hasan, M.K.; Ariffin, K.A.Z.; Namoun, A.; Tufail, A.; Kim, K.-H. High-Speed Network DDoS Attack Detection: A Survey. Sensors 2023, 23, 6850. [Google Scholar] [CrossRef] [PubMed]
- Avcı, İ.; Koca, M. Predicting DDoS Attacks Using Machine Learning Algorithms in Building Management Systems. Electronics 2023, 12, 4142. [Google Scholar] [CrossRef]
- Ye, J.; Wang, Z.; Yang, J.; Wang, C.; Zhang, C. An LDDoS Attack Detection Method Based on Behavioral Characteristics and Stacking Mechanism. IoT 2025, 6, 7. [Google Scholar] [CrossRef]
- Ali, M.N.; Imran, M.; din, M.S.U.; Kim, B.-S. Low Rate DDoS Detection Using Weighted Federated Learning in SDN Control Plane in IoT Network. Appl. Sci. 2023, 13, 1431. [Google Scholar] [CrossRef]
- Meng, F.; Yan, X.; Zhang, Y.; Yang, J.; Cao, A.; Liu, R.; Zhao, Y. Mitigating DDoS Attacks in LEO Satellite Networks Through Bottleneck Minimize Routing. Electronics 2025, 14, 2376. [Google Scholar] [CrossRef]
- Badotra, S.; Tanwar, S.; Bharany, S.; Rehman, A.U.; Eldin, E.T.; Ghamry, N.A.; Shafiq, M. A DDoS Vulnerability Analysis System against Distributed SDN Controllers in a Cloud Computing Environment. Electronics 2022, 11, 3120. [Google Scholar] [CrossRef]
- Zaman, A.; Khan, S.A.; Mohammad, N.; Ateya, A.A.; Ahmad, S.; ElAffendi, M.A. Distributed Denial of Service Attack Detection in Software-Defined Networks Using Decision Tree Algorithms. Future Internet 2025, 17, 136. [Google Scholar] [CrossRef]
- Hernandez, D.V.; Lai, Y.-K.; Ignatius, H.T.N. Real-Time DDoS Detection in High-Speed Networks: A Deep Learning Approach with Multivariate Time Series. Electronics 2025, 14, 2673. [Google Scholar] [CrossRef]
- Li, M.; Zheng, L.; Ma, X.; Li, S. Real-Time Monitoring Model of DDoS Attacks Using Distance Thresholds in Edge Cooperation Networks. J. Inf. Secur. Appl. 2025, 89, 103972. [Google Scholar] [CrossRef]
- Liu, Y.; Han, Y.; Chen, H.; Zhao, B.; Wang, X.; Liu, X. IGED: Towards Intelligent DDoS Detection Model Using Improved Generalized Entropy and DNN. Comput. Mater. Contin. 2024, 80, 1851–1866. [Google Scholar] [CrossRef]
- Pandey, N.; Mishra, P.K. Conditional Entropy-Based Hybrid DDoS Detection Model for IoT Networks. Comput. Secur. 2025, 150, 104199. [Google Scholar] [CrossRef]
- Pandey, N.; Mishra, P.K. Performance Analysis of Entropy Variation-Based Detection of DDoS Attacks in IoT. Internet Things 2023, 23, 100812. [Google Scholar] [CrossRef]
- Xu, K.; Li, Z.; Liang, N.; Kong, F.; Lei, S.; Wang, S.; Paul, A.; Wu, Z. Research on Multi-Layer Defense against DDoS Attacks in Intelligent Distribution Networks. Electronics 2024, 13, 3583. [Google Scholar] [CrossRef]
- Mutar, M.H.; El Fawal, A.H.; Nasser, A.; Mansour, A. Predicting the Impact of Distributed Denial of Service (DDoS) Attacks in Long-Term Evolution for Machine (LTE-M) Networks Using a Continuous-Time Markov Chain (CTMC) Model. Electronics 2024, 13, 4145. [Google Scholar] [CrossRef]
- Hajtmanek, R.; Kontšek, M.; Smieško, J.; Uramová, J. One-Parameter Statistical Methods to Recognize DDoS Attacks. Symmetry 2022, 14, 2388. [Google Scholar] [CrossRef]
- Jing, X.; Yan, Z.; Jiang, X.; Pedrycz, W. Network Traffic Fusion and Analysis against DDoS Flooding Attacks with a Novel Reversible Sketch. Inf. Fusion 2019, 51, 100–113. [Google Scholar] [CrossRef]
- Han, H.; Yan, Z.; Jing, X.; Pedrycz, W. Applications of Sketches in Network Traffic Measurement: A Survey. Inf. Fusion 2022, 82, 58–85. [Google Scholar] [CrossRef]
- Liu, X.; Ren, J.; He, H.; Wang, Q.; Song, C. Low-Rate DDoS Attacks Detection Method Using Data Compression and Behavior Divergence Measurement. Comput. Secur. 2021, 100, 102107. [Google Scholar] [CrossRef]
- Salopek, D.; Mikuc, M. Enhancing Mitigation of Volumetric DDoS Attacks: A Hybrid FPGA/Software Filtering Datapath. Sensors 2023, 23, 7636. [Google Scholar] [CrossRef]
- Chovanec, M.; Hasin, M.; Havrilla, M.; Chovancová, E. Detection of HTTP DDoS Attacks Using NFStream and TensorFlow. Appl. Sci. 2023, 13, 6671. [Google Scholar] [CrossRef]
- Tariq, U. Optimized Feature Selection for DDoS Attack Recognition and Mitigation in SD-VANETs. World Electr. Veh. J. 2024, 15, 395. [Google Scholar] [CrossRef]
- Yang, B.; Arshad, M.H.; Zhao, Q. Packet-Level and Flow-Level Network Intrusion Detection Based on Reinforcement Learning and Adversarial Training. Algorithms 2022, 15, 453. [Google Scholar] [CrossRef]
- Chen, S.-R.; Chen, S.-J.; Hsieh, W.-B. Enhancing Machine Learning-Based DDoS Detection Through Hyperparameter Optimization. Electronics 2025, 14, 3319. [Google Scholar] [CrossRef]
- Shieh, C.-S.; Nguyen, T.-T.; Chen, C.-Y.; Horng, M.-F. Detection of Unknown DDoS Attack Using Reconstruct Error and One-Class SVM Featuring Stochastic Gradient Descent. Mathematics 2022, 11, 108. [Google Scholar] [CrossRef]
- Ma, R.; Wang, Q.; Bu, X.; Chen, X. Real-Time Detection of DDoS Attacks Based on Random Forest in SDN. Appl. Sci. 2023, 13, 7872. [Google Scholar] [CrossRef]
- Rizvi, F.; Sharma, R.; Sharma, N.; Rakhra, M.; Aledaily, A.N.; Viriyasitavat, W.; Yadav, K.; Dhiman, G.; Kaur, A. An Evolutionary KNN Model for DDoS Assault Detection Using Genetic Algorithm Based Optimization. Multimed. Tools Appl. 2024, 83, 83005–83028. [Google Scholar] [CrossRef]
- Shieh, C.-S.; Nguyen, T.-T.; Horng, M.-F. Detection of Unknown DDoS Attack Using Convolutional Neural Networks Featuring Geometrical Metric. Mathematics 2023, 11, 2145. [Google Scholar] [CrossRef]
- Setitra, M.A.; Fan, M.; Agbley, B.L.Y.; Bensalem, Z.E.A. Optimized MLP-CNN Model to Enhance Detecting DDoS Attacks in SDN Environment. Network 2023, 3, 538–562. [Google Scholar] [CrossRef]
- Yousuf, O.; Mir, R.N. DDoS Attack Detection in Internet of Things Using Recurrent Neural Network. Comput. Electr. Eng. 2022, 101, 108034. [Google Scholar] [CrossRef]
- Polat, H.; Türkoğlu, M.; Polat, O.; Şengür, A. A Novel Approach for Accurate Detection of the DDoS Attacks in SDN-Based SCADA Systems Based on Deep Recurrent Neural Networks. Expert Syst. Appl. 2022, 197, 116748. [Google Scholar] [CrossRef]
- Li, X.; Li, R.; Liu, Y. HP-LSTM: Hawkes Process–LSTM-Based Detection of DDoS Attack for In-Vehicle Network. Future Internet 2024, 16, 185. [Google Scholar] [CrossRef]
- Vladov, S.; Vysotska, V.; Sokurenko, V.; Muzychuk, O.; Nazarkevych, M.; Lytvyn, V. Neural Network System for Predicting Anomalous Data in Applied Sensor Systems. Appl. Syst. Innov. 2024, 7, 88. [Google Scholar] [CrossRef]
- Wang, H.; Li, W. DDosTC: A Transformer-Based Network Attack Detection Hybrid Mechanism in SDN. Sensors 2021, 21, 5047. [Google Scholar] [CrossRef] [PubMed]
- Junior, E.P.F.; de Neira, A.B.; Borges, L.F.; Nogueira, M. Transformers Model for DDoS Attack Detection: A Survey. Comput. Netw. 2025, 270, 111433. [Google Scholar] [CrossRef]
- Mousa, A.K.; Abdullah, M.N. An Improved Deep Learning Model for DDoS Detection Based on Hybrid Stacked Autoencoder and Checkpoint Network. Future Internet 2023, 15, 278. [Google Scholar] [CrossRef]
- Ma, J.; Su, W. Collaborative DDoS Defense for SDN-Based AIoT with Autoencoder-Enhanced Federated Learning. Inf. Fusion 2025, 117, 102820. [Google Scholar] [CrossRef]
- Paolini, D.; Dini, P.; Soldaini, E.; Saponara, S. One-Class Anomaly Detection for Industrial Applications: A Comparative Survey and Experimental Study. Computers 2025, 14, 281. [Google Scholar] [CrossRef]
- Reed, A.; Dooley, L.; Mostefaoui, S.K. The Guardian Node Slow DoS Detection Model for Real-Time Application in IoT Networks. Sensors 2024, 24, 5581. [Google Scholar] [CrossRef]
- Sikora, M.; Fujdiak, R.; Kuchar, K.; Holasova, E.; Misurec, J. Generator of Slow Denial-of-Service Cyber Attacks. Sensors 2021, 21, 5473. [Google Scholar] [CrossRef]
- Muraleedharan, N.; Janet, B. A Deep Learning Based HTTP Slow DoS Classification Approach Using Flow Data. ICT Express 2021, 7, 210–214. [Google Scholar] [CrossRef]
- Ahmed, S.; Khan, Z.A.; Mohsin, S.M.; Latif, S.; Aslam, S.; Mujlid, H.; Adil, M.; Najam, Z. Effective and Efficient DDoS Attack Detection Using Deep Learning Algorithm, Multi-Layer Perceptron. Future Internet 2023, 15, 76. [Google Scholar] [CrossRef]
- Mansoor, A.; Anbar, M.; Bahashwan, A.; Alabsi, B.; Rihan, S. Deep Learning-Based Approach for Detecting DDoS Attack on Software-Defined Networking Controller. Systems 2023, 11, 296. [Google Scholar] [CrossRef]
- Aslam, N.; Srivastava, S.; Gore, M.M. DDoS SourceTracer: An Intelligent Application for DDoS Attack Mitigation in SDN. Comput. Electr. Eng. 2024, 117, 109282. [Google Scholar] [CrossRef]
- Alshdadi, A.A.; Almazroi, A.A.; Ayub, N.; Lytras, M.D.; Alsolami, E.; Alsubaei, F.S.; Alharbey, R. Federated Deep Learning for Scalable and Privacy-Preserving Distributed Denial-of-Service Attack Detection in Internet of Things Networks. Future Internet 2025, 17, 88. [Google Scholar] [CrossRef]
- Orosz, P.; Nagy, B.; Varga, P. Real-Time Detection and Mitigation Strategies Newly Appearing for DDoS Profiles. Future Internet 2025, 17, 400. [Google Scholar] [CrossRef]
- Ain, N.U.; Sardaraz, M.; Tahir, M.; Abo Elsoud, M.W.; Alourani, A. Securing IoT Networks Against DDoS Attacks: A Hybrid Deep Learning Approach. Sensors 2025, 25, 1346. [Google Scholar] [CrossRef]
- Wahab, S.A.; Sultana, S.; Tariq, N.; Mujahid, M.; Khan, J.A.; Mylonas, A. A Multi-Class Intrusion Detection System for DDoS Attacks in IoT Networks Using Deep Learning and Transformers. Sensors 2025, 25, 4845. [Google Scholar] [CrossRef]
- Alghazzawi, D.; Bamasag, O.; Ullah, H.; Asghar, M.Z. Efficient Detection of DDoS Attacks Using a Hybrid Deep Learning Model with Improved Feature Selection. Appl. Sci. 2021, 11, 11634. [Google Scholar] [CrossRef]
- Khedr, W.I.; Gouda, A.E.; Mohamed, E.R. P4-HLDMC: A Novel Framework for DDoS and ARP Attack Detection and Mitigation in SD-IoT Networks Using Machine Learning, Stateful P4, and Distributed Multi-Controller Architecture. Mathematics 2023, 11, 3552. [Google Scholar] [CrossRef]
- Smiesko, J.; Segec, P.; Kontsek, M. Machine Recognition of DDoS Attacks Using Statistical Parameters. Mathematics 2023, 12, 142. [Google Scholar] [CrossRef]
- Berti, P.; Pratelli, L.; Rigo, P. A Central Limit Theorem for Predictive Distributions. Mathematics 2021, 9, 3211. [Google Scholar] [CrossRef]
- Polat, H.; Polat, O.; Cetin, A. Detecting DDoS Attacks in Software-Defined Networks Through Feature Selection Methods and Machine Learning Models. Sustainability 2020, 12, 1035. [Google Scholar] [CrossRef]
- Nikolić, M.; Nikolić, D.; Stefanović, M.; Koprivica, S.; Stefanović, D. Mitigating Algorithmic Bias Through Probability Calibration: A Case Study on Lead Generation Data. Mathematics 2025, 13, 2183. [Google Scholar] [CrossRef]
- Li, M.; Zhou, H.; Qin, Y. Two-Stage Intelligent Model for Detecting Malicious DDoS Behavior. Sensors 2022, 22, 2532. [Google Scholar] [CrossRef] [PubMed]
- Hu, G.; Sun, M.; Zhang, C. A High-Accuracy Advanced Persistent Threat Detection Model: Integrating Convolutional Neural Networks with Kepler-Optimized Bidirectional Gated Recurrent Units. Electronics 2025, 14, 1772. [Google Scholar] [CrossRef]
- Vladov, S.; Scislo, L.; Sokurenko, V.; Muzychuk, O.; Vysotska, V.; Osadchy, S.; Sachenko, A. Neural Network Signal Integration from Thermogas-Dynamic Parameter Sensors for Helicopters Turboshaft Engines at Flight Operation Conditions. Sensors 2024, 24, 4246. [Google Scholar] [CrossRef]
- Vladov, S.; Sachenko, A.; Sokurenko, V.; Muzychuk, O.; Vysotska, V. Helicopters Turboshaft Engines Neural Network Modeling under Sensor Failure. J. Sens. Actuator Netw. 2024, 13, 66. [Google Scholar] [CrossRef]
- Vladov, S.; Shmelov, Y.; Yakovliev, R. Method for Forecasting of Helicopters Aircraft Engines Technical State in Flight Modes Using Neural Networks. CEUR Workshop Proc. 2022, 3171, 974–985. Available online: https://ceur-ws.org/Vol-3171/paper70.pdf (accessed on 18 August 2025).
- Yan, H.; Li, J.; Du, L.; Fang, B.; Jia, Y.; Gu, Z. Adversarial Hierarchical-Aware Edge Attention Learning Method for Network Intrusion Detection. Appl. Sci. 2025, 15, 7915. [Google Scholar] [CrossRef]
- Radivilova, T.; Kirichenko, L.; Alghawli, A.S.; Ageyev, D.; Mulesa, O.; Baranovskyi, O.; Ilkov, A.; Kulbachnyi, V.; Bondarenko, O. Statistical and Signature Analysis Methods of Intrusion Detection. In Lecture Notes on Data Engineering and Communications Technologies; Springer: Cham, Switzerland, 2022; Volume 115, pp. 115–131. [Google Scholar] [CrossRef]
- Mulesa, O.; Povkhan, I.; Radivilova, T.; Baranovskyi, O. Devising a Method for Constructing the Optimal Model of Time Series Forecasting Based on the Principles of Competition. East.-Eur. J. Enterp. 2021, 5, 113. [Google Scholar] [CrossRef]
- Vladov, S.; Shmelov, Y.; Yakovliev, R. Optimization of Helicopters Aircraft Engine Working Process Using Neural Networks Technologies. CEUR Workshop Proc. 2022, 3171, 1639–1656. Available online: https://ceur-ws.org/Vol-3171/paper117.pdf (accessed on 18 August 2025).
- Vladov, S.; Shmelov, Y.; Yakovliev, R. Methodology for Control of Helicopters Aircraft Engines Technical State in Flight Modes Using Neural Networks. CEUR Workshop Proc. 2022, 3137, 108–125. [Google Scholar] [CrossRef]
- Estupiñán Cuesta, E.P.; Martínez Quintero, J.C.; Avilés Palma, J.D. DDoS Attacks Detection in SDN Through Network Traffic Feature Selection and Machine Learning Models. Telecom 2025, 6, 69. [Google Scholar] [CrossRef]
- Han, W.; Xue, J.; Wang, Y.; Liu, Z.; Kong, Z. MalInsight: A Systematic Profiling Based Malware Detection Framework. J. Netw. Comput. Appl. 2019, 125, 236–250. [Google Scholar] [CrossRef]
- Lytvyn, V.; Dudyk, D.; Peleshchak, I.; Peleshchak, R.; Pukach, P. Influence of the Number of Neighbours on the Clustering Metric by Oscillatory Chaotic Neural Network with Dipole Synaptic Connections. CEUR Workshop Proc. 2024, 3664, 24–34. Available online: https://ceur-ws.org/Vol-3664/paper3.pdf (accessed on 23 August 2025).
- Vladov, S.; Shmelov, Y.; Yakovliev, R.; Petchenko, M.; Drozdova, S. Neural Network Method for Helicopters Turboshaft Engines Working Process Parameters Identification at Flight Modes. In Proceedings of the 2022 IEEE 4th International Conference on Modern Electrical and Energy System (MEES), Kremenchuk, Ukraine, 20–23 October 2022; pp. 604–609. [Google Scholar] [CrossRef]
- Bodyanskiy, Y.; Shafronenko, A.; Pliss, I. Clusterization of Vector and Matrix Data Arrays Using the Combined Evolutionary Method of Fish Schools. Syst. Res. Inf. Technol. 2022, 4, 79–87. [Google Scholar] [CrossRef]
- Ablamskyi, S.; Tchobo, D.L.R.; Romaniuk, V.; Šimić, G.; Ilchyshyn, N. Assessing the Responsibilities of the International Criminal Court in the Investigation of War Crimes in Ukraine. Novum Jus 2023, 17, 353–374. [Google Scholar] [CrossRef]
- Ablamskyi, S.; Nenia, O.; Drozd, V.; Havryliuk, L. Substantial Violation of Human Rights and Freedoms as a Prerequisite for Inadmissibility of Evidence. Justicia 2021, 26, 47–56. [Google Scholar] [CrossRef]
- Geche, F.; Batyuk, A.; Mulesa, O.; Voloshchuk, V. The Combined Time Series Forecasting Model. In Proceedings of the 2020 IEEE Third International Conference on Data Stream Mining & Processing (DSMP), Lviv, Ukraine, 21–25 August 2020; pp. 272–275. [Google Scholar] [CrossRef]
- Vladov, S.; Chyrun, L.; Muzychuk, E.; Vysotska, V.; Lytvyn, V.; Rekunenko, T.; Basko, A. Intelligent Method for Generating Criminal Community Influence Risk Parameters Using Neural Networks and Regional Economic Analysis. Algorithms 2025, 18, 523. [Google Scholar] [CrossRef]
Disclaimer/Publisher’s Note: The statements, opinions and data contained in all publications are solely those of the individual author(s) and contributor(s) and not of MDPI and/or the editor(s). MDPI and/or the editor(s) disclaim responsibility for any injury to people or property resulting from any ideas, methods, instructions or products referred to in the content. |
© 2025 by the authors. Licensee MDPI, Basel, Switzerland. This article is an open access article distributed under the terms and conditions of the Creative Commons Attribution (CC BY) license (https://creativecommons.org/licenses/by/4.0/).