Article

Permanent Stations for Calibration/Validation of Thermal Sensors over Spain

by
Jose Antonio Sobrino
* and
Dražen Skoković
Global Change Unit, Image Processing Laboratory, University of Valencia, Av. de Blasco Ibáñez, 13, 46010 València, Spain
*
Author to whom correspondence should be addressed.
Submission received: 1 June 2016 / Revised: 22 June 2016 / Accepted: 22 July 2016 / Published: 28 July 2016
(This article belongs to the Special Issue Temperature of the Earth)

Abstract

:
The Global Change Unit (GCU) at the University of Valencia has been involved in several calibration/validation (cal/val) activities carried out in dedicated field campaigns organized by ESA and other organisms. However, permanent stations are required in order to ensure a long-term and continuous calibration of on-orbit sensors. In the framework of the CEOS-Spain project, the GCU has managed the set-up and launch of experimental sites in Spain for the calibration of thermal infrared sensors and the validation of Land Surface Temperature (LST) products derived from those data. Currently, three sites have been identified and equipped: the agricultural area of Barrax (39.05 N, 2.1 W), the marshland area in the National Park of Doñana (36.99 N, 6.44 W), and the semi-arid area of the National Park of Cabo de Gata (36.83 N, 2.25 W). This work presents the performance of the permanent stations installed over the different test areas, as well as the cal/val results obtained for a number of Earth Observation sensors: SEVIRI, MODIS, and TIRS/Landsat-8.

Graphical Abstract

1. Introduction

The Land Product Validation (LPV) subgroup, included in the Working Group on Calibration and Validation (WGCV), focuses on standardizing intercomparison and validation across products from different satellite, algorithms, and agency sources. These products include essential climate and biodiversity variables, such as Leaf Area Index, Soil moisture, or Albedo. Recently, in the year 2015, the land surface temperature (LST)/Emissivity variable, which was excluded in the 2010 implementation plan, was incorporated to LPV subgroup as a new Essential Climate Variable.
LST is a key parameter in the physical processes of surface energy at local and global scales [1,2]. Knowledge of LST provides direct or indirect information in other study fields, such as evapotranspiration [3,4], climate change [5], or urban heat island effects [6]. Through the Radiative Transfer Equation, LST is directly related with Thermal Infrared (TIR) data, which is measured through satellite sensors. TIR data is not only dependent on surface emitted radiation (linked with emissivity and temperature), but also on atmospheric absorption effects. The accuracy of TIR data and the knowledge of emissivity and atmospheric effects is fundamental in the precision of LST retrievals and in the target accuracy requirements for LST [7].
Many TIR sensors on board satellites are currently orbiting Earth. All of them have different characteristics regarding TIR channels or spatial and temporal resolution. Sensors such as the Advanced Very High Resolution Radiometer (AVHRR), MODerate-resolution Imaging Spectroradiometer (MODIS), Visible Infrared Imaging Radiometer Suite (VIIRS), Sea and Land Surface Temperature Radiometer (SLSTR), and the Spinning Enhanced Visible and Infrared Imager (SEVIRI) provide daily (or less) TIR data, but with low spatial resolution (above 1 km). On the other hand, moderate resolution sensors include the Enhanced Thematic Mapper Plus (ETM+), Thermal Infra-Red Sensor (TIRS), and Advanced Spaceborne Thermal Emission Reflection Radiometer (ASTER), and provide spatial resolutions below 100 m and have a temporal resolution of approximately 16 days. LST can be estimated from all of them, using methods that depend on the available TIR number bands in the sensor. Common LST retrievals include Radiative Transfer Equation, Single-Channel algorithm, Split-Window algorithm, and Temperature Emissivity Separation (TES) algorithm [8,9,10], which provides a typical LST accuracy of 1 K to 2 K [11,12,13]. This increase in the amount of TIR data available to users needs an efficient control in order to quantify the accuracy of TIR data, ensure good performance of the LST retrievals, and relay the relevant results to users. Thus, researchers have long been concerned with the need for calibration/validation (cal/val) activities in order to provide accurate global measurements at useful spatial and temporal resolutions.
TIR calibration and the product-derived validation from TIR data requires the availability of suitable test sites with certain conditions (e.g., high homogeneity, knowledge of land cover changes, minimal atmospheric influence [14]) that can provide the most accurate measures for each type of sensor. The Global Change Unit (GCU)—in order to contribute to the LPV project on the cal/val of Earth Observation (EO) sensors—has managed the launch and maintenance of automated fixed stations in three experimental test sites in Spain.

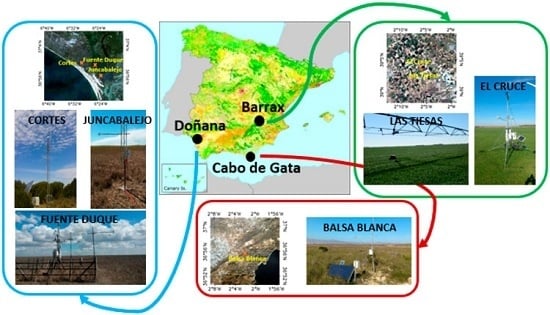
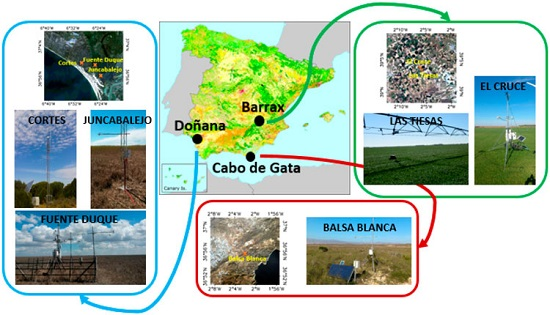
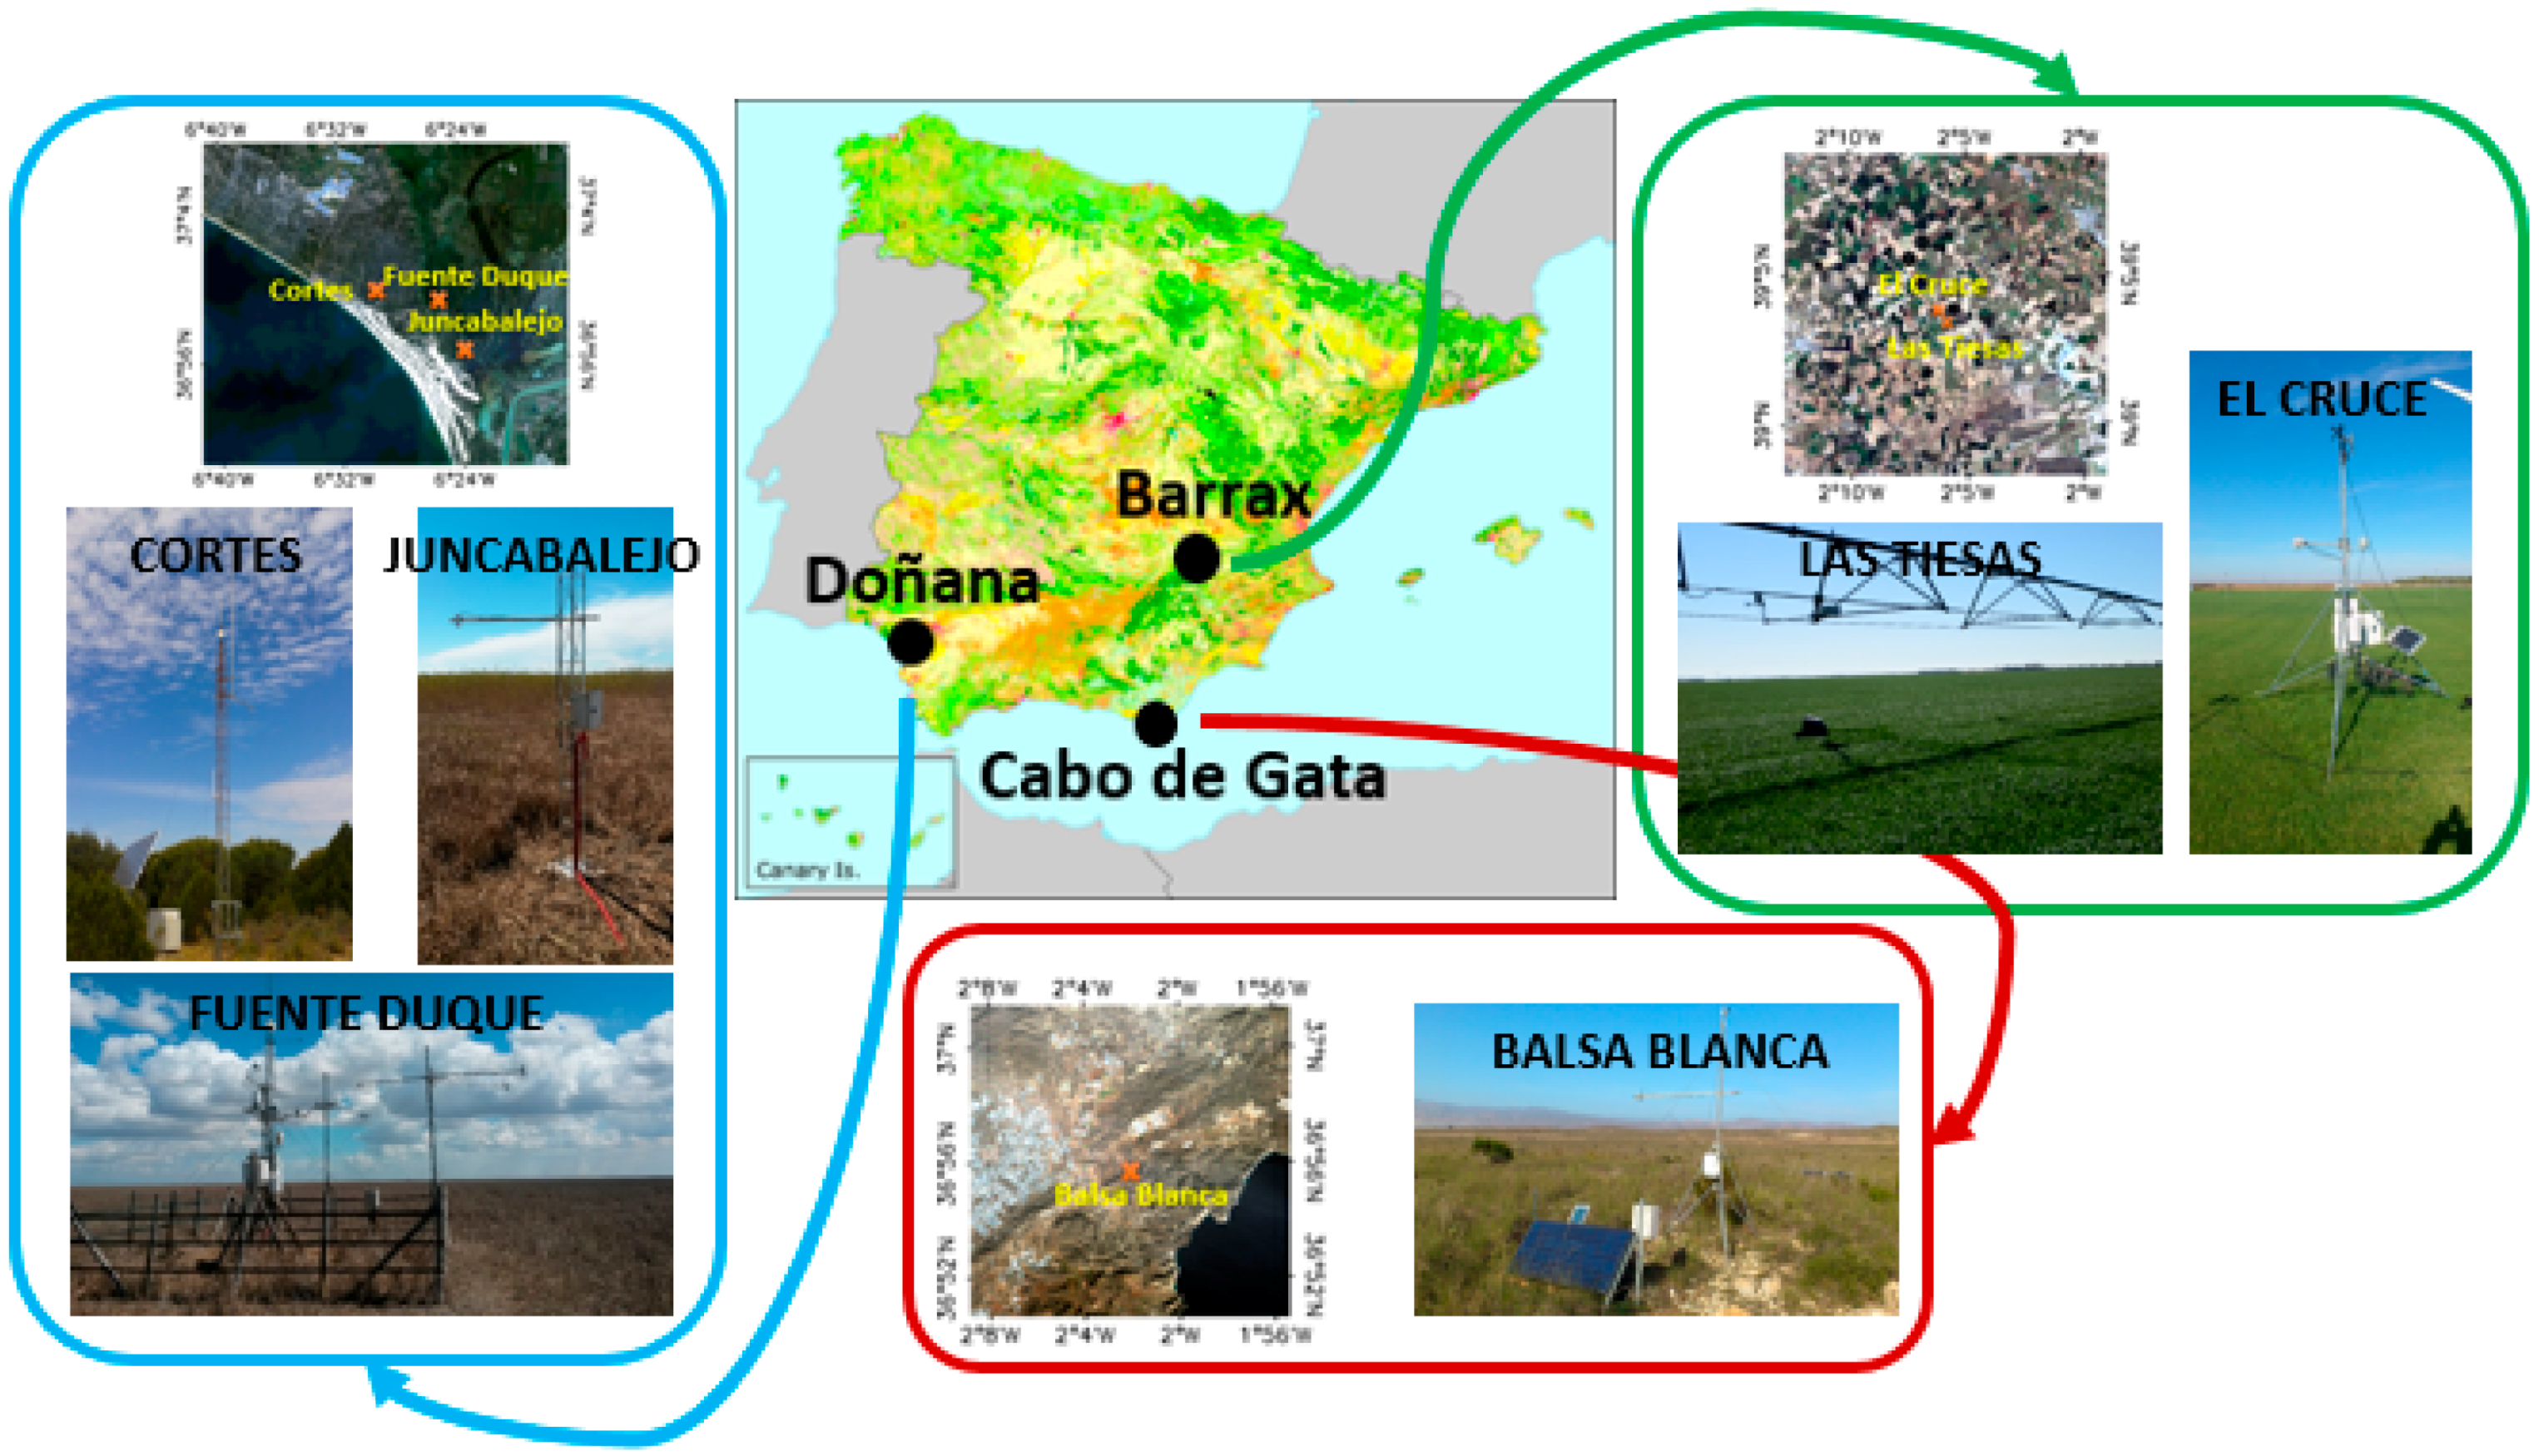
2. Spanish Test Sites

Three different areas in Spain (see Figure 1) were selected for sensor calibration and LST algorithm validation: (i) the agricultural area of Barrax (Albacete; 39° N, 2° W, 700 m a.s.l.); (ii) the Doñana National Park (Huelva; 37° N, 6°25′ W, sea level); and (iii) Cabo de Gata National Park (Almería, 37° N, 2° W, 100 m a.s.l.). Experimental sites have different characteristics in terms of surface covers and sample sizes, which make them useful for the cal/val of a wide range of sensors.

2.1. Barrax

The Barrax area has been selected in many field campaigns for cal/val activities because of its flat terrain and the presence of large, uniform land-use units (approximately 100 ha), suitable for validating moderate resolution satellite image products [15,16]. Most of the area is cultivated and includes dry land (e.g., winter cereals, fallow) and irrigated land (e.g., corn, alfalfa, vegetables). In winter, the major part of the surface is not cultivated, and a huge extension of bare soil (Inceptisols in terms of soil taxonomy) are available for the cal/val of low spatial resolution sensors. Barrax has a Mediterranean-type climate, with heavy rainfall in spring and autumn and lighter rainfall in summer. It presents a continental clime, with sudden changes from cold months to warm months and high thermal oscillations in all seasons between the maximum and minimum daily temperatures. Specifically, two plots were considered for cal/val: Green grass terrain (El Cruce: 39.061° N, 2.099° W) that covers an area of 120 m × 200 m; and a bare soil or wheat area (depending on the season) (Las Tiesas: 39.059° N, 2.099° W) that covers an extension of 1 km × 1 km. In both sites, there is a fixed station with continuous LST measurements that covers an approximate area of 3 m2 in Las Tiesas and 1 m2 in El Cruce.

2.2. Doñana

Doñana National Park is located in the south west of Spain near the Atlantic Ocean coast. The Doñana Biological Reserve is a scientific and technological infrastructure located inside Doñana National Park, and it operates different meteorological stations and scientific instrumentation for the long-term monitoring of different geo-biophysical parameters. Approximately half of its area is marshland, and it also includes areas covered by bushes, pine forest, and sand dunes, in addition to small lagoons. The marshes undergo a yearly cycle of inundation in autumn and drying out during the spring season, and its flood extension varies considerably from year to year, depending on the precipitation. The topography of the marshes is extremely flat, with a maximum elevation difference of 2.5 m. Three plots were considered in Doñana National Park: two marshland areas (Fuente Duque: 36.998° N, 6.434° W; and Juncabalejo: 36.946° N, 6.389° W), with a huge and uniform extension covered with senescent vegetation, bare soil, or water (depending on the season); and a pine forest area (Cortes: 36.996° N, 6.513° W) that covers an extension of 2.5 km × 3 km. In all of them, continuous LST measurements were taken with one or more radiometers, covering a minimal area of 5 m2 in Fuente Duque and Cortes, and 2 m2 in Juncabalejo.

2.3. Cabo de Gata

Cabo de Gata National Park is located in south Spain near the Mediterranean Sea. Of volcanic origin and with an extension of 38,000 ha, the park is characterized by a semi-arid climate with low rainfall (approximately 400 mm year−1). Balsa Blanca field is located 6 km from the coast, with surface cover characterized by perennial vegetation (green in rainfall periods and senescent in summer) and bare soil which covers approximately 40% of the extension of the field [17]. A plot that covers approximately 4 km × 4 km was considered for the launch of the fixed station (Balsa Blanca: 36.939° N, 2.034° W). One radiometer was installed, covering a minimal area of 2 m2.

2.4. Field Meassurements

2.4.1. LST and Radiometer Accuracy
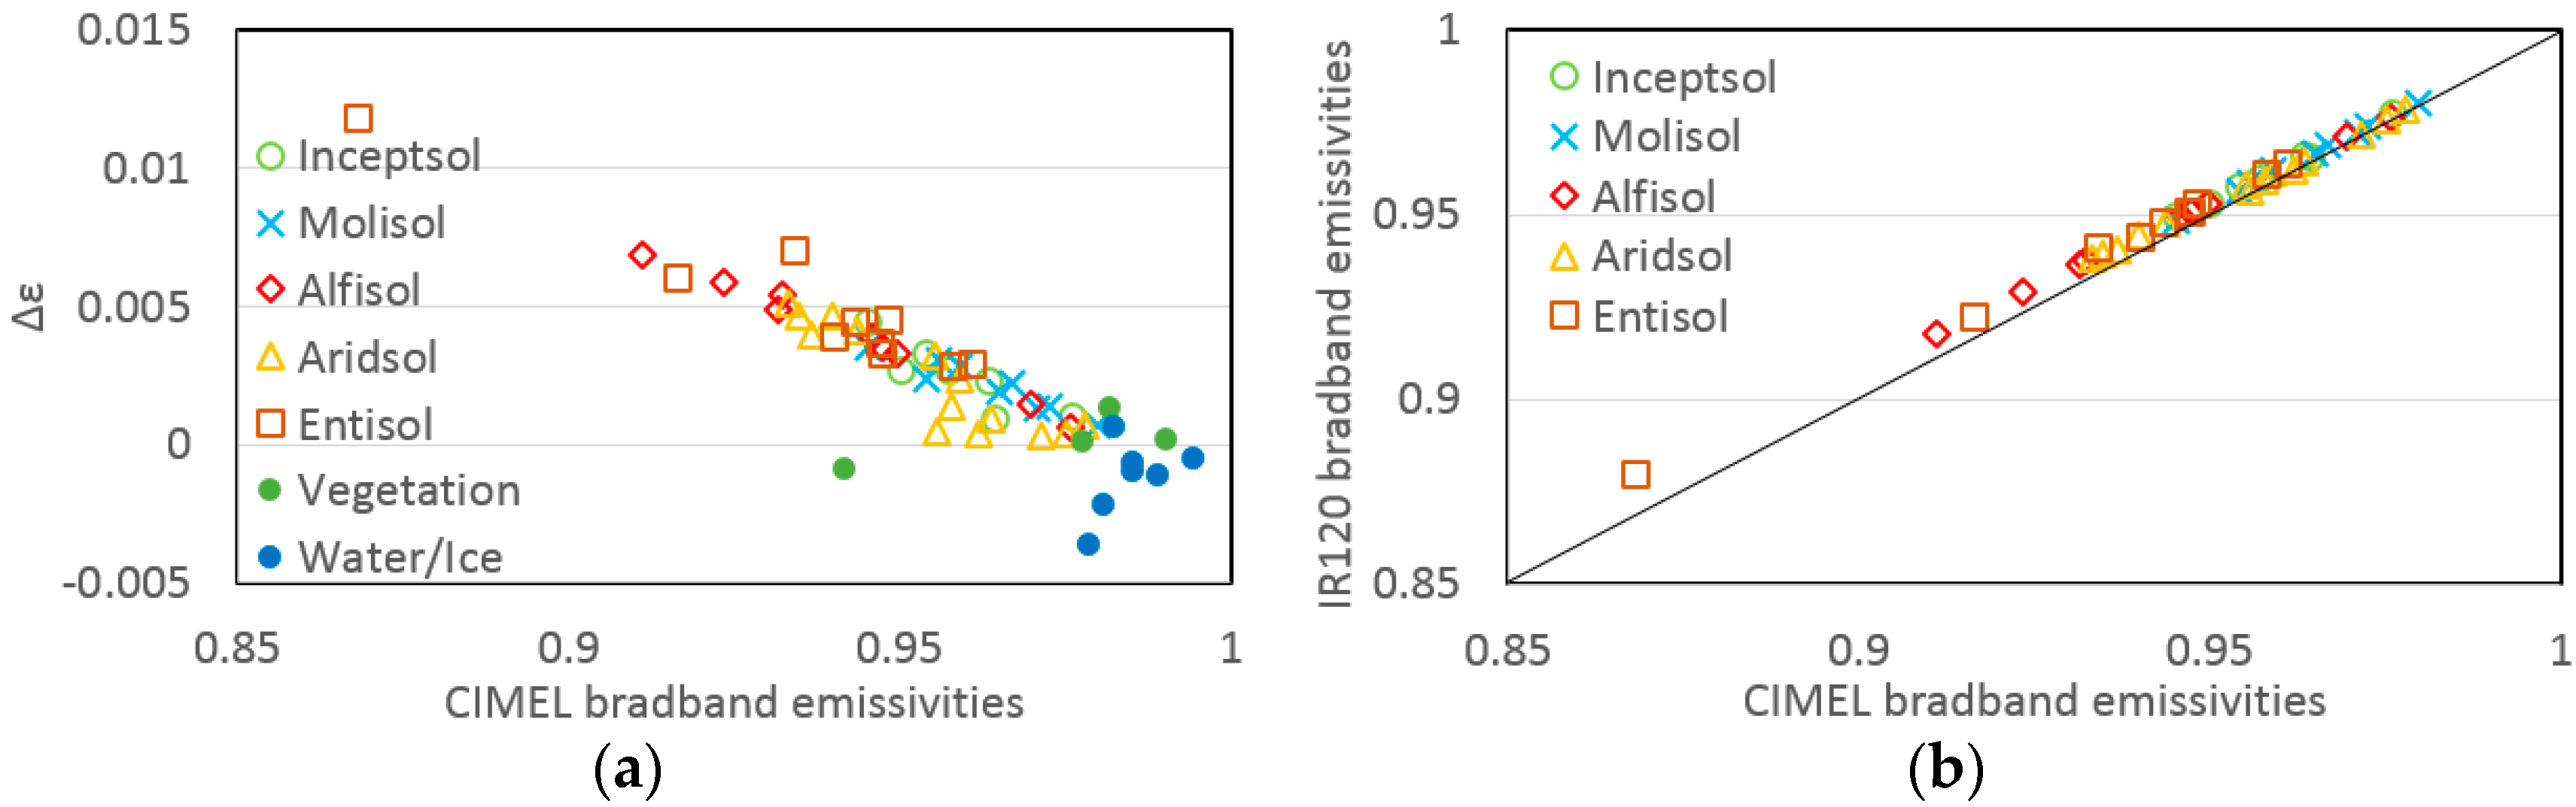
Thermal radiance was measured over the test sites using IR120 (Campbell Scientific) and Apogee broadband radiometers (8–14 µm). Calibration of the radiometers is performed every 6 months in the laboratory, ensuring the precision of the measurements. Due to minimal differences of ±0.2 K observed between two consecutive calibrations, the period of 6 months was considered adequate. The measurements of the radiometers are performed every 10 s, storing mean data every 5 min. In order to obtain the LST from the measurements, thermal radiance was corrected from ground-based measurements of surface emissivity, and also from down-welling irradiance. Finally, applying Planck’s law, the LST can be retrieved as:
T s = c 2 λ ln { c 1 λ 5 [ L s e n ( 1 ε ) L d ϵ ] + 1 }
where λ is the band wavelength (e.g., effective wavelength, averaged from the spectral response function); Lsen and Ld are the measured sensor thermal radiance and the down-welling thermal radiance, respectively, both measured in W·m−2·sr−1·µm−1; ε is the surface emissivity; and c1 and c2 are the Planck’s radiation constants, with values of 1.19104·108 W·µm4·m−2·sr−1 and 14387.7 µm·K, respectively.

2.4.2. Emissivity

Emissivity values are characterized bimonthly in order to enable the observation of yearly changes experimented with in the targets of each fixed station. With the CIMEL CE 312-2 multiband radiometer, spectral emissivities were obtained from the application of the Temperature and Emissivity Separation (TES) method to the thermal radiances [18]. Because CIMEL and the other radiometers present slight broadband spectral differences—and therefore emissivity differences (see Figure 2a)—a comparison between them with the ASTER spectral library database [19] was performed only for soils (see Figure 2b), because there is a greater difference in comparison to vegetation and water. Results show a linear correlation between the broadband emissivities, where more than 85% of the values present absolute differences below 0.005 and mean absolute differences of 0.003. In order to reduce this error that might influence the LST with a mean uncertainty of ±0.3 K (for an Ld value of 2 W·m−2·sr−1·µm−1), it is possible to predict the emissivities with the fit of Figure 2b. Testing the new emissivities obtained with the fit (with gain and offset obtained with only the two extreme data points), the uncertainty was reduced to near zero (see Table 1, in brackets values), and hence, fit values were used in the prediction of apogee and IR120 soil emissivities. The apogee and IR120 radiometers present minimal broadband differences, so only the IR120 comparison in Figure 2 is shown.

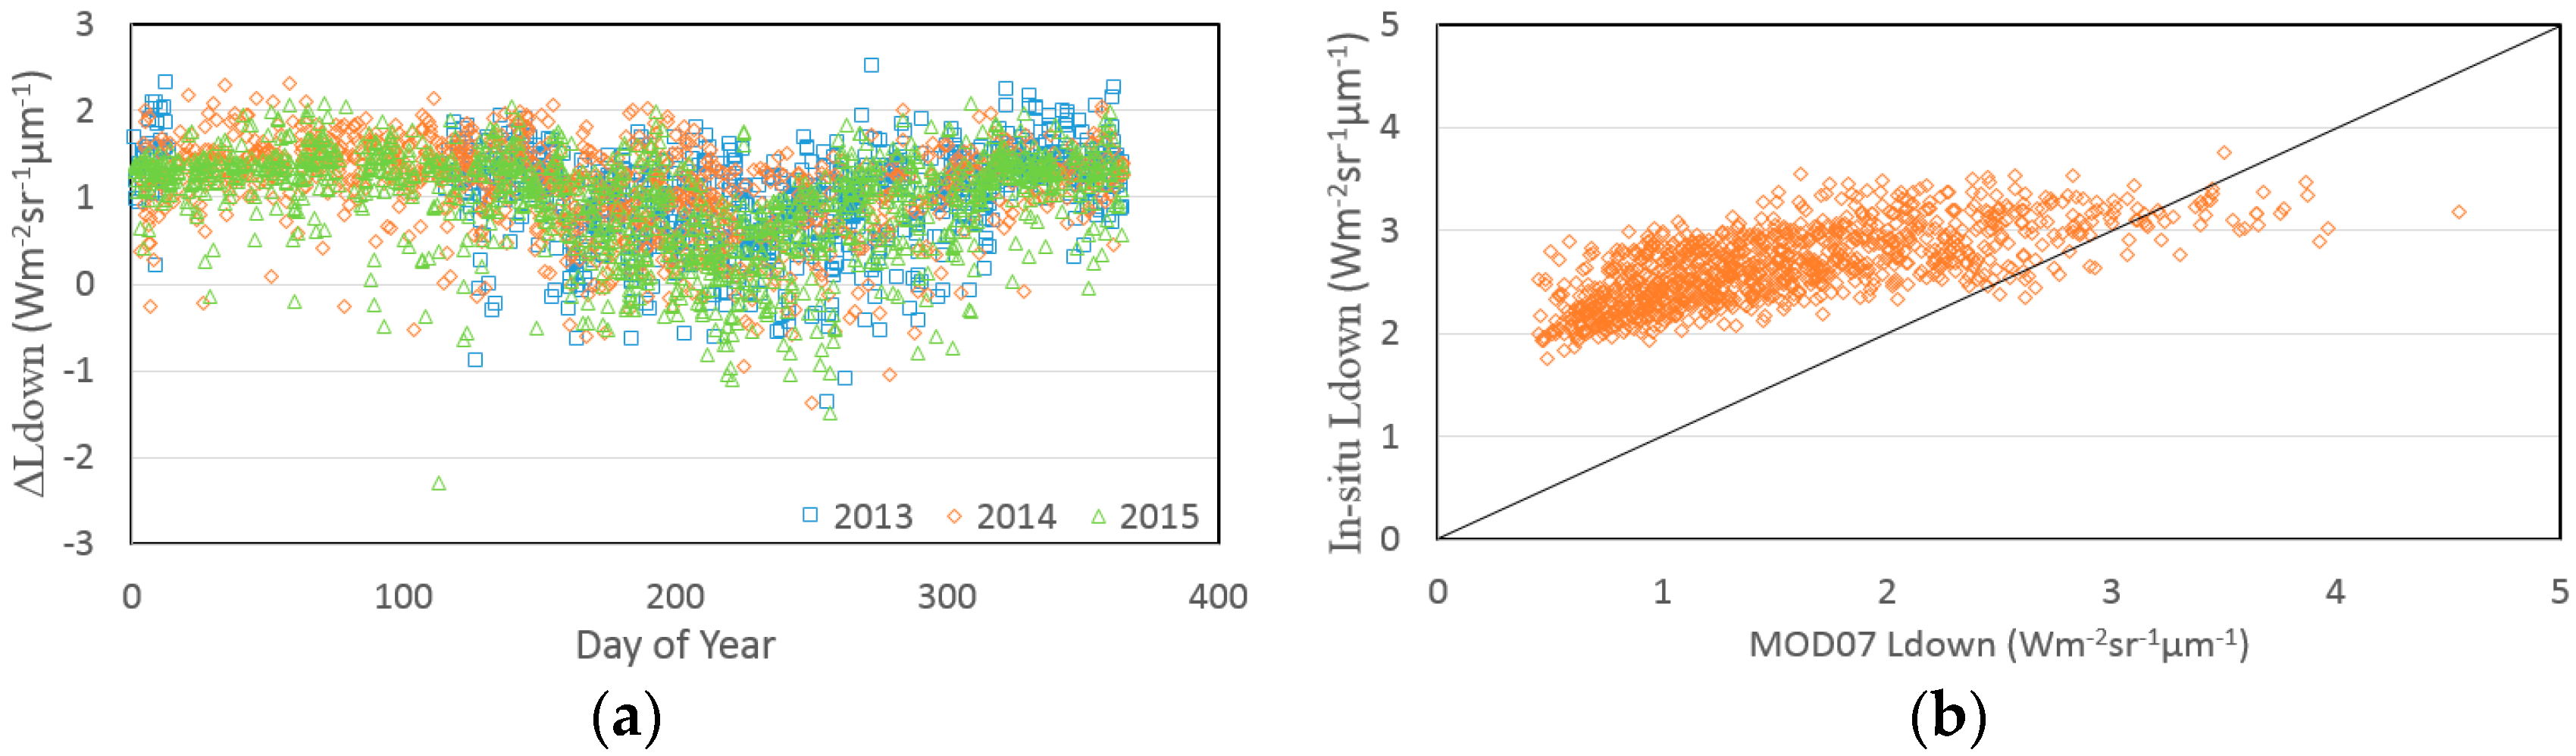
2.4.3. Down-Welling Radiation

In addition to emissivity, Ld values are extracted from the MODIS MOD07 atmospheric profile product. Ld is a hemisphere-integrated down-welling radiance, so it should be estimated for multiple angles [20], which implies multiple simulations. Typically, a unique simulation of Ld (in the MODTRAN-5 code) is performed assuming only λ dependence. This assumption, plus the accuracy of the selected atmospheric profile, generates an uncertainty in the Ld estimation for cloudless days. In our case, because in situ down-welling thermal radiance is not available in Doñana and Cabo de Gata, the uncertainty associated with the MOD07 Ld parameter was studied in Figure 3 with in situ data over Barrax. A comparison between in situ measurements performed at El Cruce with a NR01 Campbell pyrgeometer versus MOD07 estimation was carried out during a span of three years, showing differences of 1 W·m−2·sr−1·µm−1 (Figure 3a). An uncertainty of 1 W·m−2·sr−1·µm−1 can influence the LST estimation approximately by ±0.5 K for an emissivity of 0.95, so a linear model to correct Ld was performed only with the values of the year 2014 (Figure 3b), and was tested with the years 2013, 2015, and two Ld measures (6 April and 11 November) performed in Doñana in the year 2013. Table 2 shows the results without and with fit correction. Including the fit correction in MOD07 Ld values (showing a correlation of r2 = 0.60), the accuracy rises to 0.25 W·m−2·sr−1·µm−1, or 0.1 K. The two Doñana measurements show similar results of 0.95 W·m−2·sr−1·µm−1 vs. 0.50 W·m−2·sr−1·µm−1 without and with correction, respectively. As atmospheric profiles between test sites are similar, the linear model of Figure 3b can be applied in our test sites to estimate hemisphere-integrated down-welling radiance.

2.4.4. Homogeneity

The LST homogeneity of the test sites was studied in [14], and it was measured for each station, when field campaigns were taking place with a high resolution sensor, and for all seasons (year changes) with TIRS Landsat-8 images. In a brief description, the methodology consists of the analysis of the representativeness of in situ measurements in a window of n × n pixels (representative of a given spatial resolution sensor). The homogeneity of the area for a sensor measurement is calculated, analyzing the RMSE between the mean matrix LST value and the radiometer value. This analysis is necessary in order to know the accuracy of the in situ measurements versus satellite data, because the area of in situ and satellite measurements does not match. While in situ measurements cover an area below 5 m2, satellite data has an extension of 100 meters or more. In general, as spatial resolution drops, it is more difficult to retrieve a single representative point of the measured area, and the installation of additional sensors is necessary if the surface variability is high [21]. In our case, because test sites areas have low variability, only one point was taken for the ground data.
Homogeneity varies depending on the season and cover conditions, and usually reaches its lowest values in spring (when there is more cover contrast between green vegetation and bare soils), and reaches its highest values in autumn. If the homogeneity is high, the best cal/val results can be obtained. In general, results show that Juncabalejo, Fuente Duque (in Doñana), and Balsa Blanca (in Cabo de Gata) have adequate homogeneity for low and high resolution sensors (mean inhomogeneity below 1 K), while El Cruce, Las Tiesas (in Barrax), and Cortes (in Doñana) are suitable for moderate resolution sensors, with mean inhomogeneity values of 0.5 K. In Las Tiesas, when there are not crops in the autumn–winter season, there is the possibility of cal/val for low resolution sensors because the inhomogeneity is lower than 1 K. In Table 3, seasonal homogeneity can be found for our test sites.

2.5. Uncertainty of Field Measures

Computing the precision of the in situ measurement process, a global accuracy can be predicted for each station. Following the classic error theory, the final error can be retrieved as the root mean square of all the steps involved in the LST estimation. The biggest part of uncertainty is due to inhomogeneity, which varies for each station and season. The other components have less influence, especially in seasons were the inhomogeneity is high. These other component are: the radiometer’s calibration (±0.2 K), uncertainty in Ld retrieval (±0.1 K), and uncertainty in ε measurements (±0.2 K).
A summary of the section 2 (Spanish test sites) can be found in Table 3.

3. Applications

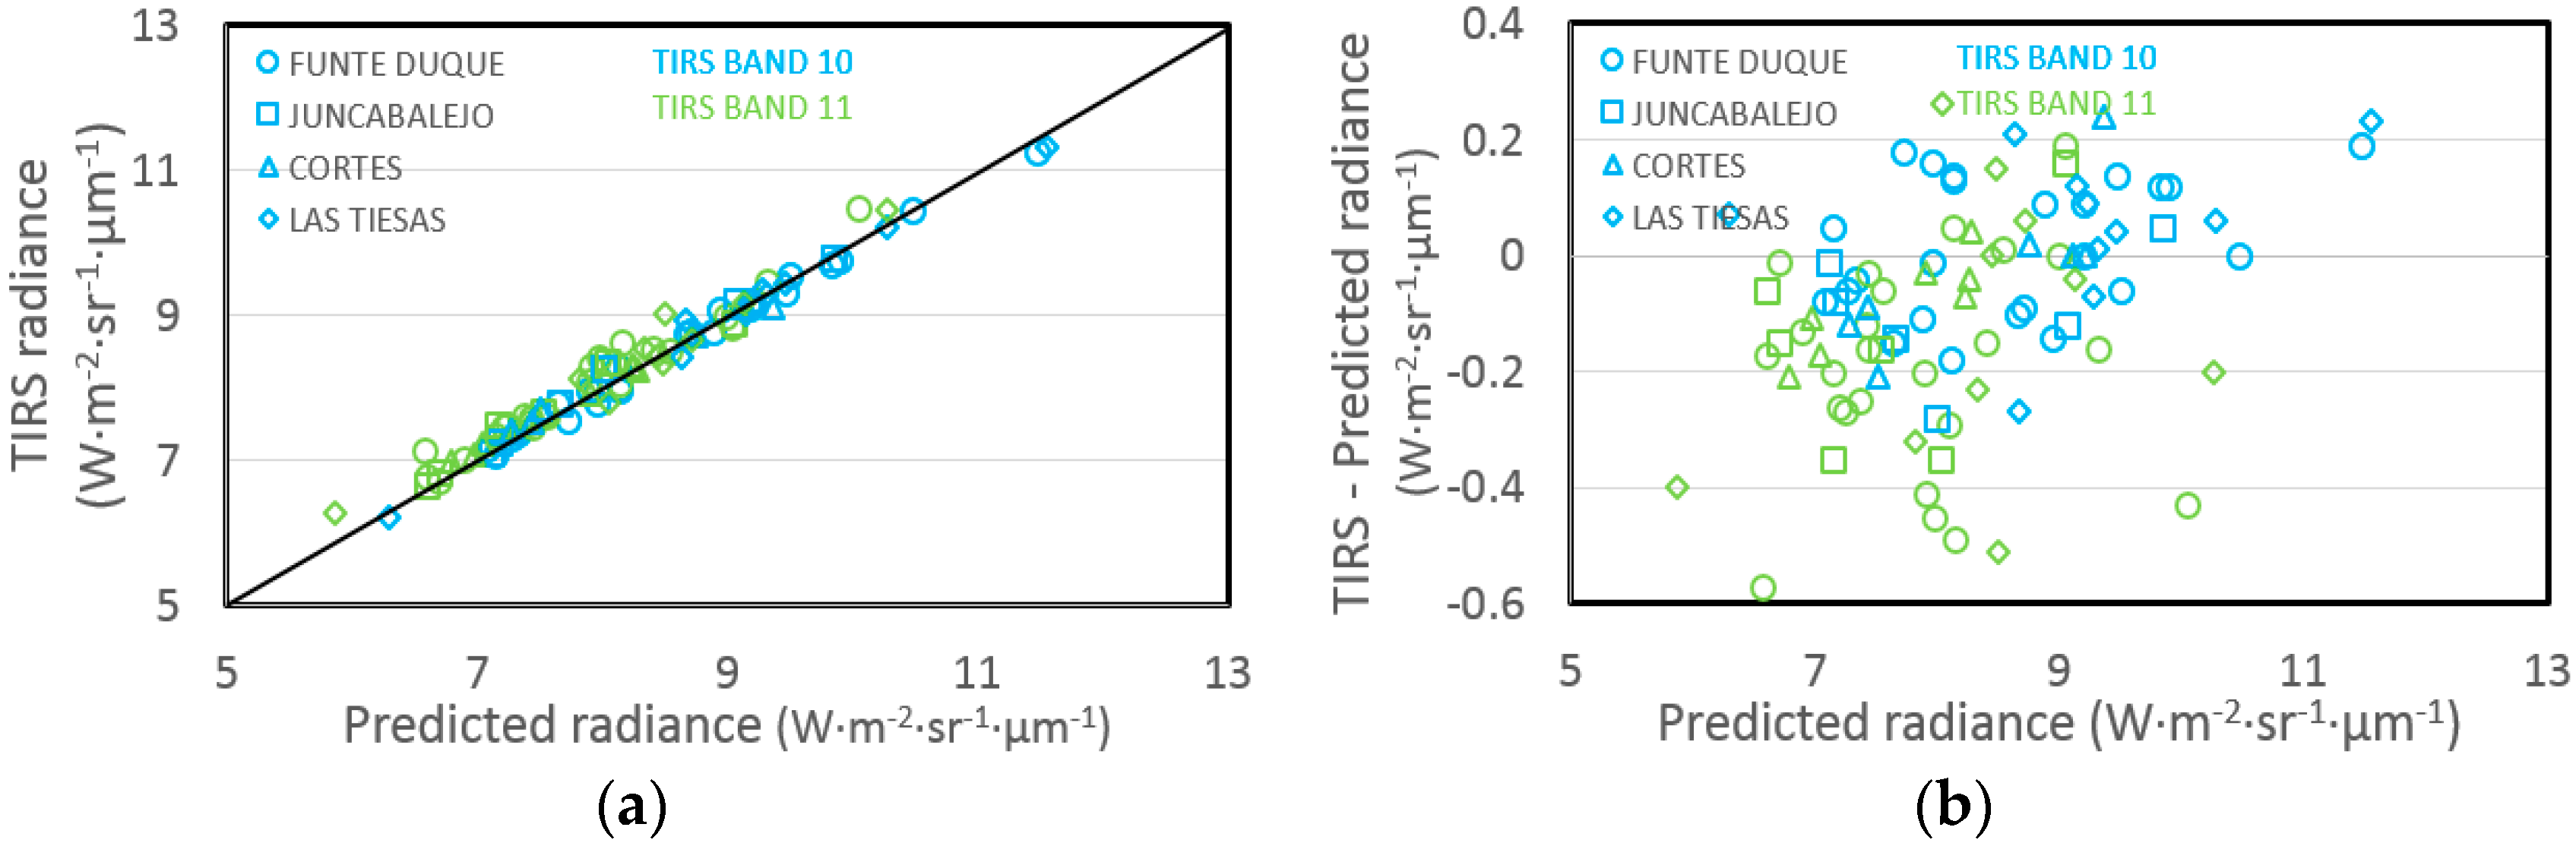
3.1. Vicarious Calibration Landsat-8 TIRS Bands

Continuous monitoring of bands 10 and 11 of TIRS were performed over our six test sites, starting in 2013. Vicarious calibration (VC) was performed following the same procedure of [22], obtaining top of atmosphere radiances for both TIRS bands. To obtain maximal precision in the VC (essential to ensure highly consistent and accurate radiometric calibration of EO sensors [22]), only the data with minimal atmospheric influence (low water vapor values in the total atmospheric column below 2 g/cm2) and days with minimal ground-based measurement uncertainty (below 1 K) were considered. In Figure 4 and Table 4, the results of VC for both Landsat TIRS bands are shown.
Predicted and Landsat-derived radiances show a high linear correlation (Figure 4) with r2 above 0.96 in all cases, and with slope values near the 1:1 line. Results show a negligible bias for band 10 with a mean 1-sigma standard deviation of 0.8 K. In the case of band 11, a larger bias and 1-sigma standard deviation were obtained, confirming the results of [23] related to stray light problems. Performing a comparison between test sites in Table 4, band 10 shows minimal differences (0.3 K) with a stable sigma values, while for band 11, depending on the situation of test site (Juncabalejo and Fuente Duque have the same surface target), higher sigma differences were obtained (above 0.5 K) which may confirm stray light problems at band 11.

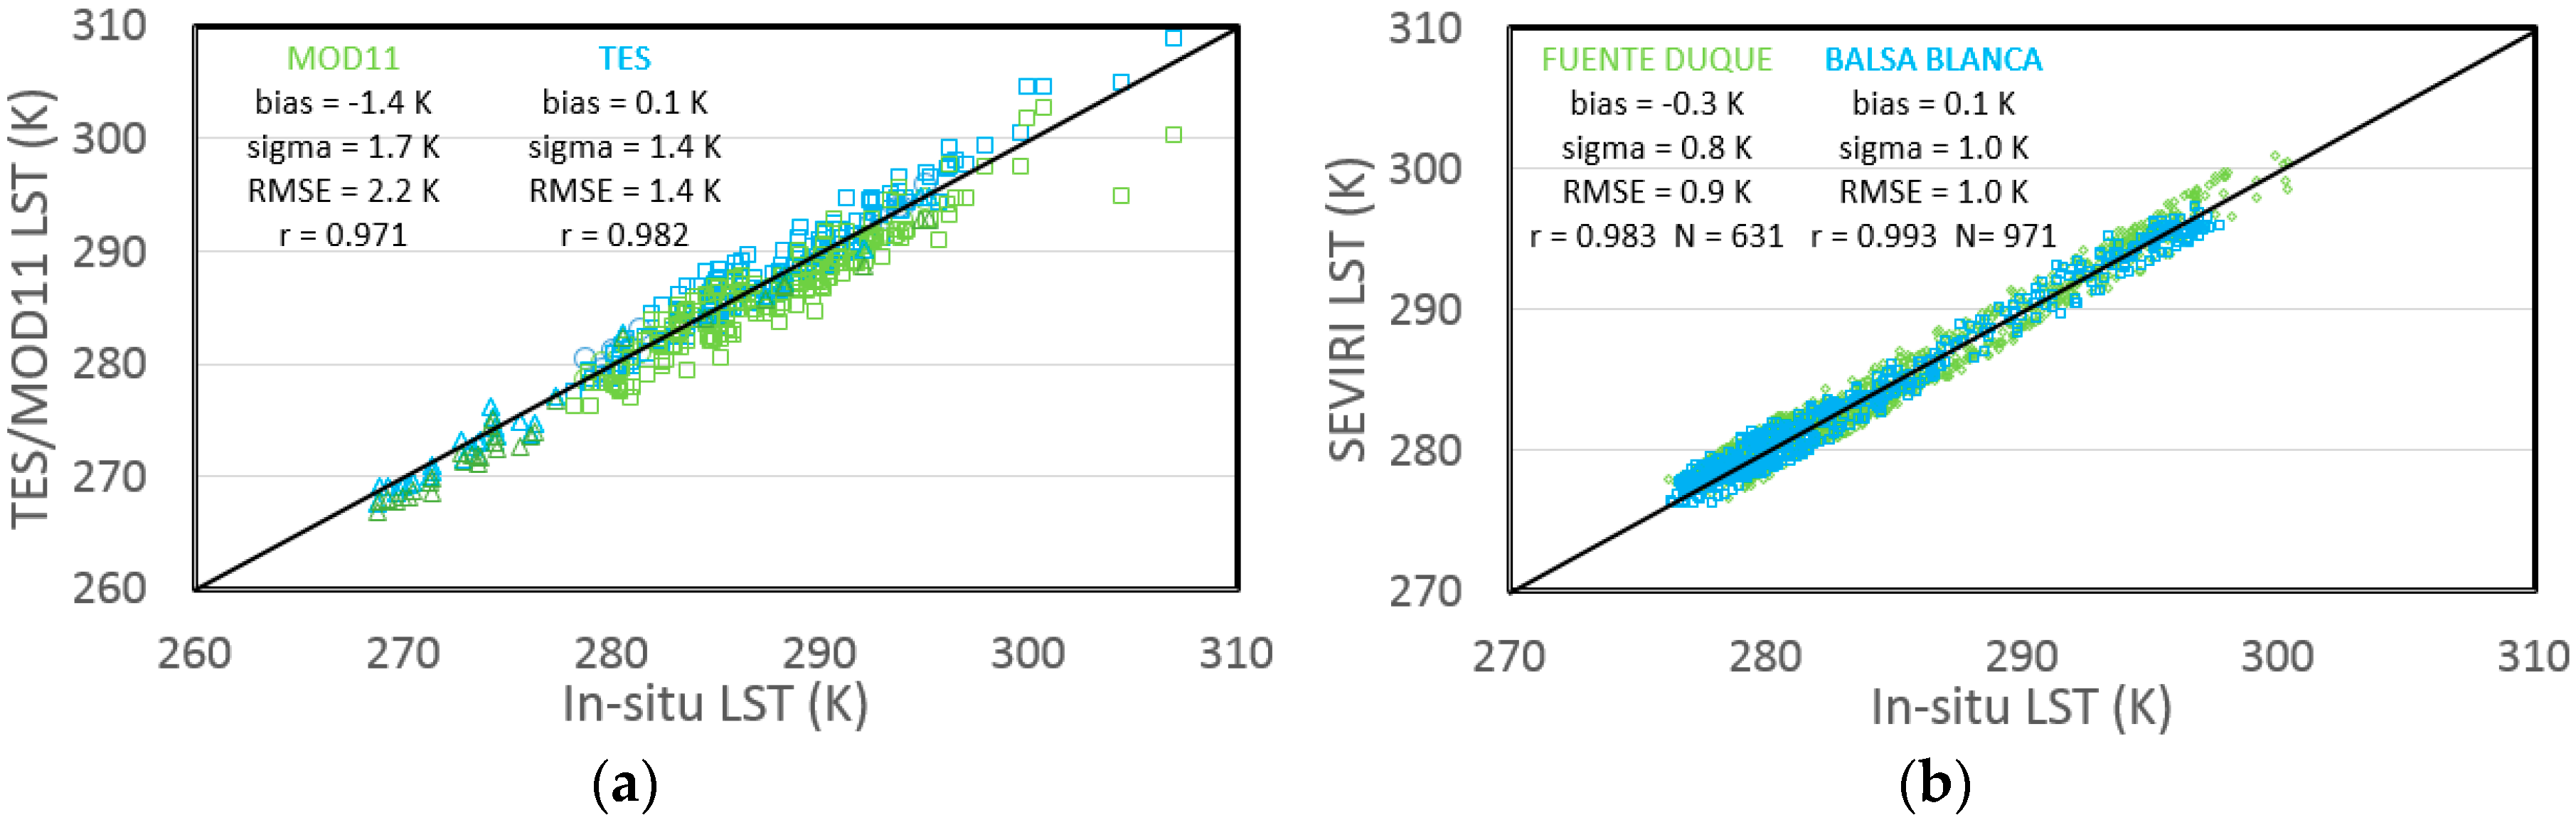
3.2. LST Validation for Low Resolution Sensors

In addition to VC, LST algorithm validation is the other task performed in the GCU in order to guarantee the quality of LST products offered by different institutions or directly developed in our installations (GCU products can be downloaded in http://ceosspain.lpi.uv.es/home/ and include, among others, the emissivity and the LST of MODIS and SEVIRI sensors [24]). The main objective of this work is to show the database and present the test sites, and so the validations performed are examples of the usefulness of our data. The in situ data used for MODIS (that is going to be retired anytime) can be extended to similar ongoing activity sensors such as VIIRS or SLSTR.
Figure 5a shows the validation of MOD11 and MODIS TES products [25], performed along the years 2013, 2014, and 2015 over Fuente Duque, Las Tiesas, and Balsa Blanca for winter, summer and autumn seasons. Validation over our test sites was not performed in the same period, so the analysis was done with all data together. RMSE values obtained for MODIS LST products agree with other validations performed over official MOD11 and TES products, with values around or below 2 K [12,26]. Furthermore, the TES algorithm shows better biases performance than the MOD11 product, with similar 1-sigma standard deviation values.
The SEVIRI LST product (applying Split-Window algorithm) developed by GCU was validated in Balsa Blanca and Fuente Duque test sites in the period of 15 December 2015 to 10 January 2016. In this case, the same data was taken for both stations, and the analysis was realized separately in order to show results for two different targets and test sites validation compatibility. In Figure 5b, validation of Split-Window is shown, with a total of 1500 values. The plot shows a RMSE of 1 K, with bias magnitude near zero and standard deviation values below 1 K for both stations. Validation results of the GCU product agree with the validation of the Land Surface Analysis Satellite Applications Facility (LSA SAF) product performed in [11] and with the expected in situ uncertainty for the autumn–winter period (approximately 0.8 K). Both test sites show minimal differences between them.

4. Conclusions

Currently, six fixed stations in the Spanish territory have been launched between 2011 and 2015 in Doñana, Cabo de Gata, and Barrax. All of them have been collecting LST data every 5 min at different surface covers that guarantee a huge spectrum of emissivities. In order to ensure the best quality of in situ measurements, the knowledge of error sources of in situ LST retrieval was studied for each station, obtaining the mean precision of the data. Including the uncertainties due to inhomogeneity and LST measurements, mean values of 0.7 K and 1.0 K for moderate and low resolution EO sensors, respectively, were retrieved. The given precision varies seasonally and depends of the type of EO sensor (to be calibrated or LST algorithm validated).
Test sites managed by the GCU have been demonstrated to be useful for cal/val activities. This fact is illustrated in the VC performed over Landsat TIRS bands and in the validation exercises performed over MODIS official products and the SEVIRI LST product generated in the GCU installations. Furthermore, with the project “Synergistic Use of The Sentinel Missions For Estimating And Monitoring Land Surface Temperature (SEN4LST)” that proposes an LST Split-Window algorithm (developed and validated in our group [27], between others), the GCU is ready for the VC and LST algorithms validation of the Sentinel-3 SLSTR sensor.
Due to the increase of installed fixed stations in the last year, the data base is not yet available, but users can ask for the data at the email address of the authors.

Acknowledgments

This work was supported by the Ministerio de Economía y Competitividad (CEOS-Spain2, project ESP2014-52955-R). The authors would like to thank the Reserva Biológica de Doñana and the Instituto Técnico Agronómico Provincial de Albacete.

Author Contributions

José A. Sobrino and Dražen Skoković conceived the study and wrote the paper. Furthermore, Dražen Skoković performed the error analysis and the cal/val results.

Conflicts of Interest

The authors declare no conflicts of interest.

References

  1. Kustas, W.; Anderson, M. Advances in thermal infrared remote sensing for land surface modeling. Agric. For. Meteorol. 2009, 149, 2071–2081. [Google Scholar] [CrossRef]
  2. Karnieli, A.; Agam, N.; Pinker, R.T.; Anderson, M.; Imhoff, M.L.; Gutman, G.G. Use of NDVI and land surface temperature for drought assessment: Merits and limitations. J. Clim. 2010, 23, 618–633. [Google Scholar] [CrossRef]
  3. Kalma, J.D.; McVicar, T.R.; McCabe, M.F. Estimating land surface evaporation: A review of methods using remotely sensed surface temperature data. Surv. Geophys. 2008, 29, 421–469. [Google Scholar] [CrossRef]
  4. Sánchez, J.M.; Kustas, W.P.; Caselles, V.; Anderson, M.C. Modelling surface energy fluxes over maize using a two-source patch model and radiometric soil and canopy temperature observations. Remote Sens. Environ. 2008, 112, 1130–1143. [Google Scholar] [CrossRef]
  5. Julien, Y.; Sobrino, J.A.; Verhoef, W. Changes in land surface temperatures and NDVI values over Europe between 1982 and 1999. Remote Sens. Environ. 1999, 103, 43–55. [Google Scholar] [CrossRef]
  6. Sobrino, J.A.; Oltra-Carrió, R.; Sòria, G.; Jiménez-Muñoz, J.C.; Franch, B.; Hidalgo, V.; Mattar, C.; Julien, Y.; Cuenca, J.; Romaguera, M.; et al. Evaluation of the Surface urban heat island effect in the city of Madrid by thermal remote sensing. Int. J. Remote Sens. 2013, 34, 3177–3192. [Google Scholar] [CrossRef]
  7. Li, Z-L.; Tang, B-H.; Wu, H.; Ren, H.; Yan, G.; Wan, Z.; Trigo, I.F.; Sobrino, J.A. Satellite-derived land surface temperature: Current status and perspectives. Remote Sens. Environ. 2013, 131, 14–37. [Google Scholar]
  8. Sobrino, J.A.; Jiménez-Muñoz, J.C.; Zarco-Tejada, P.J.; Sepulcre-Cantó, G.; De Miguel, E. Land Surface Temperature Derived from Airborne Hyperspectral Scanner Thermal Infrared Data. Remote Sens. Environ. 2006, 102, 99–115. [Google Scholar] [CrossRef]
  9. Jimenez-Munoz, J.C.; Sobrino, J.A.; Skoković, D.; Mattar, C.; Cristobal, J. Land Surface Temperature Retrieval Methods from Landsat-8 Thermal Infrared Sensor Data. IEEE Geosci. Remote Sens. Lett. 2014, 11, 1840–1843. [Google Scholar] [CrossRef]
  10. Gillespie, A.; Rokugawa, S.; Matsunaga, T.; Cothern, J.S.; Hook, S.; Kahle, A.B. A Temperature and Emissivity Separation Algorithm for Advanced Spaceborne Thermal Emission and Reflection Radiometer (ASTER) Images. IEEE Transac. Geosci. Remote Sens. 1998, 36, 1113–1126. [Google Scholar] [CrossRef]
  11. Göttsche, F.-M.; Olesen, F.-S.; Bork-Unkelbach, A. Validation of land surface temperature derived from MSG/SEVIRI with in situ measurements at Gobabeb, Namibia. Int. J. Remote Sens. 2013, 34, 3069–3083. [Google Scholar] [CrossRef]
  12. Wang, W.; Liang, S.; Meyers, T. Validating MODIS Land Surface Temperature Products Using Long-Term Nighttime Ground Measurements. Remote Sens. Environ. 2008, 112, 623–635. [Google Scholar] [CrossRef]
  13. Cristóbal, J.; Jiménez-Muñoz, J.C.; Sobrino, J.A.; Ninyerola, M.; Pons, X. Improvements in land surface temperature retrieval from the Landsat series termal band using water vapor and air temperature. J. Geophys. Res. 2009, 114, D08103. [Google Scholar] [CrossRef]
  14. Sobrino, J.A.; Skoković, D.; Jiménez-Muñoz, J.C. Spatial analysis of the homogeneity of the land surface temperature in three Spanish test sites. Int. J. Remote Sens. 2015, 36, 4793–4807. [Google Scholar] [CrossRef]
  15. Andreu, A.; Timmermans, W.J.; Skoković, D.; Gonzalez-Dugo, M.P. Influence of Component Temperature Derivation from Dual Angle Thermal Infrared Observations on TSEB Flux Estimates Over an Irrigated Vineyard. Acta Geophys. 2015, 63, 1540–1570. [Google Scholar] [CrossRef]
  16. Peres, L.F.; Sobrino, J.A.; Libonati, R.; Jiménez-Muñoz, J.C.; Dacamara, C.C.; Romaguera, M. Validation of a temperature emissivity separation hybrid method from airborne hyperspectral scanner data and ground measurements in the SEN2FLEX field campaign. Int. J. Remote Sens. 2008, 29, 7251–7268. [Google Scholar] [CrossRef]
  17. Morillas, L.; García, M.; Nieto, H.; Villagarcia, L.; Sandholt, I.; Gonzalez-Dugo, M.P.; Zarco-Tejada, P.J.; Domingo, F. Using radiometric surface temperature for surface energy flux estimation in Mediterranean drylands from a two-source perspective. Remote Sens. Environ. 2013, 136, 234–246. [Google Scholar] [CrossRef]
  18. Jiménez-Muñoz, J.C.; Sobrino, J.A. Emissivity spectra obtained from field and laboratory measurements using the temperature and emissivity separation algorithm. Appl. Opt. 2007, 45, 7104–7109. [Google Scholar] [CrossRef]
  19. Baldridge, A.M.; Hook, S.J.; Grove, C.I.; Rivera, G. The ASTER spectral library version 2.0. Remote Sens. Environ. 2009, 113, 711–715. [Google Scholar] [CrossRef]
  20. Galve, J.M.; Coll, C.; Caselles, V.; Valor, E. An atmospheric radiosounding database for generating land surface temperature algorithms. IEEE Trans. Geosci. Remote Sens. 2008, 46, 1547–1557. [Google Scholar] [CrossRef]
  21. Duguay-Tetzlaff, A.; Bento, V.; Göttsche, F.; Stöckli, R.; Martins, J.; Trigo, I.; Olesen, F.; Bojanowski, J.; da Camara, C.; Kunz, H. Meteosat Land Surface Temperature Climate Data Record: Achievable Accuracy and Potential Uncertainties. Remote Sens. 2015, 7, 13139–13156. [Google Scholar] [CrossRef]
  22. Slater, P.N.; Biggar, S.F.; Thome, K.J.; Gellman, D.I.; Spyak, P.R. Vicarious radiometric calibrations of EOS sensors. J. Atmos. Ocean. Technol. 1996, 13, 349–359. [Google Scholar] [CrossRef]
  23. Barsi, J.A.; Schott, J.R.; Hook, S.J.; Raqueno, N.G.; Markham, B.L.; Radocinski, R.G. Landsat-8 Thermal Infrared Sensor (TIRS) Vicarious Radiometric Calibration. Remote Sens. 2015, 6, 11607–11626. [Google Scholar] [CrossRef]
  24. Julien, Y.; Sobrino, J.A.; Sòria, G. Retrieving and broadcasting near-real time biophysical parameters from MODIS and SEVIRI receiving stations at the Global Change Unit of the University of Valencia. Int. J. Remote Sens. 2015. [Google Scholar] [CrossRef]
  25. Hulley, G.; Veraverbeke, S.; Hook, S. Thermal-based techniques for land cover change detection using a new dynamic MODIS multispectral emissivity product (MOD21). Remote Sens. Environ. 2014, 140, 755–765. [Google Scholar] [CrossRef]
  26. Coll, C.; García-Santos, V.; Niclòs, R.; Caselles, V. Test of the MODIS Land Surface Temperature and Emissivity Separation Algorithm with Ground Measurements Over a Rice Paddy. IEEE Transac. Geosci. Remote Sens. 2016, 54, 3061–3069. [Google Scholar] [CrossRef]
  27. Sobrino, J.A.; Jiménez-Muñoz, J.C.; Sòria, G.; Ruescas, A.B.; Danne, O.; Brockmann, C.; Ghent, D.; Remedios, J.; North, P.; Merchant, C.; et al. Synergistic use of MERIS and AATSR as a proxy for estimating Land Surface Temperature from Sentinel-3 data. Remote Sens. Environ. 2016, 179, 149–161. [Google Scholar] [CrossRef]
Figure 1. Test sites locations and plots of the fixed stations. From left to right: Doñana (Cortes, Fuente Duque, and Juncabalejo), Cabo de Gata (Balsa Blanca), and Barrax (El Cruce and Las Tiesas) test sites.
Data 01 00010 g001
Figure 2. (a) Difference (Δε) between broadband emissivity values of IR120 and CIMEL radiometers versus the emissivities measured by CIMEL broadband radiometer; (b) IR120 versus CIMEL emissivities for soils extracted from the Advanced Spaceborne Thermal Emission Reflection Radiometer (ASTER) spectral library database.
Data 01 00010 g002
Figure 3. (a) Differences of Ld (in situ minus MOD07 product) in the years 2013, 2014, and 2015; (b) Plot of in situ Ld versus MOD07 Ld for the year 2013.
Data 01 00010 g003
Figure 4. (a) Plot of thermal infrared sensor (TIRS) radiance versus the vicarious calibration (VC)-based radiance (predicted); and (b) plot of residual bias error versus in situ radiances. Results present plots for each test site and for both TIRS bands.
Data 01 00010 g004
Figure 5. (a) Plot of MODIS LST products versus in situ LST measurements in the years 2013, 2014, and 2015 at Fuente Duque (in squares), Las Tiesas (in circles), and Balsa Blanca (in triangles); (b) SEVIRI Split Window LST algorithm versus in situ data for the period 15 December 2015 to 10 January 2016.
Data 01 00010 g005
Table 1. Emissivity statics referred to Figure 2a and, in brackets, the same statics but with IR120 predict emissivities of the Figure 2b.
BiasSigmaRMSESlopeOffsetR2
Soils0.0032 (0.0004)0.0022 (0.0007)0.0038 (0.0008)0.909.810.99
Water/Vegetation0.00070.00130.0015---
Table 2. Statics of correlation between MOD07 and in situ down-welling radiance (W·m−2·sr−1·µm−1) without and with fit correction, performed in the Barrax test site. The land surface temperature (LST) uncertainty for an emissivity of 0.95 is shown in brackets.
BiasSigmaRMSESlopeOffsetR2
Barrax (El Cruce)No correction1.020.561.16 (±0.5)---
Correction−0.020.250.25 (±0.1)0.352.120.60
Table 3. Summary of the main characteristics of fixed stations managed in Doñana, Barrax, and Cabo de Gata test sites. Field cover type was defined as: PN is pine forest, W is water, BS is bare soil, GV is green vegetation, SV is senescent vegetation, WH is wheat, and GG is green grass. MRS and LRS are the inhomogeneity of Moderate and Low spatial Resolution Sensors, respectively. The inhomogeneity was divided into seasons: Wi, Sp, Su, and At are Winter, Spring, Summer, and Autumn seasons, respectively.
Test SitesDoñanaBararxCabo de Gata
NamesCortesFuente DuqueJuncabalejoLas TiesasEl CruceBalsa Blanca
Location36.996 N 6.513 W36.998 N 6.434 W36.946 N 6.389 W39.059 N 2.099 W39.061 N 2.099 W36.939 N 2.034 W
Field coverPNW or BS/SVW or BS/SVBS or WHGGBS/SV or BS/GV
Field extension (km × km)2.5 × 3>10 × 102 × 51 × 10.12 × 0.204 × 4
Measured area5 m 2 5 m 2 2 m 2 3 m 2 1 m 2 2 m 2
Inhomogeneity for MRS/LRS (10−1 K)
Wi-Sp-Su-At
MRSMRSMRSMRSMRSMRS
7-15-9-54-11-9-45-13-10-45-8-11-34-8-10-44-14-10-5
/-/-/-/7-35-10-58-40-12-610-/-/-8 */-/-/-/7-21-11-6
LRSLRSLRSLRSLRSLRS
Emissivity range0.97–0.990.95–0.990.95–0.990.95–0.990.97–0.990.95–0.98
Mean accuracy measurement (K)MRS/LRSMRS/LRSMRS/LRSMRS/LRSMRS/LRSMRS/LRS
0.9/…0.7/1.00.8/1.00.7/0.9 *0.6/…0.8/1.1
* Only computed for autumn/winter season.
Table 4. Results of VC between TIRS versus in situ predicted radiance data obtained with the MOD07 atmospheric profiles for four Spanish test sites. N is the number of data used in VC and, in brackets, the data considered in each fixed station. Bias, sigma, and RMSE are given in W·m−2·sr−1·µm−1 and, in brackets, the equivalency in temperature at 300 K.
(N = 46) Las Tiesas (10)Fuente Duque (24)Juncabalejo (5)Cortes (7)
TIRS b10Bias0.05 (0.4)0.02 (0.2)−0.06 (−0.5)−0.02 (−0.2)
sigma0.14 (0.9)0.12 (0.8)0.08 (0.6)0.14 (0.9)
RMSE0.15 (1.0)0.12 (0.8)0.10 (0.7)0.14 (0.9)
TIRS b11Bias−0.12 (−1.0)−0.19 (−1.6)−0.15 (−1.2)−0.08 (−0.7)
sigma0.25 (2.1)0.19 (1.6)0.21 (1.7)0.09 (0.8)
RMSE0.28 (2.3)0.27 (2.2)0.26 (2.2)0.12 (1.0)
TOTALBiassigmaRMSEsloper
TIRS b100.01 (0.1)0.12 (0.8)0.12 (0.8)0.956 ± 0.0150.994
TIRS b11−0.16 (−1.3)0.19 (1.6)0.25 (2.1)0.954 ± 0.0300.979

