Article

Lachancea thermotolerans, an Innovative Alternative for Sour Beer Production

1
Department of Agri-Food, Madrid Institute for Rural, Agriculture and Food Research and Development (IMIDRA), El Encín, A-2, km 38.2, 28805 Alcalá de Henares, Spain
2
Brewery La Cibeles, Petróleo 34, 28918 Leganés, Spain
*
Author to whom correspondence should be addressed.
Beverages 2023, 9(1), 20; https://doi.org/10.3390/beverages9010020
Submission received: 20 November 2022 / Revised: 19 January 2023 / Accepted: 12 February 2023 / Published: 20 February 2023

Abstract

:
The interest in and growth of craft beer has led to an intense search for new beers and styles. The revival of traditional styles has sometimes been hampered by the use of microorganisms such as lactic acid bacteria. Therefore, studies on alternative yeasts for the production of this style of beer have increased. In this work and together with previous studies carried out with yeasts isolated from Madrid agriculture (from grapes, must, wine, vineyards and wineries), the capacity of 10 yeast strains, belonging to the genus Lachancea thermotolerans, for the production of sour beer has been determined. For this purpose, different fermentation scale-ups (100 mL, 1 L and 100 L) have been performed and their fermentation capacity, aroma compound production (33 volatile compounds by GC), organoleptic profile (trained tasting panel and consumers), melatonin production (HPLC) and antioxidant capacity have been studied. Beer fermented with yeast strain CLI 1232 showed a balanced acidity with a fruity aromatic profile and honey notes. On the other hand, the beer fermented with strain 1-8B also showed a balanced acidity, but less fruity and citric flavour than CLI 1232 strain. Finally, the yeast strain selected by the consumers (CLI 1232) was used for beer production at industrial scale and the market launch of a sour beer.

Graphical Abstract

1. Introduction

Craft beer production has increased significantly in recent years, not only in terms of production but also in terms of demand for new products and new styles of beer [1]. Research or revival of new beer styles has focused on experimentation with the main ingredients of beer: water [2], malted grain [3], hops [4,5] and yeasts [6,7,8,9,10]. However, despite extensive research into the different ingredients of beer, studies have mainly focused on the use of non-conventional yeasts.
Sour beers are styles that have been marketed since ancient times and have been rediscovered by many brewers in order to diversify their range of product offerings [11,12]. Different approaches can be chosen to produce sour beers. These beers are traditionally spontaneously fermented and involve acidifying microorganisms, such as yeasts of the genus Brettanomyces, acetic and/or lactic acid bacteria [13]. The synergies between microorganisms will determine the complex flavour profiles of these products.
The sour ale style is also characterised by spontaneous fermentation, where lactic acid bacteria act to improve the accessibility of starch and prevent the growth of other microorganisms, thus providing a favourable growth medium for Saccharomyces spp. [14]. Nevertheless, microorganisms such as Lactobacillus spp., Micrococcus spp., Pediococcus spp. and Streptococcus spp. can spoil beer and produce unpleasant aromatic compounds [15]. Due to the difficulties involved in using bacteria in the brewing industry, studies have focused on the search for yeasts that produce lactic acid levels similar to those found in sour beers where bacteria are involved.
The search for new yeast strains has focused on the use of wild strains of the genus Saccharomyces from different niches [16,17,18,19,20]. However, multiple yeast strains from the genera Brettanomyces, Hanseniaspora, Lachancea and Pichia [21,22] have also been investigated as alternative species for beer production. It has also been shown that yeasts of the genera Hanseniaspora vineae, Lachancea fermentati, Lachancea thermotolerans, Schizosaccharomyces japonicus and Wickerhamomyces anomalus are able to carry out heterolactic fermentation of sugar and produce lactic acid, ethanol and CO2 [23,24]. For this reason, several studies have focused on L. thermotolerans yeast strains as an alternative to the use of bacteria in the production of sour beer [22,23]. However, it has also been found that not all strains of L. thermotolerans are capable of producing lactic acid, and some produce it at lower levels than those found in this style of beer (from 100 to 4500 mg L−1 [22,23,25]), as well as creating a varied aromatic profile (tart or sour flavour [23]). Likewise, until now, the studies carried out in Spain with wine yeasts of the Lachancea genus had been applied to wine production, but not to beer [26,27,28].
The use of non-conventional yeasts has also focused on the search for strains that provide functional benefits, such as antioxidant capacity or melatonin production. Melatonin, in addition to regulating circadian rhythms [29], has antioxidant [30,31], anti-aging [32,33], anti-inflammatory [34,35], antitumor [36,37] and metabolic [38,39] properties. Therefore, with moderate consumption, beer can be considered a functional food, since its constituents can contribute to the whole set of therapeutic characteristics [40].
The aim of this study focused on the characterisation of 10 yeast strains of the acidifying species Lachancea thermotolerans. They were isolated from Madrid agriculture (IMIDRA Autochthonous Yeast Collection) and their potential capacity to produce sour-style beers was investigated. For this purpose, the selected strains were analysed on different scales and in relation to the main beer parameters (residual fermentable sugars, ethanol content, glycerol, colour, bitterness, lactic acid, SO2 and VDKs), volatile profiles, sensory analysis (trained panel and consumers), melatonin production and antioxidant activity to produce a sour beer.

2. Materials and Methods

2.1. Yeast Strains

Ten Lachancea thermotolerans (1-1B to 1-10B) native wine yeast strains were tested. These strains belong to the Autochthonous Yeast Collection of the Madrid Institute for Rural, Agriculture and Food Research and Development (IMIDRA, Madrid, Spain). They were isolated from different resources (grapes, must, wine, vineyard and cellars) belonging to D.O. “Vinos de Madrid”, and were preserved under cryogenization at −80 °C (YPD broth supplemented with 40% (w/v) glycerol).
To ensure the purity of the strains used, they were analysed through amplification of the 5.8S rRNA gene and the two ribosomal internal transcribed spacers, using the primer pair ITS1/ITS4 [41]. The resulting PCR product was analysed using restriction enzymes (Hae III, Cfo I and Hinf I) [42]. Saccharomyces cerevisiae strain SafAle S-04 (Fermentis, Lesaffre, Marcq-en-Barœul, France) was used as control. Yeast strains were preserved under cryogenization at −80 °C (YPD broth supplemented with 40% (w/v) glycerol).

2.2. Selection of Yeast Strains

The yeast strains studied were initially identified to test their ability to assimilate maltose and H2S production. The capacity to ferment maltose was assessed using the Durham test, containing 10 mL of a medium composed of yeast extract (10 g L−1), bacteriological peptone (20 g L−1) (Condalab, Madrid, Spain) and maltose (20 g L−1) (Serva, Heidelberg, Germany). H2S production was analysed by inoculating the yeasts on bismuth-containing indicator medium BiGGY agar (Oxoid Ltd., Basingstoke, UK) and incubating plates at 28 °C for 2 days [43]. The browning of yeast colonies on BiGGY agar medium was determined using a colour scale (1–4):
  • Type I (white/cream): low–null production of H2S
  • Type II (light brown): moderate production of H2S
  • Type III (brown): high production of H2S
  • Type IV (dark brown/black): very high production of H2S

2.3. Fermentation Conditions

Fermentations on the different scales (100 mL, 1 L, 100 L) were carried out with La Cibeles wort with the following characteristics: pH, 5.73; gravity, 11.92 °Plato and 1.047 g cm−3; free amino nitrogen, 239.67 mg L−1; bitterness, 37.43 IBU.
Inoculum for the laboratory scales (100 mL and 1 L) was prepared in 100 mL Erlenmeyer flasks with 30 mL of YPD broth (2% yeast extract, 1% bacteriological peptone and 2% glucose; all w/v) (Condalab, Madrid, Spain) and using orbital stirring (120 rpm) at 28 °C for 24 h. The inoculum for industrial fermentation (100 L) was grown by different sequential scales for five days at 20 °C. The measurement of the inoculum concentration was determined using spectrophotometry and the corresponding calibration line.
The fermentative capacity of the 10 strains was initially tested on a small scale using 150 mL bottles containing 100 mL of wort and an initial population of 106 cells mL−1, at 20 °C under rotary shaking (120 rpm). Bottles were sealed with airlocks, allowing the CO2 to escape. Each strain was tested in triplicate. Daily lost weight was taken until stabilisation to determine CO2 loss. Once the fermentation was finished, samples were centrifuged and stored at −30 °C until their analysis.
In a second phase, based on the results obtained in the 100 mL fermentation, the 10 strains were used to ferment 900 mL of sterile wort in 1 L fermenters. The fermentation conditions were the same, 18 °C and 120 rpm. Fermentation was monitored each hour by lost weight until stabilisation. Once fermentation was completed, 7 g L−1 of sterile glucose was added to the beer, bottled and stored at 20 °C for one week for bottle conditioning and then one month at 4 °C for maturation [44,45]. Yeast viability before bottling was also measured. The matured beers were sensorially and analytically analysed.
The selected L. thermotolerans yeast strains were used for fermentation in 100 L to determine their suitability on an industrial scale as well as at consumer level. Industrial-scale fermentations were carried out in 100 L fermenters containing 90 L of directly transferred wort after cooling. The fermentation temperature was maintained at 18–20 °C under static conditions, and the same recipe as the laboratory-scale fermentations was used. The evolution of fermentation activity was measured by density every day until it was established (constant density for three consecutive days). Once fermentation was complete, the beer was lowered to a temperature of 0–4 °C for 3–4 weeks to allow maturation. It was then held for five days under CO2 pressure and bottled under antioxidant conditions using manual isobaric equipment.

2.4. Beer Analysis

The beers obtained in each of the scalings were analysed for different parameters. Prior to analysis, the samples were degassed through a cellulose filter of grade 2 V (Whatman, Maidstone, UK). Beer analyses were performed in triplicate.
The parameters analysed were: colour (range 1–100 EBC—European Brewing Convention), bitterness (range 5–100 IBU—International Bitterness Unit), lactic acid (range 150–3500 mg L−1), vicinal diketones: diacetyl and 2,3-pentanodione (VDKs) (range 0.05–2 mg L−1), SO2 (range 1–30 mg L−1) and residual fermentable sugars (glucose, fructose and maltose, range 0.1–18 g/L and 15–200 g/L). They were analysed with CDR FoodLab (BeerLab software, Ginestra Fiorentina, Florence, Italy), verified by the international reference analysis laboratory Campden BRI. All analyses were based on enzymatic reactions and spectrophotometry.

2.5. Volatile Compounds Analysis

Beer samples were analysed using GC to determine volatile compounds. Higher alcohols, esters, acids, acetaldehydes-ketones, lactones and phenols (33 major aromatic compounds) were determined according to method from Ortega et al. [46] based on liquid phase microextraction with dichloromethane (DCM). The GC analysis was conducted using a gas chromatograph 6850 (GC-FID, Agilent Technologies, Inc., Santa Clara, CA, USA) equipped with a flame ionization detector. The column used was a DB-WAX (60 m × 0.32 mm i.d. and 0.5 µm film). The GC oven was programmed from a starting temperature of 40 °C for 5 min to 200 °C at 3 °C min−1, the injector and detector temperature were 200 °C, the injection was performed in splitless mode, and the carrier gas was helium at a flow rate of 2 mL min−1.
Four internal standards (2-butanol, 4-methyl-2-pentanol, 4-hydroxy-4-methyl-2-pentanone, 2-octanol) were used for the determination of major aromatic compounds. Levels of the different compounds were determined using calibration lines for each compound (R2 = 0.9861–0.9969).

2.6. Melatonin Determination

Beer samples were extracted using solid phase extraction (SPE) with RP-18 standard PP tubes (Agilent Technologies, Inc., Santa Clara, CA, USA) and loaded into the pre-conditioned extraction columns. Column conditioning was performed by adding 2 mL of methanol (Scharlab, Barcelona, Spain) and 5 mL of bidistilled water, followed by 500 µL of beer, impurities were washed with 2 mL bidistilled water and then eluted with 2 mL of methanol [47]. Once the eluate was obtained, it was dried in a thermoblock at 80 °C under a stream of nitrogen. Finally, the dried extracts were reconstituted with 300 µL methanol and 700 µL mobile phase (formic acid (0.1%)/Acetonitrile (95:5)) (HPLC grade; Carlo Erba, Italy/Panreac-Applichem, Barcelona, Spain). Prior to 10 µL volume injection into the HPLC system, the reconstituted extracts were filtered through a 0.22 µm syringe filter (13 mm hydrophilic PVDF syringe filter, Ginestra Fiorentina, Florence, Italy).
Melatonin analysis was determined through HPLC using a Waters 600 HPLC controller system connected to an autosampler Waters 717 plus and a Waters 2475 multifluorescence detector (Milford, MA, USA). The chromatographic separations were performed on an Eclipse Plus C18 column (Agilent Technologies, Inc., Santa Clara, CA, USA) using a mixture of 0.1% formic acid in water and acetonitrile (95:5) at a flow rate of 1 mL min−1 at 30 °C. The concentration of melatonin was measured by using a linear calibration curve (R2 > 0.9856) [48,49,50].

2.7. Antioxidant Capacity

The antioxidant activity shown by the beers fermented with the different yeasts was determined using the e-BQC lab device (Bioquochem, Asturias, Spain, www.bioquochem.com, accessed on 20 November 2022), based on a measurement of the redox potential and expressed in in microcoulombs (μC) [51]. Two values were obtained for each sample: the antioxidant capacity of the compounds with the highest rate of free radical scavenging (Q1) and with a lower rate of free radical scavenging (Q2).
The antioxidant capacity was determined by the calculation of TEAC (Trolox equivalent antioxidant capacity), using a solution of 6-hydroxy-2,5,7,8-tetrametilchroman-2-carboxylic acid (Trolox 8 mM L−1 in methanol 5% and pH 4.5). Using the Trolox calibration curve (Q1, R2 = 0.9974; Q2, R2 = 0.9876; QT = Q1 + Q2), expressed as e-BQC measurement versus concentration (μmol L−1), the antioxidant activity of the beers was expressed as millimoles of Trolox equivalents per litre (mmol TE L−1).

2.8. Sensory Analysis

Sensory analyses of 1 L and 100 L beers were performed with a trained panel of 10 sensory assessors (five male and five female in an age range from 35 to 62 years old). The panel trainings were carried out with the following descriptors: diacetyl, DMS, acetaldehyde, bitter, butyric acid, isovaleric acid, lactic acid, earthy, H2S, geraniol, clove, grainy, papery, indole and light-struck (Siebel Institute of Technology, Chicago, IL, USA) according to EBC method 13 [52,53,54]. A standardised tasting room with individual booths equipped with a glass of water and with a room temperature of 24° to 25 °C was used.
This sensory analysis allowed us to obtain a formal and structured descriptive profile of the taste of the beers, assessing the intensity of each attribute. Overall quality scores were also used to rate the complete quality of beers (EBC method 13.10) [55]. The attributes to be identified were classified into three groups: appearance (colour, foam retention), smell (esters, alcohols) and taste (alcohol, sweet, salty, acidic, bitterness, astringency, effervescence, warmth, slickness, body). Each attribute was rated on a scale of 0 to 5 points according to its presence or absence. The main average values of the different attributes of each beer were plotted on a radar graph.

2.9. Consumer Aceptability Test

Consumer acceptance was carried out by means of a sensory analysis in which 142 volunteers (28.17% female and 71.83% male, aged between 18 and 65 years old) participated. Aroma and flavour were determined using a 9-point hedonic scale to categorise bitterness, acidity and overall impression, where 1 = dislike extremely, 5 = neither like nor dislike and 9 = like extremely. In addition, it was determined what percentage of consumers were able to detect the aromas, flavours and tastes of the beers.

2.10. Check-All-That-Apply Questions

The rest of the attributes that could be detected for consumers were analysed according to check-all-that-apply (CATA) questions [56]. These questions consist of posing a question and providing a list of words or phrases from which respondents must select those that best answer the question. Compared to other tests, it has the advantage of allowing multiple choices to be selected, rather than limiting respondents to selecting a single answer for a specific attribute. In this way, we can obtain information on consumer perception when determining the sensory characteristics of a product. The following sensory attributes were analysed using the CATA questions: appearance (foam consistency and visual impression), aroma (aroma intensity) and taste (acidity, bitterness, mouthfeel and aftertaste). Samples of 50 mL of beer at 10 °C were tasted in a normalized sensory room of the IMIDRA in individual booths using Sensesbit software (TasteLab, Galicia, Spain, www.sensesbit.com, accessed 18 November 2022) to display the questionnaire.

2.11. Statistical Analysis

Data from chemical and volatile compounds were reported as the mean of three values ± standard deviation. A one-way analysis of variance (ANOVA) with the Tukey post hoc test on a significance level of p < 0.05 was calculated for the strains used in 100 mL, 1 L and 100 L fermentations, as well as for sensory analysis. Identification of significant data correlation was performed with the Pearson test. Principal component analysis (PCA) was carried out to highlight differences between the obtained results (total higher alcohols, total esters, total aldehydes/ketones, total fatty acids, γ-butyrolactone, guaiacol, bitterness, glycerol, ethanol, lactic acid, colour, melatonin and antioxidant capacity). Calculations were performed using statistical analysis software R Studio 4.1 (Integrated Development for R. RStudio, PBC, Boston, MA, USA).

3. Results and Discussion

Lachancea thermotolerans yeast has been widely used in wine since it reduces the pH and volatile acidity of wines, as well as increases glycerol when fermentations are carried out together with the yeast Saccharomyces cerevisiae [57,58]. In addition to lowering the pH of beer, it can produce lactic acid in beer and can, thus, be used to make sour beers without the need for bacteria in the brewing industry. L. thremotolerans can also shorten the fermentation process and improve the mouthfeel provided by these yeasts [7,22,23].
In order to achieve the objective of obtaining a sour beer without using bacteria, 10 yeast strains belonging to the species L. thermotolerans were initially studied and one was finally selected. This strain was evaluated together with the CLI 1232 strain previously studied in the initial non-Saccharomyces preselection [24].

3.1. Yeast Screening

The 10 strains of L. thermotolerans were used to first ferment 100 mL samples to determine their behaviour in the beer wort. They showed a lower ability to ferment the wort (2.65 to 3.48 g CO2 lost) compared to the S-04 S. cerevisiae control strain (6.21 g CO2 lost), with the strains 1-7B, 1-8B and 1-9B being the best of all (3.5 g CO2 lost) (Figure 1). Nevertheless, fermentation stabilised after five days, as with the control strain. The L. thermotolerans species has been described as maltose-fermenting but not maltotriose-fermenting [22,59], which was contradicted in the Durham test, where all yeasts were positive for maltose fermentation. Residual maltose can cause undesirable aromas or flavours in the final beer [60]; however, no unpleasant aromas were perceived in the 1 L and 100 L beers tasted. Likewise, the sweetness contributed by maltotriose to the beer is significantly less than that which can be contributed by residual glucose or sucrose [59].
Likewise, in terms of H2S production, three strains (1-1B, 1-2B and 1-3B) showed low or null production (Type I) in the BiGGY medium, while the rest showed high production (Type III). However, in the sensory analyses performed, no taster detected this aroma.

3.1.1. Beer Analyses

Table 1 shows the results obtained on the 100 mL scale for each of the 10 yeast strains studied. The parameters lactic acid, colour, bitterness, ethanol and residual sugars were analysed using the CDR FoodLab equipment.
In terms of beer appearance, they had colour values between 10 and 13.5 EBC, lower than those of the control strain S-04 (14.33 EBC). In studies such as that of Marek Zdaniewicz et al., a decrease in the colour values of beer fermented with L. thermotolerans was observed [61]. The values obtained were also higher than those for a sour beer (4-7 EBC) [62], which may also be influenced by the Maillard reactions that occur during the brewing process and depend on malting and boiling as well as fermentation. It has also been shown that colour is a strain-dependent parameter. There are several studies where high concentrations of polyphenols, as well as compounds such as rivoflavin, can contribute to beer colour [63,64]. Therefore, more in-depth studies are needed to analyse the presence of compounds produced by yeasts that can affect beer colour.
As mentioned above, the L. thermotolerans species is characterised by high lactic acid production, with the levels obtained in this work ranging from 1593 to 2554 mg L−1, which were similar to those obtained by Domizio et al. [22]. However, the levels of lactic acid that can be found in a non-acidic ale beer are between 100 and 330 mg L−1 [65], with the results obtained for strain S-04 being 263.33 mg L−1. Likewise, levels typically found in sour beers that have been fermented with lactic acid bacteria and yeast are around 1000 mg L−1, which is half the value obtained with a L. thermotolerans yeast. There are also several studies with lactic acid bacteria and S. cerevisiae that have explored different strategies to improve the production of sour beer, as well as its lactic acid content. In some studies the levels ranged from 7500 to 3900 mg L−1 [66], while in other cases up to 5000 mg L−1 [67]. The acidification of beers not only affects taste and mouthfeel, but also reduces the risk of haze formation. It also provides stability to the foam, fine foam bubbles, a fresher mouthfeel, smoother bitterness and fuller flavour profile [68].
The bitterness values found in the sour beers (ranging from 10 to 16.10 IBU) were around half of those obtained with the control strain S-04 (21.1 IBU), with initial values of 32.77 ± 2.58 IBU. Values found in this style of beer were also lower than those found in Saccharomyces (from 17.30 to 34.40 IBU) and non-Saccharomyces fermented beers (from 20.4 to 29.30 IBU). As mentioned above, lactic acid plays a role in reducing the bitterness of beers. This reduction can also be influenced by the yeast cells, as the α-acid molecules from the hops can stick to the walls of the yeast cells and settle at the bottom of the fermenter [69,70,71].
As could be observed in the fermentation kinetics, the L. thermotolerans strains fermented the wort to a lesser degree than strain S-04, which translates, as can be seen in Table 1, into a higher residual sugar content (ranging from 17.5 to 19 g L−1) compared to S-04 (15.57 g L−1). The fact that these strains have fermented the sugars to a lesser extent can lead to beers with a greater sweetness and viscosity, which contributes to the body and mouthfeel of the beer [72,73].
The observed ethanol values are indirectly related to residual sugars, ranging from 3.85 to 5.35% (v/v) for the Lachancea strains, while for S-04 it is 6.37% (v/v). These values were similar to those found by Domizio et al. in their studies [22], as well as those carried out with lactic acid bacteria and yeasts [62].

3.1.2. Volatile Compounds

For the contents of the main volatile compounds in the beers, the data in Table 2 show the concentration for the different yeast strains studied.
According to different studies of sour beer fermented with lactic bacteria and yeasts, the main compounds obtained are mainly associated with carbohydrate metabolism (esters, aldehydes and ketones) and amino acid metabolism (higher alcohols and aldehydes) [74,75]. Yeasts will mainly produce higher alcohols, esters, aldehydes and fatty acids, while lactic acid bacteria produce aldehydes and organic acids [76,77]. As detailed below, L. thermotolerans yeasts have been able to produce the majority of these compounds without the need for bacterial intervention.
Higher alcohols are the most abundant compounds found in the beer. In this study, strain 1-10B stood out for its higher production (158.13 mg L−1) compared to the control strain S-04 (139.08 mg L−1). Likewise, strains 1-7B (128.94 mg L−1) and 1-9B (122.69 mg L−1) were also close to these values. The main differences observed between strains were in isoamyl alcohol production, whose threshold is 70 mg L−1 [78] and was exceeded in strains 1-7B and 1-10B (84.32 and 79.21 mg L−1, respectively). Although strains 1-8B and 1-9B did not exceed this threshold (64.13 and 67.72 mg L−1), concentrations higher than those of strain S-04 (60.67 mg L−1) were obtained, but with no significant differences. Isoamyl alcohol imparts alcohol, banana and sweet flavours to beer, being one of the most abundant higher alcohols found in beer along with isobutanol and β-phenyl ethanol. For isobutanol (solvent aroma), all strains except 1-6B produced higher concentrations (ranging from 12.46 to 24.43 mg L−1) than the control strain S-04 (12.25 mg L−1), although in no case was the threshold exceeded (100 mg L−1) [79]. Similar values in isobutanol (16.56 to 16.67 mg L−1) and isoamyl alcohol (from 52.99 to 54.87 mg L−1) were obtained by Holt et al. in their studies with L. thermotolerans [80]. Likewise, Callejo et al. showed higher isobutanol levels with L. thermotolerans (7.6 mg L−1 in 5 °P wort and 36.3 mg L−1 in 15 °P wort) in their studies [59].
Regarding ester production, the production of ethyl butyrate, whose concentrations were, in some cases, five times higher (2.71 mg L−1 for 1-7B strain) than those of strain S-04 (0.45 mg L−1), is noteworthy. This compound was also observed in high concentrations in the L. thermotolerans CLI 1232 and 9-6C strains in previous studies [24]. Ethyl butyrate contributes to papaya, pineapple and berry flavours, and was above its threshold of 0.4 mg L−1 in all strains [81]. The production of ethyl hexanoate (fruity, solvent flavours) by strains 1-7B, 1-8B and 1-9B (from 0.21 to 0.34 mg L−1) exceeded the perception threshold (0.21 mg L−1) [82], as did that of diethyl succinate (cheese, earthy, spicy flavours) by strain 1-7B (threshold 1.2 mg L−1). The values obtained for ethyl hexanoate are higher than those obtained in the study conducted by Gobbi et al. (0.17 mg L−1) [58], but still higher than those produced by Saccharomyces strains [83]. Another ester of note was ethyl lactate (fruity, butter flavours), which was only produced by one of the study strains (1-3B, 7.37 mg L−1), although in amounts below the threshold (250 mg L−1) [81]. Ethyl lactate is a characteristic compound of sour beers [84] and also increases during beer aging [85]. Although these ethyl esters remained under their individual flavour threshold, the effect thattheir combined increase may have on taste requires further research. In general, the ester concentration produced by the Lachancea strains was higher than that of the Saccharomyces S-04 strain.
Table 2. Main volatile compounds found in the beers obtained with the 10 yeast strains of L. thermotolerans and strain S-04 in 100 mL.
Yeast Strains1-1B1-2B1-3B1-4B1-5B1-6B1-7B1-8B1-9B1-10BS-04
Higher alcohols
Isobutanol12.54 ± 1.47 bc15.85 ± 1.76 bc12.46 ± 0.44 bc16.21 ± 1.84 bc14.43 ± 2.21 bc11.31 ± 0.66 c17.69 ± 2.38 abc18.65 ± 2.31 ab23.86 ± 5.28 a24.43 ± 2.95 a12.25 ± 2.60 bc
Isoamyl alcohol46.76 ± 5.61 cd49.95 ± 2.83 bcd41.92 ± 5.03 cd34.08 ± 21.96 d40.56 ± 4.16 cd41.66 ± 2.30 cd84.32 ± 11.81 a64.13 ± 7.03 abcd67.72 ± 8.36 abc79.21 ± 8.26 ab60.67 ± 18.16 abcd
Benzyl alcoholndndndnd0.16 ± 0.14nd0.03 ± 0.050.18 ± 0.32ndndnd
β-phenylethanol31.02 ± 3.97 b32.16 ± 1.26 ab28.54 ± 4.65 b26.93 ± 3.62 b30.62 ± 1.63 b29.49 ± 0.56 b26.90 ± 5.53 b30.25 ± 0.00 b31.11 ± 3.54 ab25.98 ± 5.97 b44.72 ± 10.75 a
Esters
Ethyl butyrate0.99 ± 0.11 cd1.04 ± 0.09 cd0.94 ± 0.04 cd1.43 ± 0.2 bc1.27 ± 0.14 c1.05 ± 0.05 cd2.71 ± 0.21 a2.16 ± 0.25 ab2.57 ± 0.64 a2.14 ± 0.62 ab0.45 ± 0.12 d
Ethyl hexanoate0.18 ± 0.04 ab0.14 ± 0.03 ab0.16 ± 0.06 ab0.15 ± 0.04 ab0.02 ± 0.04 abnd0.34 ± 0.29 ab0.21 ± 0.21 ab0.32 ± 0.05 abnd0.06 ± 0.04 ab
Ethyl lactatendnd7.37 ± 6.38 andndndndndndnd0.58 ± 0.83 a
Ethyl octanoate0.10 ± 0.020.05 ± 0.040.06 ± 0.05nd0.23 ± 0.39ndndnd0.18 ± 0.16ndnd
Diethyl succinatendndndndndnd1.31 ± 0.51 a0.70 ± 0.02 bndndnd
Fatty Acids
Butyric acidndndndndndndndnd1.66 ± 2.872.70 ± 4.67nd
Isovaleric acid0.14 ± 0.08 c0.26 ± 0.06 c0.16 ± 0.01 c0.39 ± 0.16 bc0.19 ± 0.22 c0.13 ± 0.03 cndnd0.78 ± 0.21 ab0.85 ± 0.34 and
Hexanoic acid1.62 ± 1.140.31 ± 0.140.02 ± 0.040.97 ± 1.060.49 ± 0.430.08 ± 0.022.21 ± 2.30nd1.15 ± 0.69nd0.45 ± 0.23
Octanoic acidndndndndndnd0.86 ± 0.81 abndnd0.07 ± 0.13 b1.05 ± 0.59 a
Decanoic acidndndnd0.14 ± 0.24ndnd1.06 ± 0.94ndnd0.28 ± 0.481.85 ± 3.07
Aldehydes/Ketones
Acetoin6.19 ± 0.63 a5.15 ± 0.74 ab5.02 ± 0.38 ab1.62 ± 2.81 bcndndnd6.19 ± 1.22 andnd3.81 ± 2.63 ab
Guaiacolndnd0.02 ± 0.04 b0.04 ± 0.07 bndndnd0.86 ± 0.75 andnd0.03 ± 0.04 b
Data are means ± standard deviations of three independent samples expressed in mg L−1. Compounds above their threshold levels in beer are marked in bold [78,79,81,82,85,86,87]. Data with different superscript letters within each column are significantly different (Tukey tests: p < 0.05). nd: not detected.
In terms of fatty acid production, strains 1-2B, 1-3B, 1-5B, 1-6B and 1-8B had low or null production, while for the rest of the strains the values were similar to S-04. Although the values obtained were below their thresholds of perception, they were higher than those obtained in the study conducted by Ciosek et al. [88] in sour beer fermented with lactic bacteria. In general, the long-chain fatty acids come from the raw materials, while the short-chain fatty acids studied are produced by the yeasts during fermentation [64]. Fatty acids have a beneficial effect on yeast growth during fermentation, as well as a negative effect on the foam and sensory stability of the beer [85]. Fatty acids are responsible of caprylic flavour (hexanoic acid, octanoic acid and decanoic acid), and rancid, cheese and old flavours (isovaleric acid, isobutyric acid and butyric acid). Therefore, it is preferable that their thresholds are not exceeded [85].
The production of aldehydes and ketones in the sour beers studied was not high. Only the production of acetoin by some strains exceeded the production by the control strain S-04 (1-1B, 1-2B, 1-3B and 1-8B). None of them exceeded the threshold (50 mg L−1), but the concentrations were higher (from 1.62 to 6.19 mg L−1) than those observed in the study by Callejo et al. (7 mg L−1 for 5 °P wort and 5.5 mg L−1 for 15 °P wort) [59]. No diacetyl concentrations were detected, so it could have been reabsorbed by the yeast cells and reduced to acetoin [89]. Several studies carried out with lactic acid bacteria to obtain sour beer have observed different concentrations of acetoin in beer, which can vary from 1.4 to 25 mg L−1, but was always below the threshold [62,90].
In terms of phenolic compounds, the production of guaiacol was studied. It was only detected in strains 1-3B, 1-4B and 1-8B, with concentrations above the threshold of 3.88 µg L−1 [87] (0.02, 0.04, 0.86 µg L−1, respectively).

3.1.3. Melatonin Production

Melatonin is a sleep-regulating hormone that can modulate circadian and seasonal rhythms. It also has antioxidant properties and can be produced in beer during alcoholic fermentation by yeasts [91]. For this reason, it is interesting to study these compounds in beer, which can, therefore, be considered as a functional food.
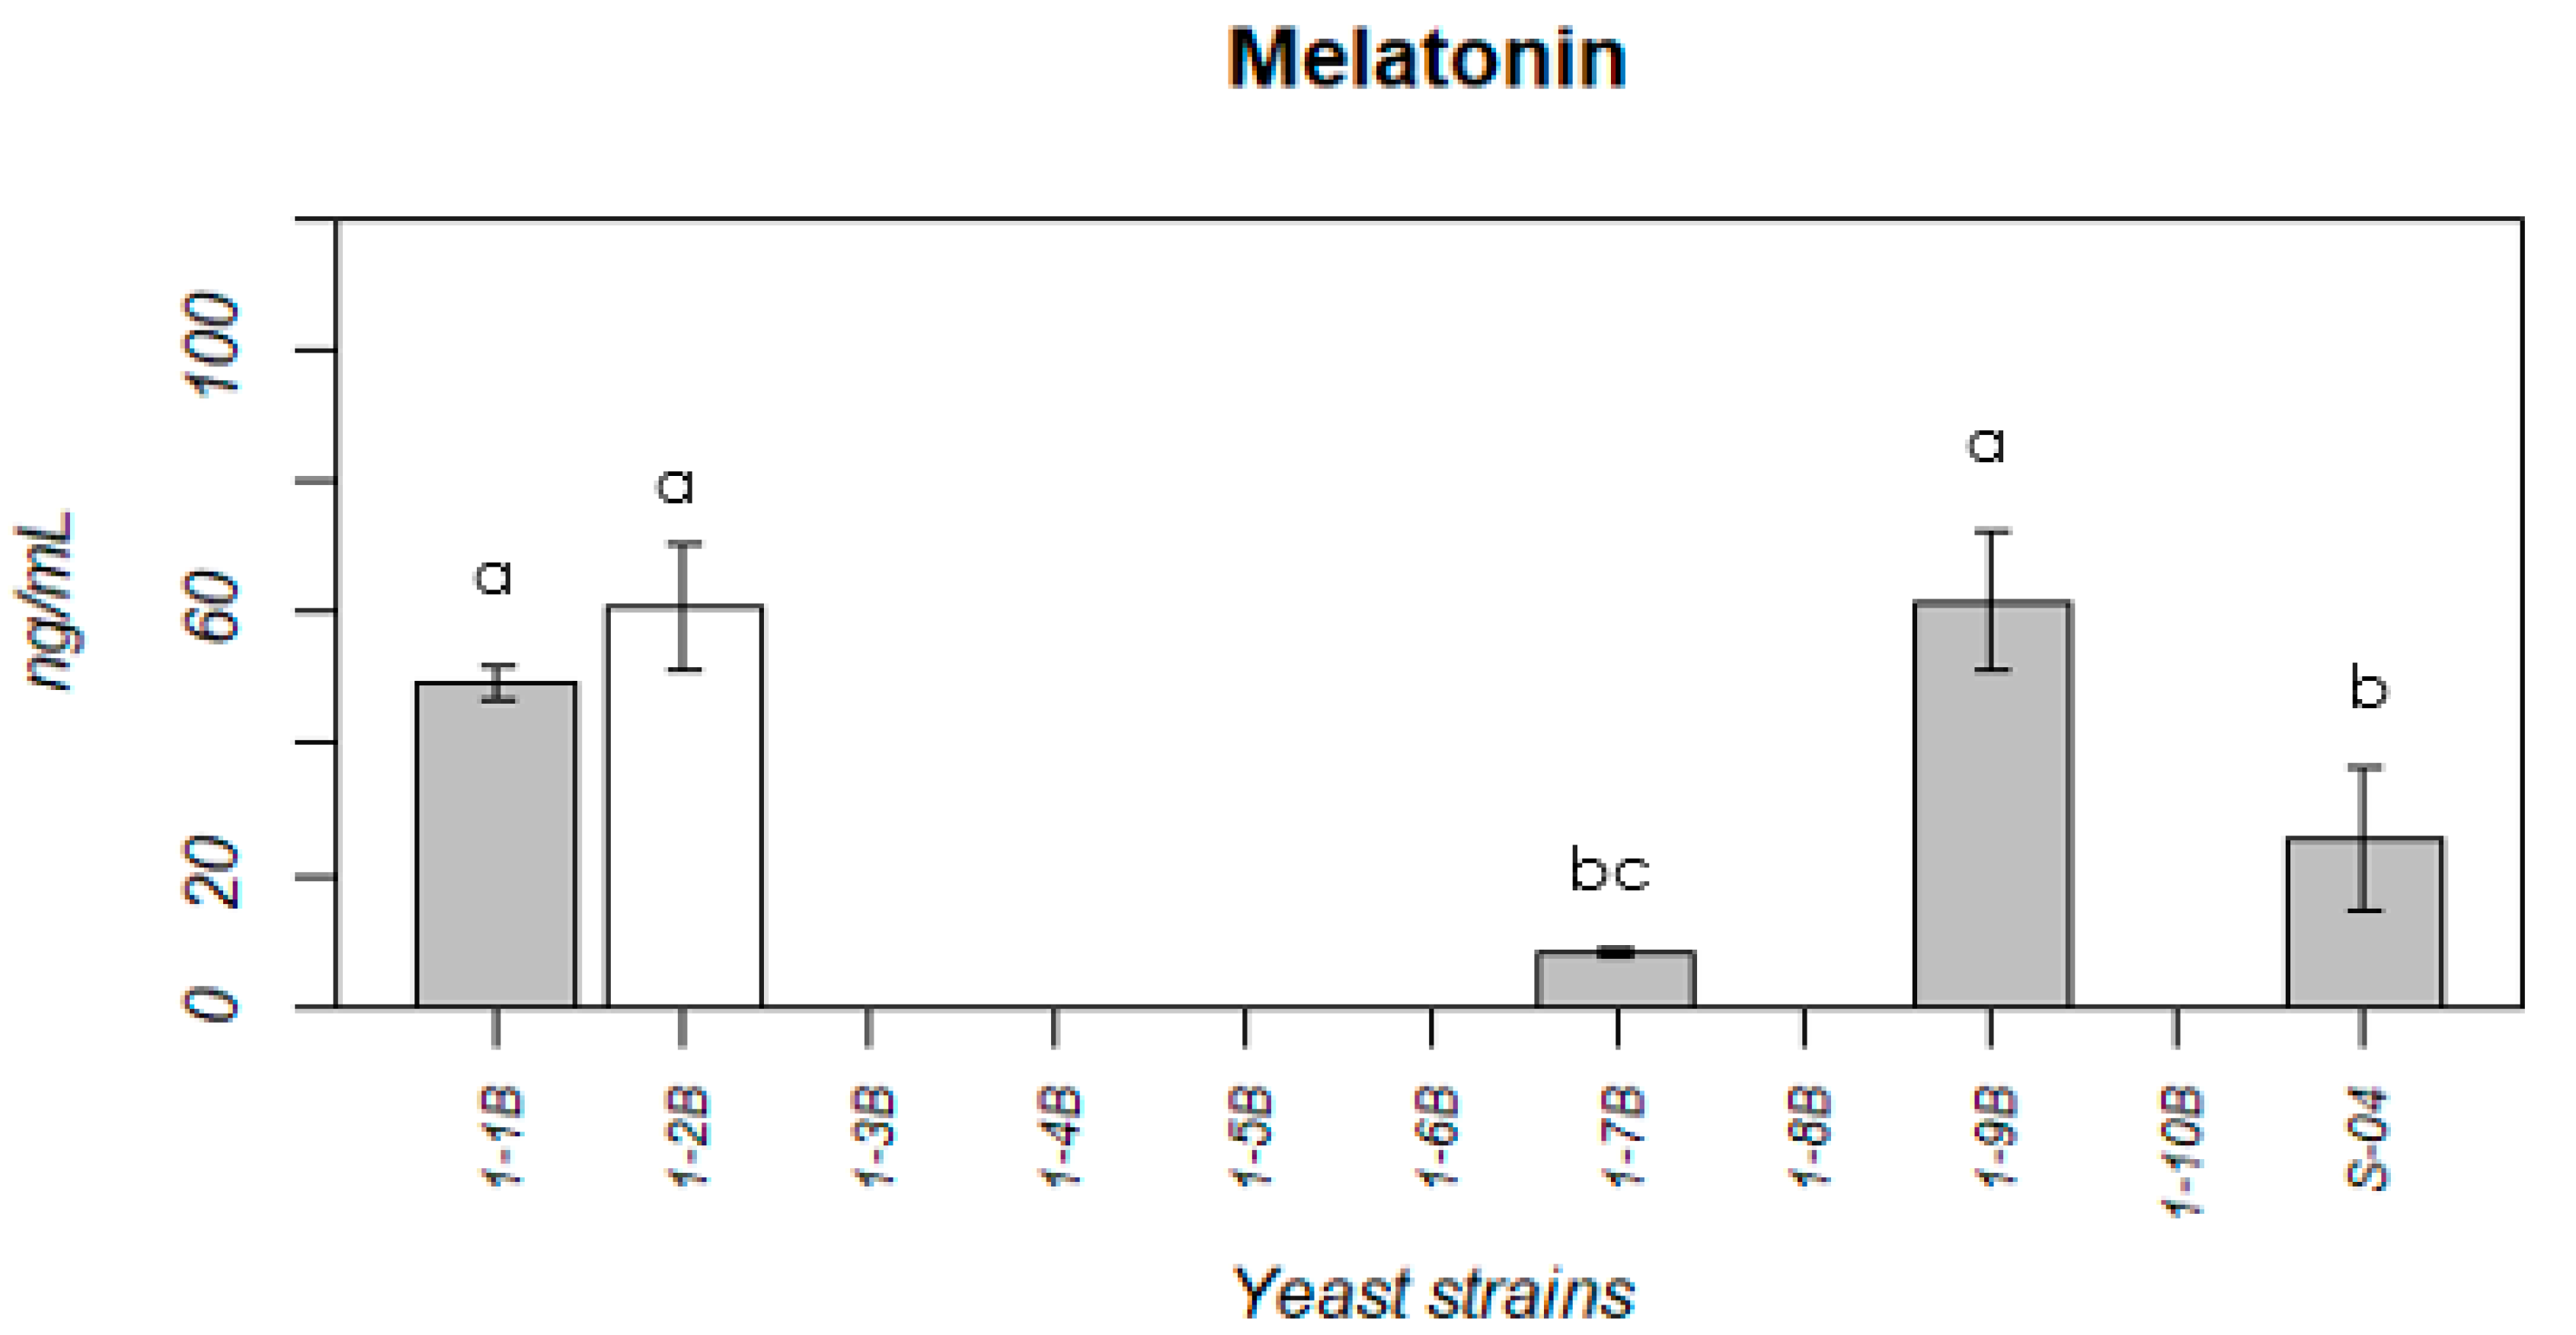
Figure 2 shows the concentration of melatonin produced by the different strains of L. thermotolerans. As with the other non-Saccharomyces yeast strains isolated from Madrid agriculture (IMIDRA Autochthonous Yeast Collection) [24], the concentrations obtained by the L. thermotolerans strains were higher than those obtained by the Saccharomyces strains [83]. However, the melatonin-producing non-Saccharomyces strains were lower.
Only in strains 1-1B, 1-2B, 1-7B and 1-9B were melatonin values between 8.07 and 61.73 ng mL−1 detected, while values for S-04 were between 25.03 ng mL−1. On the other hand, no melatonin production was detected in the yeast strains 1-3B, 1-4B, 1-5B, 1-6B, 1-8B and 1-10B. This fact may be due to the origin from which they were isolated and/or their use, thus presenting different mechanisms of adaptation to the fermentation medium in the different strains, as described by Vigentini et al. [92] and Morcillo-Parra et al. [93] in their studies. Comparing these results with those obtained in other studies of melatonin in beer with the ELISA method, higher values have been obtained [91]. Likewise, these values are higher than the average values found in other foods (bread, tomato, black tea) analysed with liquid chromatography [48]. For this reason, the moderate consumption of beer together with a balanced diet can contribute to increased melatonin levels in the body and health benefits [91].

3.2. Lab Scale Fermentation in 1 L

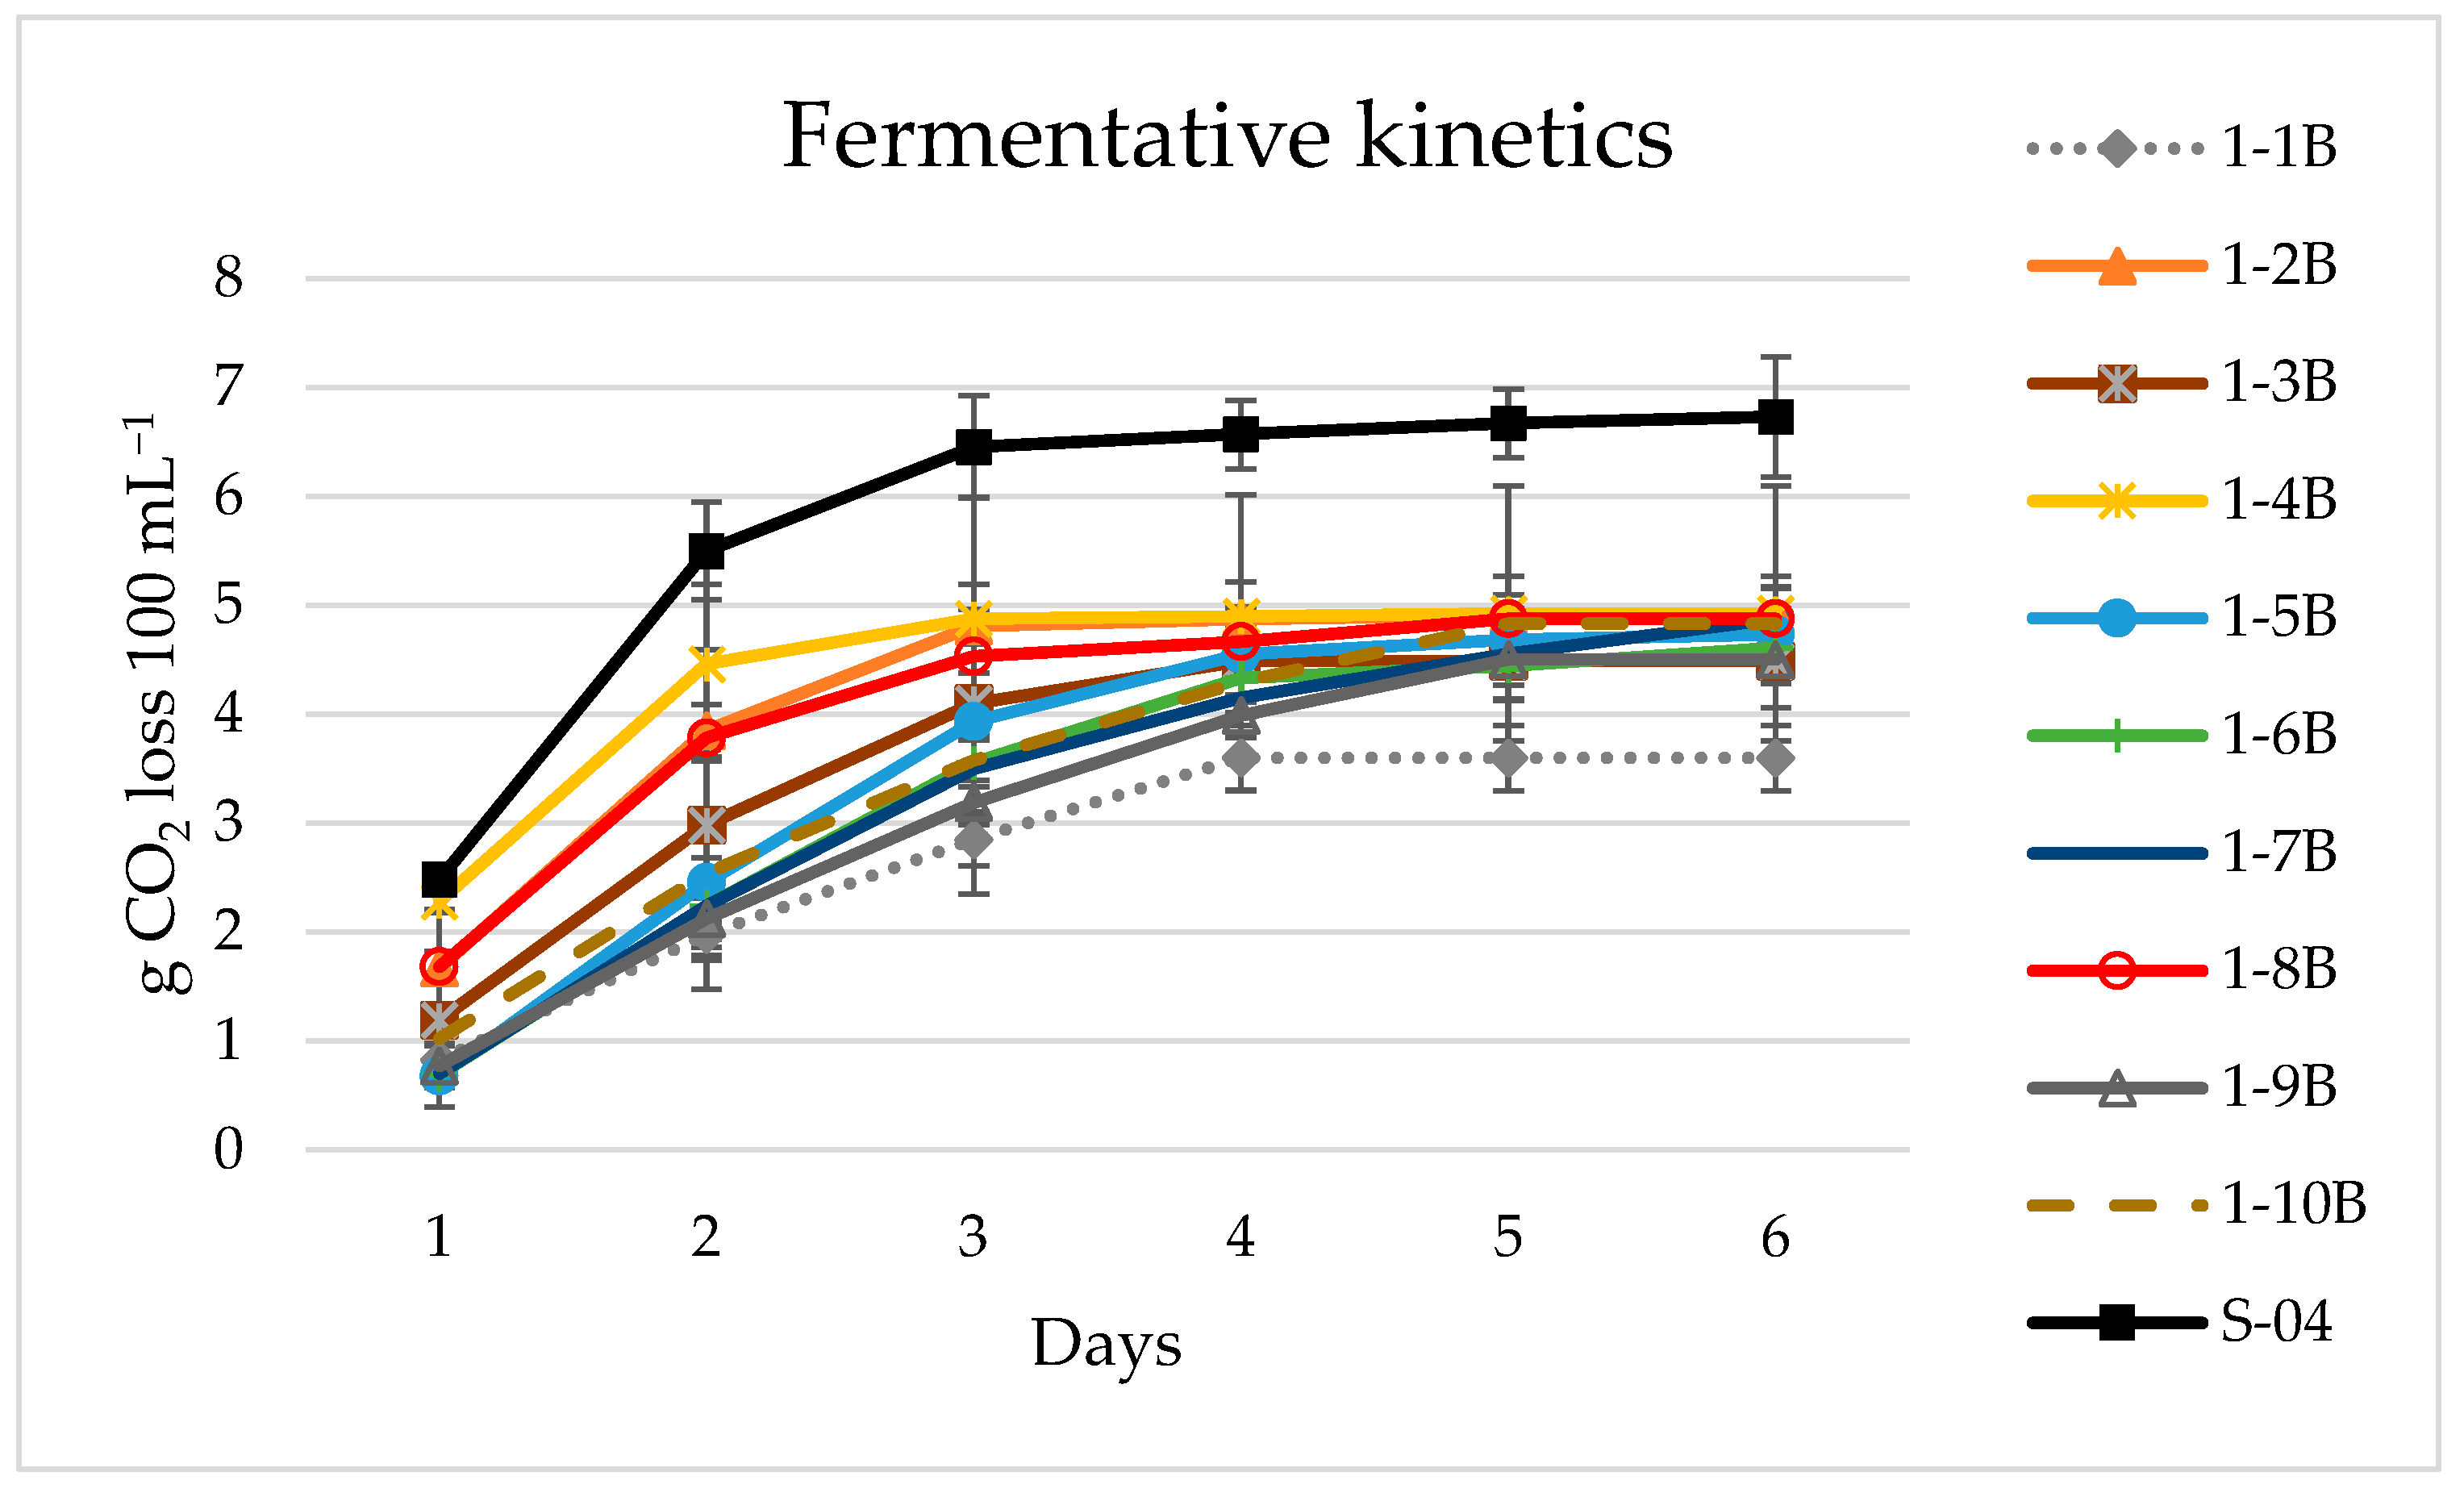
The L. thermotolerans yeast strains fermented in 100 mL showed good fermentation kinetics, similar to the S-04 commercial strain. They also presented outstanding aromatic characteristics, which is why they were subsequently tested in 1 L to determine their aromatic profile through sensory analysis. Fermentation conditions were 18 °C in a thermoregulated room, stirring at 120 rpm and daily lost weight. Figure 3 shows the fermentative kinetics for the different strains in 1 L.
After the completion of fermentation, the beers were left to decant for 2–3 days at 14 °C and then bottled after the addition of 7 g L−1 of sterile glucose. Yeast viability was measured before bottling and populations ranged from 1.46 × 10⁷ to 3.85 × 10⁷ cells mL−1. Fermentation behaviour in 1 L was in correlation with the fermentation in 100 mL, with a total CO2 loss of 4.49 to 4.91 g 100 mL−1 compared to 6.73 g 100 mL −1 for the control strain. The slight increase in CO2 loss observed compared to 100 mL may be due to the sealing system that allows the CO2 to exit, as well as the weight measurements, since in 1 L it was automatic, while in 100 mL it was manual. Strain 1-1B showed a slightly lower fermentative capacity (3.60 g 100 mL−1) in the 100 mL trial.

3.2.1. Sensory Analysis

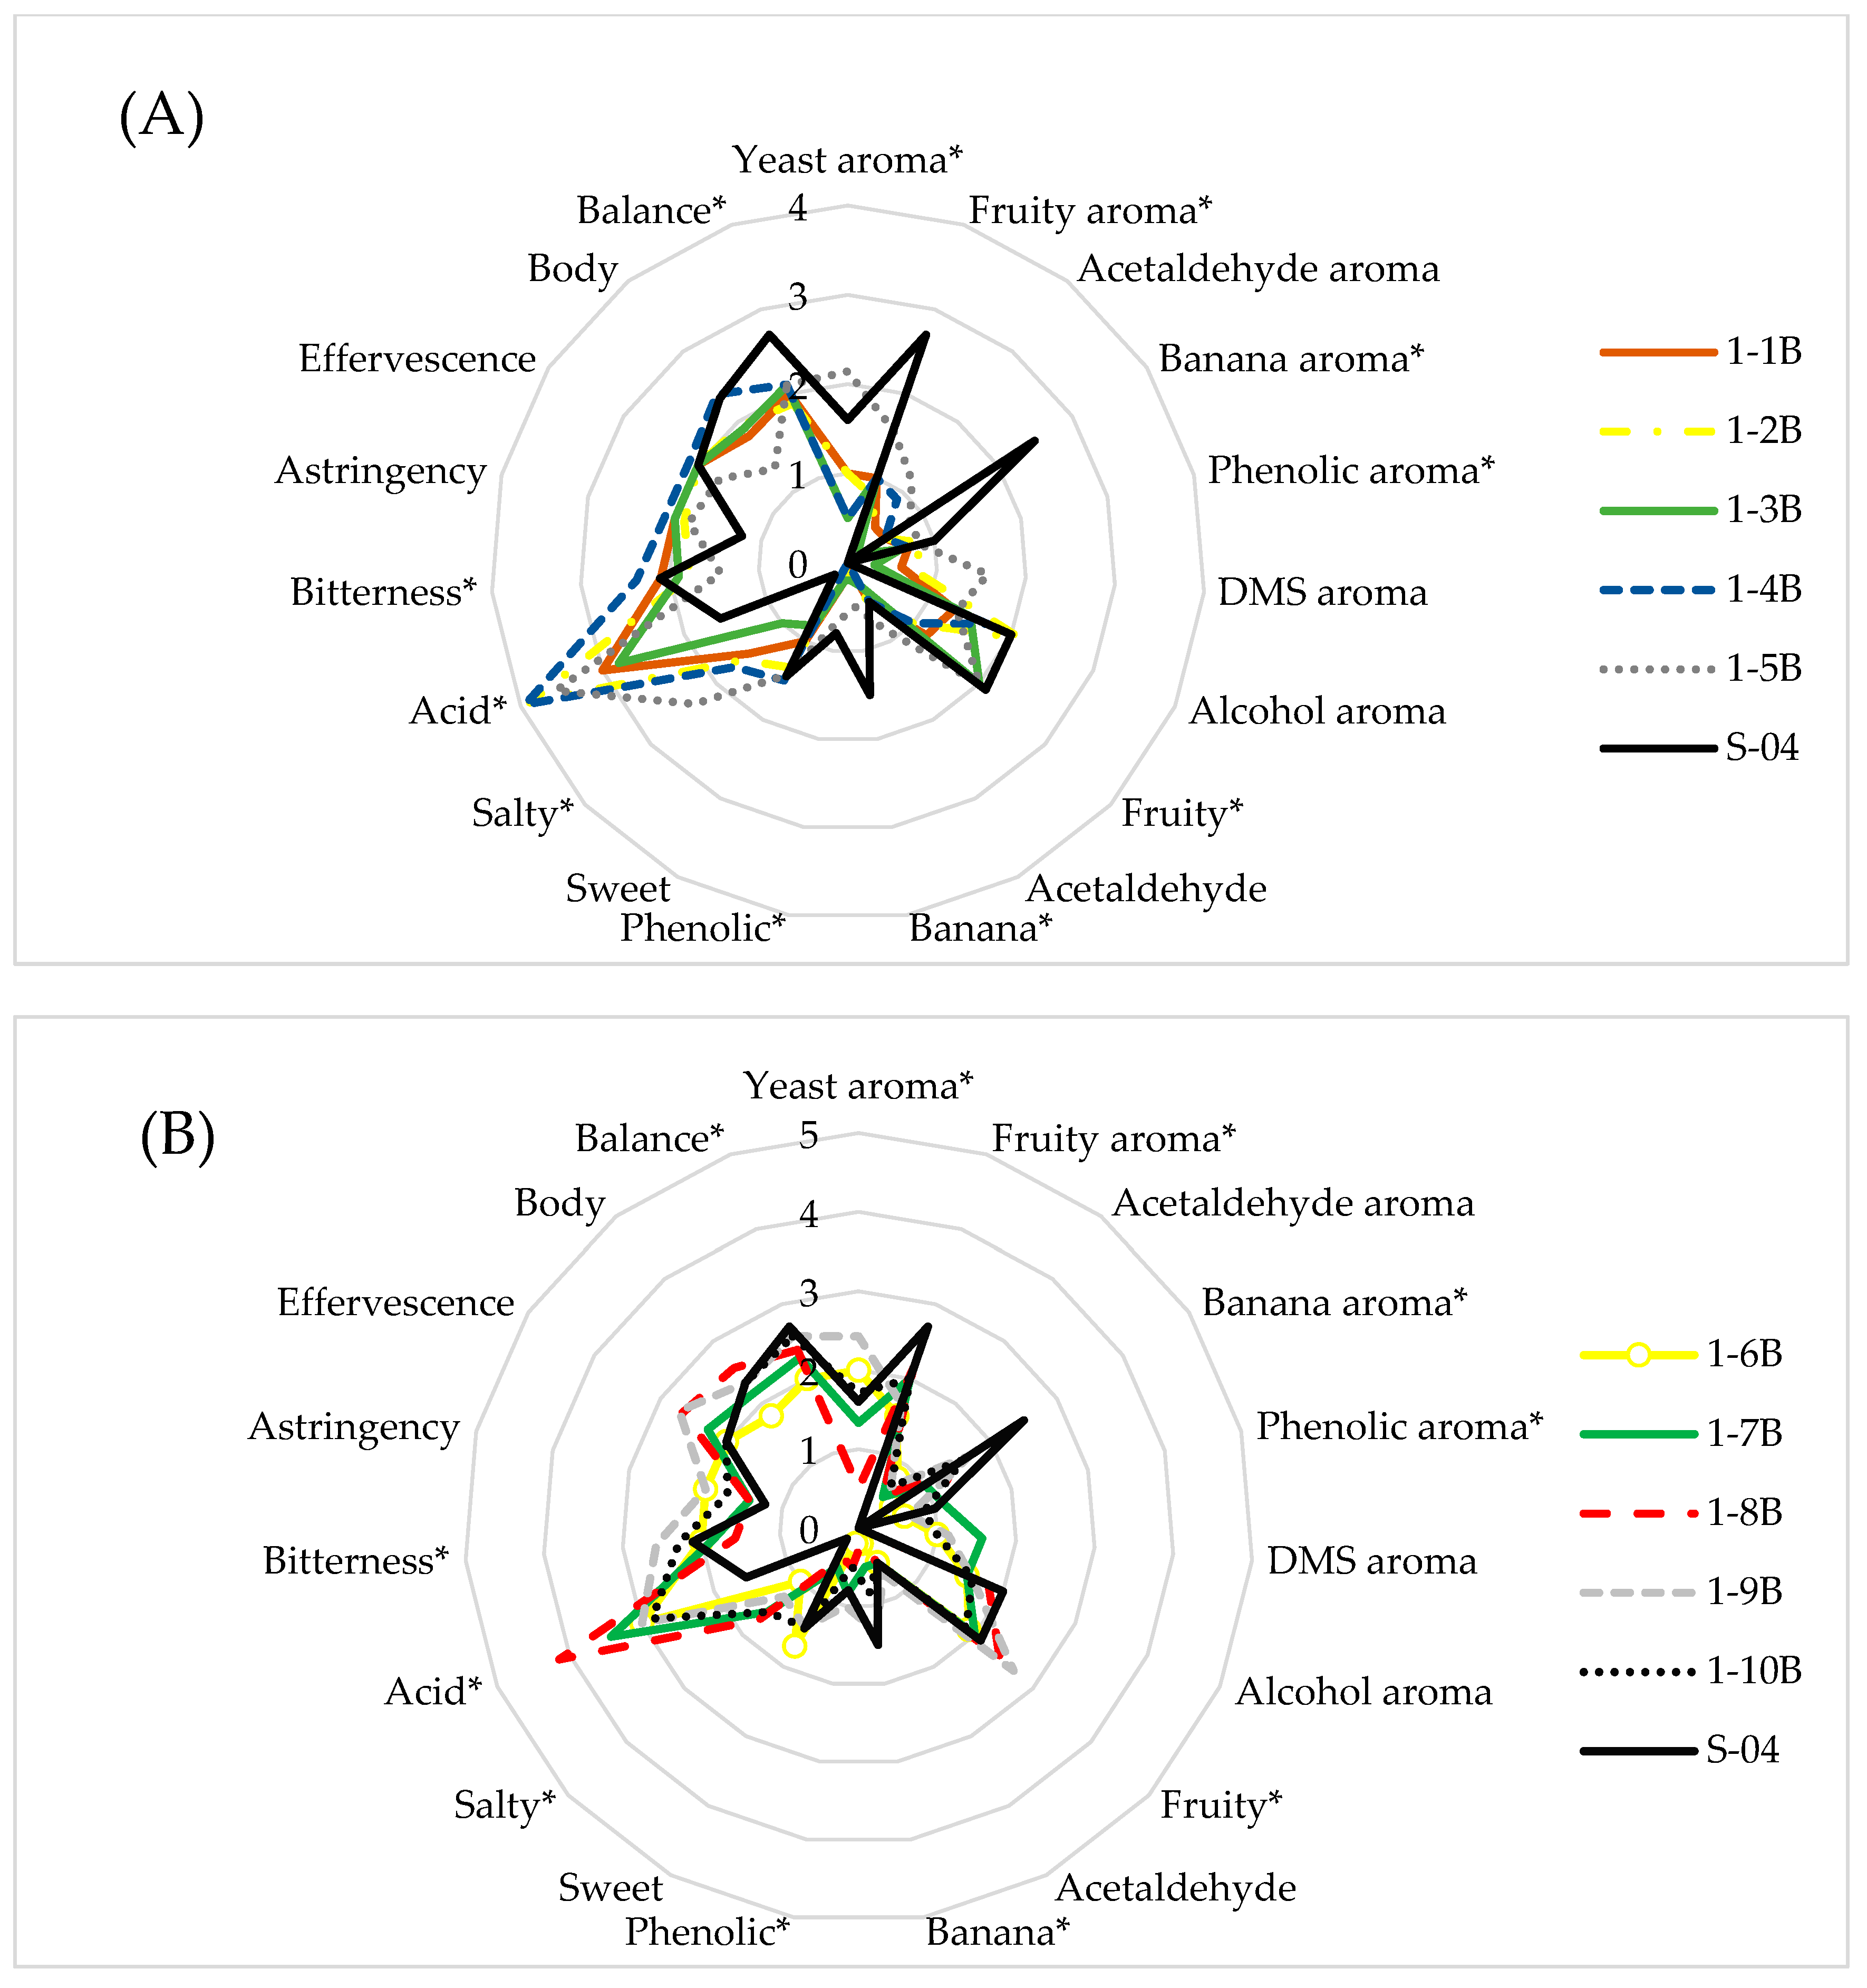
To determine the sensory suitability of the strains, the beers obtained were evaluated by the tasting panel. Figure 4 shows the radar chart of the results for the 10 L. thermotolerans strains studied.
The most outstanding characteristic of the beers was their marked acidity, with the beers fermented with 1-2B, 1-4B and 1-8B being the most highly valued in terms of acidity. Sour flavour is the perception obtained from the combination of the acid taste together with the retronasal volatile organic acids (lactic acid). Sour flavour is a very complex sensory property, associated with freshness as well as sweet and sour balance [94]. Another marked character was the fruity flavour, especially in strains 1-3B, 1-7B, 1-8B, 1-9B and 1-10B, which showed the highest concentration of esters in the 100 mL aroma analyses. They were also characterised by a low bitterness in the mouth, and salty notes. L. thermotolerans species are characterised by floral, honey and sweet aromas in beer [95], which is why the panel detected honey notes in strains 1-2B, 1-4B, 1-5B and 1-8B. It is also worth noting the banana notes found in beers 1-7B, 1-8B, 1-9B and 1-10, since although isoamyl acetate was only detected in the beer fermented with strain 1-8B, these beers also showed this character. The identification of this aroma in tasting may also be due to the high concentrations of isoamyl alcohol that can be produced by these strains, which can also give rise to banana flavours. Generally, these beers had a medium body and balance (aromas/flavours).

3.2.2. Beer Analysis

The present study aims to evaluate and select those yeast strains suitable for the production of sour-style beers, since during preliminary studies carried out with non-conventional yeasts [24], the capacity of the Lachancea yeast genus to produce lactic acid was observed (strains CLI 894, CLI 996, CLI 1232 and 9-6C). For this reason, strain CLI 1232 from previous studies and strain 1-8B from the present study were selected for their fermentative capacity, their high lactic acid content and the absence of undesirable aromas in the beer, such as fatty acids or high H2S production. They were also rated as the best by the panel of tasting experts, having good organoleptic characteristics with fruity aromas and a good balance. Considering these results, the following analyses focused on these two strains.
Table 3 shows the analyses carried out on beers (1 L) fermented with the selected strains and matured for one to three months. Comparing the results obtained in 1 L with those obtained in 100 mL, no major differences were observed, especially for strain CLI 1232. However, the lactic acid concentration and ethanol production decreased. This may be due to the fact that the 100 mL beers were analysed at the end of fermentation, without prior maturation. The maturation of the beers may affect lactic acid concentrations since the esterification reaction between lactic acid and ethanol forms ethyl lactate [96], which increased in concentration in the 1 L fermentation (Table 3). On the other hand, the concentration of residual sugars after fermentation for strain S-04 decreased remarkably from 15.57 g L−1 in 100 mL to 5.90 g L−1 in 1 L, which could be due to a better adaptation of the yeast to fermentation in 1 L (conditions and shape of the fermenter). Although residual sugars decreased, ethanol levels were stable [97].
The study of the VDKs (diacetyl and 2,3-pentanedione) was only performed in the 1 L trial and the results obtained indicated unremarkable values in relation to those obtained for other strains under the same conditions (0.20 to 0.70 mg L−1 in 1 L Saccharomyces fermentation and 0.10 to 0.39 mg L−1 in 1 L sequential fermentations). Regardless, the values obtained for VDKs were lower than the individual thresholds for diacetyl and 2,3-pentanedione (0.15 and 0.19 mg L−1, respectively) [98].
SO2 production by both strains was similar and below the threshold (20 mg L−1) [99]. Studies carried out by Dvořak et al. and L. F. Guido suggest that low SO2 concentrations in beer may contribute to its stabilisation over time [100,101].

3.2.3. Volatile Compounds

The selected L. thermotolerans yeast strains CLI 1232 and 1-8B were tested for the production of volatile compounds to contrast possible variations in scaling, as well as in tasting.
As in the previous analyses, no major differences were observed with respect to the 100 mL fermentation (Table 4), although different behaviour between strains was observed.
The total concentration of higher alcohols obtained in 1 L by strains CLI 1232 and 1-8B was higher (82.22 and 89.58 mg L−1, respectively) than that obtained in 100 mL (62.08 and 86.47 mg L−1, respectively). This difference is mostly due to the in-bottle refermentation process, as seen in the studies carried out by Bourbon-Melo et al. [102].
In terms of ester production, the total concentration in 1 L for strain 1-8B was five times higher (15.21 mg L−1) than that obtained in 100 mL (3.06 mg L−1). The increase in this concentration is mainly due to the increase in ethyl lactate concentration, as during beer maturation, ethanol and lactic acid react in an esterification process to give rise to ethyl lactate. In either case, for both study strains, ethyl butyrate was still above the threshold (0.4 mg L−1). Ethyl butyrate was the only ester found above the threshold. However, even though the other compounds did not exceed their thresholds, the synergism between them and with ethyl butyrate caused the beers to show a fruity profile in the sensory analysis. The ester concentrations of the control strain also increased from 1.48 to 3.71 mg L−1, mainly due to the increase in isoamyl acetate concentration. For strain S-04, the production of isoamyl acetate is noteworthy, the concentration of which increased above the threshold (1.81 mg L−1) when scaling up to the 1 L fermentation. Isoamyl acetate is formed during fermentation by yeast via an enzyme-catalysed reaction between acyl-CoA and isoamyl alcohol. Therefore, as the fermentation efficiency improved for the 1 L, the concentration of isoamyl alcohol increased and, consequently, the concentration of isoamyl acetate increased.
Fatty acid production was increased in all three strains. Regarding the concentration of fatty acids responsible for the so-called caprylic aroma (hexanoic, octanoic and decanoic acid), despite increasing their concentration, they remained below the threshold (8, 15 and 100 mg L−1, respectively). However, for the rest of the short-chain fatty acids, a generalised behaviour was observed for isovaleric acid, since it increased above the threshold (2.5 mg L−1) in all beers. However, this aroma was not detected in the tasting.
The total concentration of aldehydes and ketones measured in the beers was mainly due to the production of acetoin during the fermentation. This content decreased for strains 1-8B and S-04, while it increased for strain CLI 1232. This reduction is due to the maturation of the 1 L beer [103]. Although acetoin levels increased in strain CLI 1232, they were similar to those found in strain 1-8B, in neither case exceeding the threshold (50 mg L−1).
Guaiacol concentration showed different behaviours in the strains, as it increased for CLI 1232 (from not detected to 0.06 mg L−1) and S-04 (from 0.03 to 0.13 mg L−1), while it decreased in 1-8B (from 0.86 to 0.05 mg L−1). In any case, all values remained above the threshold (3.88 µg L−1), being similar for the CLI 1232 and 1-8B strains, and double for the control strain. However, although the values detected in strains CLI 1232 and 1-8B were above the threshold, the smoky aroma due to guaiacol was not detected during the tastings.
Comparing the results with other studies carried out with yeast strains of the genus Lachancea, both commercial and wild, it can be observed that the production of esters, as well as other aromatic compounds, is strain-dependent, obtaining varying concentrations of the different compounds [25,59].

3.2.4. Melatonin Content

In the study of melatonin production by the strains used in the production of sour beer in 1 L and in relation to the 100 mL assay, it was observed that for strain CLI 1232 it continued to be undetected, while for strain S-04 there was a reduction in concentration (from 25.32 to 20.41 ng mL−1), and there was an increase for the 1-8B strain (from 0.00 to 47.78 ng mL−1). These variations could be due to the manipulation of the beer for 1 L bottling and in 100 mL, as melatonin is sensitive to changes in light, temperature and the presence of oxygen [104].

3.2.5. Antioxidant Capacity

Beer is composed of several phenolic compounds that can be found naturally in fruits, vegetables, nuts, seeds and beverages [105,106]. They are the most studied components of the antioxidant fraction of beer and are derived from both the hop (20–30%) and malt (70–80%) components [105]. The yeast used in brewing can also influence the phenolic composition and antioxidant capacity of the final product [43]. Studies carried out by Viana et al. showed that the yeast strain used for pale ale brewing significantly influences the antioxidant capacity of the beers [65].
The antioxidant capacity of experimental beers obtained in 1 L by the selected strains is reported in Table 5.
The total antioxidant capacity (Qt) values were similar for the strains (12.15 to 12.50 mmol TE L−1) with no significant differences. Furthermore, these values were within the mean of the total antioxidant capacity values produced by the previously studied Saccharomyces strains [83]. In terms of slow-acting (Q2) and fast-acting (Q1) antioxidants, there were also no major differences between strains. As well as the values obtained for Saccharomyces strains, these values continued to be higher than those observed in other studies, ranging from 24.77 to 10,508.47 μmol TE L−1 [107].

3.3. Industrial Scale: 100 L

Non-conventional yeasts are of great industrial interest due to their ability to produce high concentrations of certain metabolites as well as aromatic compounds. However, many of the studies carried out with wild yeasts have only been tested on the laboratory scale and not at the industrial level, which would give us more precise information on their suitability for brewing [21,108,109].
The selected strains of L. thermotolerans (CLI 1232, 1-8B) were fermented in triplicate on an industrial scale in 100 L under fermentation conditions of 18–20 °C and daily density measurement (apparent extract) until stabilisation with S-04 as control strain.
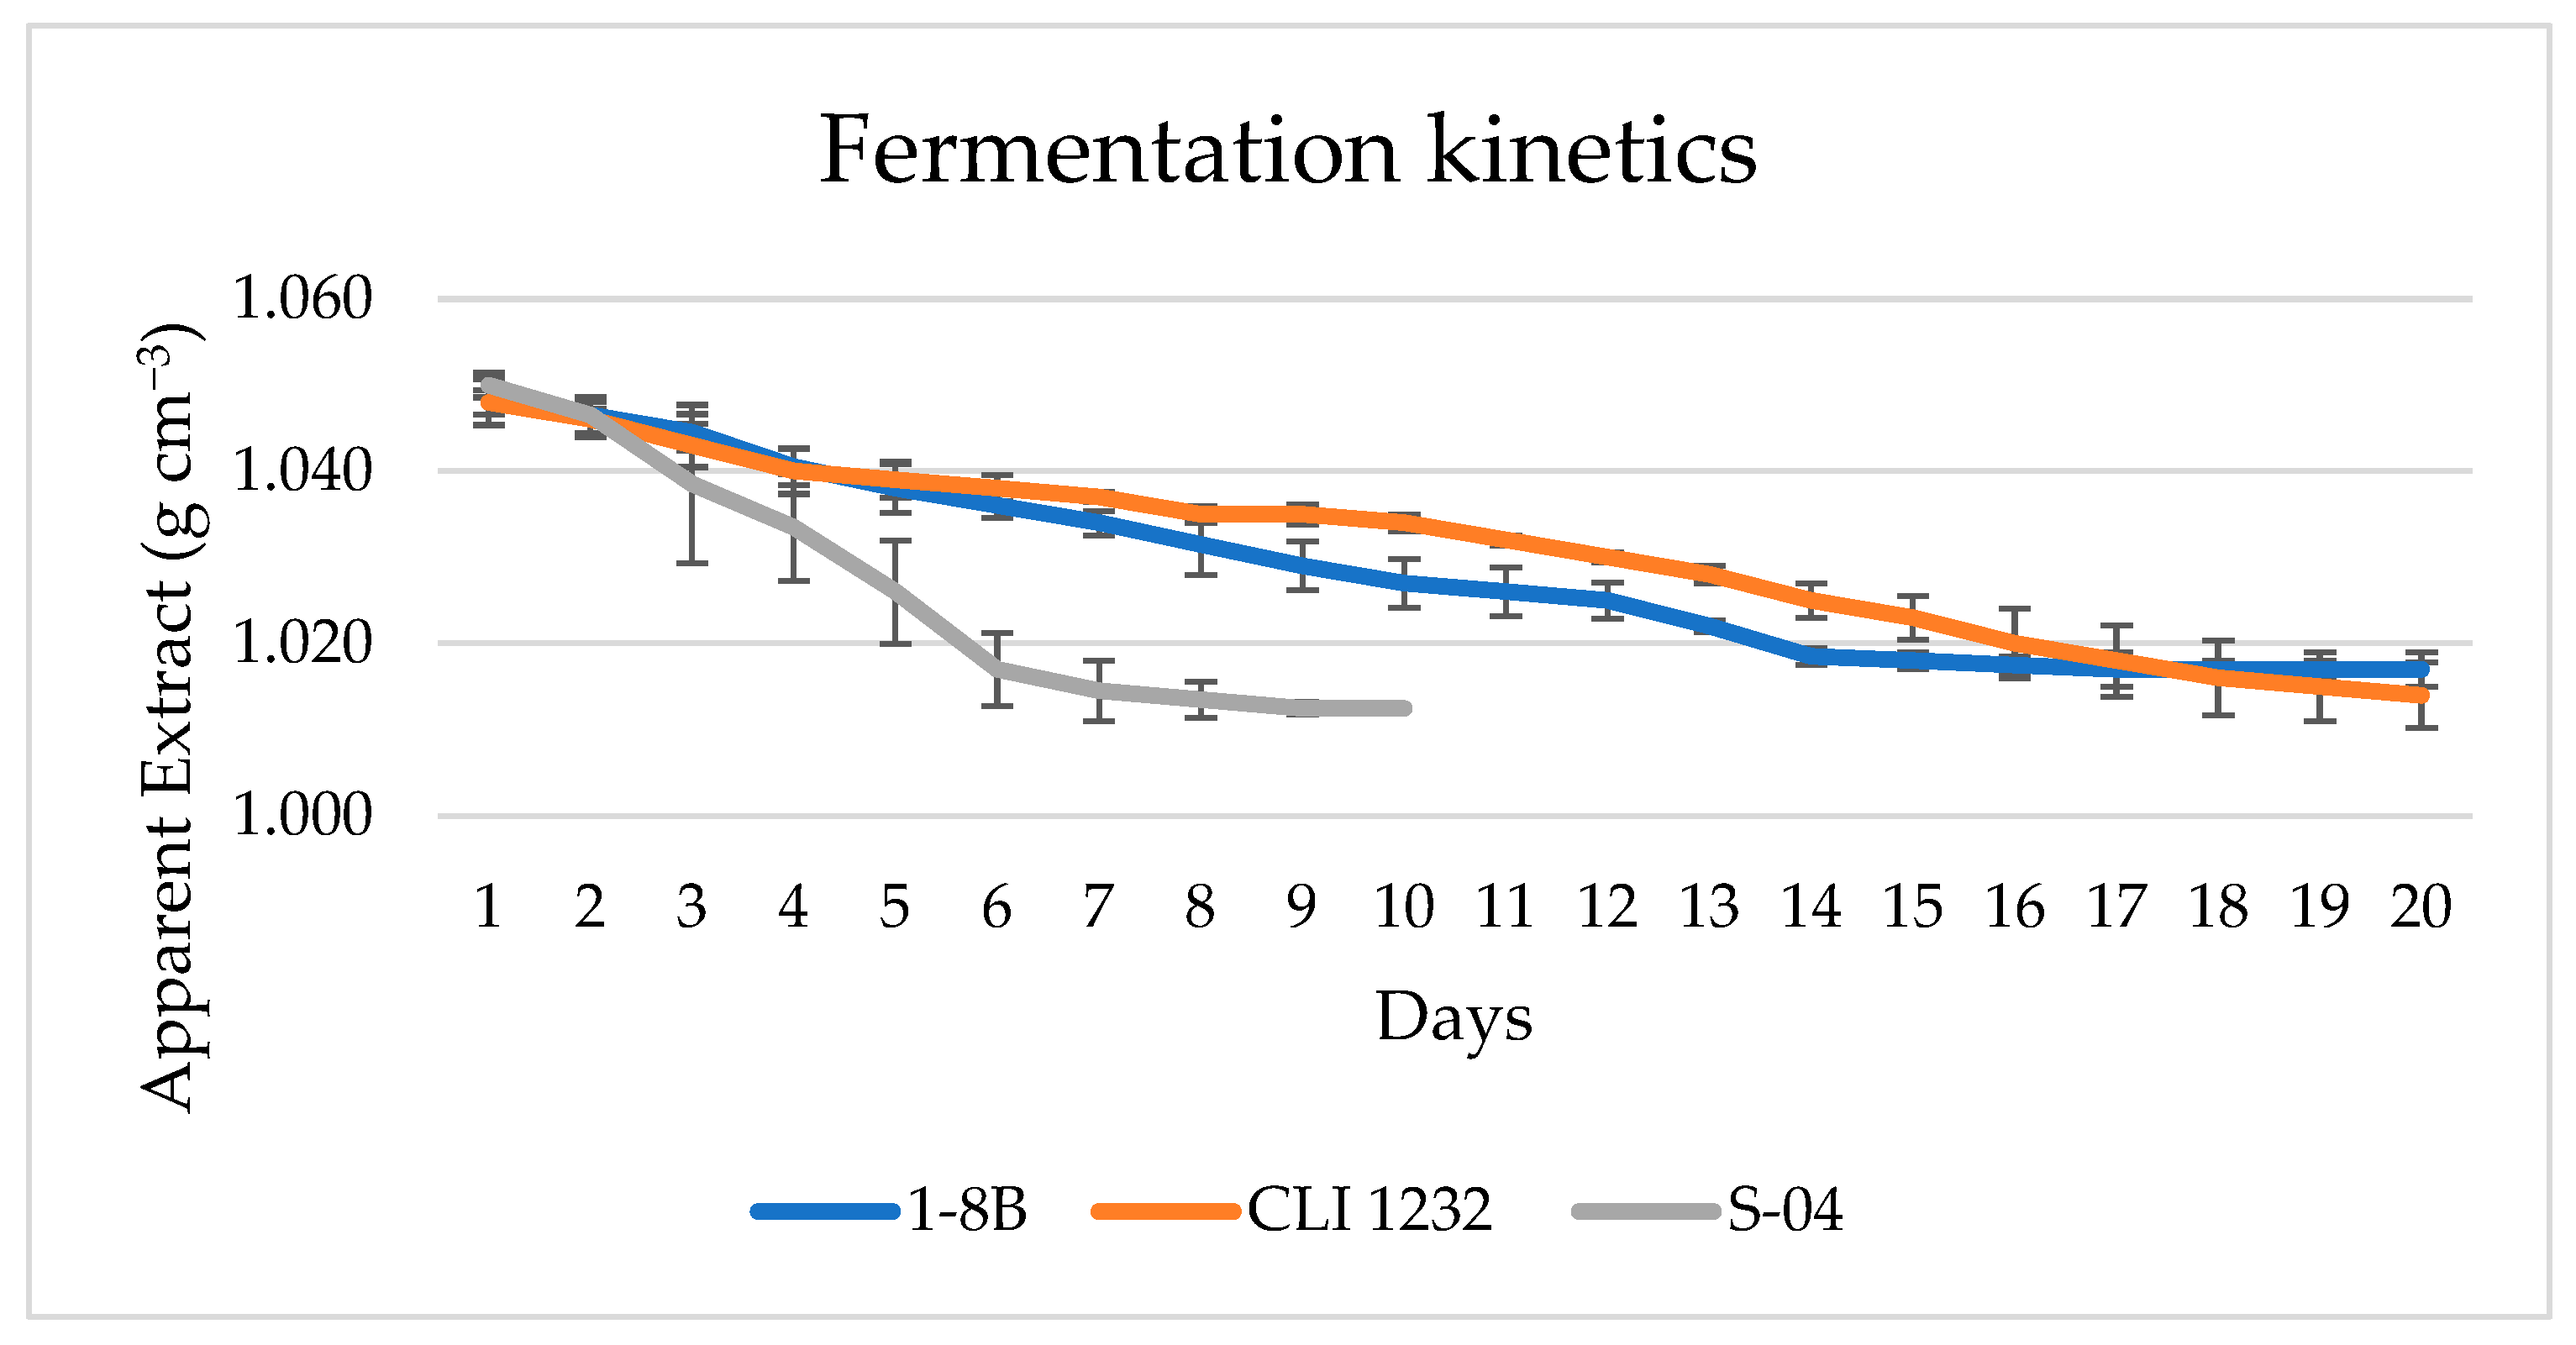
Figure 5 represents the fermentation kinetics of the L. thermotolerans strains and S-04 strain fermented in 100 L. Fermentation in 1 L lasted between five and six days, while in 100 L, without agitation, fermentation lasted up to 19–20 days. In contrast, for the control strain S-04 was five to six days, while in 100 L it was 9–10 days. These differences in fermentation kinetics are mainly due to the fact that there was not a homogeneous distribution of nutrients and cells in the 100 L fermentations, as well as there being low mass transfer volumetric coefficients, as reported in other studies [110,111]. Likewise, it can be observed that the fermentation capacity of Saccharomyces strain S-04 is greater than that of the Lachancea strains, since S-04 has the ability to ferment maltotriose [22,59].

3.3.1. Beer Analysis in 100 L

Table 6 shows the comparison of the main parameters analysed in beers fermented in 1 L and in 100 L. Strain CLI 1232 did not show large differences in the scaling, while the differences were more noticeable for certain parameters in strains 1-8B and S-04.
The agitation on the 100 L scale was mainly due to the CO2 bubbles rising during the fermentation process. However, this agitation did not occur homogeneously as it does on a laboratory scale [111]. Scaling produced different changes in the strains studied, being more noticeable in strains 1-8B and S-04 in terms of ethanol, higher alcohol and ester production.
As seen above, Lachancea species are not able to ferment maltose fully. This fact was observed in the 100 L scale-up, where the amounts of residual maltose were higher than in 1 L. This is why the ethanol concentration was consequently reduced in 100 L [110]. It should also be noted that carbonation in 1 L is achieved by bottle conditioning, which can increase the ethanol concentration by 0.5% (v/v) [112]. Strain S-04 also reported variations in ethanol concentration, as due to the inhomogeneous distribution of nutrients, the strain did not complete the fermentation of maltotriose, with the ethanol being reduced to 4.62% (v/v). Residual maltose could cause stability problems in the aroma of the beer over time; however, establishing the shelf-life of these craft beers at one year, no variations in the production of undesirable flavours are observed. In glycerol production, no major changes were observed between the two scales. However, the concentration by the Lachancea strains was higher than that obtained by the control Saccharomyces S-04 strain, as reported in other studies [57].
The colour values obtained were similar for all strains, being slightly lower for strain 1-8B. On the other hand, the biggest changes were those obtained when changing scale, since the beers fermented in 1 L were previously sterilised before fermentation, while in 100 L, wort was directly transferred to the fermenter after cooling. Sterilisation of the wort in 1 L favoured Maillard reactions, which darkened the wort [113]. Likewise, the precipitation of nitrogenous material is also favoured by sterilisation, resulting in a brighter beer [114].
The bitterness did not undergo major changes, except in the S-04 strain, as the fermentation capacity was lower. Thus, there was not a complete homogenisation of the wort, and it was not possible to reduce the bitterness as in the 1 L fermentation. As homogenization was reduced, the efficiency of the yeasts was not the same, with fewer α -acid molecules adhering to the yeast, thus not reducing bitterness once these cells have decanted [69,70,71].
Regarding the rest of the parameters analysed (melatonin content, antioxidant capacity), there were no major variations, but the production of certain volatile compounds such as higher alcohols and esters should be highlighted. In the 1 L fermentation, the concentrations of esters were higher than those obtained in 100 L, which is due to the fact that the origin of the esters is from the higher alcohols. Therefore, in the 100 L fermentation, as the homogenisation was not complete, the concentration of alcohols was higher, while that of esters was lower, as their production is not favoured.

3.3.2. Consumer Analysis

In order to determine whether a new beer is suitable for industrial brewery production, it is necessary to carry out an analysis to determine consumer acceptance, identifying whether such a product would be successful (or fail) and its market opportunities [115].
To test the sour beers fermented in 100 L with the CLI 1232 and 1-8B yeast strains, 142 volunteer consumers were recruited. The prerequisites for participating in the study were that the individual habitually consumed beer. The panel was composed of 28.17% females and 71.83% males, with an average consumer age of 30.61 years old ranging from 21 to 74 years old. Regarding the frequency of beer consumption, 92.25% of the panel reported frequently drinking beer, every day or during the weekend. A total of 52.11% consumed both commercial and craft beer, whereas 21.13% only consumed lager beer and 26.76% consumed only craft beers. Beer appearance was evaluated regarding foam consistency and visual impression. Consumers rated the consistency of the foam as light for CLI 1232 and light–fine for 1-8B beer, while the visual impression was rated mainly as hazy for both beers (Table 7).
The aroma intensity was rated as medium to medium–low for both beers. As in the expert panel tastings, these beers were rated as medium to medium–high in acidity and low in bitterness, as well as medium to medium–high in body and medium to medium–long for aftertaste. Therefore, for these parameters, both beers had similar ratings.
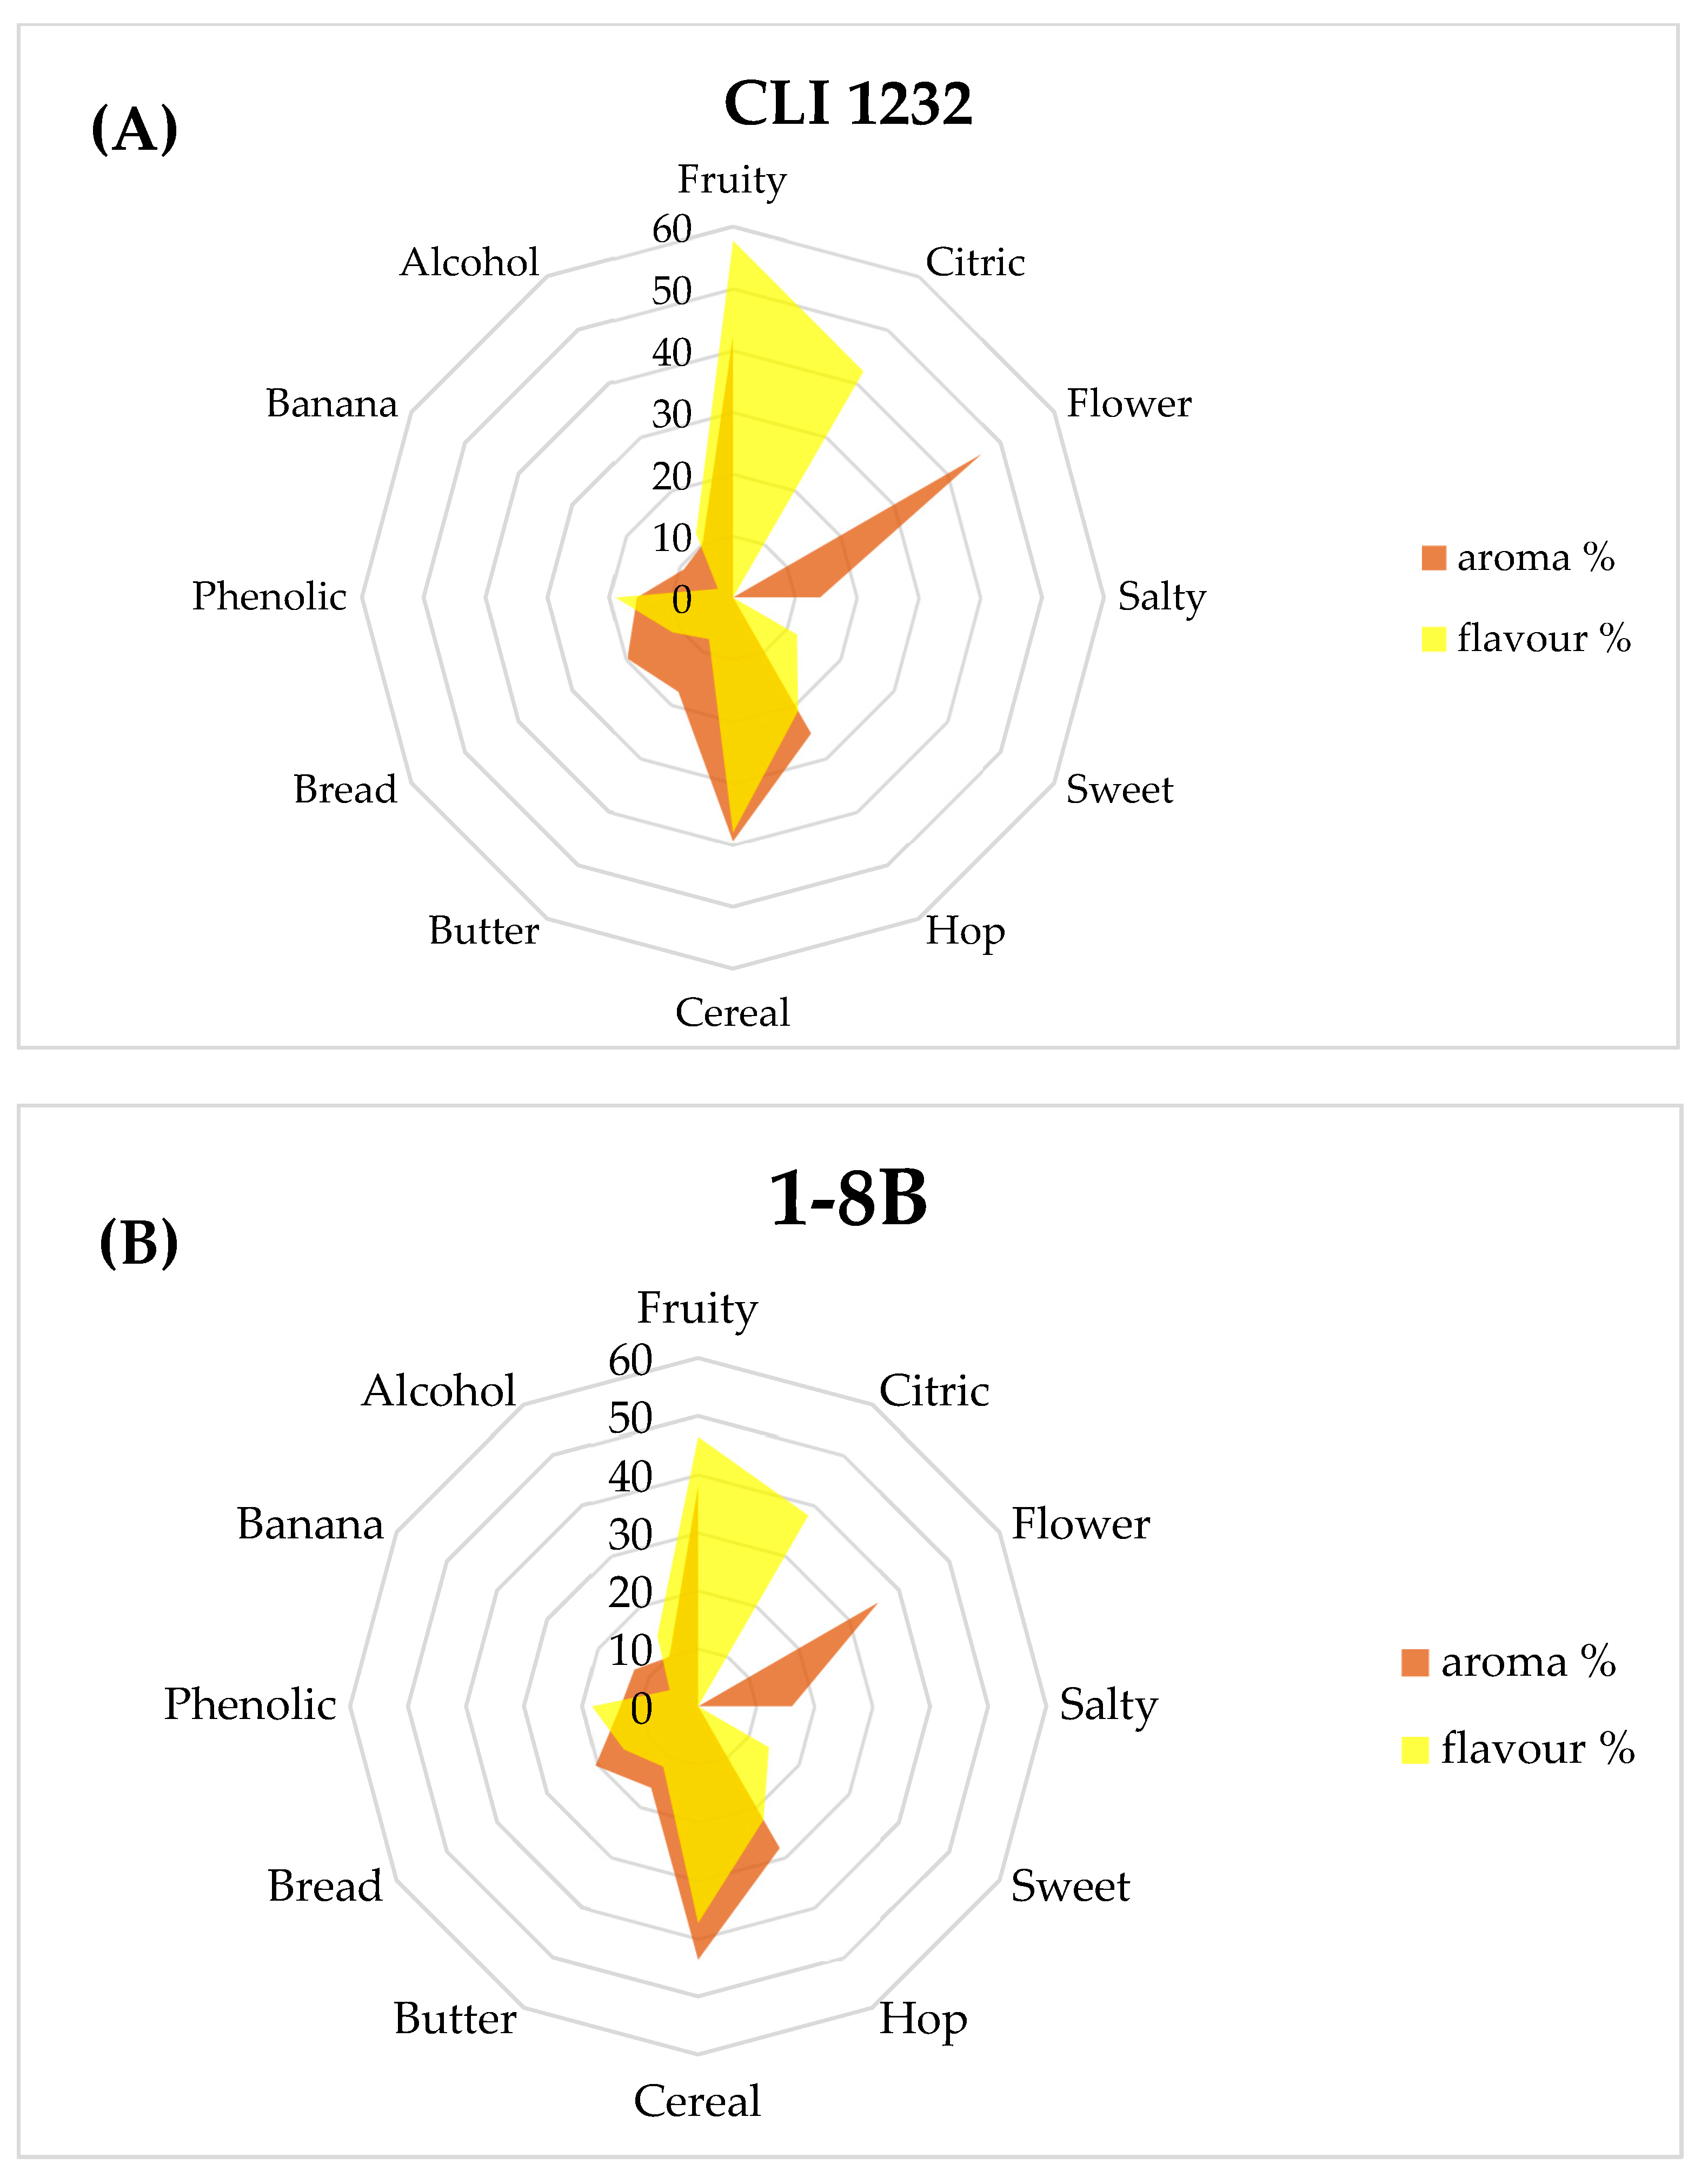
The attributes determining the aroma and flavour of the beers were where the biggest differences were obtained. The CLI 1232 beer was rated as fruitier in aroma and flavour than the 1-8B beer. Likewise, the CLI 1232 showed a higher acidity, salinity and floral aroma than 1-8B. Beer 1-8B stood out for having banana aromas, while CLI 1232 had less banana aroma, as well as honey notes (Figure 6).
Individual attributes, which may be considered good or bad, may have a different place in the overall perception of taste. For the tasted beers, the overall impression (from 1 to 9) was 5.43 points for CLI 1232 (Figure 6A) and 5.09 for 1-8B (Figure 6B). The purchase intention showed CLI 1232 as the preferred beer by 46.1%, while 30.5% would not buy either of the two beers. It should be noted that these beers were mainly preferred by consumers aged between 26 and 45.
Following the results obtained in the consumer tasting, the beer fermented with the CLI 1232 yeast strain was finally launched on the Madrid market by La Cibeles brewery.

3.3.3. Statistical Analysis

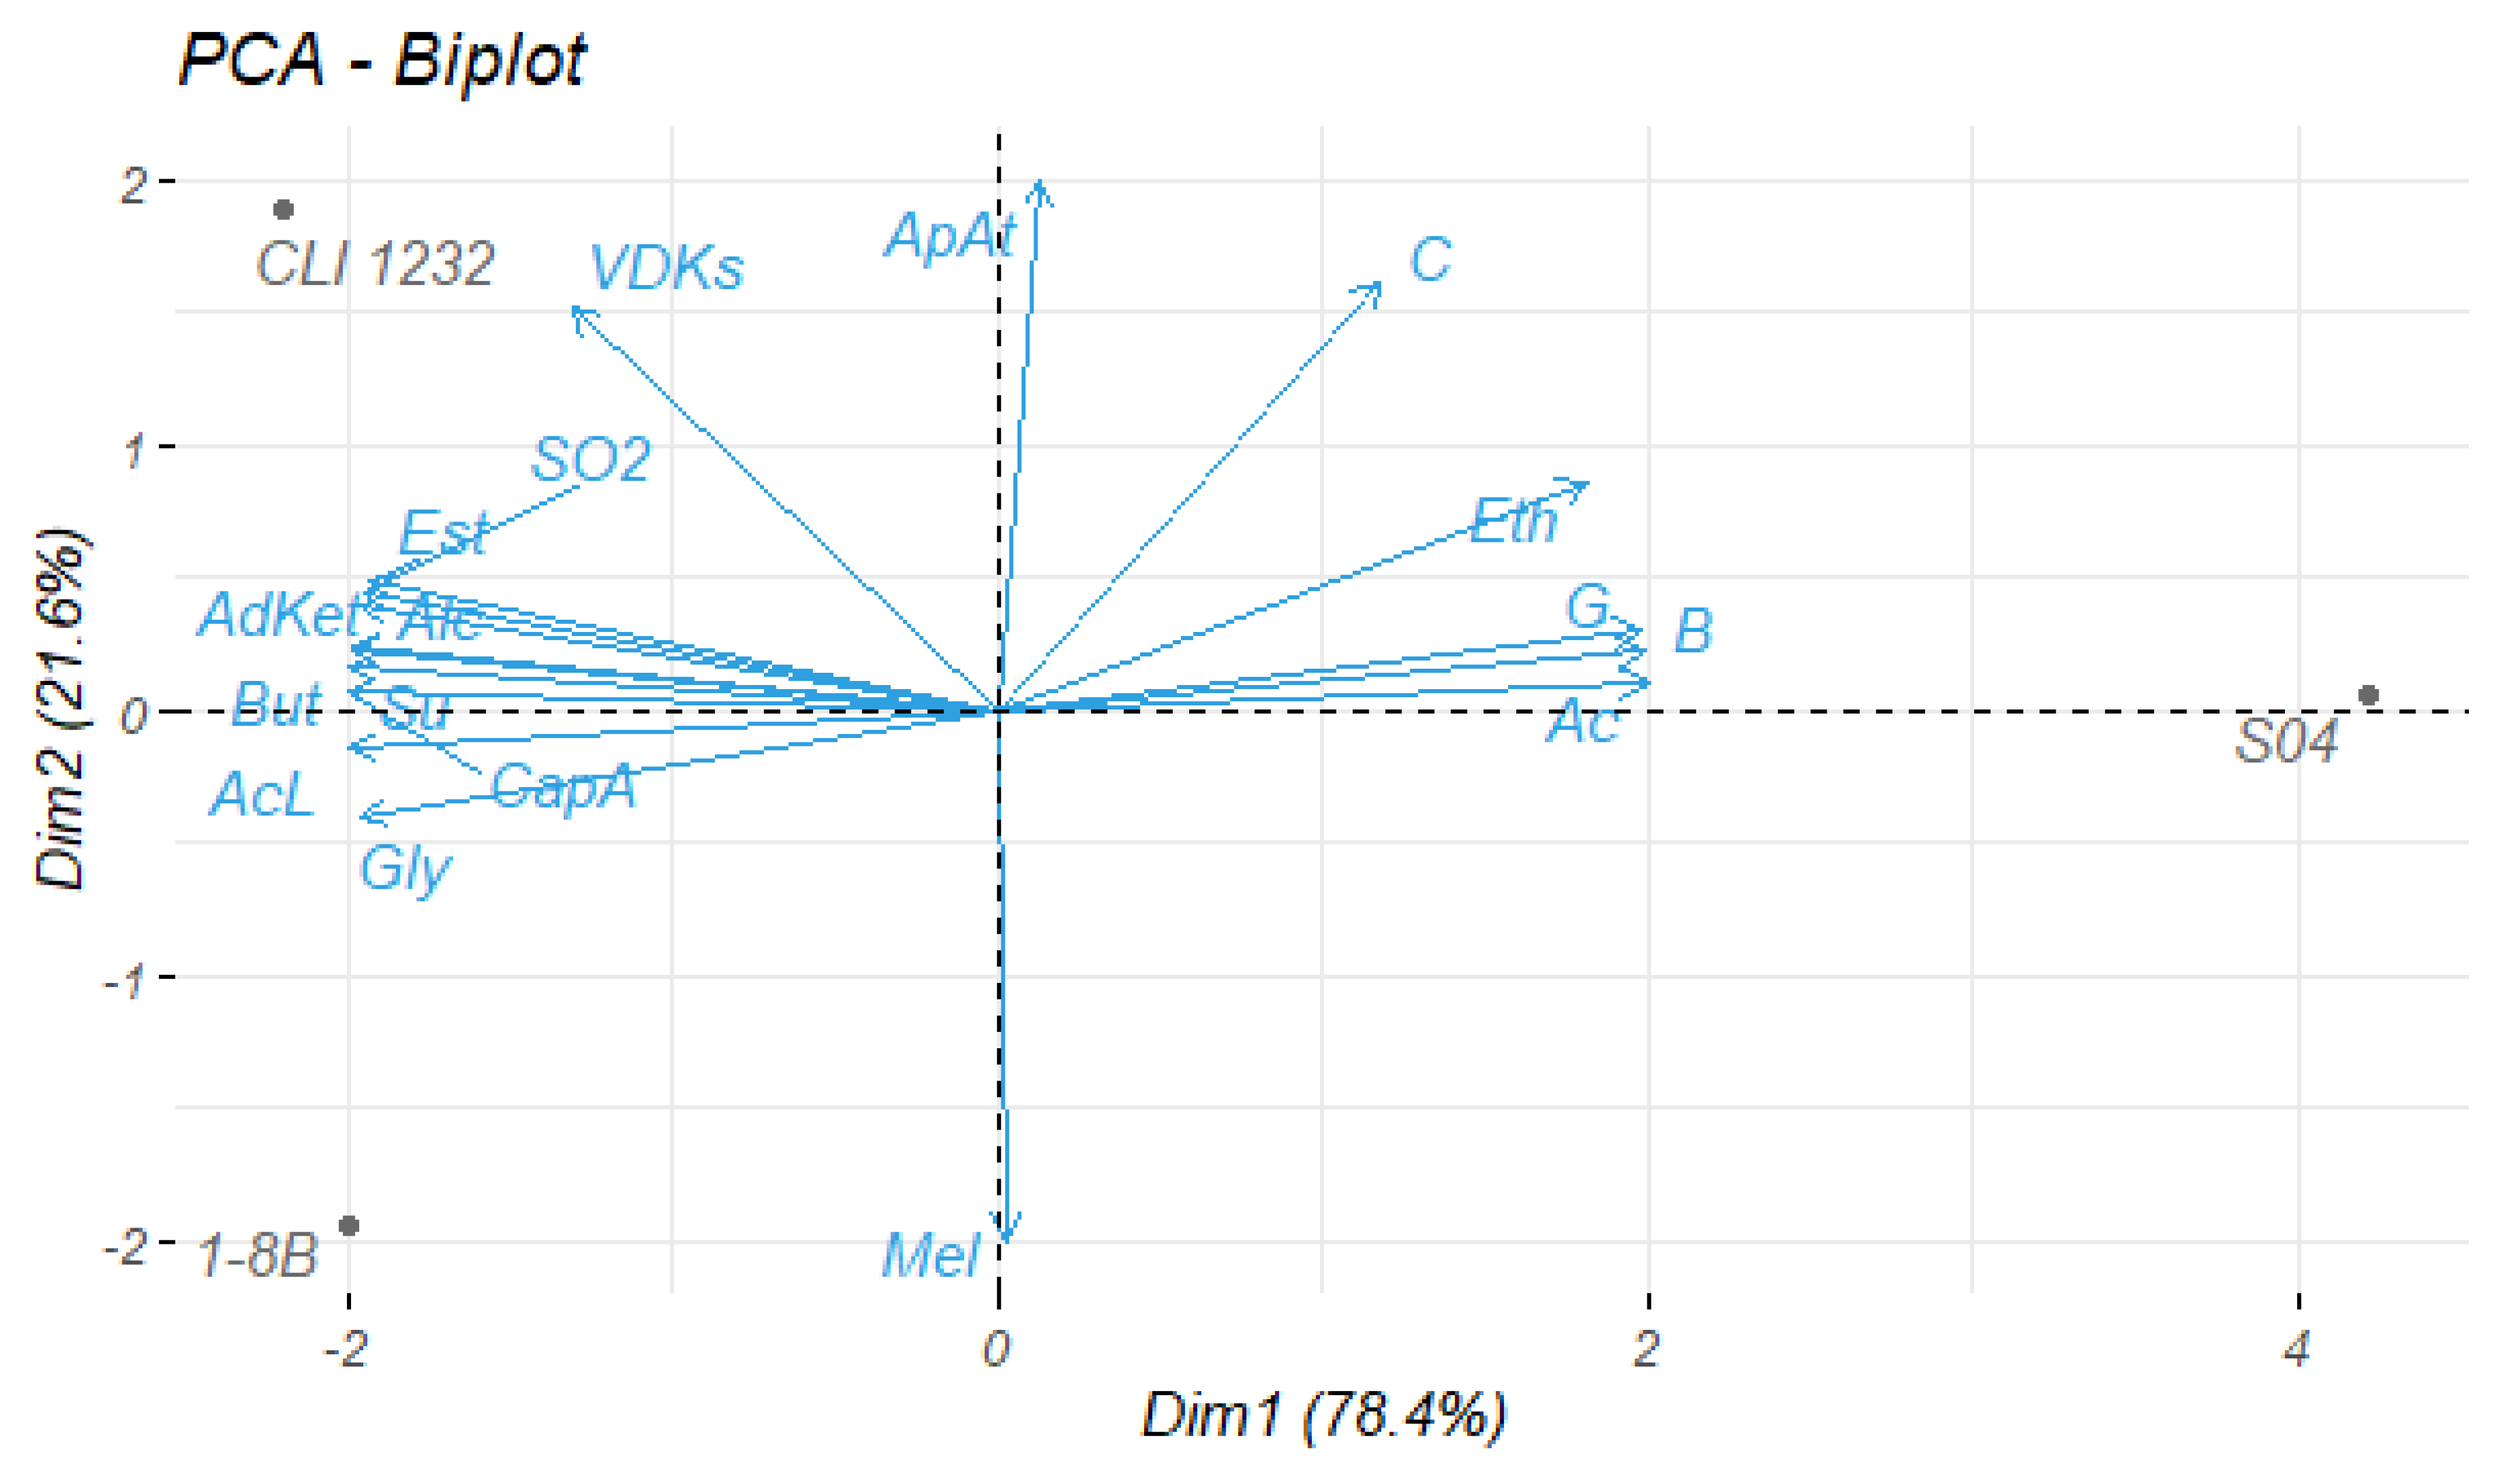
Principal component analysis (PCA) was applied to assess trends in the data. Two principal components (PCs) were extracted. PC1 (Dim1) explained up to 78.4% of the total variance and PC2 (Dim2) explained another 21.6%. By plotting PC1 against PC2, a scatter plot of the sour-style beers fermented in 100 L together with the control strain S-04 and the main parameters analysed (biplot) was obtained (Figure 7).
Sour-style beers are situated in the negative region of PC 1, CLI 1232 in the positive side of PC2 and1-8B in the negative side of PC2. CLI 1232 is associated with VDKs, SO2, total esters, total aldehydes/ketones, total higher alcohols and antioxidant capacity, whereas 1-8B is situated near γ-butyrolactone, lactic acid, glycerol and melatonin production. On the other hand, the beer fermented with the control strain S-04 is in the positive side of PC1, characterised by the ethanol, colour, guaiacol, bitterness and total fatty acid production. The Lachancea strains are positioned completely opposite to the control strain, thus indicating that they are very different styles. Strain CLI 1232 stood out for the production of esters, higher alcohols, VDKs, aldehydes/ketones and antioxidant capacity, while strain 1-8B stood out for the production of lactic acid and glycerol.

4. Conclusions

The use of bacteria in the brewing process for sour-style beer production poses a risk to the brewer. Therefore, the search for yeast species that can provide the same characteristics as bacteria is important. In this case, the use of yeast species Lachancea thermotolerans could be an alternative to the use of bacteria. Ten yeast strains were characterised during this project, along with those already evaluated in previous studies. The results were very promising in terms of the production of lactic acid and aroma compounds in the beers, compared to a beer in which bacteria are involved in the production. In addition, the sensory profile and evaluation obtained by consumers was positive in general. The CLI 1232 strain stood out from the 1-8B strain for its fruitier character, with notes of honey and flowers, as well as an accentuated but balanced acidity. For this reason, the beer fermented with the CLI 1232 yeast strain was finally selected to be launched on the Madrid market in a limited edition.

Author Contributions

Conceptualization, T.A.; methodology, T.A. and V.P.; formal analysis, V.P.; investigation, V.P. and S.E.; resources, T.A.; data curation, V.P.; writing—original draft preparation, V.P.; writing—review and editing, V.P. and T.A.; supervision, T.A.; project administration, T.A.; funding acquisition, T.A. All authors have read and agreed to the published version of the manuscript.

Funding

This research was funded by the DG Research and Technological Innovation of the Regional Government of Madrid, Spain, grant number IND2017/BIO7787, for the industrial doctorate conducted by Vanesa Postigo. The project was developed between La Cibeles brewery and the Madrid Institute for Rural, Agriculture and Food Research and Development (IMIDRA) (Madrid, Spain).

Data Availability Statement

Not applicable.

Conflicts of Interest

Author Vanesa Postigo was employed by the company La Cibeles. The remaining authors declare that the research was conducted in the absence of any commercial or financial relationships that could be construed as a potential conflict of interest.

References

  1. Aquilani, B.; Laureti, T.; Poponi, S.; Secondi, L. Beer Choice and Consumption Determinants When Craft Beers Are Tasted: An Exploratory Study of Consumer Preferences. Food Qual. Prefer. 2015, 41, 214–224. [Google Scholar] [CrossRef]
  2. Brungard, M. Calcium and Magnesium in Brewing Water. New Brew. 2014, 31, 80–88. [Google Scholar]
  3. So, A. Developing New Barely Varities: A Work in Progress. New Brew. 2014, 31, 60–68. [Google Scholar]
  4. Carbone, K.; Bianchi, G.; Petrozziello, M.; Bonello, F.; Macchioni, V.; Parisse, B.; De Natale, F.; Alilla, R.; Cravero, M.C. Tasting the Italian Terroir through Craft Beer: Quality and Sensory Assessment of Cascade Hops Grown in Central Italy and Derived Monovarietal Beers. Foods 2021, 10, 2085. [Google Scholar] [CrossRef] [PubMed]
  5. Tusha, K.; Nešpor, J.; Jelínek, L.; Vodičková, H.; Kinčl, T.; Dostálek, P. Effect of Czech Hop Varieties on Aroma of Dry-Hopped Lager Beer. Foods 2022, 11, 2520. [Google Scholar] [CrossRef]
  6. Osburn, K.; Ahmad, N.N.; Bochman, M.L. Bio-Prospecting, Selection, and Analysis of Wild Yeasts for Ethanol Fermentation. Zymurgy 2016, 39, 81–88. [Google Scholar]
  7. Capece, A.; Romaniello, R.; Siesto, G.; Romano, P. Conventional and Non-Conventional Yeasts in Beer Production. Fermentation 2018, 4, 38. [Google Scholar] [CrossRef] [Green Version]
  8. Canonico, L.; Agarbati, A.; Comitini, F.; Ciani, M. Torulaspora delbrueckii in the Brewing Process: A New Approach to Enhance Bioflavour and to Reduce Ethanol Content. Food Microbiol. 2016, 56, 45–51. [Google Scholar] [CrossRef]
  9. Kochlánová, T.; Kij, D.; Kopecká, J.; Kubizniaková, P.; Matoulková, D. Non-Saccharomyces Yeasts and Their Importance in the Brewing Industry. Part II. Kvas. Prum. 2016, 62, 206–214. [Google Scholar] [CrossRef] [Green Version]
  10. Johansson, L.; Nikulin, J.; Juvonen, R.; Krogerus, K.; Magalhães, F.; Mikkelson, A.; Nuppunen-Puputti, M.; Sohlberg, E.; de Francesco, G.; Perretti, G.; et al. Sourdough Cultures as Reservoirs of Maltose-Negative Yeasts for Low-Alcohol Beer Brewing. Food Microbiol. 2021, 94, 103629. [Google Scholar] [CrossRef]
  11. Bokulich, N.A.; Bamforth, C.W.; Mills, D.A. Brewhouse-Resident Microbiota Are Responsible for Multi-Stage Fermentation of American Coolship Ale. PLoS ONE 2012, 7, e35507. [Google Scholar] [CrossRef] [PubMed]
  12. Tonsmeire, M. American Sour Beer: Innovative Techniques for Mixed Fermentations; Brewers Publications: Boulder, CO, USA, 2014. [Google Scholar]
  13. Spitaels, F.; Wieme, A.D.; Janssens, M.; Aerts, M.; Daniel, H.-M.; Van Landschoot, A.; De Vuyst, L.; Vandamme, P. The Microbial Diversity of Traditional Spontaneously Fermented Lambic Beer. PLoS ONE 2014, 9, e95384. [Google Scholar] [CrossRef] [PubMed]
  14. Hornsey, I.S. A History of Beer and Brewing; Royal Society of Chemistry: Cambridge, UK, 2003. [Google Scholar]
  15. Esmaeili, S.; Mogharrabi, M.; Safi, F.; Sohrabvandi, S.; Mortazavian, A.M.; Bagheripoor-Fallah, N. The common spoilage microorganisms of beer: Occurrence, defects, and determination—A review. Carpathian J. Food Sci. Technol. 2015, 7, 68–73. [Google Scholar]
  16. Lee, Y.-J.; Choi, Y.-R.; Lee, S.-Y.; Park, J.-T.; Shim, J.-H.; Park, K.-H.; Kim, J.-W. Screening Wild Yeast Strains for Alcohol Fermentation from Various Fruits. Mycobiology 2011, 39, 33. [Google Scholar] [CrossRef] [PubMed] [Green Version]
  17. Sampaio, J.P.; Gonçalves, P. Natural Populations of Saccharomyces kudriavzevii in Portugal Are Associated with Oak Bark and Are Sympatric with S. cerevisiae and S. paradoxus. Appl. Environ. Microbiol. 2008, 74, 2144–2152. [Google Scholar] [CrossRef] [Green Version]
  18. Marongiu, A.; Zara, G.; Legras, J.-L.; Del Caro, A.; Mascia, I.; Fadda, C.; Budroni, M. Novel Starters for Old Processes: Use of Saccharomyces cerevisiae Strains Isolated from Artisanal Sourdough for Craft Beer Production at a Brewery Scale. J. Ind. Microbiol. Biotechnol. 2015, 42, 85–92. [Google Scholar] [CrossRef]
  19. Cubillos, F.A.; Gibson, B.; Grijalva-Vallejos, N.; Krogerus, K.; Nikulin, J. Bioprospecting for Brewers: Exploiting Natural Diversity for Naturally Diverse Beers. Yeast 2019, 36, 383–398. [Google Scholar] [CrossRef]
  20. Rossi, S.; Turchetti, B.; Sileoni, V.; Marconi, O.; Perretti, G. Evaluation of Saccharomyces cerevisiae Strains Isolated from Non-Brewing Environments in Beer Production. J. Inst. Brew. 2018, 124, 381–388. [Google Scholar] [CrossRef] [Green Version]
  21. Steensels, J.; Verstrepen, K.J. Taming Wild Yeast: Potential of Conventional and Nonconventional Yeasts in Industrial Fermentations. Annu. Rev. Microbiol. 2014, 68, 61–80. [Google Scholar] [CrossRef]
  22. Domizio, P.; House, J.F.; Joseph, C.M.L.; Bisson, L.F.; Bamforth, C.W. Lachancea thermotolerans as an Alternative Yeast for the Production of Beer. J. Inst. Brew. 2016, 122, 599–604. [Google Scholar] [CrossRef] [Green Version]
  23. Osburn, K.; Amaral, J.; Metcalf, S.R.; Nickens, D.M.; Rogers, C.M.; Sausen, C.; Caputo, R.; Miller, J.; Li, H.; Tennessen, J.M.; et al. Primary Souring: A Novel Bacteria-Free Method for Sour Beer Production. Food Microbiol. 2018, 70, 76–84. [Google Scholar] [CrossRef] [PubMed]
  24. Postigo, V.; Sánchez, A.; Cabellos, J.M.; Arroyo, T. New Approaches for the Fermentation of Beer: Non-Saccharomyces Yeasts from Wine. Fermentation 2022, 8, 280. [Google Scholar] [CrossRef]
  25. Toh, D.W.K.; Chua, J.Y.; Lu, Y.; Liu, S.Q. Evaluation of the Potential of Commercial Non-Saccharomyces Yeast Strains of Torulaspora delbrueckii and Lachancea thermotolerans in Beer Fermentation. Int. J. Food Sci. Technol. 2020, 55, 2049–2059. [Google Scholar] [CrossRef]
  26. Vaquero, C.; Izquierdo-Cañas, P.M.; Mena-Morales, A.; Marchante-Cuevas, L.; Heras, J.M.; Morata, A. Use of Lachancea thermotolerans for Biological vs. Chemical Acidification at Pilot-Scale in White Wines from Warm Areas. Fermentation 2021, 7, 193. [Google Scholar] [CrossRef]
  27. Vaquero, C.; Loira, I.; Bañuelos, M.A.; Heras, J.M.; Cuerda, R.; Morata, A. Industrial Performance of Several Lachancea thermotolerans Strains for PH Control in White Wines from Warm Areas. Microorganisms 2020, 8, 830. [Google Scholar] [CrossRef] [PubMed]
  28. Morata, A.; Bañuelos, M.A.; Vaquero, C.; Loira, I.; Cuerda, R.; Palomero, F.; González, C.; Suárez-Lepe, J.A.; Wang, J.; Han, S.; et al. Lachancea thermotolerans as a Tool to Improve PH in Red Wines from Warm Regions. Eur. Food Res. Technol. 2019, 245, 885–894. [Google Scholar] [CrossRef]
  29. Morera, A.L.; Abreu, P. Seasonality of Psychopathology and Circannual Melatonin Rhythm. J. Pineal Res. 2006, 41, 279–283. [Google Scholar] [CrossRef]
  30. Reiter, R.J.; Manchester, L.C.; Tan, D. Melatonin in Walnuts: Influence on Levels of Melatonin and Total Antioxidant Capacity of Blood. Nutrition 2005, 21, 920–924. [Google Scholar] [CrossRef]
  31. Maldonado, M.D.; Manfredi, M.; Ribas-Serna, J.; Garcia-Moreno, H.; Calvo, J.R. Melatonin Administrated Immediately before an Intense Exercise Reverses Oxidative Stress, Improves Immunological Defenses and Lipid Metabolism in Football Players. Physiol. Behav. 2012, 105, 1099–1103. [Google Scholar] [CrossRef]
  32. Poeggeler, B.; Reiter, R.J.; Tan, D.-X.; Chen, L.; Manchester, L.C. Melatonin, Hydroxyl Radical-Mediated Oxidative Damage, and Aging: A Hypothesis. J. Pineal Res. 1993, 14, 151–168. [Google Scholar] [CrossRef]
  33. Sanchez-Hidalgo, M.; de la Lastra, C.A.; Carrascosa-Salmoral, M.P.; Naranjo, M.C.; Gomez-Corvera, A.; Caballero, B.; Guerrero, J.M. Age-Related Changes in Melatonin Synthesis in Rat Extrapineal Tissues. Exp. Gerontol. 2009, 44, 328–334. [Google Scholar] [CrossRef] [PubMed] [Green Version]
  34. Maldonado, M.D.; Mora-Santos, M.; Naji, L.; Carrascosa-Salmoral, M.P.; Naranjo, M.C.; Calvo, J.R. Evidence of Melatonin Synthesis and Release by Mast Cells. Possible Modulatory Role on Inflammation. Pharmacol. Res. 2010, 62, 282–287. [Google Scholar] [CrossRef] [PubMed]
  35. Motilva, V.; García-Mauriño, S.; Talero, E.; Illanes, M. New Paradigms in Chronic Intestinal Inflammation and Colon Cancer: Role of Melatonin. J. Pineal Res. 2011, 51, 44–60. [Google Scholar] [CrossRef] [PubMed]
  36. Lee, S.E.; Kim, S.J.; Youn, J.-P.; Hwang, S.Y.; Park, C.-S.; Park, Y.S. MicroRNA and Gene Expression Analysis of Melatonin-Exposed Human Breast Cancer Cell Lines Indicating Involvement of the Anticancer Effect. J. Pineal Res. 2011, 51, 345–352. [Google Scholar] [CrossRef]
  37. Sanchez-Barcelo, E.J.; Mediavilla, M.D.; Alonso-Gonzalez, C.; Reiter, R.J. Melatonin Uses in Oncology: Breast Cancer Prevention and Reduction of the Side Effects of Chemotherapy and Radiation. Expert Opin. Investig. Drugs 2012, 21, 819–831. [Google Scholar] [CrossRef]
  38. Maldonado, M.D.; Siu, A.W.; Sánchez-Hidalgo, M.; Acuna-Castroviejo, D.; Escames, G. Melatonin and Lipid Uptake by Murine Fibroblasts: Clinical Implications. Neuroendocrinol. Lett. 2006, 27, 601–608. [Google Scholar]
  39. Koziróg, M.; Poliwczak, A.R.; Duchnowicz, P.; Koter-Michalak, M.; Sikora, J.; Broncel, M. Melatonin Treatment Improves Blood Pressure, Lipid Profile, and Parameters of Oxidative Stress in Patients with Metabolic Syndrome. J. Pineal Res. 2011, 50, 261–266. [Google Scholar] [CrossRef]
  40. Basso, R.F.; Alcarde, A.R.; Portugal, C.B. Could Non-Saccharomyces Yeasts Contribute on Innovative Brewing Fermentations? Food Res. Int. 2016, 86, 112–120. [Google Scholar] [CrossRef]
  41. Montrocher, R.; Verner, M.C.; Briolay, J.; Gautier, C.; Marmeisse, R. Phylogenetic Analysis of the Saccharomyces cerevisiae Group Based on Polymorphisms of RDNA Spacer Sequences. Int. J. Syst. Bacteriol. 1998, 48, 295–303. [Google Scholar] [CrossRef] [Green Version]
  42. Esteve-Zarzoso, B.; Belloch, C.; Uruburu, F.; Querol, A. Identification of Yeasts by RFLP Analysis of the 5.8S RRNA Gene and the Two Ribosomal Internal Transcribed Spacers. Int. J. Syst. Bacteriol. 1999, 49, 329–337. [Google Scholar] [CrossRef] [Green Version]
  43. Capece, A.; Romaniello, R.; Pietrafesa, A.; Siesto, G.; Pietrafesa, R.; Zambuto, M.; Romano, P. Use of Saccharomyces cerevisiae Var. Boulardii in Co-Fermentations with S. cerevisiae for the Production of Craft Beers with Potential Healthy Value-Added. Int. J. Food Microbiol. 2018, 284, 22–30. [Google Scholar] [CrossRef] [PubMed]
  44. Marconi, O.; Rossi, S.; Galgano, F.; Sileoni, V.; Perretti, G. Influence of Yeast Strain, Priming Solution and Temperature on Beer Bottle Conditioning. J. Sci. Food Agric. 2016, 96, 4106–4115. [Google Scholar] [CrossRef] [PubMed]
  45. Vanderhaegen, B.; Neven, H.; Coghe, S.; Verstrepen, K.J.; Derdelinckx, G.; Verachtert, H. Bioflavoring and Beer Refermentation. Appl. Microbiol. Biotechnol. 2003, 62, 140–150. [Google Scholar] [CrossRef] [PubMed]
  46. Ortega, C.; López, R.; Cacho, J.; Ferreira, V. Fast Analysis of Important Wine Volatile Compounds—Development and Validation of a New Method Based on Gas Chromatographic-Flame Ionisation Detection Analysis of Dichloromethane Microextracts. J. Chromatogr. A 2001, 923, 205–214. [Google Scholar] [CrossRef]
  47. Rodriguez-Naranjo, M.I.; Gil-Izquierdo, A.; Troncoso, A.M.; Cantos-Villar, E.; Garcia-Parrilla, M.C. Melatonin Is Synthesised by Yeast during Alcoholic Fermentation in Wines. Food Chem. 2011, 126, 1608–1613. [Google Scholar] [CrossRef]
  48. Kocadaǧli, T.; Yilmaz, C.; Gökmen, V. Determination of Melatonin and Its Isomer in Foods by Liquid Chromatography Tandem Mass Spectrometry. Food Chem. 2014, 153, 151–156. [Google Scholar] [CrossRef]
  49. Hevia, D.; Mayo, J.C.; Tan, D.-X.; Rodriguez-Garcia, A.; Sainz, R.M. Melatonin Enhances Photo-Oxidation of 2′,7′-Dichlorodihydrofluorescein by an Antioxidant Reaction That Renders N1-Acetyl-N2-Formyl-5-Methoxykynuramine (AFMK). PLoS ONE 2014, 9, e109257. [Google Scholar] [CrossRef] [PubMed] [Green Version]
  50. Huang, X.; Mazza, G. Simultaneous Analysis of Serotonin, Melatonin, Piceid and Resveratrol in Fruits Using Liquid Chromatography Tandem Mass Spectrometry. J. Chromatogr. A 2011, 1218, 3890–3899. [Google Scholar] [CrossRef] [PubMed]
  51. Vasilescu, A.; Fanjul-Bolado, P.; Titoiu, A.-M.; Porumb, R.; Epure, P. Progress in Electrochemical (Bio)Sensors for Monitoring Wine Production. Chemosensors 2019, 7, 66. [Google Scholar] [CrossRef] [Green Version]
  52. European Brewery Convention Analytica—EBC. Section 13 Sensory Analysis Method 13.0. In EBC Methods of Analysis; Fachverlag Hans Carl: Nürnberg, Germany, 2004. [Google Scholar]
  53. European Brewery Convention Analytica—EBC. Section 13 Sensory Analysis Method 13.4. In EBC Methods of Analysis; Fachverlag Hans Carl: Nürnberg, Germany, 1997. [Google Scholar]
  54. European Brewery Convention Analytica—EBC. Section 13 Sensory Analysis Method 13.12. In EBC Methods of Analysis; Fachverlag Hans Carl: Nürnberg, Germany, 1997. [Google Scholar]
  55. European Brewery Convention Analytica—EBC. Section 13 Sensory Analysis Method 13.10. In EBC Methods of Analysis; Fachverlag Hans Carl: Nürnberg, Germany, 1997. [Google Scholar]
  56. Varela, P.; Ares, G. Sensory Profiling, the Blurred Line between Sensory and Consumer Science. A Review of Novel Methods for Product Characterization. Food Res. Int. 2012, 48, 893–908. [Google Scholar] [CrossRef]
  57. Comitini, F.; Gobbi, M.; Domizio, P.; Romani, C.; Lencioni, L.; Mannazzu, I.; Ciani, M. Selected Non-Saccharomyces Wine Yeasts in Controlled Multistarter Fermentations with Saccharomyces cerevisiae. Food Microbiol. 2011, 28, 873–882. [Google Scholar] [CrossRef] [PubMed]
  58. Gobbi, M.; Comitini, F.; Domizio, P.; Romani, C.; Lencioni, L.; Mannazzu, I.; Ciani, M. Lachancea thermotolerans and Saccharomyces cerevisiae in Simultaneous and Sequential Co-Fermentation: A Strategy to Enhance Acidity and Improve the Overall Quality of Wine. Food Microbiol. 2013, 33, 271–281. [Google Scholar] [CrossRef] [PubMed]
  59. Callejo, M.J.; García Navas, J.J.; Alba, R.; Escott, C.; Loira, I.; González, M.C.; Morata, A. Wort Fermentation and Beer Conditioning with Selected Non-Saccharomyces Yeasts in Craft Beers. Eur. Food Res. Technol. 2019, 245, 1229–1238. [Google Scholar] [CrossRef]
  60. Zheng, X.; D’Amore, T.; Russell, I.; Stewart, G.G. Transport Kinetics of Maltotriose in Strains of Saccharomyces. J. Ind. Microbiol. 1994, 13, 159–166. [Google Scholar] [CrossRef]
  61. Zdaniewicz, M.; Satora, P.; Pater, A.; Bogacz, S. Low Lactic Acid-Producing Strain of Lachancea thermotolerans as a New Starter for Beer Production. Biomolecules 2020, 10, 256. [Google Scholar] [CrossRef] [Green Version]
  62. Dysvik, A.; Liland, K.H.; Myhrer, K.S.; Westereng, B.; Rukke, E.O.; de Rouck, G.; Wicklund, T. Pre-Fermentation with Lactic Acid Bacteria in Sour Beer Production. J. Inst. Brew. 2019, 125, 342–356. [Google Scholar] [CrossRef]
  63. Clapperton, J.F.; Brown, D.G.W. Caprylic Flavour As a Feature of Beer Flavour. J. Inst. Brew. 1978, 84, 90–92. [Google Scholar] [CrossRef]
  64. Olšovská, J.; Vrzal, T.; Štěrba, K.; Slabý, M.; Kubizniaková, P.; Čejka, P. The Chemical Profiling of Fatty Acids during the Brewing Process. J. Sci. Food Agric. 2019, 99, 1772–1779. [Google Scholar] [CrossRef]
  65. Viana, A.C.; Pimentel, T.C.; Borges do Vale, R.; Clementino, L.S.; Januario Ferreira, E.T.; Magnani, M.; dos Santos Lima, M. American Pale Ale Craft Beer: Influence of Brewer’s Yeast Strains on the Chemical Composition and Antioxidant Capacity. LWT 2021, 152, 112317. [Google Scholar] [CrossRef]
  66. Dysvik, A.; La Rosa, S.L.; Buffetto, F.; Liland, K.H.; Myhrer, K.S.; Rukke, E.-O.; Wicklund, T.; Westereng, B. Secondary Lactic Acid Bacteria Fermentation with Wood-Derived Xylooligosaccharides as a Tool To Expedite Sour Beer Production. J. Agric. Food Chem. 2020, 68, 301–314. [Google Scholar] [CrossRef]
  67. Alcine Chan, M.Z.; Chua, J.Y.; Toh, M.; Liu, S.Q. Survival of Probiotic Strain Lactobacillus Paracasei L26 during Co-Fermentation with S. cerevisiae for the Development of a Novel Beer Beverage. Food Microbiol. 2019, 82, 541–550. [Google Scholar] [CrossRef] [PubMed]
  68. Hill, A.E. Brewing Microbiology; Elsevier: Amsterdam, The Netherlands, 2015; ISBN 9781782423317. [Google Scholar]
  69. Bamforth, C.W. Beer and Health. In Beer; Elsevier: Amsterdam, The Netherlands, 2009; pp. 229–253. ISBN 9780126692013. [Google Scholar]
  70. Laws, D.R.J.; McGuinness, J.D.; Rennie, H. The Losses of Bitter Substances during Fermentation. J. Inst. Brew. 1972, 78, 314–321. [Google Scholar] [CrossRef]
  71. Popescu, V.; Soceanu, A.; Dobrinas, S.; Stanciu, G. A Study of Beer Bitterness Loss during the Various Stages of the Romanian Beer Production Process. J. Inst. Brew. 2013, 119, 111–115. [Google Scholar] [CrossRef]
  72. Hughes, P.S.; Baxter, E.D. Beer: Quality, Safety and Nutritional Aspects; Royal Society of Chemistry: Cambridge, UK, 2001; ISBN 0854045880. [Google Scholar]
  73. Langstaff, S.A.; Lewis, M.J. The mouthfeel of beer—A review. J. Inst. Brew. 1993, 99, 31–37. [Google Scholar] [CrossRef]
  74. Mcfeeters, R.F. Fermentation Microorganisms and Flavor Changes in Fermented Foods. J. Food Sci. 2004, 69, FMS35–FMS37. [Google Scholar] [CrossRef]
  75. Nsogning Dongmo, S.; Sacher, B.; Kollmannsberger, H.; Becker, T. Key Volatile Aroma Compounds of Lactic Acid Fermented Malt Based Beverages—Impact of Lactic Acid Bacteria Strains. Food Chem. 2017, 229, 565–573. [Google Scholar] [CrossRef] [PubMed]
  76. Peyer, L. Lactic Acid Bacteria Fermentation of Wort as a Tool to Add Functionality in Malting, Brewing and Novel Beverages. Ph.D. Thesis, University College Cork, Cork, Ireland, 2017. [Google Scholar]
  77. Ripari, V.; Tomassetti, M.; Cecchi, T.; Enrico, B. Recipe, Volatiles Profile, Sensory Analysis, Physico-Chemical and Microbial Characterization of Acidic Beers from Both Sourdough Yeasts and Lactic Acid Bacteria. Eur. Food Res. Technol. 2018, 244, 2027–2040. [Google Scholar] [CrossRef]
  78. Engan, S. Organoleptic Threshold Values of Some Alcohols and Esters in Beer. J. Inst. Brew. 1972, 78, 33–36. [Google Scholar] [CrossRef]
  79. Meilgaard, M. Flavor Chemistry of Beer: Part II: Flavor and Threshold of 239 Aroma Volatiles. Master Brew. Assoc. Am. Tech. Q. 1975, 12, 151–168. [Google Scholar]
  80. Holt, S.; Mukherjee, V.; Lievens, B.; Verstrepen, K.J.; Thevelein, J.M. Bioflavoring by Non-Conventional Yeasts in Sequential Beer Fermentations. Food Microbiol. 2018, 72, 55–66. [Google Scholar] [CrossRef]
  81. Tan, Y.; Siebert, K.J. Quantitative Structure-Activity Relationship Modeling of Alcohol, Ester, Aldehyde, and Ketone Flavor Thresholds in Beer from Molecular Features. J. Agric. Food Chem. 2004, 52, 3057–3064. [Google Scholar] [CrossRef] [PubMed]
  82. Meilgaard, M. Flavor Chemistry of Beer. I. Flavor Interaction between Principal Volatiles. Master Brew. Assoc. Am. Tech. Q. 1975, 12, 107–117. [Google Scholar]
  83. Postigo, V.; García, M.; Cabellos, J.M.; Arroyo, T. Wine Saccharomyces Yeasts for Beer Fermentation. Fermentation 2021, 7, 290. [Google Scholar] [CrossRef]
  84. Thompson Witrick, K.; Duncan, S.E.; Hurley, K.E.; O’keefe, S.F. Acid and Volatiles of Commercially-Available Lambic Beers. Beverages 2017, 3, 51. [Google Scholar] [CrossRef] [Green Version]
  85. Vanderhaegen, B.; Neven, H.; Coghe, S.; Verstrepen, K.J.; Verachtert, H.; Derdelinckx, G. Evolution of Chemical and Sensory Properties during Aging of Top-Fermented Beer. J. Agric. Food Chem. 2003, 51, 6782–6790. [Google Scholar] [CrossRef] [PubMed]
  86. Meilgaard, M.C. Prediction of Flavor Differences between Beers from Their Chemical Composition. J. Agric. Food Chem. 1982, 30, 1009–1017. [Google Scholar] [CrossRef]
  87. Sterckx, F.L.; Missiaen, J.; Saison, D.; Delvaux, F.R. Contribution of Monophenols to Beer Flavour Based on Flavour Thresholds, Interactions and Recombination Experiments. Food Chem. 2011, 126, 1679–1685. [Google Scholar] [CrossRef]
  88. Ciosek, A.; Fulara, K.; Hrabia, O.; Satora, P.; Poreda, A. Chemical Composition of Sour Beer Resulting from Supplementation the Fermentation Medium with Magnesium and Zinc Ions. Biomolecules 2020, 10, 1599. [Google Scholar] [CrossRef]
  89. Brányik, T.; Vicente, A.A.; Dostálek, P.; Teixeira, J.A. A Review of Flavour Formation in Continuous Beer Fermentations. J. Inst. Brew. 2008, 114, 3–13. [Google Scholar] [CrossRef] [Green Version]
  90. Peyer, L.C.; Zarnkow, M.; Jacob, F.; De Schutter, D.P.; Arendt, E.K. Sour Brewing: Impact of Lactobacillus Amylovorus FST2.11 on Technological and Quality Attributes of Acid Beers. J. Am. Soc. Brew. Chem. 2017, 75, 207–216. [Google Scholar] [CrossRef] [Green Version]
  91. Maldonado, M.D.; Moreno, H.; Calvo, J.R. Melatonin Present in Beer Contributes to Increase the Levels of Melatonin and Antioxidant Capacity of the Human Serum. Clin. Nutr. 2009, 28, 188–191. [Google Scholar] [CrossRef]
  92. Vigentini, I.; Gardana, C.; Fracassetti, D.; Gabrielli, M.; Foschino, R.; Simonetti, P.; Tirelli, A.; Iriti, M. Yeast Contribution to Melatonin, Melatonin Isomers and Tryptophan Ethyl Ester during Alcoholic Fermentation of Grape Musts. J. Pineal Res. 2015, 58, 388–396. [Google Scholar] [CrossRef]
  93. Morcillo-Parra, M.Á.; Beltran, G.; Mas, A.; Torija, M.-J. Effect of Several Nutrients and Environmental Conditions on Intracellular Melatonin Synthesis in Saccharomyces cerevisiae. Microorganisms 2020, 8, 853. [Google Scholar] [CrossRef]
  94. Dysvik, A.; La Rosa, S.L.; Liland, K.H.; Myhrer, K.S.; Østlie, H.M.; De Rouck, G.; Rukke, E.O.; Westereng, B.; Wicklund, T. Co-Fermentation Involving Saccharomyces cerevisiae and Lactobacillus Species Tolerant to Brewing-Related Stress Factors for Controlled and Rapid Production of Sour Beer. Front. Microbiol. 2020, 11, 279. [Google Scholar] [CrossRef]
  95. Burini, J.A.; Eizaguirre, J.I.; Loviso, C.; Libkind, D. Levaduras No Convencionales Como Herramientas de Innovación y Diferenciación en la Producción de Cerveza. Rev. Argent. Microbiol. 2021, 53, 359–377. [Google Scholar] [CrossRef]
  96. Vanderhaegen, B.; Delvaux, F.; Daenen, L.; Verachtert, H.; Delvaux, F.R. Aging Characteristics of Different Beer Types. Food Chem. 2007, 103, 404–412. [Google Scholar] [CrossRef]
  97. Piddocke, M.P.; Kreisz, S.; Heldt-Hansen, H.P.; Nielsen, K.F.; Olsson, L. Physiological Characterization of Brewer’s Yeast in High-Gravity Beer Fermentations with Glucose or Maltose Syrups as Adjuncts. Appl. Microbiol. Biotechnol. 2009, 84, 453–464. [Google Scholar] [CrossRef]
  98. Meilgaard, M.; Elizondo, A.; Moya, E. A Study of Carbonyl Compounds in Beer, Part II. Flavor and Flavor Thresholds of Aldehydes and Ketones Added to Beer. Tech. Q. Master Brew. Assoc. Am. 1970, 7, 143–149. [Google Scholar]
  99. Meilgaard, M.C. Individual Differences in Sensory Threshold for Aroma Chemicals Added to Beer. Food Qual. Prefer. 1993, 4, 153–167. [Google Scholar] [CrossRef]
  100. Dvořak, J.; Dostálek, P.; Štěrba, K.; Čejka, P.; Kellner, V.; Čulík, J.; Beinrohr, E. Determination of Total Sulphur Dioxide in Beer Samples by Flow-through Chronopotentiometry. J. Inst. Brew. 2006, 112, 308–313. [Google Scholar] [CrossRef]
  101. Guido, L.F. Sulfites in Beer: Reviewing Regulation, Analysis and Role. Sci. Agric. 2016, 73, 189–197. [Google Scholar] [CrossRef] [Green Version]
  102. Bourbon-Melo, N.; Palma, M.; Rocha, M.P.; Ferreira, A.; Bronze, M.R.; Elias, H.; Sá-Correia, I. Use of Hanseniaspora guilliermondii and Hanseniaspora opuntiae to Enhance the Aromatic Profile of Beer in Mixed-Culture Fermentation with Saccharomyces cerevisiae. Food Microbiol. 2021, 95, 103678. [Google Scholar] [CrossRef]
  103. Haukeli, A.D.; Lie, S. Formation and removal of acetoin during yeast fermentation. J. Inst. Brew. 1975, 81, 58–64. [Google Scholar] [CrossRef]
  104. Pranil, T.; Moongngarm, A.; Loypimai, P. Influence of pH, temperature, and light on the stability of melatonin in aqueous solutions and fruit juices. Heliyon 2020, 6, e03648. [Google Scholar]
  105. Gerhäuser, C. Beer Constituents as Potential Cancer Chemopreventive Agents. Eur. J. Cancer 2005, 41, 1941–1954. [Google Scholar] [CrossRef]
  106. Katalinić, V.; Milos, M.; Modun, D.; Musić, I.; Boban, M. Antioxidant Effectiveness of Selected Wines in Comparison with (+)-Catechin. Food Chem. 2004, 86, 593–600. [Google Scholar] [CrossRef]
  107. Granato, D.; Branco, G.F.; Faria, J.D.A.F.; Cruz, A.G. Characterization of Brazilian Lager and Brown Ale Beers Based on Color, Phenolic Compounds, and Antioxidant Activity Using Chemometrics. J. Sci. Food Agric. 2011, 91, 563–571. [Google Scholar] [CrossRef] [PubMed]
  108. Michel, M.; Meier-Dörnberg, T.; Jacob, F.; Methner, F.J.; Wagner, R.S.; Hutzler, M. Review: Pure Non-Saccharomyces Starter Cultures for Beer Fermentation with a Focus on Secondary Metabolites and Practical Applications. J. Inst. Brew. 2016, 122, 569–587. [Google Scholar] [CrossRef]
  109. Sannino, C.; Mezzasoma, A.; Buzzini, P.; Turchetti, B. Non-Conventional Yeasts for Producing Alternative Beers. In Non-Conventional Yeasts: From Basic Research to Application; Sibirny, A., Ed.; Springer International Publishing: Cham, Switzerland, 2019; pp. 361–388. ISBN 978-3-030-21109-7. [Google Scholar]
  110. Ahmad, M.N.; Holland, C.R.; McKay, G. Mass Transfer Studies in Batch Fermentation: Mixing Characteristics. J. Food Eng. 1994, 23, 145–158. [Google Scholar] [CrossRef]
  111. Díaz, M.; García, A.I.; García, L.A. Mixing Power, External Convection, and Effectiveness in Bioreactors. Biotechnol. Bioeng. 1996, 51, 131–140. [Google Scholar] [CrossRef]
  112. Vanderhaegen, B.; Neven, H.; Daenen, L.; Verstrepen, K.J.; Verachtert, H.; Derdelinckx, G. Furfuryl Ethyl Ether: Important Aging Flavor and a New Marker for the Storage Conditions of Beer. J. Agric. Food Chem. 2004, 52, 1661–1668. [Google Scholar] [CrossRef]
  113. Shellhammer, T.H.; Bamforth, C.W. Assessing Color Quality of Beer. ACS Symp. Ser. 2008, 983, 192–202. [Google Scholar] [CrossRef]
  114. Hudson, J.R.; Birtwistle, S.E. Wort-boiling in relation to beer quality. J. Inst. Brew. 1966, 72, 46–50. [Google Scholar] [CrossRef]
  115. Eßlinger, H.M. Handbook of Brewing Processes Technology Markets-Wiley; Wiley: Weinheim, Germany, 2009; ISBN 9783527314065. [Google Scholar]
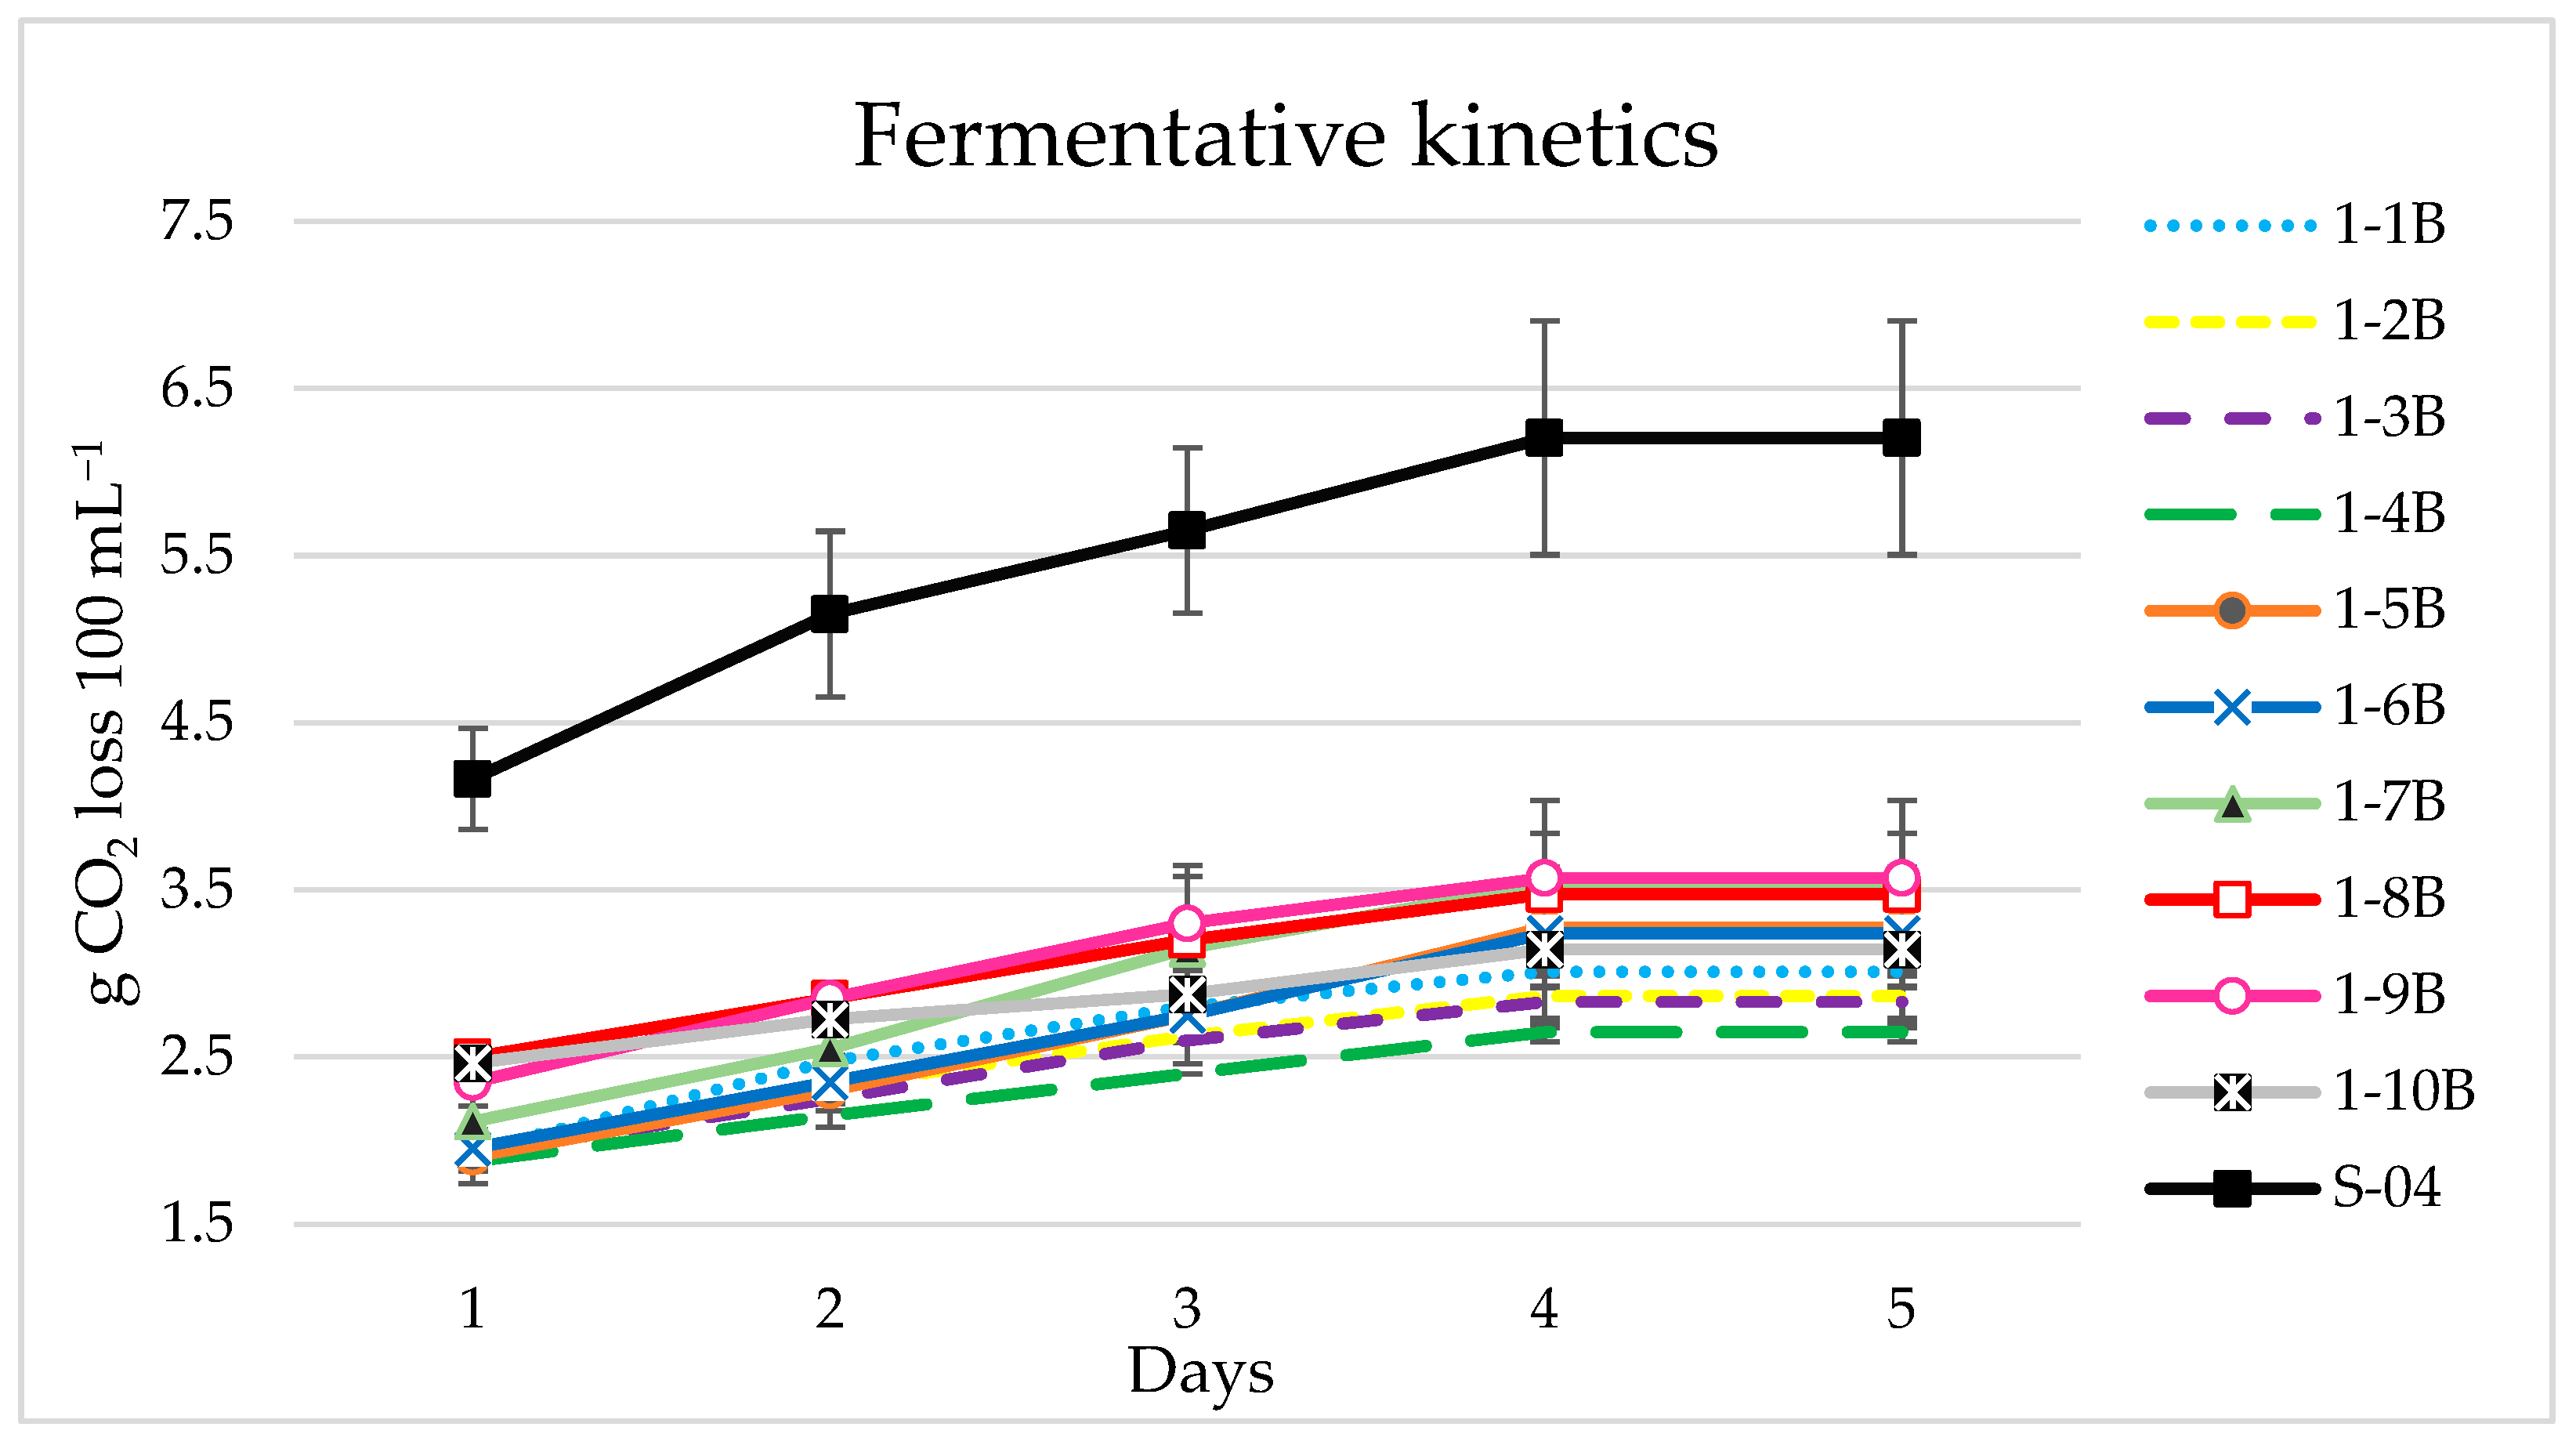
Figure 1. Fermentative kinetic of 10 L. thermotolerans strains fermented in 100 mL to obtain sour beer.
Beverages 09 00020 g001
Figure 2. Melatonin production by 10 L. thermotolerans strains and S-04 in 100 mL fermentation. Data with different superscript letters are significantly different (Tukey tests: p < 0.05).
Beverages 09 00020 g002
Figure 3. Fermentative kinetic of 10 L. thermotolerans strains fermented in 1 L for sour beer production.
Beverages 09 00020 g003
Figure 4. Sensory analysis of the 10 sour beers studied. Aroma attributes: yeast aroma, fruity aroma, acetaldehyde aroma, banana aroma, phenolic aroma, DMS (dimethyl sulphide) aroma, alcohol aroma; flavour attributes: fruity, acetaldehyde, banana, phenolic; taste attributes: sweet, salty, acid, bitterness; overall attributes: astringency, effervescence, body, balance. (A), sensory analysis for strains 1-1B, 1-2B, 1-3B, 1-4B, 1-5B, S-04, (B) sensory analysis for strains 1-6B, 1-7B, 1-8B, 1-9B, 1-10B, S-04. *: significantly different (ANOVA; p < 0.05).
Beverages 09 00020 g004
Figure 5. Fermentation kinetics of the L. thermotolerans strains fermented in 100 L and S-04 control strain.
Beverages 09 00020 g005
Figure 6. Percentage of detection by consumers for each of the analysed attributes in aroma and flavour for the sour beers (CLI 1232, 1-8B). (A): beer fermented with CLI 1232 strain. (B): beer fermented with 1-8B strain.
Beverages 09 00020 g006
Figure 7. Projection of the 100 L beers on the axes formed by the principal components 1 and 2. Each object is the average of the three corresponding experimental beers. Eth, ethanol; Gly, glycerol; ApAt, apparent attenuation; AcL, lactic acid; C, colour; B, bitterness; SO2, dioxide sulphide; VDKs, vicinal diketones; Su, residual sugars; Alc, total higher alcohols; Est, total esters; Ac, total fatty acids; AdKet, total aldehydes/ketones; But, γ-butyrolactone; G, guaiacol; Mel, melatonin; CapA, antioxidant capacity.
Beverages 09 00020 g007
Table 1. Results of the parameters analysed on the 100 mL scale for the L. thermotolerans yeast strains studied.
Yeast StrainsLactic Acid
mg L−1
Colour
EBC
Bitterness
IBU
Ethanol
% (v/v)
Residual Sugars g L−1
1-1B 1877.50 ± 31.82 cd10.00 ± 0.00 b11.00 ± 0.00 c3.85 ± 0.35 b19.00 ± 0.00 b
1-2B 2084.50 ± 111.02 bc10.50 ± 0.71 b11.00 ± 0.00 c4.30 ± 0.57 b18.00 ± 0.00 b
1-3B 1925.00 ± 77.78 bcd10.00 ± 0.00 b13.65 ± 0.78 b4.10 ± 0.56 b18.00 ± 0.00 b
1-4B 2115.00 ± 70.71 b10.00 ± 0.00 b14.80 ± 0.99 b4.15 ± 0.21 b18.00 ± 0.00 b
1-5B 1593.00 ± 43.84 e10.50 ± 0.71 b16.10 ± 1.13 ab3.95 ± 0.21 b19.00 ± 0.00 b
1-6B 2093.00 ± 9.90 bc12.00 ± 0.00 b10.00 ± 0.00 c4.20 ± 0.28 b18.25 ± 1.06 b
1-7B 2402.00 ± 53.74 a11.50 ± 0.71 b10.00 ± 0.00 c5.00 ± 0.57 ab17.50 ± 0.71 b
1-8B 2554.00 ± 65.05 a13.50 ± 0.71 ab10.80 ± 0.35 c4.70 ± 0.28 b18.00 ± 0.00 b
1-9B 1925.00 ± 49.50 bcd13.50 ± 0.71 ab11.00 ± 0.00 c5.35 ± 0.49 a17.50 ± 0.71 b
1-10B 1694.00 ± 62.22 de13.50 ± 0.71 ab11.10 ± 0.17 c4.00 ± 0.14 ab18.00 ± 0.00 b
S-04 263.33 ± 37.29 f14.33 ± 1.53 a21.10 ± 3.32 a5.57 ± 0.59 a15.57 ± 3.19 a
Data are means ± standard deviations of three independent samples. Data with different superscript letters within each column are significantly different (Tukey tests: p < 0.05).
Table 3. Parameters analysed in the two selected sour beers fermented with the strains CLI 1232 and 1-8B and S-04 control strain in 1 L.
Yeast StrainsLactic Acid
(mg L−1)
Colour
EBC
Bitterness
IBU
VDKs
(mg L−1)
SO2
(mg L−1)
Ethanol
%(v/v)
Residual Sugars (g L−1)
CLI 12321942.00 ± 82.02 a10.5 ± 2.1212.75 ± 2.90 b0.11 ± 0.081.15 ± 0.21 a4.05 ± 0.49 b16.80 ± 1.70 a
1-8B1639.00 ± 39.60 b11.00 ± 0.0016.85 ± 2.33 a0.16 ± 0.041.25 ± 0.07 a4.35 ± 0.35 b18.00 ± 0.00 a
S-04321.00 ± 21.00 c13.00 ± 0.0016.50 ± 0.30 a0.11 ± 0.03≤1 b5.40 ± 0.10 a5.90 ± 0.50 b
Data are means ± standard deviations of three independent samples. Data with different superscript letters within each column are significantly different (Tukey tests: p < 0.05). VDKs: vicinal diketones. Parameters were analysed with CDR FoodLab.
Table 4. Volatile compounds (mg L−1) detected in beers fermented with CLI 1232 and 1-8B L. thermotolerans strains and control strain S-04.
Yeast StrainsCLI 12321-8BS-04
Isobutanol17.39 ± 2.00 ab12.76 ± 1.10 b23.54 ± 2.78 a
1-butanolnd0.02 ± 0.00 b0.03 ± 0.00 a
Isoamyl alcohol33.33 ± 4.54 b46.04 ± 0.73 b68.73 ± 5.45 a
1-hexanol0.02 ± 0.040.07 ± 0.000.06 ± 0.00
Benzyl alcohol0.01 ± 0.00 ab0.01 ± 0.00 and
β-phenyl ethanol31.11 ± 0.95 b29.80 ± 1.95 b45.90 ± 4.09 a
Total higher alcohols82.22 ± 7.5389.58 ± 3.78138.26 ± 12.32
Ethyl isobutyrate0.06 ± 0.07 b2.11 ± 0.29 a0.40 ± 0.15 b
Ethyl butyrate1.51 ± 0.56 a1.90 ± 0.25 a0.13 ± 0.00 b
Ethyl isovaleratendnd0.19 ± 0.00 a
Isoamyl acetate0.10 ± 0.04 b0.10 ± 0.00 b1.81 ± 0.26 a
Ethyl hexanoate0.04 ± 0.050.09 ± 0.010.03 ± 0.00
Ethyl lactate11.02 ± 1.43 a10.93 ± 0.07 a0.19 ± 0.01 b
Ethyl octanoate0.08 ± 0.01 b0.08 ± 0.00 b0.13 ± 0.00 a
Diethyl succinate0.36 ± 0.05 b0.88 ± 0.07 a0.82 ± 0.09 a
Total esters12.83 ± 2.2215.21 ± 0.693.71 ± 0.51
Isovaleric acid3.39 ± 0.78 b4.45 ± 0.25 b9.82 ± 0.59 a
Hexanoic acid0.19 ± 0.050.39 ± 0.041.56 ± 0.07
Octanoic acid0.17 ± 0.01 b0.17 ± 0.01 b5.50 ± 0.35 a
Decanoic acid0.46 ± 0.210.29 ± 0.100.17 ± 0.02
Total fatty acids4.22 ± 1.055.31 ± 0.417.05 ± 1.03
Acetoin1.62 ± 0.551.31 ± 0.230.67 ± 0.43
Furfural0.02 ± 0.03ndnd
Total aldehydes/
ketones
1.65 ± 0.581.32 ± 0.230.67 ± 0.43
γ-Butyrolactone0.46 ± 0.03 a0.45 ± 0.03 a0.27 ± 0.00 b
Guaiacol0.06 ± 0.00 b0.05 ± 0.00 c0.13 ± 0.00 a
Data are means ± standard deviations of three independent samples. Compounds above their threshold levels are marked in bold. Data with different superscript letters within each row are significantly different (Tukey tests: p < 0.05). nd: not detected.
Table 5. Antioxidant activity of the selected sour beers and control strain in 1 L fermentation.
Yeast StrainsQ1Q2Qt
CLI 12323.52 ± 0.07 a8.88 ± 0.93 a12.41 ± 0.85 a
1-8B3.58 ± 0.51 a8.92 ± 0.12 a12.50 ± 0.64 a
S-043.79 ± 0.00 a8.37 ± 0.21 a12.15 ± 0.21 a
Data are means ± standard deviations of three independent experiments expressed as millimoles of Trolox equivalents per litre (mmol TE L−1). Q1, fast-acting antioxidants, Q2, slow-acting antioxidants, Qt, total antioxidants. Data with different superscript letters within each column are significantly different (Tukey tests: p < 0.05).
Table 6. Scale-up data comparison between 1 L and 100 L fermentation.
Parameters1 L Fermentation100 L Fermentation
CLI 1232 1-8BS-04CLI 12321-8BS-04
Ethanol (% v/v)4.00 ± 0.16 bc4.23 ± 0.25 bc5.53 ± 0.05 a3.88 ± 0.69 bc3.38 ± 0.44 c4.62 ± 0.43 ab
Residual sugars
(g L−1)
Maltotriose14.22 ± 1.78 a15.67 ± 0.04 a1.43 ± 0.08 d11.48 ± 1.07 b13.43 ± 2.06 ab7.74 ± 0.91 c
Maltose1.61 ± 0.22 c2.77 ± 1.10 c1.45 ± 0.01 c2.33 ± 0.84 c8.06 ± 1.02 a2.29 ± 0.20 b
Fructose0.18 ± 0.050.14 ± 0.000.18 ± 0.020.06 ± 0.040.14 ± 0.020.49 ± 0.17
Glucose0.10 ± 0.00 c0.11 ± 0.01 c0.16 ± 0.00 b0.19 ± 0.04 b0.17 ± 0.03 b0.30 ± 0.10 a
Glycerol (g L−1)3.82 ± 0.43 bc5.01 ± 0.14 a3.43 ± 0.01 bc3.97 ± 0.53 b4.20 ± 0.32 ab2.93 ± 0.46 c
Lactic acid (mg L−1)1942.00 ± 58.00 ab1639.00 ± 28.00 b321.00 ± 21.00 c1930 ± 29.00 ab1785.00 ± 60.00 b337.00 ± 17.00 c
Colour (EBC)10.50 ± 1.50 a11.00 ± 0.00 a13.00 ± 0.00 a5.50 ± 1.50 b4.50 ± 0.50 b5.67 ± 1.15 b
Bitterness (IBU)12.75 ± 2.0516.85 ± 1.6516.50 ± 0.3013.75 ± 1.9514.75 ± 1.4523.40 ± 3.33
SO2 (mg L−1)1.15 ± 0.15 a1.25 ± 0.05 and1.45 ± 0.45 a1.35 ± 0.05 a1.07 ± 0.12 a
VDKs (mg L−1)0.11 ± 0.06 b0.16 ± 0.03 b0.37 ± 0.11 a0.35 ± 0.05 a0.16 ± 0.11 b0.12 ± 0.03 b
Total higher alcohols (mg L−1)82.22 ± 4.01 d89.58 ± 1.06 cd139.08 ± 12.40 a110.97 ± 7.82 b106.14 ± 10.62 bc80.41 ± 2.39 d
Total esters (mg L−1)12.83 ± 0.63 a15.21 ± 0.34 a2.89 ± 0.11 d11.62 ± 0.71 a8.70 ± 0.54 b1.12 ± 0.10 e
Total fatty acids
(mg L−1)
4.22 ± 0.68 d5.31 ± 0.07 cd17.05 ± 0.15 a6.64 ± 0.64 b6.30 ± 0.20 bc17.01 ± 0.66 a
T. aldehyde/ketones (mg L−1)1.65 ± 0.41 a1.32 ± 0.16 ab0.67 ± 0.43 b1.67 ± 0.20 a1.51 ± 0.36 a1.01 ± 0.04 ab
γ-Butyrolactone
(mg L−1)
0.46 ± 0.02 a0.45 ± 0.02 a0.27 ± 0.00 bc0.31 ± 0.01 b0.29 ± 0.11 b0.15 ± 0.04 c
Guaiacol (mg L−1)0.06 ± 0.00 bc0.05 ± 0.00 c0.13 ± 0.00 a0.06 ± 0.01 bc0.05 ± 0.01 bc0.07 ± 0.02 b
Melatonin (ng mL−1)nd47.78 ± 12.69 a20.41 ± 5.25 bnd47.13 ± 7.91 a22.88 ± 3.08 b
Antioxidant capacity (Qt)
(mmol TE L−1)
12.41 ± 0.60 b12.50 ± 0.45 b12.15 ± 0.21 b12.51 ± 1.35 b11.91 ± 0.72 b10.05 ± 0.52 c
Data are means ± standard deviations of three independent samples. Data with different superscript letters within each row are significantly different (Tukey tests: p < 0.05). VDKs: vicinal diketones. Ethanol and residual sugars were analysed using HPLC.
Table 7. Analysis of the data frequency obtained by CATA questions expressed as percentage of consumers (%).
Sensory AttributesResponse (n = 142)
AppearanceCLI 12321-8B
Foam consistency
   Light8255
   Fine315
   Medium621
   Persistent66
   Creamy33
Visual impression
   Very hazy1516
   Hazy5650
   Dull1617
   Clear1211
   Bright16
Aroma
Aroma intensity
   Low1416
   Low–medium3229
   Medium2833
   Medium–high2520
   High12
Taste
Acidity
   Low1519
   Low–medium2720
   Medium2429
   Medium–high2717
   High715
Bitterness
   Low4547
   Low–medium2526
   Medium1813
   Medium–high108
   High 26
Mouthfeel body
   Light1316
   Light–medium4240
   Medium3432
   Medium–full910
   Full22
Aftertaste intensity
   Short21
   Short–medium1618
   Medium3031
   Medium–long4036
   Long1214
Disclaimer/Publisher’s Note: The statements, opinions and data contained in all publications are solely those of the individual author(s) and contributor(s) and not of MDPI and/or the editor(s). MDPI and/or the editor(s) disclaim responsibility for any injury to people or property resulting from any ideas, methods, instructions or products referred to in the content.