Article

Effect of Three Post-Harvest Methods at Different Altitudes on the Organoleptic Quality of C. canephora Coffee

by
Sofía Velásquez
1,2,*,
Carlos Banchón
1,
Willian Chilán
1 and
José Guerrero-Casado
2
1
Escuela Superior Politécnica Agropecuaria de Manabí—Manuel Félix López, ESPAM-MFL, Calceta 130602, Ecuador
2
Departamento de Zoología, Universidad de Córdoba, Campus de Rabanales, Madrid-Cádiz Km. 396, 14014 Córdoba, Spain
*
Author to whom correspondence should be addressed.
Beverages 2022, 8(4), 83; https://doi.org/10.3390/beverages8040083
Submission received: 9 November 2022 / Revised: 1 December 2022 / Accepted: 9 December 2022 / Published: 13 December 2022
(This article belongs to the Section Tea, Coffee, Water, and Other Non-Alcoholic Beverages)

Abstract

:
C. canephora (syn. C. robusta) is distinctive due to its rising industrial value and pathogen resistance. Both altitude and post-harvest methods influence coffee cup quality; however, modest information is known about this coffee species. Therefore, the aim of this study was to determine the relationship between four different altitudes and post-harvest processes (dry, honey, and wet) to the improvement of the organoleptic quality of the C. canephora congolensis and conilon drink. For dry processing, congolensis and conilon showed the lowest scores in terms of fragrance/aroma, flavour, aftertaste, salt–acid, bitter–sweet, and body. Above 625 m, coffees from dry, honey, and wet processes increased scores in their sensory attributes, but there was no difference at such high altitudes when comparing post-harvest samples. Dry-processed coffee samples had total scores over 80 points at high altitudes. Conilon was perceived to have the best sensory attributes at high altitudes using honey processing. In general, the wet-processed congolensis and conilon samples had a tastier profile than dry-processed ones.

1. Introduction

World coffee production up to 2020 totalled 169.34 million bags, with 101.9 million bags of C. arabica and 73.5 million bags of C. canephora (syn. C. robusta)—which represent 64% and 36% of commercial importance, respectively [1]. C. arabica is world-famous for its aroma and acidity; meanwhile, C. canephora has a greater body but a lower aroma [2]. This coffee species is distinguished by its excellent industrial value, drought resilience, and heat tolerance [3,4,5]; in comparison, C. arabica tends to have a lower output for one or two years after reaching its peak production [6,7,8]. According to projections, C. arabica growing areas will be 300 m lower by 2050 [9,10]. Due to climate change, coffee producers are moving their operations to other regions, which will result in the deforestation of new areas [11,12]. Moreover, the production of profitable arabica is being threatened by the fungus Hemileia vastatrix (Hv)—known as coffee leaf rust (CLR)—everywhere in the world [13,14,15]. Previously unfavourable places are now suited for many diseases due to global warming [13,16]. Under these circumstances, blending C. arabica and C. canephora coffees is a popular industrial technique as a sustainable option for the food industry [17,18].
The quality of the coffee is affected by pre-harvest, post-harvest, and export handling in the proportions of 40%, 40%, and 20%, respectively [19]. Free amino acids, reducing sugars, and phenolic compounds in green coffee beans are engaged in the Maillard reaction, which is responsible for the aroma and flavour [20]; these compounds vary significantly depending on the post-harvest processing method [21,22]. Green coffee seeds are handled using one of three techniques known as dry, wet, or honey (semi-dry) processing after the fruits have been harvested [23,24,25]. The cherry fruit flesh is intended to be removed using one of these processes. In the dry process, the entire cherry (bean, mucilage, and pulp) is dried in the sun or using a mechanical dryer before the dried exterior pieces are mechanically removed [5]. The dry process produces a so-called “natural coffee” with a full-bodied, fruity, cherry-like flavour [19]. The dry process is the simplest method for growing green coffee beans, but it is difficult to obtain coffee of a good quality [26]. Nonetheless, coffee beverages prepared from beans harvested by the wet process are characterized by their robust aroma and pleasant acidity [27]. Honey processing is less sensitive in terms of fermentation than dry processing, in addition to reducing the levels of flavour and acidity that are present in the coffee [28]. In addition, there is a small amount of mucilage in the honey process, which presents as a sticky sugar-rich mucilage on the coffee beans [29].
The term pre-harvest specifies the sensory properties of the coffee based on the crop’s location, height, latitude, land slope, coffee variety, soil, fertilizer, rainfall, irrigation, shadow, frost, climate change, and exposure to pathogens [11,30,31]. Particularly, altitude positively influences the physicochemical properties and consequently the organoleptic quality of coffee, although little is understood about the metabolic changes that lead to this trait [32]. At higher altitudes above 1200 m, sucrose is the most abundant carbohydrate, and it acts as an aroma precursor to the formation of furans, aldehydes, and carboxylic acids which contribute to a caramel aftertaste [33]. However, when cultivated under an altitude of 300 m, C. canephora provides coffee with lower ratings and undesirable qualities such as woody and herbal flavours [34]. Coffee beans undergo a post-harvest procedure to transform them into a more stable, transportable, and roastable state, with a moisture level of between 10% and 12% to prevent unintended fermentation [35]. This post-harvest entails removing skin, mucilage, and parchment layers that are firmly connected to the coffee beans. There are three ways to handle green coffee cherries: dry, wet, and semi-dry processing [26].
The hypothesis presented as the study’s premise is that altitude and post-harvest processes influence coffee cup quality. Therefore, the aim of this study was to determine the relationship between four different altitudes and three post-harvest methods to the improvement of the organoleptic quality of the C. canephora drink. For each coffee variety, the evaluation was performed independently, since the two varieties are not found at the same altitudes.

2. Materials and Methods
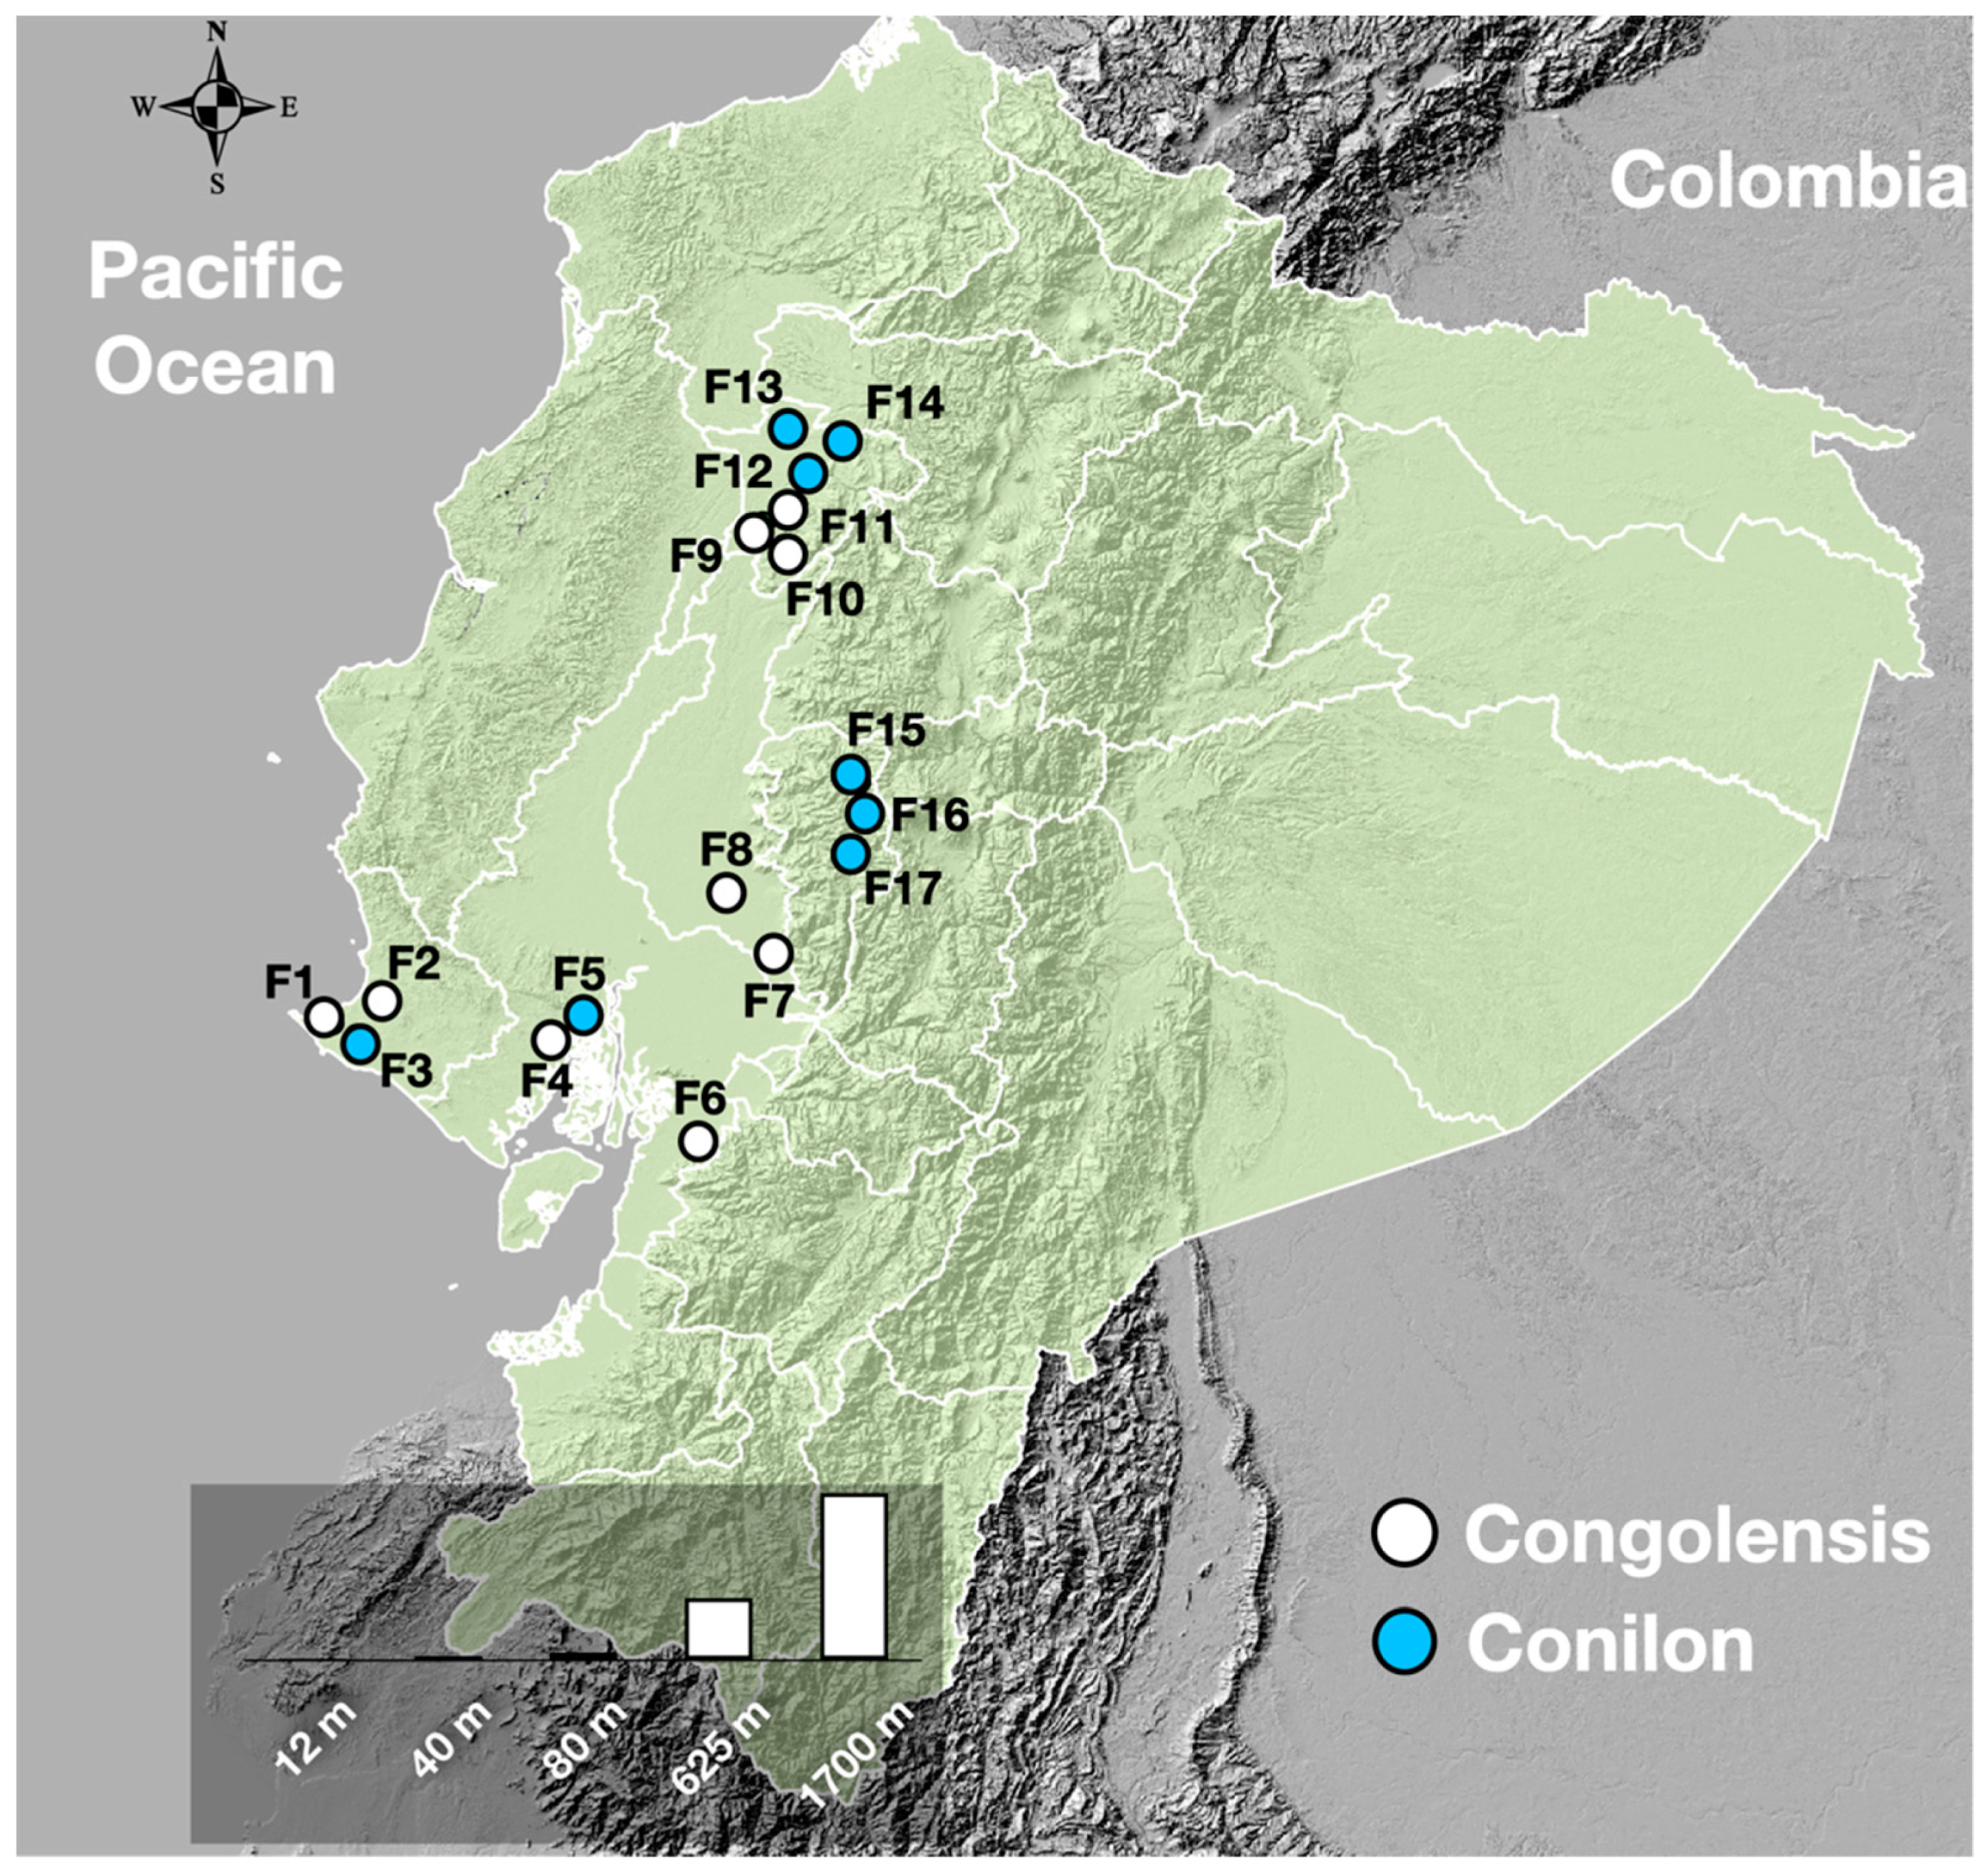
2.1. Sampling

The fruits of C. canephora congolensis and conilon variants were gathered from 17 Ecuadorian plantations located at various altitudes (Table 1, Figure 1). Twenty plants were randomly chosen from each plantation at each altitude, and at least 5000 g of fresh fruit was harvested. Within twenty-four hours, the samples were placed in sterile plastic bags for additional post-harvest treatment.

2.2. Post-Harvest Treatment

Each farm featured its own processing units, whose altitudes and temperatures are listed in Table 1. Three different post-harvest treatments were applied: dry, wet, and honey [36,37,38,39,40,41]. In the dry method, the entire crop of mature cherries was sun-dried for 12 days, until the requisite 10% water content was reached [42]. The cherries were exposed uniformly to the sun’s rays and constantly scraped to prevent fermentation. The unwanted outer layers were removed manually. There was no yeast inoculation conducted. At the conclusion of the process, the outer layer of the cherries had turned dark brown and brittle. After drying, cherries were milled to remove the fruit and the parchment encasing the seed. Manual sorting was carried out in order to exclude overripe or fermenting beans.
In the wet process, the pulp and mucilage from ripe coffee cherries were removed using a significant amount of water (30 L/Kg) for 24 h. Proteolytic enzymes (Granozyme, Ecuador) were used to break down mucilage for 2 days. The remaining mucilage was washed off. The parchment coffee was cleaned and dried under the sun [19].
In the honey (semi-dry or pulped natural) approach, the coffee skin and pulp are removed using a pulping machine. The seeds were dried under the sun with the mucilage still around them. The parchment layer is removed with a hulling machine [43].
In all the above processes, to separate the unripe, overripe, and damage cherries and to get rid of dirt, soil, twigs, and leaves, the gathered cherries were first manually sorted and cleaned. This was accomplished with a sizable sieve and manual winnowing. In all processes, the drying step was conducted under the sun in specially designed canopies, in wooden boxes (150 × 70 × 30 cm) with plastic mesh covers, and at room temperature until the grains’ moisture content reached 10%.

2.3. Preparation of Coffee Samples

In a coffee roaster (Fresh Roast SR540, China), each coffee sample was roasted at 210–220 °C (American medium roast) [44]. This took up to 10 min. The roasting level was measured by the Agtron/SCAA roast classification colour disc at number 55. After the roasting process, the coffee samples were cooled and stored at room temperature. Roasted coffee beans were ground into a fine powder (Shardor conical burr coffee grinder, CG9406-UL2, USA). This step was performed before the sensorial analysis.

2.4. Sensorial Analysis

Five tasters performed the sensory analysis at each altitude. Therefore, there were a total of twenty-five tasters, as there were five distinct elevations. The training was conducted by video conference in accordance with COVID-19 social distance requirements. The sensory analysis was carried out by a panel accredited by the Coffee Quality Institute (CQI). We worked with the cupping protocol established by the Specialty Coffee Association (SCA), which establishes ten quality parameters for C. canephora (fragrance/aroma, flavour, aftertaste, salt/acidity, bitter/sweet, body, balance, and overall score) [37,45].
The cupping test of coffee beans was carried out referring to the standards and protocols for fine C. canephora. The cup quality components observed included the attributes of fragrance/aroma, flavour, aftertaste, salt/acidity balance, bitter/sweet balance, mouthfeel, cup uniformity, cup balance, cleanliness, and overall score. Fragrance is the smell of the ground coffee when it is still dry, aroma is the odour of the coffee after it has been infused with hot water, and aftertaste is the vapours that stay in the mouth after consuming the coffee. Balance is the evaluation of how well the flavour, aftertaste, acidity, and body harmonize with one another. The attribute overall is a reflection of the panellist’s personal appraisal [45].
Panellists assessed each sensory attribute with a score of 6.00 to 6.75 (good), 7.00 to 7.75 (very good), 8.00 to 8.75 (excellent), and 9.00 to 10.00 (outstanding) [46]. The final score was obtained by adding up the scores for each attribute. If the value was >80 on a scale of 100, it was categorized as fine C. canephora; higher scores could classify the coffee as specialty grade (80 to 100 points) or commercial grade (<79 and below).

2.5. Statistical Analysis

The observational data were analysed by descriptive and inferential statistics using R-project and R-studio with the ggplot2 package [47,48]. The effects of altitude (Factor A) and post-harvest process (Factor B) on the sensory attributes (response variables) fragrance/aroma, flavour, aftertaste, sweetness, body, acidity, balance, and overall score were studied using ANOVA and Tukey’s range test. The interactions altitude*variety and altitude*process were also included. Since the two coffee varieties are not found at the same altitudes, statistical tests were conducted individually for each.

3. Results

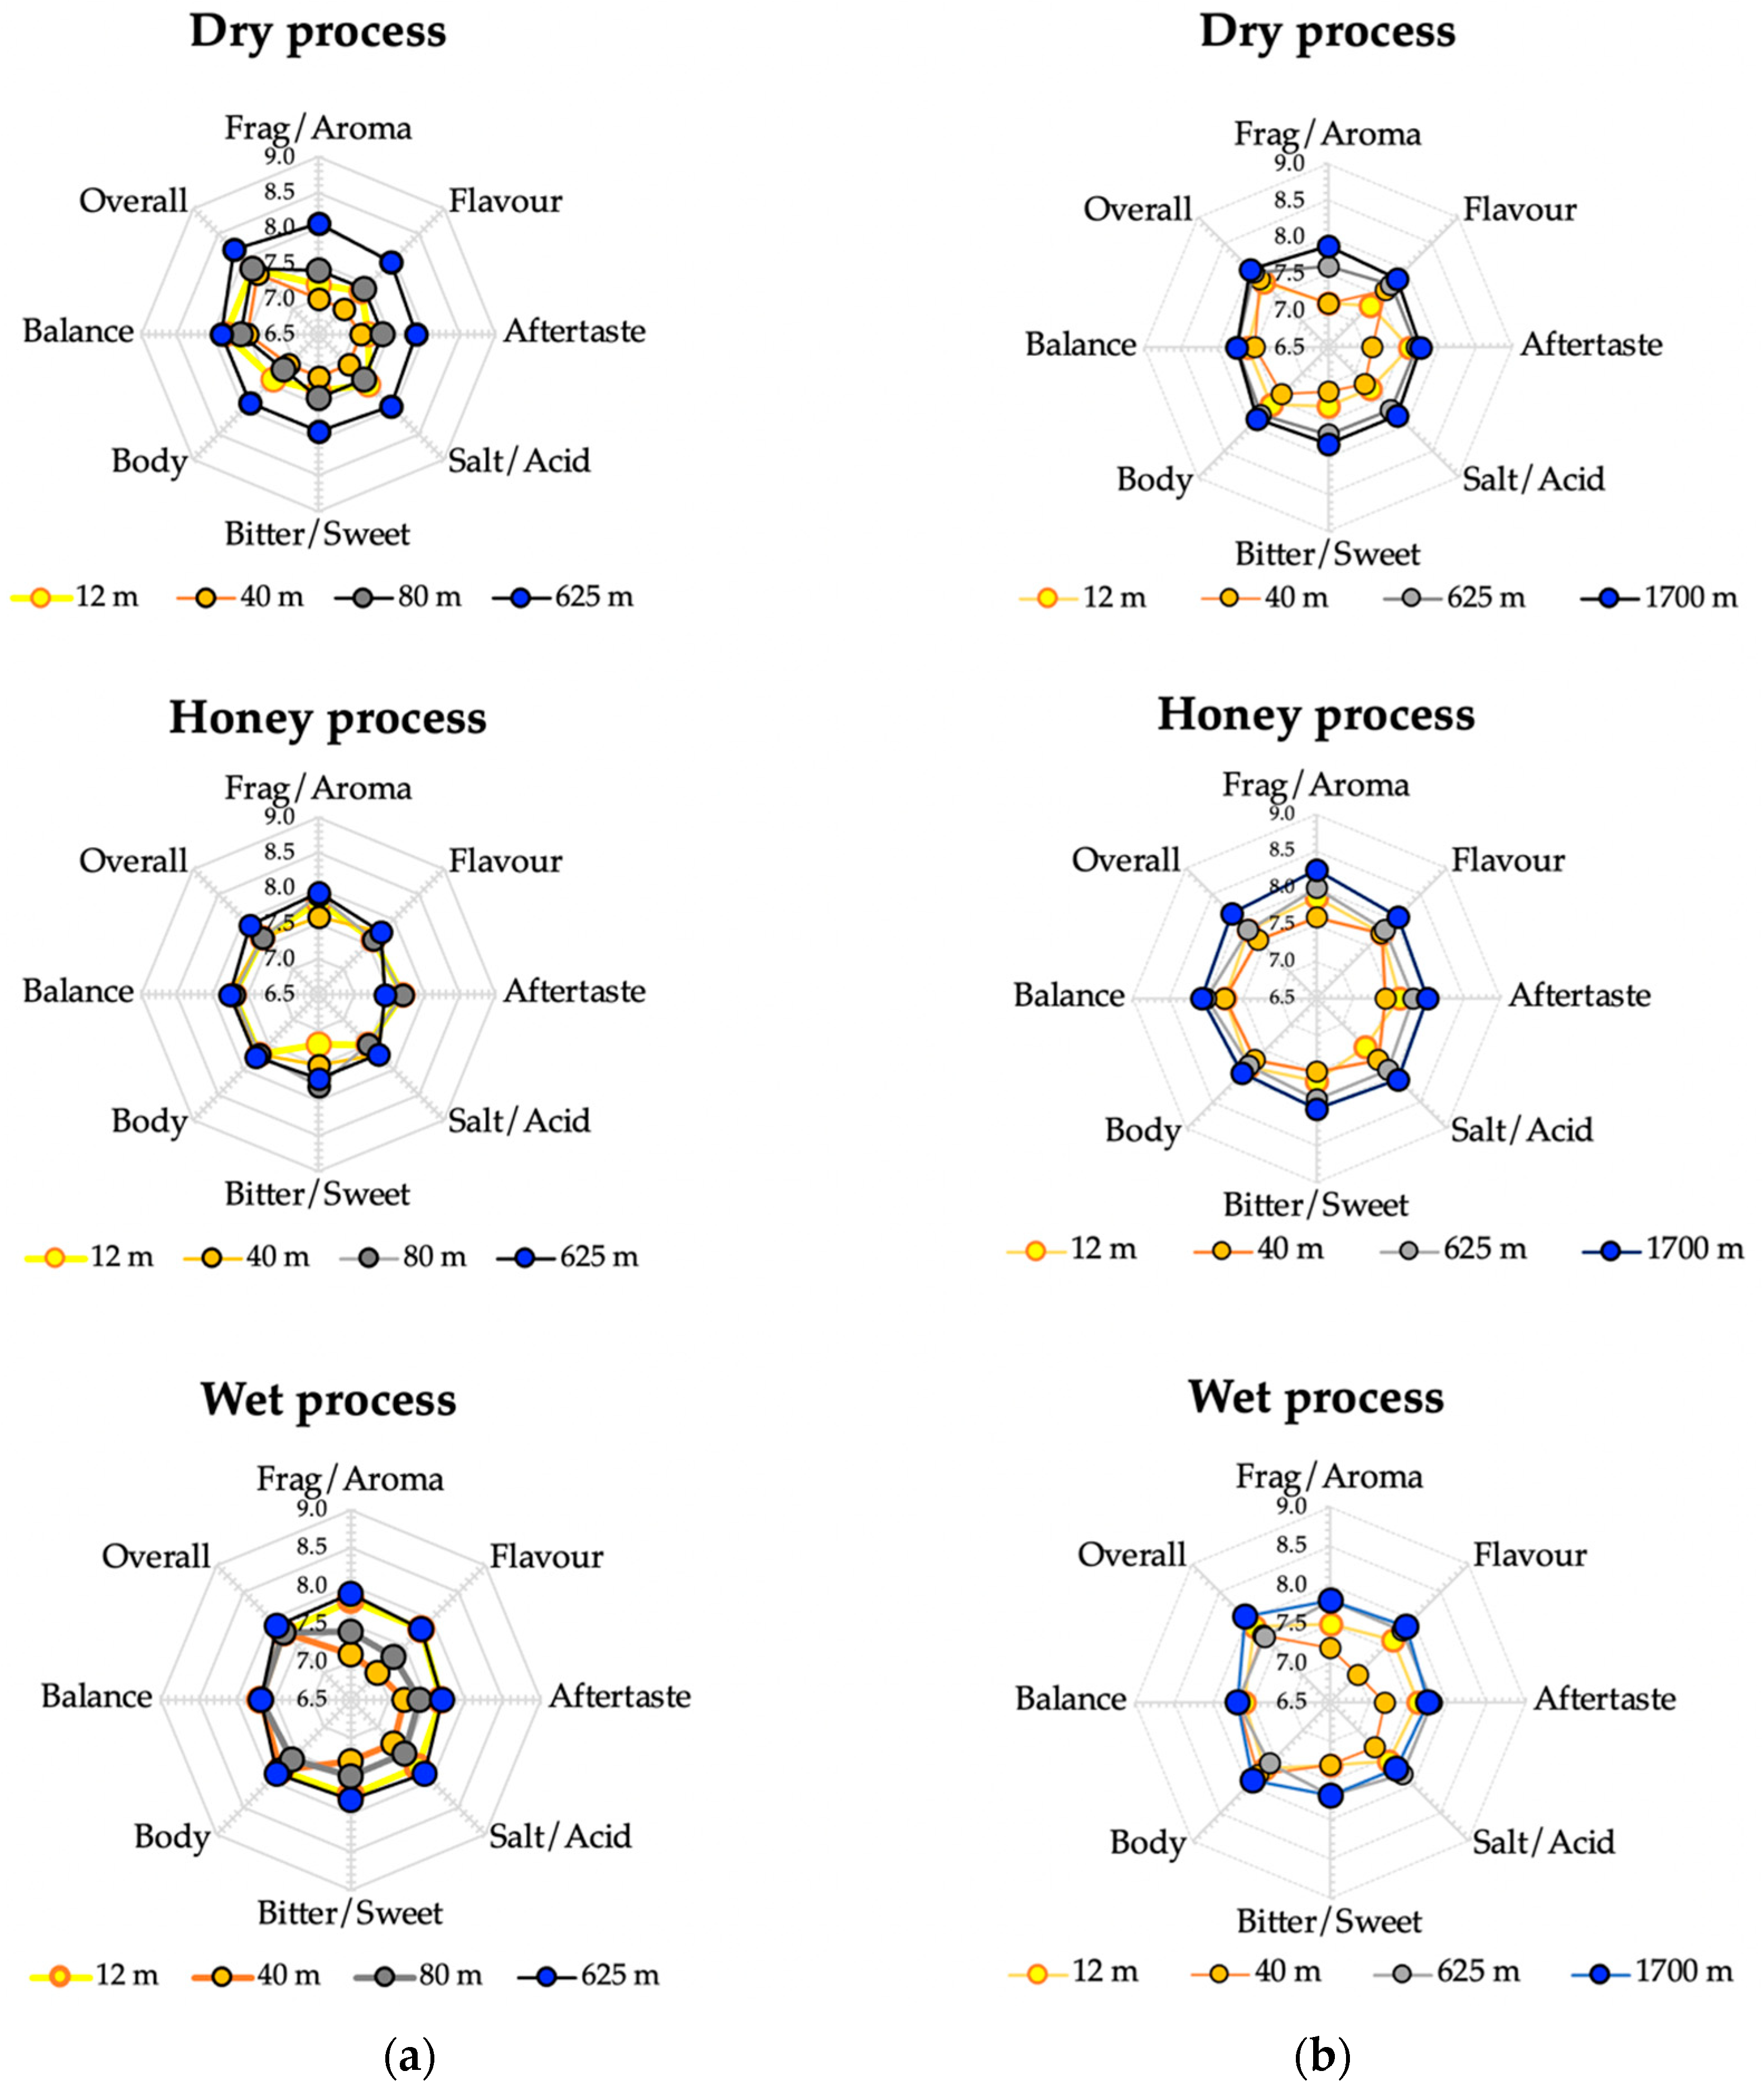
3.1. Effect of Post-Harvest Processes and Altitude on Coffee Cupping

According to Figure 2, all congolensis and conilon samples from different altitudes (12, 40, 80, 625, and 1700 m.a.m.s.l.) and post-harvest processes scored above 7.00 points, indicating that the panel of assessors rated them as very good and excellent in terms of aroma/flavour, aftertaste, salt/acidity, bitter/sweet balance, mouthfeel, body, cup balance, and overall score. The defects reached a score of 0 points in all cases. All the samples scored a maximum of 10 points for each of the variables clean-cup and uniformity, which were added to the total scores of the other sensory variables (Figure 3 and Figure 4).
At a 12–40 m altitude, after the three post-harvest processes, coffee cupping produced significantly different attribute scores (p < 0.05), with a maximum value of 7.80 points (rated ‘very good’) for fragrance/aroma. At this altitude, dry processing reached the lowest scores, up to 7.0 points for fragrance/aroma, flavour, aftertaste, salt–acid, bitter–sweet, and body for both conilon and congolensis. The average grade for honey processing was an excellent 8.0 (Figure 2).
At an 80 m altitude, congolensis coffee’s cupping results revealed an improvement in flavour, sweetness, and aroma but not in aftertaste or acidity (Figure 2). All post-harvest processes improved the quality of the cup, but dry processing did not. Conilon plantations were not present in our study at this height.
At an altitude of 625 m, for both conilon and congolensis, all three post-harvest processes improved the ratings of all attributes with nearly no statistically significant difference (p > 0.05) among them (Table 2).
At 1700 m, only samples from conilon were tested, because congolensis plantations were not found at that altitude. Nonetheless, all conilon cup coffee characteristics had excellent score values at higher altitudes.
After dry-processing, congolensis obtained a very good grade for fragrance/aroma, flavour, aftertaste, salt–acid, bitter–sweet, and body from samples grown at elevations ranging from 12 to 80 m; meanwhile, at a 625 m altitude, the average overall attribute score was excellent (Figure 2). After honey and wet processing, congolensis obtained very good grades in all sensory attributes, with an average overall attribute score of excellent for samples growing at a 625 m altitude.
Conilon received very good scores after all three post-harvest processes in all the categories of fragrance/aroma, flavour, aftertaste, salt–acid, bitter–sweet, and body; besides this, conilon had an average overall attribute score of ‘excellent’ between 625 and 1700 m.
The effects of dry, honey, and wet post-harvest processes on congolensis coffee cupping were significantly different (Table 2). For congolensis, a significant difference (p < 0.05) was found across all sensory attributes when coffee beans were post-harvested by different means at different altitudes. Congolensis and conilon were not found in all altitudes, and thus the coffee variety did not offer a meaningful response and did not interact significantly with either the altitude or the post-harvest processing factors.
As altitude increased, particularly above 625 m, congolensis coffees from the dry, honey, and wet processes improved in most sensory qualities. When comparing post-harvest congolensis samples at higher altitudes (Table 3), there was no difference in sensory attributes (p > 0.05) except for acidity, sweetness, and balance.
The effects of dry, honey, and wet post-harvest processes on conilon coffee cupping were significantly different (Table 4). For conilon, a significant difference (p < 0.05) was found across all sensory attributes when coffee beans were post-harvested by different means at different altitudes. Nevertheless, the interaction process:altitude was not significant (p > 0.05) for the attribute balance.
In Table 5, Tukey’s test determines where the significant difference (p < 0.05) exists among all sensory attributes at different altitudes. From the post-hoc test results, there were statistically significant differences between the honey, wet, and dry processes for fragrance/aroma, flavour, acidity, and overall score at lower altitudes (12 to 80 m). However, up to 1700 m, there were no significant differences—for example, for flavour, aftertaste, acidity, sweetness, or body—except for fragrance/aroma, balance, and overall score.
Tukey’s test is applied in Table 5 to evaluate where there is a significant difference (p < 0.05) among all sensory qualities at different elevations. According to the post-hoc test results, there were statistically significant differences in fragrance/aroma, flavour, acidity, and overall score at lower elevations in all processes (12 to 80 m). However, there were no significant differences (p > 0.05) in flavour, aftertaste, acidity, sweetness, and body up to 1700 m, although there were differences in fragrance/aroma, balance, and overall score.

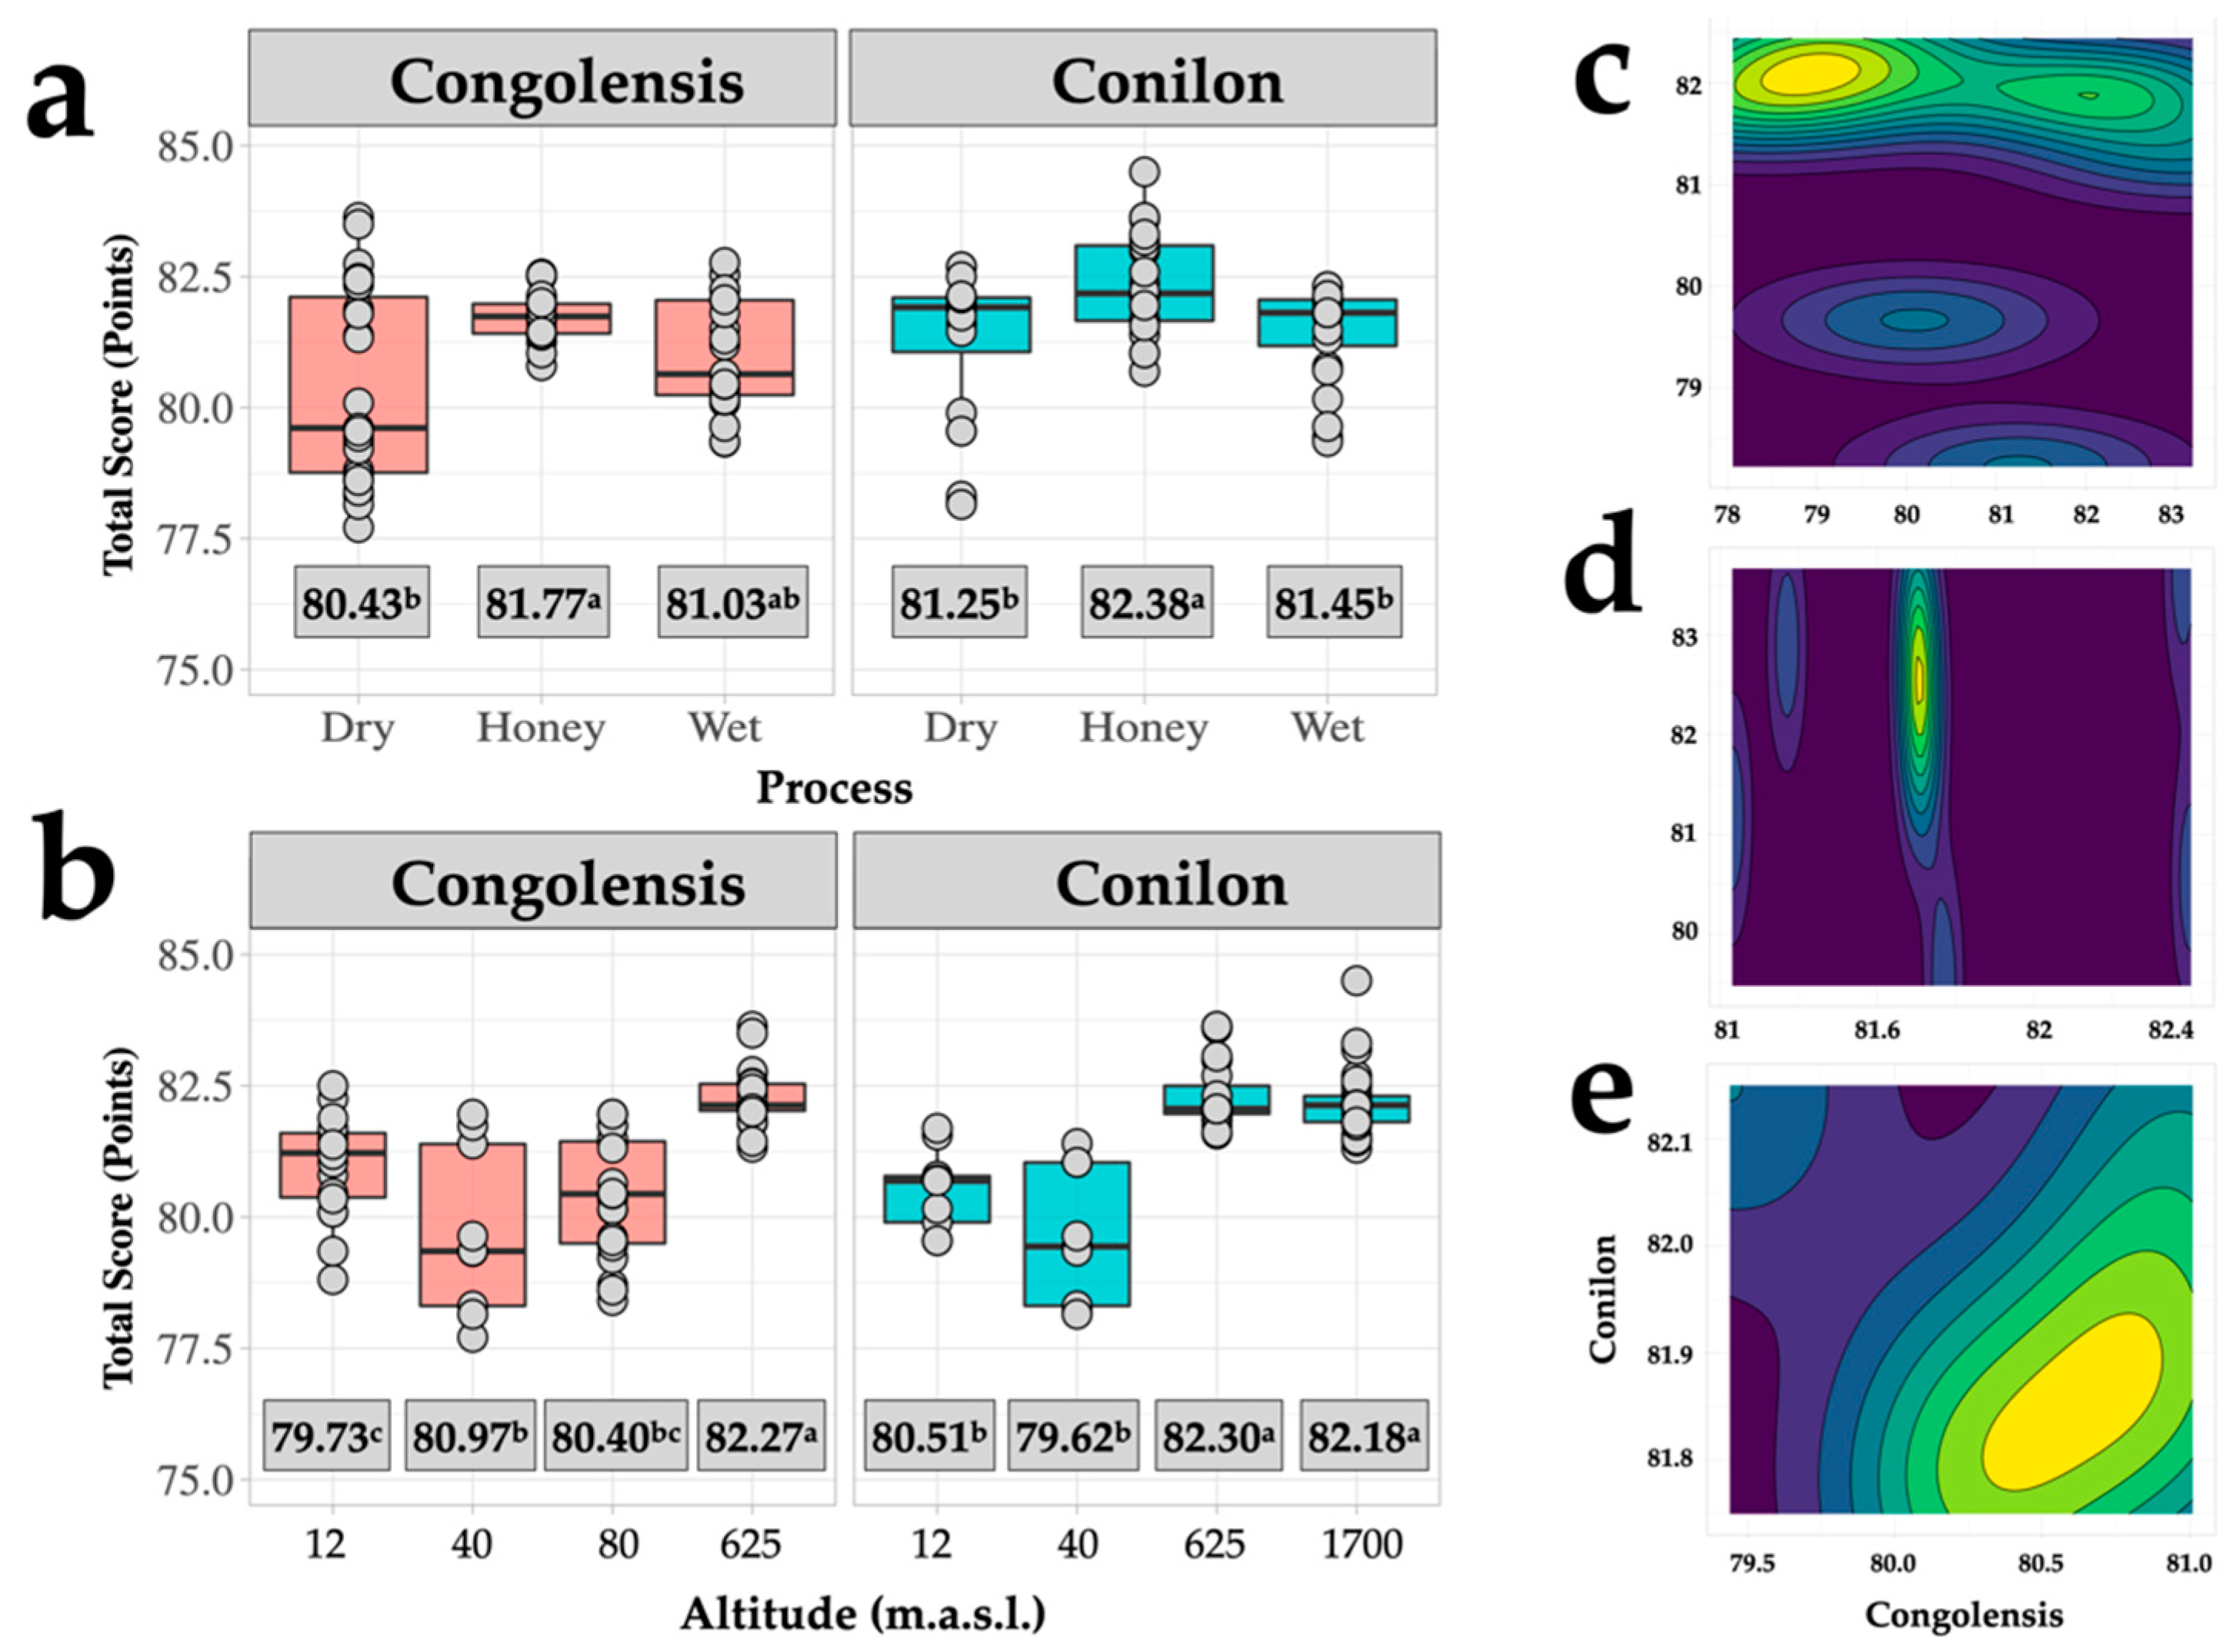
3.2. Effect of Post-Harvest Processes and Altitude on Total Score

The effects of higher altitude on coffee cupping are shown in Figure 3. It shows the total cupping scores for coffee congolensis and conilon harvested at various elevations (12, 40, 80, 625, and 1700 m.a.m.s.l.) applying dry, honey, and wet post-harvest methods. The results show that each altitude and processing method gives the coffee a unique cup profile.
Samples of congolensis and conilon grown under 80 m were identified as commercial grade. However, there were some exceptions for honey- and wet-processed samples from 12 and 40 m which were regarded as speciality grade. Above a 625 m altitude, all samples from all three processes were classified as speciality grade. Thus, the higher the altitude, the higher the coffee’s sensory quality [32,49,50,51].
Figure 4 shows the effect of post-harvesting processes and altitudes on the accumulative total score of all 17 farms; also, it shows the post-hoc test to evaluate where there is a significant difference (p < 0.05) among all processes and different elevations. The mean values indicate that congolensis and conilon samples grown under 40 m received scores below 80 points, which are regarded as commercial grade coffee. According to contour plots, conilon was perceived to have the best sensory attributes at high altitudes using honey processing. In general, the wet-processed congolensis and conilon samples have a tastier profile than dry-processed ones.

4. Discussion

At an altitude of 12–40 m, fragrance/aroma, flavour, aftertaste, salt–acid, bitter–sweet, and body scores were all as low as 7.0 points for dry-processed conilon and congolensis (Figure 2). The results showed that the flavour, sweetness, and scent of congolensis coffee improved at 80 m but not the aftertaste or acidity. C. canephora grown under 800 m has a high bitterness, astringency, strength, body, grassy flavour, and a low aromatic value [25,27,32,45,52,53]. According to the present results, for both congolensis and conilon, acidity was an attribute with the lowest scores up to 7.0 points. At this altitude, it is feasible that a high humidity led to fermentation, and therefore fragrance/aroma and flavour are more likely reduced.
According to the findings of this study, the overall score of the two coffee species at higher altitudes exceeds 80 points, indicating that they belong to speciality grade. At higher altitudes, sweetness, smoother taste, and cup quality increases in C. canephora [39]. Caramel, brown sugar, fruity, almond, apricot, very sweet, coconut bullet, and fruity are the flavour characteristics that are most prevalent [54]. This increase in sensory attributes is related with the coffee plant’s slow growth and a higher precipitation index. Due to the slower maturation rate at higher elevations, photoassimilates (sucrose, polyols, and amino acids), which are associated with a flavourful aroma, accumulate in greater concentrations in the coffee tree’s leaves and fruits [26,55,56]. Furthermore, the slower ripening process allows a greater production of phenolic compounds and more intensely flavoured beans than those grown in lower areas, or under full sunlight [49,57].
The dry process produces a less aromatic but full body coffee cup, but it depends on the variability of climatic conditions which results in an inconsistency of drying [58,59]. Furthermore, drying temperatures above 40 °C for parchment and 45 °C for cherries have a noticeable impact on the quality of the final cup of coffee. Excessive drying would occur if air flow, relative humidity, and pressure are not managed, causing a great deal of water to evaporate off the bean’s surface [60]. During the drying process, coffee beans remain viable with metabolic activities to produce a wide variety of free amino acids from proteins, and low-molecular-weight sugars (i.e., glucose, fructose, and mannose); however, the germination process is inhibited [57,61]. The inhibition of germination is related to low coffee cup quality, and this is related to the accumulation of gamma-amino butyric acid (GABA) [26]. On the contrary, during the wet process, germination occurs immediately after depulping. The most likely metabolic events in living seeds are related to germination, which enhances coffee cup quality [57,62]. Therefore, the characteristics of coffee produced by dry and wet processing remain distinct.
The wet processes herein tested produced coffees with more flavour and acidity but with less body than those samples from the dry-processing method, according to our results. In the wet coffee-processing methods, fermentation occurs in water at more controlled temperatures which produce lower levels of undesirable flavours [26]. Thus, the washed coffee is often associated with better cup quality. Wet-processed coffees have a better aroma with a pleasantly higher acid content, resulting in higher acceptance [24,57]. Besides this, in the wet method, sugars and pectins present in the mucilage allow microorganisms’ growth, thus playing an important role in coffee flavour [63].
The hypotheses established as the premise of this study should be accepted in the context of the information presented herein.

5. Conclusions

Crop altitude and post-harvest processes influence perceived coffee cupping. Our results indicate that the greater the altitude, the higher the quality of the coffee, and that wet-processed coffees are preferred. Altitude had a strong impact on the physicochemical qualities and consequently the organoleptic quality of the coffee, representing the key element that influenced the coffee sensory quality. Congolensis and conilon received high average scores for fragrance/aroma, flavour, aftertaste, salt/acidity, bitter/sweet balance, mouthfeel, body, cup balance, and overall score. Honey processing produced the highest fragrance/aroma, flavour, aftertaste, salt/acidity, bitter/sweet, body, balance, and overall ratings for all congolensis and conilon samples from varied altitudes. Conilon outperformed congolensis in all qualities using the dry, honey, and wet procedures. At a 12–40 m altitude, congolensis had the lowest fragrance/aroma and flavour values in all post-harvest processes. Higher altitude coffees exhibit the highest scent strength and quality. Wet-processed congolensis and conilon samples possessed a more flavourful character than dry-processed samples. Dry processing results in a hard coffee, whereas wet processing results in a better-quality coffee with less body, higher acidity, and more aroma than dry processing. As a result of arabica’s increased sensitivity to temperature fluctuations, C. canephora might benefit in this scenario. As a result, more information on the C. canephora market is needed, particularly regarding customer characteristics and purchasing patterns. This study suggests that any C. canephora cultivar has the potential to produce high-quality coffee; nevertheless, flavour profiles will vary depending on growing conditions.

Author Contributions

Conceptualization, S.V. and J.G.-C.; methodology, S.V. and W.C.; software, C.B.; validation, S.V., W.C. and C.B.; formal analysis, S.V. and W.C.; investigation, S.V.; resources, S.V.; data curation, S.V.; writing—original draft preparation, S.V. and C.B.; writing—review and editing, S.V.; visualization, C.B.; supervision, J.G.-C.; funding acquisition, S.V. All authors have read and agreed to the published version of the manuscript.

Funding

This research received funding from Escuela Superior Politécnica Agropecuaria de Manabí, ESPAM-MFL, Calceta.

Data Availability Statement

The data supporting all figures are publicly available in the Figshare repository, as part of this record: https://doi.org/10.6084/m9.figshare.21300144.v1 (accessed on 8 October 2022).

Acknowledgments

We would like to express our gratitude to Miryam Félix López (ESPAM) for her invaluable support.

Conflicts of Interest

The authors declare no conflict of interest.

References

  1. ICO. Monthly Coffee Market Report (2021/22); ICO: London, UK, 2021. [Google Scholar]
  2. Campuzano-Duque, L.F.; Herrera, J.C.; Ged, C.; Blair, M.W. Bases for the Establishment of Robusta Coffee (Coffea canephora) as a New Crop for Colombia. Agronomy 2021, 11, 2550. [Google Scholar] [CrossRef]
  3. Bunn, C.; Läderach, P.; Ovalle Rivera, O.; Kirschke, D. A Bitter Cup: Climate Change Profile of Global Production of Arabica and Robusta Coffee. Clim. Chang. 2015, 129, 89–101. [Google Scholar] [CrossRef] [Green Version]
  4. Byrareddy, V.; Kouadio, L.; Mushtaq, S.; Kath, J.; Stone, R. Coping with Drought: Lessons Learned from Robusta Coffee Growers in Vietnam. Clim. Serv. 2021, 22, 100229. [Google Scholar] [CrossRef]
  5. Kath, J.; Mittahalli Byrareddy, V.; Mushtaq, S.; Craparo, A.; Porcel, M. Temperature and Rainfall Impacts on Robusta Coffee Bean Characteristics. Clim. Risk Manag. 2021, 32, 100281. [Google Scholar] [CrossRef]
  6. Bosselmann, A.S.; Dons, K.; Oberthur, T.; Olsen, C.S. The Influence of Shade Trees on Coffee Quality in Small Holder Coffee 3 Agroforestry Systems in Southern Colombia. Agric. Ecosyst. Environ. 2009, 129, 8. [Google Scholar] [CrossRef]
  7. Ahmed, S.; Brinkley, S.; Smith, E.; Sela, A.; Theisen, M.; Thibodeau, C.; Warne, T.; Anderson, E.; Van Dusen, N.; Giuliano, P.; et al. Climate Change and Coffee Quality: Systematic Review on the Effects of Environmental and Management Variation on Secondary Metabolites and Sensory Attributes of Coffea arabica and Coffea canephora. Front. Plant Sci. 2021, 12, 708013. [Google Scholar] [CrossRef]
  8. Kittichotsatsawat, Y.; Jangkrajarng, V.; Tippayawong, K.Y. Enhancing Coffee Supply Chain towards Sustainable Growth with Big Data and Modern Agricultural Technologies. Sustainability 2021, 13, 4593. [Google Scholar] [CrossRef]
  9. Läderach, P.; Ramirez–Villegas, J.; Navarro-Racines, C.; Zelaya, C.; Martinez–Valle, A.; Jarvis, A. Climate Change Adaptation of Coffee Production in Space and Time. Clim. Chang. 2017, 141, 47–62. [Google Scholar] [CrossRef] [Green Version]
  10. Chemura, A.; Mudereri, B.T.; Yalew, A.W.; Gornott, C. Climate Change and Specialty Coffee Potential in Ethiopia. Sci. Rep. 2021, 11, 8097. [Google Scholar] [CrossRef]
  11. Hameed, A.; Hussain, S.A.; Ijaz, M.U.; Ullah, S.; Pasha, I.; Suleria, H.A.R. Farm to Consumer: Factors Affecting the Organoleptic Characteristics of Coffee. II: Postharvest Processing Factors: Farm to Consumer. Compr. Rev. Food Sci. Food Saf. 2018, 17, 1184–1237. [Google Scholar] [CrossRef]
  12. Rojas-Múnera, D.M.; Feijoo-Martínez, A.; Molina-Rico, L.J.; Zúñiga, M.C.; Quintero, H. Differential Impact of Altitude and a Plantain Cultivation System on Soil Macroinvertebrates in the Colombian Coffee Region. Appl. Soil Ecol. 2021, 164, 103931. [Google Scholar] [CrossRef]
  13. Gichuru, E.; Alwora, G.; Gimase, J.; Kathurima, C. Coffee Leaf Rust (Hemileia vastatrix) in Kenya—A Review. Agronomy 2021, 11, 2590. [Google Scholar] [CrossRef]
  14. Pereira, D.; Nadaleti, D.; Rodrigues, E.; Silva, A.; Malta, M.; Carvalho, S.; Carvalho, G. Genetic and Chemical Control of Coffee Rust (Hemileia vastatrix Berk et Br.): Impacts on Coffee (Coffea Arabica L.) Quality. J. Sci. Food Agric. 2021, 101, 2836–2845. [Google Scholar] [CrossRef] [PubMed]
  15. Wagner, S.; Jassogne, L.; Price, E.; Jones, M.; Preziosi, R. Impact of Climate Change on the Production of Coffea arabica at Mt. Kilimanjaro, Tanzania. Agriculture 2021, 11, 53. [Google Scholar] [CrossRef]
  16. Guerrero-Parra, H.A.; Calderón-Ezquerro, M.C.; Martínez-López, B. Environmental Factors That Modulate the Release and Transport of Airborne Urediniospores Hemileia vastatrix (Berk. & Broome) in Coffee Crops in Veracruz México. Aerobiologia 2022, 38, 123–143. [Google Scholar] [CrossRef]
  17. Mulindwa, J.; Kaaya, A.N.; Muganga, L.; Paga, M.; Musoli, P.; Sseremba, G.; Wagoire, W.W.; Bitalo, D.N. Cup Quality Profiles of Robusta Coffee Wilt Disease Resistant Varieties Grown in Three Agro-Ecologies in Uganda. J. Sci. Food Agric. 2021, 102, 1225–1232. [Google Scholar] [CrossRef]
  18. Pereira, L.; Moreli, A.; Moreira, T.; Caten, C.; Marcate, J.; Debona, D.; Guarçoni, R. Improvement of the Quality of Brazilian Conilon through Wet Processing: A Sensorial Perspective. AS 2019, 10, 395–411. [Google Scholar] [CrossRef] [Green Version]
  19. Pereira, L.; Guarçoni, R.; Pinheiro, P.; Osório, V.; Pinheiro, C.; Moreira, T.; Schwengber, C. New Propositions about Coffee Wet Processing: Chemical and Sensory Perspectives. Food Chem. 2020, 310, 125943. [Google Scholar] [CrossRef]
  20. do Livramento, K.G.; Borém, F.M.; José, A.C.; Santos, A.V.; do Livramento, D.E.; Alves, J.D.; Paiva, L.V. Proteomic Analysis of Coffee Grains Exposed to Different Drying Process. Food Chem. 2017, 221, 1874–1882. [Google Scholar] [CrossRef]
  21. Wei, F.; Tanokura, M. Chemical Changes in the Components of Coffee Beans during Roasting. In Coffee in Health and Disease Prevention; Elsevier: Amsterdam, The Netherlands, 2015; pp. 83–91. ISBN 978-0-12-409517-5. [Google Scholar]
  22. Waters, D.M.; Arendt, E.K.; Moroni, A.V. Overview on the Mechanisms of Coffee Germination and Fermentation and Their Significance for Coffee and Coffee Beverage Quality. Crit. Rev. Food Sci. Nutr. 2017, 57, 259–274. [Google Scholar] [CrossRef]
  23. Girma, B.; Sualeh, A. A Review of Coffee Processing Methods and Their Influence on Aroma. Int. J. Food Eng. Technol. 2022, 6, 7. [Google Scholar] [CrossRef]
  24. Campos, G.A.F.; Kruizenga, J.G.K.T.; Sagu, S.T.; Schwarz, S.; Homann, T.; Taubert, A.; Rawel, H.M. Effect of the Post-Harvest Processing on Protein Modification in Green Coffee Beans by Phenolic Compounds. Foods 2022, 11, 159. [Google Scholar] [CrossRef] [PubMed]
  25. Zakidou, P.; Plati, F.; Matsakidou, A.; Varka, E.-M.; Blekas, G.; Paraskevopoulou, A. Single Origin Coffee Aroma: From Optimized Flavor Protocols and Coffee Customization to Instrumental Volatile Characterization and Chemometrics. Molecules 2021, 26, 4609. [Google Scholar] [CrossRef]
  26. Bastian, F.; Hutabarat, O.S.; Dirpan, A.; Nainu, F.; Harapan, H.; Emran, T.B.; Simal-Gandara, J. From Plantation to Cup: Changes in Bioactive Compounds during Coffee Processing. Foods 2021, 10, 2827. [Google Scholar] [CrossRef] [PubMed]
  27. Schwan, R.; Fleet, G. Cocoa and Coffee Fermentations, 1st ed.; CRC Press: Boca Raton, FL, USA, 2014; Volume 1, ISBN 978-0-429-06292-6. [Google Scholar]
  28. Ribeiro, L.S.; Miguel, M.G.D.C.P.; Evangelista, S.R.; Martins, P.M.M.; van Mullem, J.; Belizario, M.H.; Schwan, R.F. Behavior of Yeast Inoculated during Semi-Dry Coffee Fermentation and the Effect on Chemical and Sensorial Properties of the Final Beverage. Food Res. Int. 2017, 92, 26–32. [Google Scholar] [CrossRef] [PubMed]
  29. Duarte, G.S.; Pereira, A.A.; Farah, A. Chlorogenic Acids and Other Relevant Compounds in Brazilian Coffees Processed by Semi-Dry and Wet Post-Harvesting Methods. Food Chem. 2010, 118, 851–855. [Google Scholar] [CrossRef]
  30. Lee, L.W.; Cheong, M.W.; Curran, P.; Yu, B.; Liu, S.Q. Coffee Fermentation and Flavor—An Intricate and Delicate Relationship. Food Chem. 2015, 185, 182–191. [Google Scholar] [CrossRef]
  31. Mahmud, M.M.C.; Shellie, R.A.; Keast, R. Unravelling the Relationship between Aroma Compounds and Consumer Acceptance: Coffee as an Example. Compr. Rev. Food Sci. Food Saf. 2020, 19, 2380–2420. [Google Scholar] [CrossRef]
  32. Worku, M.; de Meulenaer, B.; Duchateau, L.; Boeckx, P. Effect of Altitude on Biochemical Composition and Quality of Green Arabica Coffee Beans Can Be Affected by Shade and Postharvest Processing Method. Food Res. Int. 2018, 105, 278–285. [Google Scholar] [CrossRef]
  33. Pinheiro, C.A.; Pereira, L.L.; Fioresi, D.B.; da Silva Oliveira, D.; Osório, V.M.; Silva, J.A.D.; Pereira, U.A.; Ferrão, M.A.G.; Souza, E.M.R.; da Fonseca, A.F.A.; et al. Physico-Chemical Properties and Sensory Profile of Coffea canephora Genotypes in High-Altitudes. Aust. J. Crop Sci. 2019, 13, 2046–2052. [Google Scholar] [CrossRef]
  34. Vargas-Pereira, P.; Silveira, D.; Schwan, R.; Assis Silva, S.; Coelho, J.; Bernardes, P. Effect of Altitude and Terrain Aspect on the Chemical Composition of Coffea canephora Cherries and Sensory Characteristics of the Beverage. J. Sci. Food Agric. 2021, 101, 2570–2575. [Google Scholar] [CrossRef] [PubMed]
  35. Rodriguez, Y.; Guzman, N.; Hernandez, J. Effect of the Postharvest Processing Method on the Biochemical Composition and Sensory Analysis of Arabica Coffee. Eng. Agrícola 2020, 40, 177–183. [Google Scholar] [CrossRef] [Green Version]
  36. Barbosa, I.; de Oliveira, A.; Rosado, R.; Sakiyama, N.; Cruz, C.; Pereira, A. Sensory Analysis of Arabica Coffee: Cultivars of Rust Resistance with Potential for the Specialty Coffee Market. Euphytica 2020, 216, 165. [Google Scholar] [CrossRef]
  37. Bressani, A.P.P.; Martinez, S.J.; Batista, N.N.; Simão, J.B.P.; Dias, D.R.; Schwan, R.F. Co-Inoculation of Yeasts Starters: A Strategy to Improve Quality of Low Altitude Arabica Coffee. Food Chem. 2021, 361, 130133. [Google Scholar] [CrossRef] [PubMed]
  38. Elmacı, İ.; Gok, I. Effect of Three Post-harvest Methods and Roasting Degree on Sensory Profile of Turkish Coffee Assessed by Turkish and Brazilian Panelists. J. Sci. Food Agric. 2021, 101, 5368–5377. [Google Scholar] [CrossRef] [PubMed]
  39. Figueiredo, L.P.; Borém, F.M.; Ribeiro, F.C.; Giomo, G.S.; Malta, M.R. Coffee Cultivated in Different Environments. Coffee Sci. 2018, 13, 10. [Google Scholar] [CrossRef] [Green Version]
  40. Gamonal, L.E.; Vallejos-Torres, G.; López, L.A. Sensory Analysis of Four Cultivars of Coffee (Coffea arabica, L.), Grown at Different Altitudes in the San Martin Region—Peru. Ciência Rural. 2017, 47, 1–5. [Google Scholar] [CrossRef] [Green Version]
  41. Gumecindo-Alejo, A.L.; Sánchez-Landero, L.A.; Ortiz-Ceballos, G.C.; Roberto Cerdán Cabrera, C.; Alvarado-Castillo, G. Factors Related to Coffee Quality, Based on the “Cup of Excellence” Contest in Mexico. Coffee Sci. 2021, 16, 1–10. [Google Scholar] [CrossRef]
  42. Evangelista, S.R.; Silva, C.F.; Miguel, M.G.P.D.C.; Cordeiro, C.D.S.; Pinheiro, A.C.M.; Duarte, W.F.; Schwan, R.F. Improvement of Coffee Beverage Quality by Using Selected Yeasts Strains during the Fermentation in Dry Process. Food Res. Int. 2014, 61, 183–195. [Google Scholar] [CrossRef] [Green Version]
  43. Wulandari, S.; Ainuri, M.; Sukartiko, A.C. Biochemical Content of Robusta Coffees under Fully-Wash, Honey, and Natural Processing Methods. IOP Conf. Ser. Earth Environ. Sci. 2021, 819, 012067. [Google Scholar] [CrossRef]
  44. Saloko, S.; Sulastri, Y.; Murad; Rinjani, M. The Effects of Temperature and Roasting Time on the Quality of Ground Robusta Coffee (Coffea rabusta) Using Gene Café Roaster. In Proceedings of the Bioscience, Biotechnology, and Biometrics, Lombok, Indonesia, 13–14 August 2019; AIP Publishing: Lombok, Indonesia, 2019; p. 060001. [Google Scholar]
  45. Folmer, B. (Ed.) The Craft and Science of Coffee; Academic Press—Elsevier: Amsterdam, The Netherlands; Boston, MA, USA, 2017; Volume 1, ISBN 978-0-12-803520-7. [Google Scholar]
  46. Pereira, L.; Cardoso, W.; Guarçoni, R.; da Fonseca, A.; Moreira, R.; Schwengber, C. The Consistency in the Sensory Analysis of Coffees Using Q-Graders. Eur. Food Res. Technol. 2017, 243, 1545–1554. [Google Scholar] [CrossRef]
  47. R Core Team. R: A Language and Environment for Statistical Computing. Available online: https://www.R-project.org/ (accessed on 1 October 2022).
  48. Wickham, H. Ggplot2: Elegant Graphics for Data Analysis, 1st ed.; Springer: New York, NY, USA, 2016; Volume 1, ISBN 978-3-319-24277-4. [Google Scholar]
  49. Avelino, J.; Barboza, B.; Davrieux, F.; Guyot, B. Shade Effects on Sensory and Chemical Characteristics of Coffee from Very High Altitude Plantations in Costa Rica. In Proceedings of the Conference: Second International Symposium on Multi-Strata Agroforestry Systems with Perennial Crops: Making Ecosystem Services Count for Farmers, Consumers and the Environment, Turrialba, Costa Rica, 17–21 September 2007; CATIE: Turrialba, Costa Rica, 2007. [Google Scholar]
  50. Silveira, A.; Pinheiro, A.; Ferreira, W.; Silva, L.; Rufino, J.; Sakiyama, N. Sensory Analysis of Specialty Coffee from Different Environmental Conditions in the Region of Matas de Minas, Minas Gerais, Brazil. Rev. Ceres 2016, 63, 436–443. [Google Scholar] [CrossRef] [Green Version]
  51. Tolessa, K.; D’heer, J.; Duchateau, L.; Boeckx, P. Influence of Growing Altitude, Shade and Harvest Period on Quality and Biochemical Composition of Ethiopian Specialty Coffee: Quality and Biochemical Composition of Ethiopian Specialty Coffee. J. Sci. Food Agric. 2017, 97, 2849–2857. [Google Scholar] [CrossRef] [PubMed]
  52. Louzada, L.; Rizzo, T. (Eds.) Quality Determinants In Coffee Production; Food Engineering Series; Springer International Publishing: Cham, Switzerland, 2021; ISBN 978-3-030-54436-2. [Google Scholar]
  53. Gebrekidan, M.; Redi-Abshiro, M.; Chandravanshi, B.; Ele, E.; Ahmed, M.; Mamo, H. Influence of Altitudes of Coffee Plants on the Alkaloids Contents of Green Coffee Beans. Chem. Int. 2019, 5, 247–257. [Google Scholar] [CrossRef] [Green Version]
  54. Ferreira, D.; do Amaral, J.; Pereira, L.; Ferreira, J.; Guarçoni, R.; Moreira, T.; de Oliveira, A.; Rodrigues, W.; de Almeida, S.; Ribeiro, W.; et al. Physico-Chemical and Sensory Interactions of Arabica Coffee Genotypes in Different Water Regimes. J. Agric. Sci. 2021, 159, 50–58. [Google Scholar] [CrossRef]
  55. Sunarharum, W.B.; Williams, D.J.; Smyth, H.E. Complexity of Coffee Flavor: A Compositional and Sensory Perspective. Food Res. Int. 2014, 62, 315–325. [Google Scholar] [CrossRef]
  56. Velásquez, S.; Franco, A.P.; Peña, N.; Bohórquez, J.C.; Gutierrez, N. Effect of Coffee Cherry Maturity on the Performance of the Drying Process of the Bean: Sorption Isotherms and Dielectric Spectroscopy. Food Control. 2021, 123, 107692. [Google Scholar] [CrossRef]
  57. Joët, T.; Laffargue, A.; Descroix, F.; Doulbeau, S.; Bertrand, B.; de Kochko, A.; Dussert, S. Influence of Environmental Factors, Wet Processing and Their Interactions on the Biochemical Composition of Green Arabica Coffee Beans. Food Chem. 2010, 118, 693–701. [Google Scholar] [CrossRef]
  58. Banti, M.; Abraham, E. Coffee Processing Methods, Coffee Quality and Related Environmental Issues. J. Food Nutr. Sci. 2021, 9, 144. [Google Scholar] [CrossRef]
  59. Firdissa, E.; Mohammed, A.; Berecha, G.; Garedew, W. Coffee Drying and Processing Method Influence Quality of Arabica Coffee Varieties (Coffee arabica, L.) at Gomma I and Limmu Kossa, Southwest Ethiopia. J. Food Qual. 2022, 2022, 9184374. [Google Scholar] [CrossRef]
  60. Li, Z.; Zhang, C.; Zhang, Y.; Zeng, W.; Cesarino, I. Coffee Cell Walls—Composition, Influence on Cup Quality and Opportunities for Coffee Improvements. Food Qual. Saf. 2021, 5, fyab012. [Google Scholar] [CrossRef]
  61. de Melo Pereira, G.V.; de Carvalho Neto, D.P.; Magalhães Júnior, A.I.; Vásquez, Z.S.; Medeiros, A.B.P.; Vandenberghe, L.P.S.; Soccol, C.R. Exploring the Impacts of Postharvest Processing on the Aroma Formation of Coffee Beans—A Review. Food Chem. 2019, 272, 441–452. [Google Scholar] [CrossRef] [PubMed]
  62. Selmar, D.; Bytof, G.; Knopp, S.-E.; Breitenstein, B. Germination of Coffee Seeds and Its Significance for Coffee Quality. Plant Biol. 2006, 8, 260–264. [Google Scholar] [CrossRef]
  63. Elhalis, H.; Cox, J.; Frank, D.; Zhao, J. The Role of Wet Fermentation in Enhancing Coffee Flavor, Aroma and Sensory Quality. Eur. Food Res. Technol. 2021, 247, 485–498. [Google Scholar] [CrossRef]
Figure 1. Sampling points in Ecuador.
Beverages 08 00083 g001
Figure 2. Average score of sensory profile evaluated by protocol cupping SCA (5 Q-Graders). Different altitudes: (a) congolensis; (b) conilon.
Beverages 08 00083 g002
Figure 3. Total score of congolensis 100-point scale at different altitudes and different post-harvest processes, where: (a) congolensis; (b) conilon.
Beverages 08 00083 g003
Figure 4. Total score of congolensis and conilon for (a) post-harvest processes; (b) altitudes. Contour plots of total scores for (c) dry; (d) honey; and (e) wet processes. Inside the Figure 4a,b, identical letters in superscripts indicate non-significant differences.
Beverages 08 00083 g004
Table 1. Features of the 17 sampling coffee farms.
FarmProvinceCoordinatesAltitude, m.a.m.s.l.Precipitation a, mmTemperature b, °CVariety
F1Santa Elena2°13′36″ S 80°51′30″ W1248726 °CCongolensis
F2Santa Elena2°13′36″ S 80°51′30″ W1248726 °CCongolensis
F3Santa Elena2°13′36″ S 80°51′30″ W1248726 °CConilon
F4Guayas2°12′00″ S 79°58′00″ W40428331 °CCongolensis
F5Guayas2°12′00″ S 79°58′00″ W40428331 °CConilon
F6Los Rios1°46′00″ S 79°27′00″ W80618227 °CCongolensis
F7Los Rios1°46′00″ S 79°27′00″ W80618227 °CCongolensis
F8Los Rios1°46′00″ S 79°27′00″ W80618227 °CCongolensis
F9Santo Domingo0°15′15″ S 79°10′19″ W625400023 °CConilon
F10Santo Domingo0°15′15″ S 79°10′19″ W625400023 °CCongolensis
F11Santo Domingo0°15′15″ S 79°10′19″ W625400023 °CCongolensis
F12Santo Domingo0°15′15″ S 79°10′19″ W625400023 °CConilon
F13Santo Domingo0°15′15″ S 79°10′19″ W625400023 °CConilon
F14Santo Domingo0°15′15″ S 79°10′19″ W625400023 °CCongolensis
F15Bolivar1°36′ S 79°00′ W1700435523 °CConilon
F16 Bolivar1°36′ S 79°00′ W1700435523 °CConilon
F17Bolivar1°36′ S 79°00′ W1700435523 °CConilon
a,b Precipitation and temperature refer to annual mean values.
Table 2. Summary of F-values from analysis of variance (ANOVA) for congolensis according to sensory attributes.
Source of VariationDfFrag/AromaFlavourAftertasteAciditySweetnessBodyBalanceOverall
Process240.19 (***)14.45 (***)25.50 (***)23.27 (***)14.34 (***)18.06 (***)2.00 (ns)42.90 (***)
Altitude339.37 (***)22.54 (***)21.88 (***)28.59 (***)30.93 (***)16.17 (***)15.97 (***)58.06 (***)
Process:Altitude66.40 (***)3.61 (***)5.37 (***)2.09 (.)14.23 (***)6.01 (***)10.54 (***)13.16 (***)
Df = Degrees of freedom. Significance codes: 0 (***) 0.001 (**) 0.01 (*) 0.05 (.) 0.1 (−) no significance (ns).
Table 3. Summary of means from Tukey’s HSD test for congolensis.
AltitudeProcessFrag/AromaFlavourAftertasteAciditySweetnessBodyBalanceOverall
12 mDry7.53 (a)7.51 (a)7.41 (a)7.51 (a)7.52 (a)7.64 (a)7.64 (a)7.85 (a)
Honey7.76 (a)7.72 (a)7.56 (a)7.62 (a)7.58 (a)7.69 (a)7.70 (a)7.95 (a)
Wet7.58 (a)7.55 (a)7.47 (a)7.59 (a)7.56 (a)7.68 (a)7.69 (a)7.89 (a)
40 mDry7.06 (b)7.13 (b)7.10 (b)7.13 (b)7.16 (c) 7.20 (b)7.46 (a)7.53 (c)
Honey7.80 (a)7.70 (a)7.69 (a)7.61 (a)7.76 (a)7.72 (a)7.70 (a)8.00 (a)
Wet7.20 (b)7.34 (ab)7.30 (b)7.47 (a)7.30 (b)7.50 (ab)7.52 (a)7.70 (b)
80 mDry7.34 (c)7.33 (c)7.22 (c)7.27 (b)7.28 (c)7.28 (c) 7.50 (b)7.65 (c)
Honey7.81 (a)7.70 (a)7.69 (a)7.61 (a)7.76 (a)7.72 (a)7.70 (a)8.00 (a)
Wet7.44 (b)7.50 (b)7.51 (b)7.52 (a)7.52 (b)7.50 (b)7.64 (a)7.83 (b)
625 mDry7.80 (a)7.78 (a)7.70 (a)7.67 (b)7.72 (b)7.70 (a)7.68 (b)8.04 (a)
Honey7.89 (a)7.85 (a)7.75 (a)7.83 (a)7.84 (a)7.75 (a)7.88 (a)8.05 (a)
Wet7.83 (a)7.78 (a)7.70 (a)7.82 (ab)7.77 (ab)7.70 (a)7.68 (b)8.04 (a)
Identical letters per sensory attribute indicate non-significant differences.
Table 4. Summary of F-values from analysis of variance (ANOVA) for conilon according to sensory attributes.
Source of VariationDfFrag/AromaFlavourAftertasteAciditySweetnessBodyBalanceOverall
Process261.29 (***)16.17 (***)12.27 (***)9.61 (***)16.97 (***)4.48 (*)19.80 (***)44.29 (***)
Altitude377.60 (***)35.42 (***)73.98 (***)62.36 (***)44.84 (***)12.80 (***)14.27 (***)104.63 (***)
Process:Altitude66.35 (***)3.64 (***)5.38 (***)4.29 (**)4.56 (***)2.55 (*)1.43 (ns)6.17 (***)
Df = Degrees of freedom. Significance codes: 0 (***) 0.001 (**) 0.01 (*) 0.05 (.)tHR 0.1 (−) no significance (ns).
Table 5. Summary of means from Tukey’s HSD test for conilon according to sensory attributes.
AltitudeProcessFrag/AromaFlavourAftertasteAciditySweetnessBodyBalanceOverall
12 mDry7.10 (c)7.36 (b)7.58 (a)7.30 (b)7.37 (a)7.68 (a)7.56 (a)7.75 (b)
Honey7.81 (a)7.62 (a)7.65 (a)7.54 (a)7.62 (a)7.77 (a)7.66 (a)7.95 (a)
Wet7.43 (b)7.60 (a)7.58 (a)7.54 (a)7.51 (a)7.70 (a)7.63 (a)7.85 (a)
40 mDry7.10 (b)7.13 (b)7.10 (b)7.16 (a)7.16 (b)7.30 (a)7.46 (a)7.55 (c)
Honey7.70 (a)7.70 (a)7.54 (a)7.47 (a)7.66 (a)7.72 (a)7.70 (a)7.93 (a)
Wet7.23 (b)7.34 (ab)7.30 (b)7.49 (a)7.30 (b)7.50 (a)7.52 (a)7.71 (b)
625 mDry7.71 (b)7.72 (a)7.70 (b)7.72 (b)7.70 (b)7.76 (a)7.70 (b)8.01 (b)
Honey7.95 (a)7.85 (a)7.81 (a)7.85 (a)7.83 (a)7.81 (a)7.89 (a)8.12 (a)
Wet7.79 (b)7.75 (a)7.72 (ab)7.77 (b)7.75 (ab)7.76 (a)7.70 (b)8.02 (b)
1700 mDry7.72 (b)7.74 (a)7.73 (a)7.68 (a)7.68 (a)7.70 (a)7.66 (b)8.01 (b)
Honey7.98 (a)7.85 (a)7.80 (a)7.79 (a)7.76 (a)7.77 (a)7.80 (a)8.09 (a)
Wet7.91 (a)7.76 (a)7.73 (a)7.77 (a)7.70 (a)7.75 (a)7.72 (ab)8.01 (b)
Identical letters per sensory attribute indicate non-significant differences.
Publisher’s Note: MDPI stays neutral with regard to jurisdictional claims in published maps and institutional affiliations.

