Article

Quality Green Tea (Camellia sinensis L.) Clones Marked through Novel Traits

1
Department of Plant Physiology and Breeding, Tocklai Tea Research Institute, Tea Research Association, Jorhat-785008, Assam, India
2
USDA/ARS, NEA, Beltsville Agricultural Research Center, SPCL, Beltsville, MD 20705, USA
3
Aideobarie Tea Estate Pvt. Ltd., Kb Road Jorhat-785001, Assam, India
4
Department of Biochemistry, Tocklai Tea Research Institute, Tea Research Association, Jorhat-785008, Assam, India
5
Tea Testing Laboratory, Tocklai Tea Research Institute, Tea Research Association, Jorhat-785008, Assam, India
*
Author to whom correspondence should be addressed.
Beverages 2019, 5(4), 63; https://doi.org/10.3390/beverages5040063
Submission received: 13 June 2019 / Revised: 6 September 2019 / Accepted: 25 October 2019 / Published: 1 November 2019

Abstract

:
Tea clones and seed varieties released from Tocklai Tea Research Institutes are suitable primarily for manufacturing black tea (CTC/orthodox) while green tea manufactured from these clones are poor in quality. This led to identifying germplasm suitable for manufacturing green tea of high quality. Physiological parameters on net photosynthesis, transpiration, stomatal conductance, water-use efficiency, leaf temperature, and carboxylation efficiency of six selected germplasm (DH 1 and 2, DH 3 and 4, DH 5 and 6, DL 13, DL 25, and DL 39) were measured in first flush, second flush, rain flush, and autumn flush. Seasonal Yield, biochemical (L-theanine to total polyphenol ratio), and taster’s score were compared among seasons. Two protocols were used for green tea manufacturing, i.e., roasting and steaming. Significant differences in net photosynthesis (pn), stomatal conductance (gs), carboxylation efficiency (ci/ca), and yield were observed between flushes. Among the six test clones, the L-theanine to total polyphenol ratio found was highest in DH 5 and 6 in the roasting method. Structural and cluster analysis revealed that the DH clones genotypically occupied the same position as that of the popular green tea clone Longjing 43 of China and Yabukita of Japan, indicating suitability of these germplasm to develop new green tea clones. Clones DH 5 and 6 are suitable for green tea manufacturing and they can be released to the industry as new green tea clones. As far as manufacturing protocol is concerned, the roasting method of tea manufacturing was found superior over steaming.

1. Introduction

Tea (Camellia sinensis (L.) O. Kuntze) is a widely consumed and one of the oldest beverages in the world ranked second after water [1,2]. Demand for green tea is growing day by day in both domestic and international markets. In the state of Assam (India), tea production started in 1823 by Robert Bruce. The Tocklai Tea Research Institute (TTRI) has released 33 Tocklai Vegetative (TV) clones, 153 TRA/garden series clones, and 16 biclonal hybrid seed stocks for commercial cultivation. TTRI is maintaining the largest tea germplasm collection in its National Active Germplasm Site (NAGS) [3]. Tocklai not only developed elite planting materials but also made available genetic resources for other tea producing countries [4].
Tea plants in North East (N.E.) India experience four flushes in a year, viz. first flush (March–April), second flush (May–June) rain flush (July–September) and autumn flush (October–December). Shorter day length and low temperature keep the tea plant dormant during winter (January–March) [5] without any harvest, so that there is only about nine cropping months instead of harvesting throughout the year as in South India, Sri Lanka and Kenya [6]. After the winter season the climate gradually becomes favourable for growth and the tea plant initiates flushing. Thus in N.E. India the harvesting season start in spring, rises to a peak in the rains and gradually decline towards autumn [6]. Plant growth and development depends on several physiological and biochemical parameters which influenced by seasonal climatic changes. Compounds from photosynthetically assimilated carbon influence the yield and green tea quality (organoleptic and biochemical). Thus, understanding of the seasonal changes of physiological parameters needs to be studied. Manufacturing protocol and planting material are also important factors affecting the green tea quality.
Genetic architecture of the clone plays a crucial role in the quality of the tea. High quality green tea cannot be expected from clones developed for manufacturing black tea. As such, understanding the genetic architecture of the germplasm at the beginning of any breeding scheme is the primary requisite to further the exercise to develop new tea clones and seed variety. In our investigation we included six selected germplasm Dehradun (DH) and Deepling (DL) clones, DH 1 and 2, DH 3 and 4, DH 5 and 6, DL 13, DL 25, and DL 29, to identify the most suitable germplasm/released clones to develop/recommend a clone for manufacturing green tea. In this study we have utilized an expanded SNP marker set (150 SNP markers) to analyse 30 selected tea accessions with a highly diverse background from Tocklai Tea Research Institute (TTRI) and from Eastern China. These tea accession include six germplasm from TTRI considered for developing new green tea clones, four released clones, six popular clones from China, four Cambod-type clones and 10 pure Assam-type clones. Our aim was as to understand the genetic diversity and genetic structure of the six germplasm under investigation. The entire exercise was carried out in SPCL, USDA, MD, USA.

2. Material and Methods

2.1. Material

Six selected Dehradun (DH) and Deepling (DL) germplasm of tea (Camellia sinensis (L.) O. Kuntze), DH 1 and 2, DH 3 and 4, DH 5 and 6, DL 13, DL 25, and DL 39, were selected from an experimental plot of the Tocklai Tea Research Institute (26°47′ N 94°12′ E and 96.5 m a.s.l.). The experimental area is of sandy loam soil with pH of 4.9. All physiological measurements (gas exchange parameters) were made on maintenance leaves at the plucking table on a clear day between 9:30 a.m. to 11:30 a.m. under identical conditions of full sun. Yield was measured by harvesting a tender single leaf with an unopen bud (plucking standard of green tea) at the actively growing stage in each season, and quality traits (L-theanine, total polyphenols, taster’s score) were measured from the green tea manufactured from the harvested tea shoot.

2.2. Methods

The gas exchange parameters were measured using the Portable Photosynthetic System (CIRAS-II, PP System, Make, Amesbury, MA, USA).
Polyphenolic compounds were extracted from a finely ground sample with 10 mL 70% methanol. The extraction was carried out in a water bath set at 70 °C over 10 min time. Total polyphenol content of leaf tea was then determined by a colorimetric assay using Folin–Ciocalteu phenol reagent by following the method of ISO 14502-1 [7,8]. Total polyphenols content of the samples was expressed as gallic acid equivalent.
Theanine was estimated in HPLC by extracting from a finely powdered sample by brewing with hot water for 5 min using a magnetic stirrer. After filtration of the brew it was allowed to cool. The cooled extract was filtered with a 0.45 µm membrane filter and 20 µL was injected into a Phenomenex C18 5 µ 250 mm × 4.6 mm reverse phase column. Theanine was detected by comparing with the Theanine standard through a previously prepared calibration curve (Draft International Standard [9]).
Generally, tasters ascertain quality attributes like appearance, make, briskness, brightness, strength, colour of the liquor, and colour of green tea infusion following the method in [10]. Taster score follows a numerical scoring system (usually ratings from 0 to 10) [11]. For an optimization manufacturing protocol, two different manufacturing processes were evaluated: (1) Roasting (fixing–cooling–shaping–drying) and (2) steaming (steaming–cooling–shaping–drying).
In our green tea manufacturing Protocol 1 (roasting) fixing was done by pan-frying. Fresh tea leaves were exposed to high temperatures (130–140 °C) for approximately five minutes followed by cooling for one hour. The fixed tea leaves were then rolled for 15–20 min at 60–70 °C. Fixing after releasing 40% leaf moisture deactivates enzymes which prevent oxidation and fermentation to maintain a green colour in leaf and shape the final product. Steaming involves placing leaves above pierce steamers that release steam from boiled water. The steaming method of processing takes on steaming of leaves for two minutes followed by cooling for one hour and thereafter shaping or rolling for 5–10 min at 60–70 °C and finally drying at 35 °C overnight.
Regarding genotyping of the tea germplasm, SNPs from the EST database of tea was designed as described by [12]. SNP sequences were submitted to the Assay Design Group at Fluidigm Corporation (South San Francisco, CA, USA) for design and manufacture of primers for a SNPtypeTM genotyping panel. The assays were based on competitive allele-specific polymerase chain reaction (PCR) and enable bi-allelic scoring of SNPs at specific loci (KBioscience Ltd, Hoddesdon, UK). The Fluidigm SNPtypeTM Genotyping Reagent Kit was used according to the manufacturer’s instructions. DNA was extracted from dried tea leaves of the eight tea clones/germplasm with the DNeasyH Plant Mini kit (Qiagen Inc., Valencia, CA, USA) and isolated DNAs were subjected to Specific Target Amplification (STA) using these primers in order to enrich the SNP sequences of interest. Genotyping was performed on a nanofluidic 96.96 Dynamic ArrayTM IFC (Integrated Fluidic Circuit; Fluidigm Corp. South San Francisco, CA, USA). The end-point fluorescent images of the 96.96 IFC were acquired on an EP1TM imager (Fluidigm Corp. South San Francisco, CS, USA) and data was analysed with Fluidigm Genotyping Analysis Software [12,13]. Distance-based multivariate analysis was used to assess the relationship among the individual farmer cultivars, as well as their relationship with reference clones from international genebanks. Pairwise genetic distances were computed using the DISTANCE procedure implemented in GenAlEx 6.5 [14,15]. The same program was then used to perform Principal Coordinates Analysis (PCoA), based on the pairwise distance matrix. Both distance and covariance were standardized.

2.3. Statistical Analysis

Data was statistically analysed and the standard deviation of mean was also calculated [16]. All attempts were carried out in triplicate and the results were presented through a histogram and the vertical bars indicate the standard deviations of mean.

3. Results and Discussions

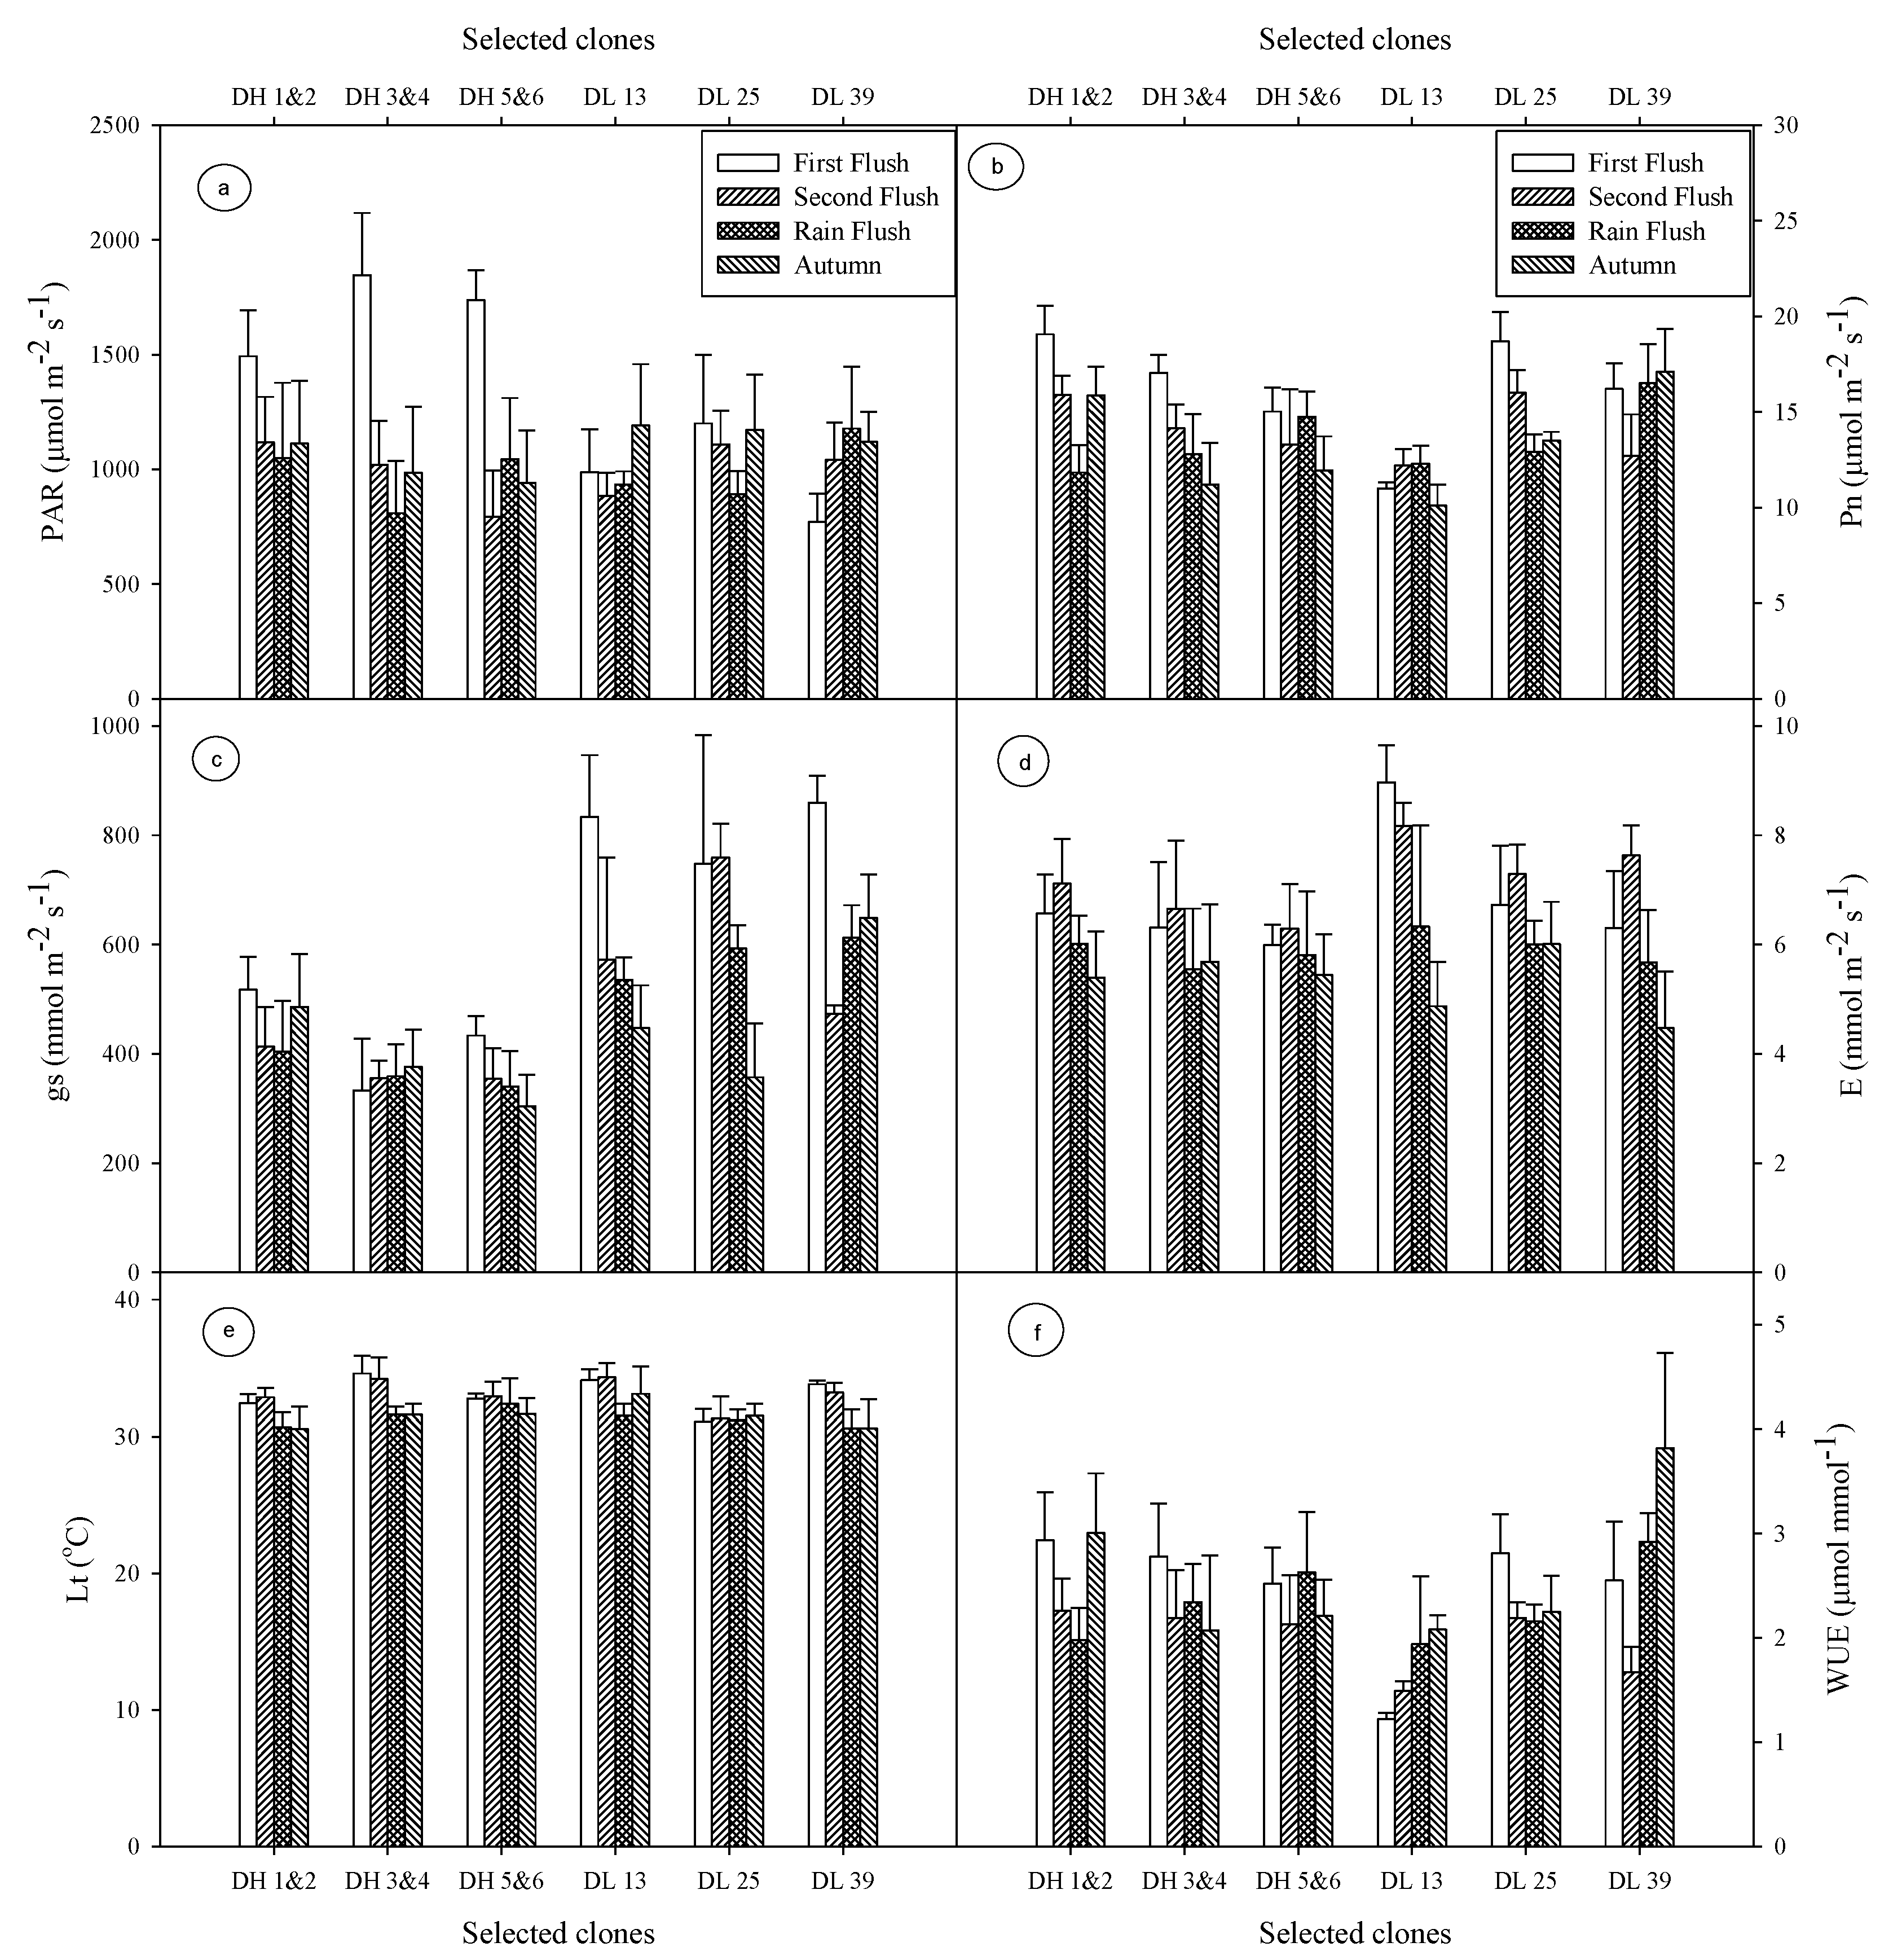
3.1. Photosynthetically Active Radiation (PAR)

The photosynthetically active radiation (PAR) was measured on the plucking surface of tea bushes using a portable photosynthetic system (CIRAS-II, PP System). The PAR varies within 984–1339 µmol m−2s−1 during first flush and autumn flush. In the first flush it was recorded highest (1339 µmol m−2s−1), whereas in the rain flush it was observed lowest (984 µmol m−2s−1) (Figure 1a). In N.E. India the rate of photosynthesis of tea declined above 1200 µmol m−2s−1 light intensity but continue up to 1800 µmol m−2s−1 with reduction of Pn [17]. Crop yield of selected clones (DH 1 and 2, DH 3 and 4, DH 5 and 6, DL 13, DL 25, and DL 39) depends upon efficient use of light for assimilating CO2 and effective distribution of the assimilated carbon to plant biomass.

3.2. Net Photosyntheis (Pn)

Net photosynthesis varies significantly among clones, but no significant differences were found between seasons. Flushes average on Pn, decreases gradually following the order first flush (16.17 µmol m−2s−1 at PAR 1339 µmol m−2s−1), second flush (14.04 µmol m−2s−1 at PAR 994 µmol m−2s−1), rain flush (13.51 µmol m−2s−1 at PAR 984 µmol m−2s−1), and autumn flush (13.28 µmol m−2s−1 at 1087 µmol m−2s−1). Among the tested clones the highest Pn was recorded in clone DH 1 and 2 (19.07 µmol m−2s−1) under first flush whereas the lowest Pn was noticed in DL 13 (10.10 µmol m−2s−1) under autumn flush (Figure 1b). Barman [17] correlated the Pn with the light intensities and recorded a maximum Pn of 13.95 µmol m−2s−1 at PAR 1200 µmol m−2s−1. Gosh Hajara [18,19] recorded the maximum Pn at 11.9 µmol m−2s−1 at highest PAR 1370 µmol m−2s−1 under Darjeeling conditions.

3.3. Leaf Temperature (Lt)

Leaf temperature played the crucial role in the process of tea leaf photosynthesis. During the autumn flush the leaf temperature was 31.50 °C, which significantly increased to 33.12 °C in the first flush (Figure 1e). Maximum leaf temperatures of 33.13 °C was obtained in the first flush and second flush. Leaf temperature also showed significant variation among clones. A maximum leaf temperature of 33.8 °C was observed in DL 39 in the first flush and its corresponding green leaf yield was 589 g/plot, whereas in the rain flush leaf temperature of 30.6 °C was observed in DL 39 having green leaf yield of 1012.5 g/plot. Fifty per cent yield declined sharply by increasing 2–3 °C leaf temperature. Usually, tea leaf requires 25–30 °C temperature for maximum photosynthesis [20], which declines above 35 °C resulting in no net photosynthesis above 39 °C [21]. Leaf temperature has a linear correlation with light intensities [17].

3.4. Stomatal Conductance (gs) and Transpiration (E)

Stomatal conductance is influenced by PAR and Lt [22]. It limits the transpiration rate substantially [23]. Stomatal conductance showed significant variation among the clones as well as between flushes. Stomatal conductance was higher in all other flushes over autumn. Stomatal conductance has direct correlation with the rate of transpiration. The higher the gs the more the E. In first flush, the highest gs was 620.89 mmol m−2s−1 and the corresponding E was 6.8 mmol m−2s−1 whereas the lowest gs 436.56 mmol m−2s−1 was detected in the autumn season and the corresponding E was 5.31 mmol m−2s−1. Among clones, DL 39 had the highest gs (860.0 mmol m−2s−1) in the first flush whereas clone DH 5 and 6 measured the lowest gs (303.7 mmol m−2s−1) under autumn flush and the corresponding E were 6.30 mmol m−2s−1 and 5.44 mmol m−2s−1, respectively (Figure 1c,d), indicating a positive correlation between gs and E.

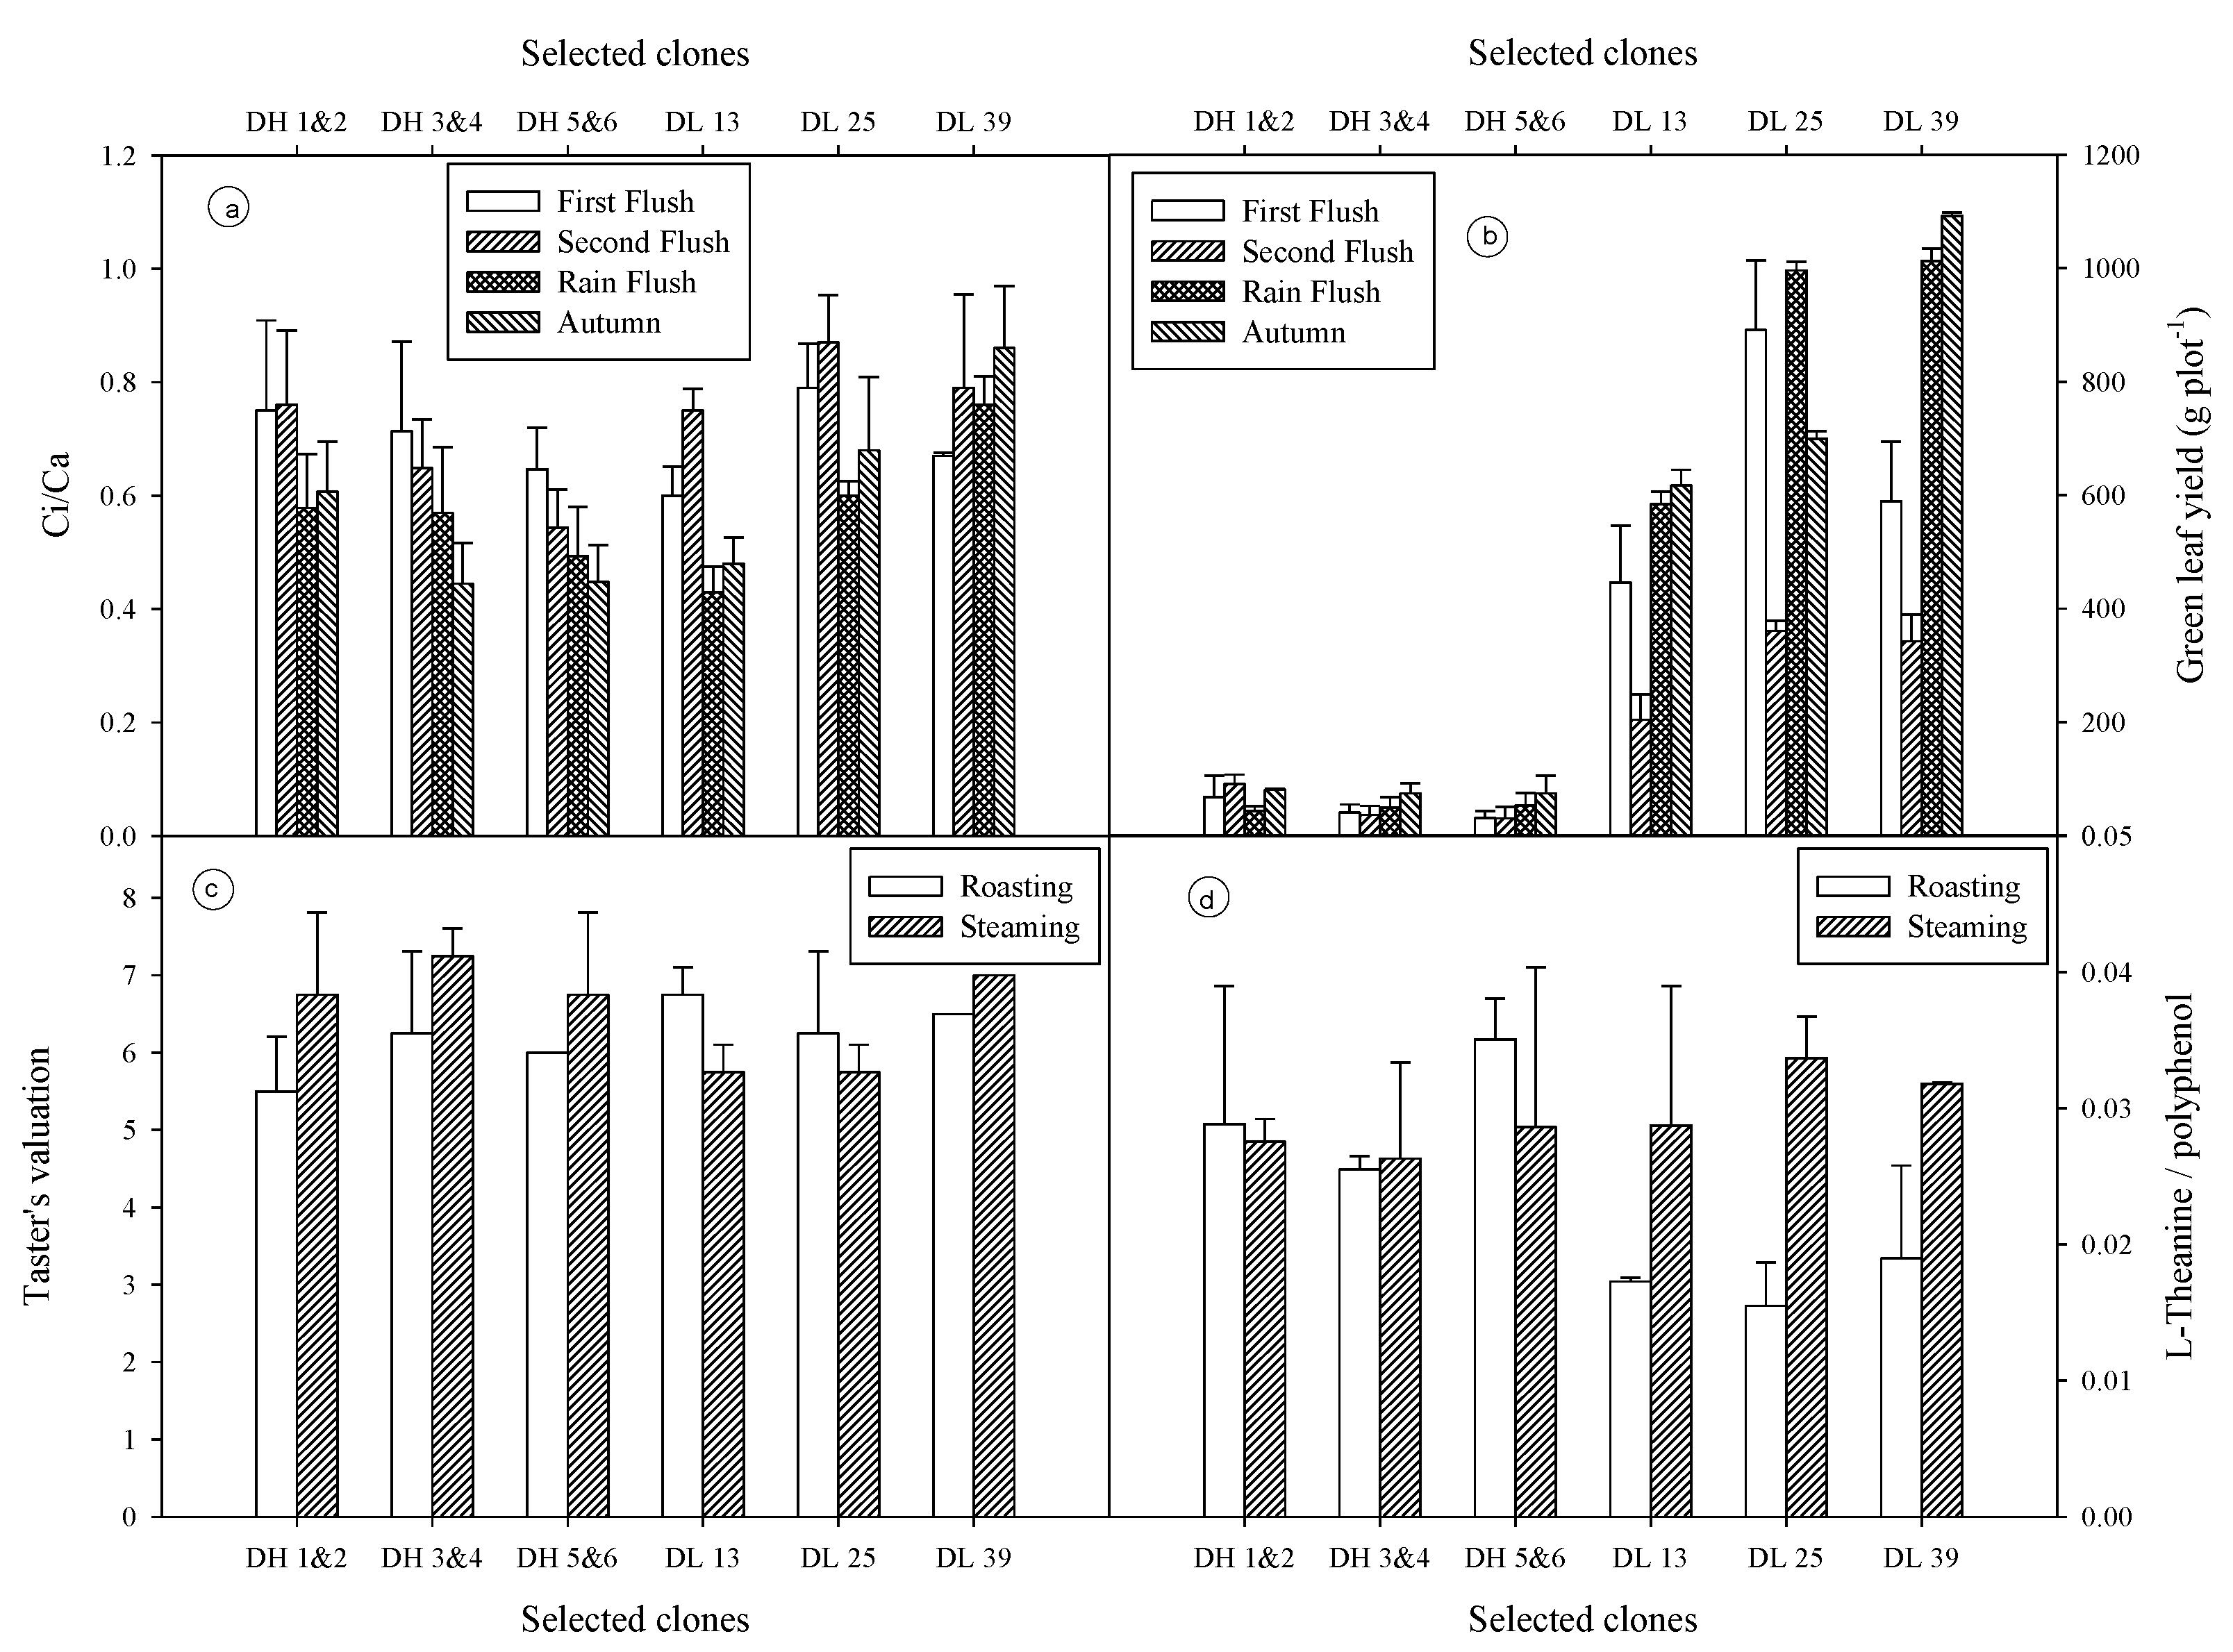
3.5. Water-Use Efficiency (WUE) and Carboxylation Efficiency (Ci/Ca)

Water-use efficiency indicate the quantum of water required to transpire by per unit area for fixing one µmol of CO2 during the process of Pn. A higher Pn/E ratio is associated with greater WUE [24]. In our study the highest WUE was observed in DL 39 (3.82 µmol/mmol) in the autumn flush (Figure 1f). Carboxylation efficiency showed significant variation among the clones and the flushes. It was found within the range of 0.5–0.9, similar to other C3 plants [25]. Maximum carboxylation efficiency was observed in the DL 25 (0.87) clone under the second flush (Figure 2a) whereas the minimum Ci/Ca was noticed in the DH 3 and 4 (0.45) clone in the autumn flush.

3.6. Green Leaf Yield

For black tea manufacturing tea bushes were plucked in 7–8-day intervals, whereas for green tea manufacturing it was reduced to 3–4-day intervals. Flushes and clones were found to have significant difference among them with respect to the yield. The highest crop yield was recorded in the rain flush, with an average of 456.18 g green leaves per plot (yield of 20 bushes) as compared to other flushes (Figure 2b). The physiological activities of tea plants vary with the change of season. Accordingly, the growth behaviour of tea plant differs in different flushes. Because of efficient metabolic processes induced by ambient conditions in rain, the growth of tea plants is faster in the rainy season as compared to the other three seasons in north eastern India [6]. Concerning the growth of clones, DL clones yield higher. The maximum yield was recorded in DL 39 (1092 g green leaves per plot) in the autumn flush whereas in the DH groups the DH 1 and 2 clone had its maximum yield (90.22 g green leaf per plot) under the second flush. The study revealed that net photosynthesis is not directly linked to leaf yield (Figure 1b and Figure 2b), as it is mainly controlled by rates of shoot initiation and extension [26].

3.7. Taster’s Score and L-Theanine to Ployphenol Ratio

Green tea manufactured from the roasting and steaming method and tea quality was assessed with respect to the taster’s score and L-theanine to polyphenol ratio. This is the most important parameter based on which clones were selected or identified for its suitability to green tea manufacturing. Traditional green tea producing countries like China, Japan, Taiwan, etc., cultivate the indigenous China Jat (Camellia sinensis var. sinensis) in which the leaves are small in size and dark green in colour. They contain low amounts of polyphenols and high amounts of amino acids compared to the leaves of the broad-leaved Assam variety. A study revealed that flushes are having significant variations but not between clones in respect to the taster’s score. Maximum valuation (6.6) was observed in the first flush where tea was made from the roasting method, whereas a taster’s valuation of 6.8 was noticed in the steaming method of tea manufacturing under rain flush. All the selected clones had taster scores greater than 5.5 (Figure 2c). Higher ratios of amino acids to polyphenols are desirable leaf qualities for the production of good quality green tea [27]. In this study, the L-theanine to polyphenol ratio was recorded highest in DH 5 and 6 (0.0351) teas manufactured by the roasting method under the first and second flush (Figure 2d).

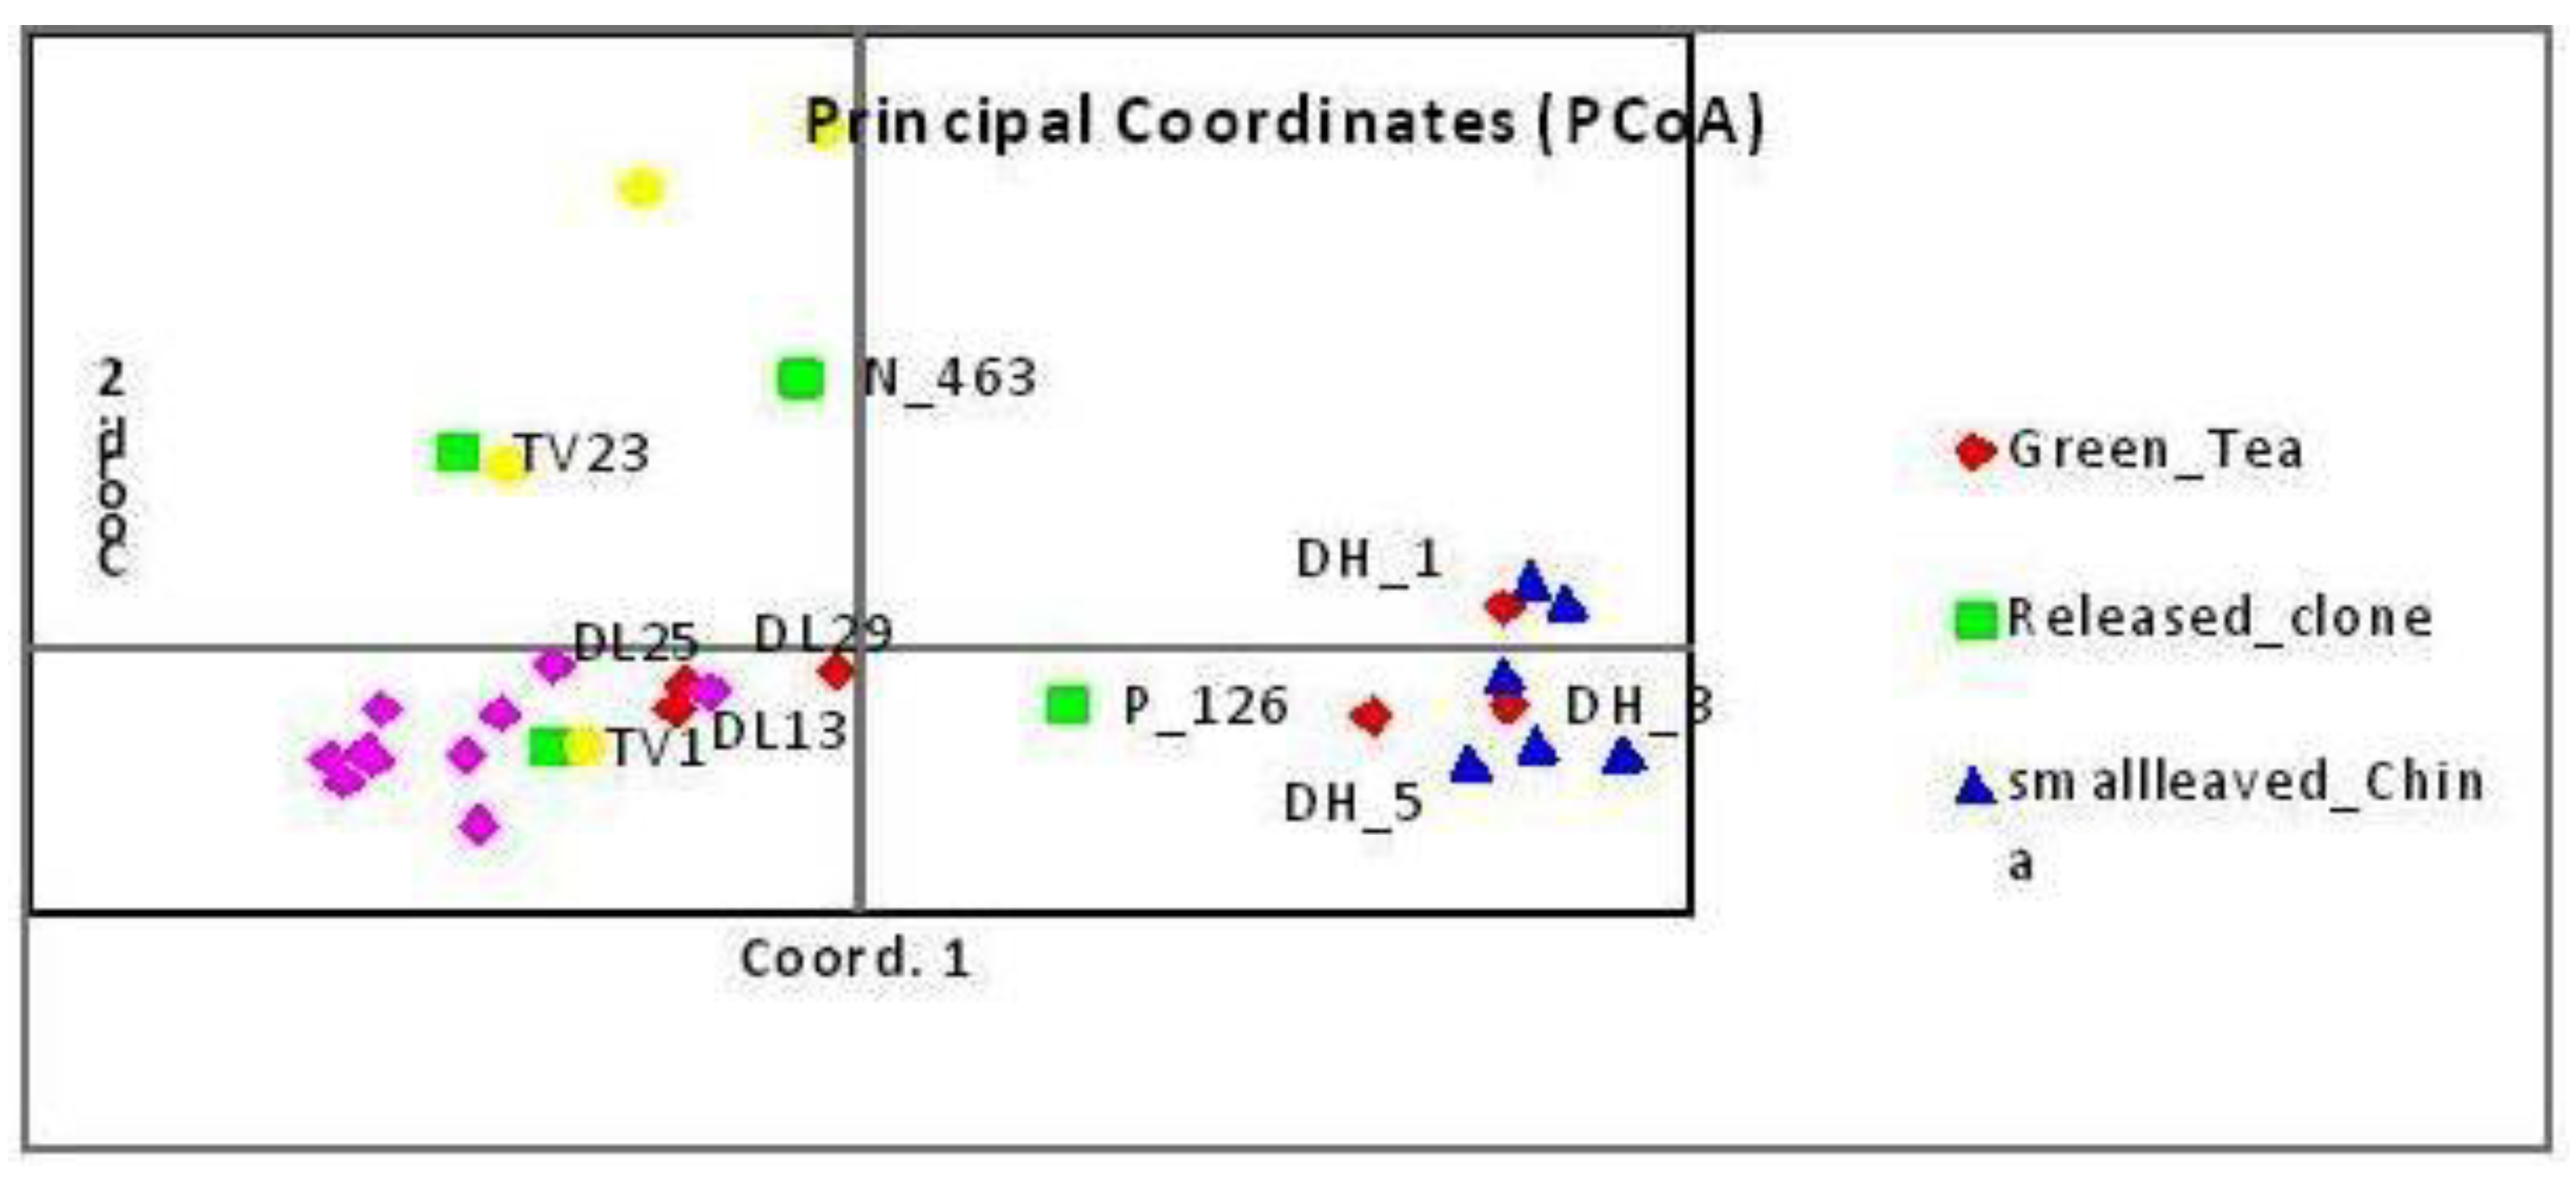
3.8. Principal Component Analysis

The principal component analysis PCoA, (Figure 3) revealed that all the DH clones genotypically occupied the same position as that of the popular green tea clones Longjing 43 of China and Yabukita of Japan, indicating genotypic proximity of these germplasm with the popular green tea clones and, thus, establishes the suitability of these germplasm to develop new clones exclusively for manufacturing. DL germplasms appeared as three-way hybrids, exhibiting the presence of Chinese, Assam, and Cambod characters. Assam-type germplasm and popular Chinese tea clones for manufacturing green tea formed two distinct groups, whereas TV 23, a popular tea clone of Assam, positioned between the Assam and Cambod clones, indicating its hybrid nature.

4. Conclusions

The physiological activities of tea plants vary with seasonal change. Accordingly, the growth behaviour of tea plant differs in different flushes. Biochemical and organoleptic tests, as well as genotypic investigations revealed that the DH 5 and 6 clone is suitable for green tea manufacturing among the six selected clones and it can be released to the industry as new green tea clones for the first time, whereas the roasting method of tea manufacturing was found to be superior over steaming.

Author Contributions

This work was carried out in group effort among all authors. Author P.K.P. and D.B. designed the study; P.K.P. wrote the first draft of the manuscript with different aspects, i.e., physiology, quality and yield; authors M.H. and P.B. contributed to the collection of field data besides biochemical analysis, tea manufacturing and managed the literature searches; author D.B. and D.Z. performed the genotyping of clones and germplasm at SPCL, USDA, MD, USA; author R.B. was a collaborator and provided the experimental field at its own tea estate, and also helped in the green tea manufacturing; author S.S. did biochemical analysis in made tea samples; author N.J.N. contributed the experimental field management; author R.C.G. provided the tea testing report of the made green tea experimental samples; and all authors read and approved the final manuscript.

Funding

Authors gratefully acknowledge the receipt of research grant from the Biotechnology Industry Research Assistance Council (BIRAC) Department of Biotechnology, Government of India, New Delhi (Sanction No.BT/CRS0155/CRS-07/15) for the work reported herein.

Conflicts of Interest

The authors declare no conflict of interest.

References

  1. Zhen, Y.S. Tea: Bioactivity and Therapeutic Potential; Taylor & Francis: New York, NY, USA, 2002. [Google Scholar]
  2. Ho, C.T.; Lin, J.K.; Shahidi, F. Tea and Tea Products: Chemistry and Health-Promoting Properties; CRC Press; Taylor & Francis Group: Boca Raton, FL, USA, 2009. [Google Scholar]
  3. Konwar, B.K. Biodiversity of tea in North East India and their conservation at Tocklai. Two Bud 1999, 46, 7–12. [Google Scholar]
  4. Singh, I.D. Indian tea germplasm and its contribution to the world tea industry. Two Bud 1979, 26, 23–26. [Google Scholar]
  5. Das, S.C.; Barua, D.N. Mechanism of tea dormancy: Effect of temperature on growth and dormancy of tea plant in North East India. Two Bud 1987, 34, 36–41. [Google Scholar]
  6. Barman, T.S.; Baruah, U.; Saikia, J.K.; Borah, D.; Deka, D.K.; Lahon, T. Seasonal varation of physiological activiteis and its effect on yield of tea in North East India. Two Bud 2006, 53, 6–12. [Google Scholar]
  7. McAlpine, M.; Ward, W.E. Influence of Steep Time on Polyphenol Content and Antioxidant Capacity of Black, Green, Rooibos, and Herbal Teas. Beverages 2006, 2, 17. [Google Scholar] [CrossRef]
  8. ISO. 14502-1 Determination of Substances Characteristic of Green and Black Tea Part 1: Content of Total Polyphenols in Tea-Colorimetric Method Using Folin-Ciocalteu Reagent; International Organization for Standardization: Geneva, Switzerland, 2005. [Google Scholar]
  9. ISO. DIS 19563: Determination of Theanine in Tea and Instant Tea in Solid Form Using High-Performance Liquid Chromatography; International Organization for Standardization: Geneva, Switzerland, 2016. [Google Scholar]
  10. ISO. 3103 Tea—Preparation of Liquor for Use in Sensory Tests; International Organization for Standardization: Geneva, Switzerland, 1980. [Google Scholar]
  11. Gogoi, R.C.; Sanyal, S. Tea Testing Manual; Tocklai Tea Research Institute Tea Research Association: Jorhat, India, 2016; p. 25. [Google Scholar]
  12. Fang, W.P.; Meinhardt, L.W.; Tan, H.W.; Zhou, L.; Mischke, S.; Zhang, D. Varietal identification of tea (Camellia sinensis) usingnanofluidic array of single nucleotide polymorphism (SNP) markers. Hort. Res. 2014, 1, 14035. [Google Scholar] [CrossRef] [PubMed]
  13. Fluidigm. Fluidigm SNP Genotyping User Guide Rev H1; PN 68000098; Fluidigm Corporation: South San Francisco, CA, USA, 2011. [Google Scholar]
  14. Peakall, R.O.D.; Smouse, P.E. Genalex 6: Genetic analysis in Excel. Population genetic software for teaching and research. Mol. Ecol. Notes 2006, 6, 288–295. [Google Scholar] [CrossRef]
  15. Peakall, R.O.D.; Smouse, P.E. Gen AlEx 6.5: Genetic analysis in Excel. Population genetic software for teaching and research—An update. Bioinformatics 2012, 28, 2537–2539. [Google Scholar] [CrossRef] [PubMed]
  16. Gomez, K.A.; Gomez, A.A. Statistical Procedures for Agricultural Research; A. Willy-Interscience Publication: New York, NY, USA, 1984. [Google Scholar]
  17. Barman, T.S.; Baruah, U.; Saikia, J.K. Irradiance influence tea leaf (Camellia sinensis L.) photosynthesis and transpiration. Photosynthetica 2008, 46, 618–621. [Google Scholar] [CrossRef]
  18. Ghosh Hajara, N.; Kumar, R. Seasonal variation in photosynthesis and productivity of young tea. Exp. Agric. 1999, 35, 71–85. [Google Scholar] [CrossRef]
  19. Ghosh Hajara, N.; Kumar, R. Diurnal and seasonal variation in gas exchange property of tea leaves. J. Plant Biol. 2002, 29, 169–173. [Google Scholar]
  20. Barua, D.N. Photosynthesis and respiration. In Science and Pratice in Tea Culture; Pub. TRA, Tea Research Association: Tocklai Experimental Station, Jorhat, India, 1989; pp. 374–377. [Google Scholar]
  21. Hadfield, W. Leaf temperature, leaf pose and productivity of tea bush. Nature 1968, 219, 282–284. [Google Scholar] [CrossRef]
  22. Whitehead, D.; Okali, D.V.W.; Fasehun, F.E. Stomatal response to environmental variables in two tropical rainforest species during the dry season in Nigeria. J. Appl. Ecol. 1981, 18, 581–587. [Google Scholar] [CrossRef]
  23. Cawan, I.R. Stomatal behaviour and environment. Adv. Bot. Res. 1977, 4, 117–228. [Google Scholar]
  24. Frank, A.B.; Baker, R.C.; Berdahl, J.D. Water use efficiency of grasses grown under controlled and field condition. Agron. J. 1987, 79, 541–544. [Google Scholar] [CrossRef]
  25. Weber, J.A.; Jurik, T.W.; Tenhunen, J.D.; Gates, D.M. Analysis of gas exchange in seedlings of Acer saccharum: Integration of field and laboratory studies. Oceologia 1985, 65, 338–347. [Google Scholar] [CrossRef] [PubMed]
  26. Squire, G.R.; Callander, B.A. Tea plantations. In Water Deficits and Plant Growth; Kozlowski, T.T., Ed.; Academic Press: New York, NY, USA, 1981; Volume VI, pp. 471–510. [Google Scholar]
  27. Wickremasinghe, R.L. Monographs on Tea Production in Sri Lanka; Tea Research Institute of Sri Lanka, St. Coombs: Talawakelle, Sri lanka, 1978; Volume 7, p. 65. [Google Scholar]
Figure 1. Seasonal changes in (a) light (PAR), (b) net photosynthesis (Pn), (c) stomatal conductance (gs), (d) evaporation (E), (e) leaf temperature (Lt), and (f) water-use efficiency (WUE). Vertical bars indicate the standard deviation of means.
Beverages 05 00063 g001
Figure 2. Seasonal changes in (a) carboxylation efficiency (Ci/Ca), (b) green leaf yield besides (c) taster’s valuation along with the (d) L-theanine to polyphenol ratio under the roasting and steaming method of green tea manufacturing. Vertical bars indicate the standard deviation of means.
Beverages 05 00063 g002
Figure 3. PCoA analysis of the 30 germplasm and clones indicate proximity of DH clones to the popular Chinese clones.
Beverages 05 00063 g003

