Article

Optimization of the Different Variables for the Development of a Cucumber-Based Blended Herbal Beverage

Food Technology and Nutrition, School of Agriculture, Lovely Professional University, Phagwara 144411, Punjab, India
*
Author to whom correspondence should be addressed.
Beverages 2017, 3(4), 50; https://doi.org/10.3390/beverages3040050
Submission received: 19 August 2017 / Revised: 26 September 2017 / Accepted: 29 September 2017 / Published: 16 October 2017

Abstract

:
Cucumber is a nutritious vegetable containing a large amount of nutrients. Due to its numerous health benefits, and even after the blind taste test, it can be used as a beverage by blending it with other suitable juices. Therefore, an attempt has been made in the present study for the development of a cucumber-based blended herbal beverage using sugarcane juice, citric acid, mint and coriander extract (30:30:30) along with salt (white salt:black salt 1:1) at varying concentrations using the response surface methodology. The physicochemical (TSS, titratable acidity, pH, reducing sugars, total sugars, total proteins, total phenols, ascorbic acid, tannins and antioxidant activity) and sensory analysis revealed that the best blend was obtained with a sugarcane juice concentration (of 30.14%, a salt concentration of 1.5%, citric acid, mint and a coriander extract concentration of 1%. It is apparent from the study that cucumber juice can be successfully blended with sugarcane juice to enhance its sensory properties, as well as the phytochemical potential with 0.953 desirability, which will open a new door in the beverage industry.

1. Introduction

Being natural, juices are some of the most popular beverages that appeal to consumers of all age groups including children, adolescents, adults, as well as elderly people. Many people consider these as a ‘healthy’ option, as they are natural and nutritionally safe, as well. A wide variety of micronutrients including vitamin C, folate, β-carotene, potassium and polyphenols is present in fruit juices. Juices are easily accessible and mostly appeal to people who are engaged in their jobs or those who look for ‘on the go’ ways to fulfill their daily nutritional requirement [1]. The hike in demand and admiration of juices might be due to the increase in awareness regarding health and nutrition among the general public. Its easy availability, purity, lifestyle modification, marketing strategies, choice of different flavors and convenience are some of the other factors that contribute to raising demand. In order to meet all these requirements, there has been a considerable expansion in the juice industry [2]. These days, drinks are not only used for the purpose of quenching one’s thirst, but also used to prevent nutritional diseases and upgrade both physical and mental well-being at the same time. As these drinks help with improving human health, these beverages may be considered as ‘functional beverages’ [3,4].
Cucumber juice offers a persuasive option as the foundation for a more nutritional and therapeutic beverage with a premium profile. It possesses various medicinal properties such as anti-carcinogenic, antioxidant, antimicrobial, antifungal, antibacterial, anti-inflammatory, antidiabetic, antifertility, antiwrinkle and antiaging, as well as lowers cholesterol levels. It helps in weight loss and hydrates the body, thus being important for skin and also preventing infections [5]. Due to the numerous health benefits of cucumber, it is gaining tremendous importance in the food industry, and researchers are focusing on using it as an ingredient in the health and food industry.
Although fruits and vegetables have high nutritional and medicinal value, still due to the bitterness, astringency and high acidity, they have limited usage. Therefore, in order to overcome this problem and to increase their utility, blending with or without fermentation of fruit and vegetable juices with a suitable substrate (which can be sugarcane juice) serves as a convenient alternate [3,4,6] to increase the organoleptic properties, as well [7]. Sugarcane (Saccharum officinarum) possesses high sucrose and low fiber content. The multiple uses of sugarcane include its role in treating skin and urinary tract infections [8], jaundice, hypertension [9], bronchitis, heart conditions, anemia and constipation [10]. It is also a rich source of antioxidants [8]. Preparation of spiced blended juices contributes to the taste, aroma, nutrition, increased storability and inhibition of microbial growth [6]. Spiced beverages are becoming popular as they possess medicinal, therapeutic and appetizing properties. They are available in the market in the form of fruit drinks, squashes, health drinks, appetizers, etc. [11]. To date, there is no documentation regarding the effect of different variables in the development of cucumber-based blended herbal beverages. Therefore, the present study was aimed at fulfilling this research gap.

2. Materials and Methods

Materials required to conduct the experiment including cucumber (Cucumis sativus), mint and coriander leaves and sugarcane juice were purchased from the local market of Jalandhar (Punjab), India. Cucumber juice was extracted by using a lab-scale juicer (Usha Jmg 2744, Juicer Mixer Grinder, Usha, India). Similarly, the extracts of mint and coriander were also obtained after sorting and washing the leaves. Mint and coriander juice were mixed along with citric acid in the ratio of 1:1:1 (A) to obtain the herbal extract. The juice and extract so produced was filtered by using sterilized muslin cloth. Sugarcane juice (B) was also used in the preparation of the beverage. The salt mixture was prepared by combining white and black salt in a 1:1 ratio (C). Different beverage formulations were then prepared according to the experimental design combinations (Table 1). The prepared beverages were filled into sterilized glass bottles and pasteurized at 95 °C for 5 min followed by cooling and storage till further analysis.

2.1. Physico-Chemical Analysis

The total soluble solids (TSS), titratable acidity and pH of blended beverages were determined as per the standard methods [12]. Total proteins were estimated by using Lowry’s method as described in [13]. Antioxidant activity was determined by the 2, 2-diphenyl-2-picryl hydrazine (DPPH) inhibition method [14], and total phenolic content was determined by using the Folin–Ciocalteu method [13]. Determination of vitamin C content of the beverage was done by using the titration method with 2, 6-dichlorophenol-indophenol dye solution [12], and the total sugar content was determined by using the Lane and Eynon method as described in [15]. Tannin content was estimated by using Folin–Denis’ reagent [12].

2.2. Sensory Analysis

The coded samples of blended beverage were served to a panel of 10 semi-trained members (3 males and 7 females, 28–35 years old) at the Department of Food Technology and Nutrition, Lovely Professional University (Phagwara), India, to evaluate the sensory characteristics on a nine-point hedonic scale as described by [16]. A training session was conducted to familiarize the panelists with the hedonic scale prior to sensory analysis. They were then asked to evaluate the samples for various quality attributes, i.e., color and appearance, aroma, flavor and overall impression, and to award a score (from 1 = dislike extremely to 9 = like extremely) depending on their respective impact. All the evaluations were carried out in isolated booths at room temperature (21 ± 1 °C). The panelists used plain water to rinse their mouth in between the tasting session. The mean of all the attributes was used to define the overall acceptability of the blended beverage [17].

2.3. Statistical Analysis

Statistical software package Design Expert® Version 7.0 (Stat Ease, Inc., Minneapolis, MN, USA) was used for regression analysis of the experimental data to obtain working parameters and to generate the one factor plots. A second-order polynomial equation was established based on analysis of variance, and the optimum variables were found using the Design-Expert 7.0 software optimization toolbox. The standard deviation and R2 values were also analyzed. The cluster analysis of data was performed using SPSS 16.0 software to get a comparative comprehensive overview of phyto-chemical, quality and nutritional attributes. The output obtained was plotted as a dendrogram, and the interpretation of data was made, accordingly.

2.4. Model Validation

The mathematical model generated during RSM implementation was validated by conducting check point studies. Experimentally-obtained data, i.e., actual data, were compared with the predicted date, and the prediction error was calculated.

3. Results and Discussion

The data pertaining to the effect of independent variables on responses, i.e., phytochemical, quality and nutritional parameters, are given in Table 1. Among all the combinations, TSS ranged from 9.00–15.00 °Brix, titratable acidity from 0.22–1.30%, pH 2.96–5.30, reducing sugars from 0.73–1.37%, total sugars from 3.26–8.95%, total protein 195.25–324.05 mg/100 mL, total phenols 17.03–25.30 mg/100 mL, ascorbic acid 6.60–21.50 mg/100 mL, antioxidant activity 39.10–63.90%, tannins 0.34–0.68 mg/100 mL and the overall acceptability from 6.65–8.36. The effect of different independent variables, i.e., herbal extract, sugarcane juice and salt concentration, on the responses under study at linear, quadratic and interactive levels have been studied and are presented in Table 2, and out of these, quadratic models were selected for the analysis of all the responses. The F-value, mean, standard deviation, coefficient correlation and lack of fit test were calculated to check the adequacy of the model. The coefficients’ sign, i.e., positive or negative, and their intensities indicate the statistical (positive and negative) effect of different variables on the responses. The regression coefficient (R2) for all the responses ranged from 0.75–0.93, and the lack of fit was non-significant. Therefore, the models were considered as significant due to their subjective nature.

3.1. Effect of Variables on the Phyto-Chemical Attributes

With the increase in the concentration of the spiced extract, a significant increase was observed in the concentration of total phenols and antioxidants (Figure 1a). This increase in total phenolics was observed due to the contribution of mint and coriander juice, which are have high phenolic contents, i.e., 1.24 mg GAE/100 mL and 1.12 mg GAE/100 mL, respectively. The increase in antioxidant activity was also observed (Figure 1a) due to the high free radical scavenging activity of mint juice, i.e., 34.21%, and the antioxidant activity exhibited by coriander juice, i.e., 26.82% [18]. Generally, the total phenols and antioxidant activity of mint leaves are higher than coriander. This may be due to the difference of the families of these herbs, as coriander and parsley come under the Apiaceae family, whereas mint belongs to the Lamiaceae family. Based on their results, [19] found that the total phenols and antioxidant activity, especially DPPH scavenging activity, of herbs from the Lamiaceae family were higher than those belonging to the Apiaceae family. Similar results of the increase in phenolic content and antioxidant activity due to the contribution of mint and coriander juice were also observed by [20,21]. Citric acid concentration in beverages also contributes to the antioxidant activity as reported by [22] in apple and raspberry juice. Tannin content was also found to be increased with the increase in the sugarcane concentration and herbal extract concentration (Figure 1a). Sugarcane concentration affects the tannin content significantly, but the effect of herbal extract was known to be non-significant.

3.2. Effect of Variables on the Quality Parameters

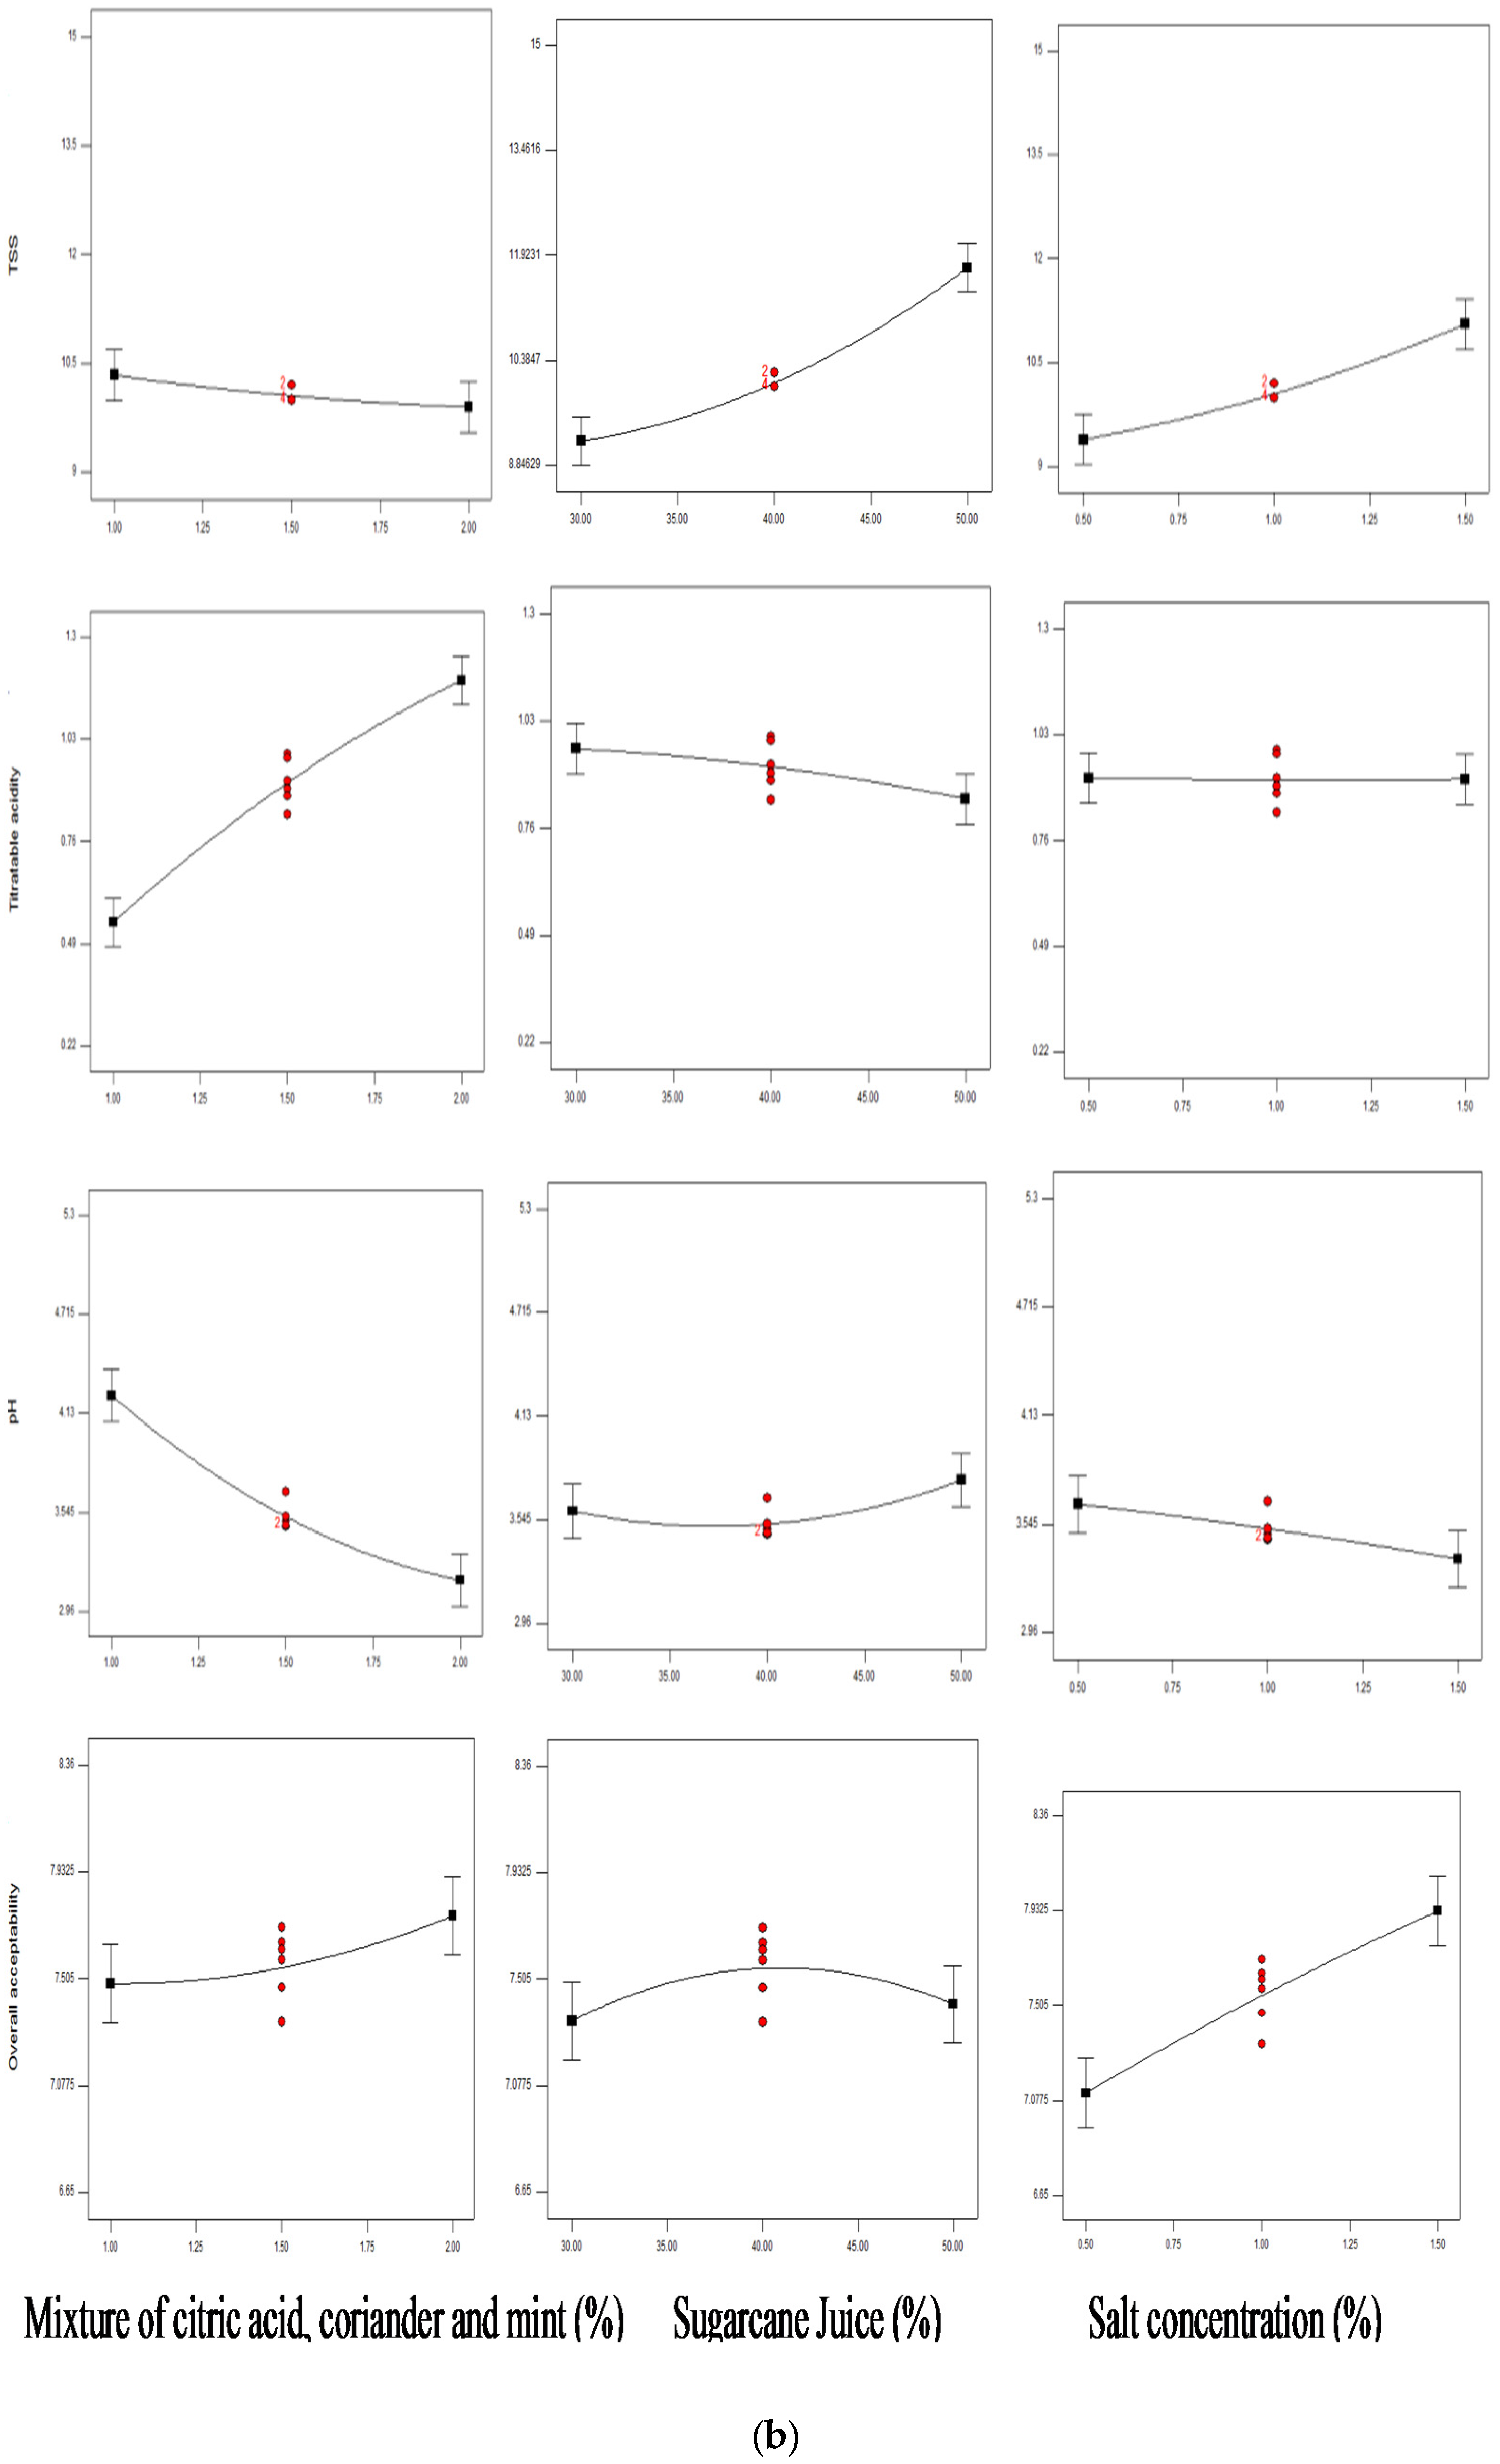
Titratable acidity, pH, total soluble solids (TSS) and overall acceptability were selected as quality parameters. At the linear level, spiced extract and sugarcane juice concentration had a significant (p < 0.05) positive effect on titratable acidity; sugarcane juice concentration and salt concentration on TSS and spiced extract and salt concentration had significant effect on pH, whereas salt concentration alone had a significant (p < 0.05) effect on the overall acceptability; whereas, at the quadratic level: sugarcane juice concentration had significant effect on TSS, spiced extract and sugarcane juice concentration on pH and sugarcane juice concentration on the overall acceptability. Furthermore, at the interactive level, sugarcane juice concentration and salt concentration significantly affected the TSS; spiced extract and salt concentration affected the pH; while all three parameters had a significant effect on the overall acceptability.
Figure 1b clearly shows that with the increase in sugarcane juice and salt concentration, there was a significant (p < 0.05) increase in TSS, which is due to the TSS of the sugarcane juice, i.e., 18.07–19.7 °Brix [23]. However, there was no significant contribution of spiced extract on TSS (Figure 1b); whereas, the increase in spiced extract concentration and sugarcane juice concentration resulted in a significant increase in the titratable acidity and a decrease in pH, which might be due to the contribution of the citric acid added into it (component of spice extract) and sugarcane juice [24,25,26], respectively. The effect of salt concentration on titratable acidity was found to be non-significant (Figure 1b), but there was a significant decrease in the pH with the increase in salt concentration. The addition of salt significantly (p < 0.05) affected the sensory characteristics of spiced cucumber beverage (Figure 1b). With this, it was observed that the beverage was preferred with high a concentration of salt (1.5%). Table 2 also indicated that the interaction of salt and spiced extract exerted a positive impact on the overall acceptability due to proper blending of spiced extract and salt and made it more acceptable.

3.3. Effect of Variables on the Nutritional Parameters

Total sugars, reducing sugars, total proteins and ascorbic acid were selected as the nutritional parameters. At the linear level, spiced extract had a significant (p < 0.05) positive effect on total protein content; whereas, sugarcane juice had a significant (p < 0.05) effect on all the nutritional parameters. At the interactive level, spiced extract and sugarcane juice concentration had a significant effect on total proteins.
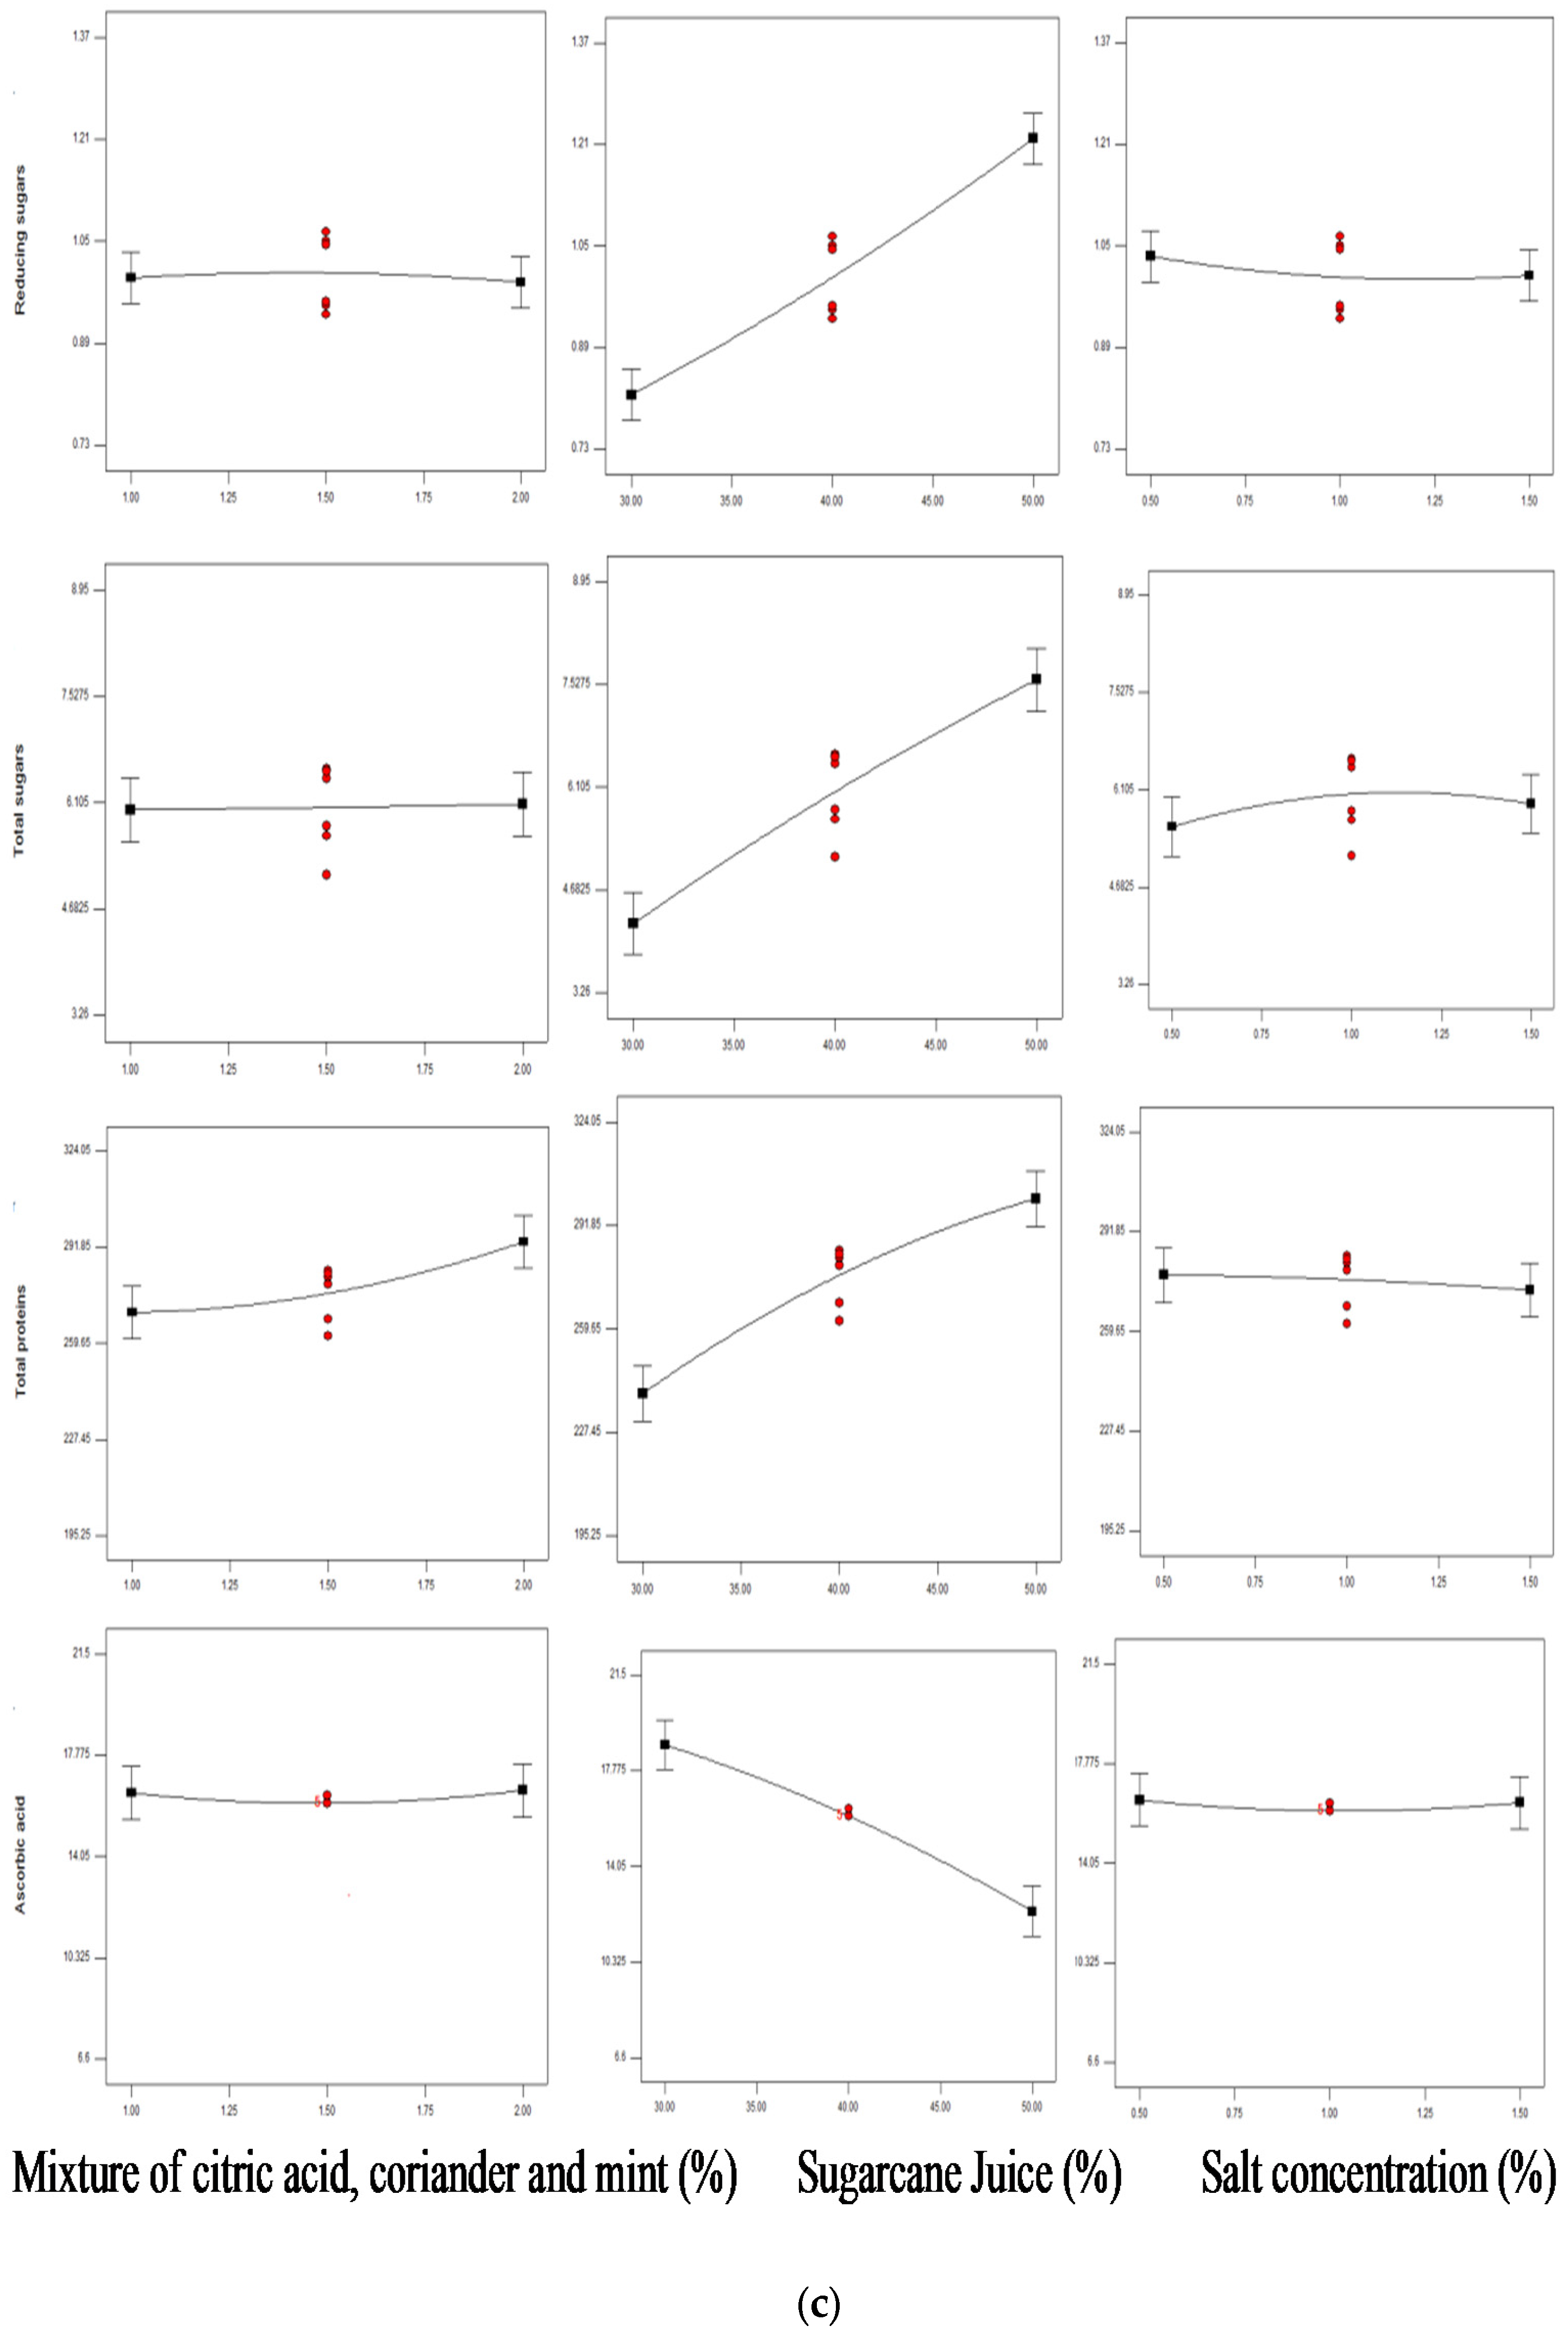
With an increase in sugarcane juice concentration (30–50%), a slight increase in the reducing sugars and a major change in total sugars were observed (Figure 1c). This increase in reducing sugars might be due to the conversion of sucrose to reducing sugars (glucose and fructose) primarily due to acids and higher temperature [27]. As sugarcane juice is a good source of total sugars, the amount of reducing sugars is very low as compared to the non-reducing sugars [24]. An increase in total sugars may be due to the degradation of complex polysaccharides like pectin and starch into simple sugars. Similar results have been observed by [28]: reducing sugars in juice significantly increase with the increase in the spiced extract concentration (Figure 1c). A significant increase in total proteins was observed with the increase in sugarcane concentration (Figure 1c), which might be due to the contribution of sugarcane juice, having total proteins ranging between 0.39 and 0.60%, as reported by [24]. A significant increase in total proteins due to the increase in the concentration of herbal extract (Figure 1) can be attributed to mint [29,30] and coriander extract [21,29]. With the increase in sugarcane juice concentration, there was a significant decrease in ascorbic acid content due to the low ascorbic acid concentration of sugarcane juice (3.35 mg/100 mL), as observed by [28], in comparison to cucumber juice. However, the effect of the other two variables under study on ascorbic acid content was found to be non-significant (Figure 1c).

3.4. Numerical Optimization

As per the desired goals, each factor and response was chosen to optimize the process parameters for the selection of the best formulation (Table 3). The software generated optimum conditions for the development of the novel cucumber beverage along with the desirability, i.e., 0.952. Thus, the optimum values for the development of the beverage were a 30.14% sugarcane juice concentration, 1.5% salt and 1% spiced extract. A difference was drawn between the predicted and actual values of the parameters to check the efficiency of the developed condition.

3.5. Cluster Analysis of the Different Variables Selected for the Development of a Novel Radish Beverage

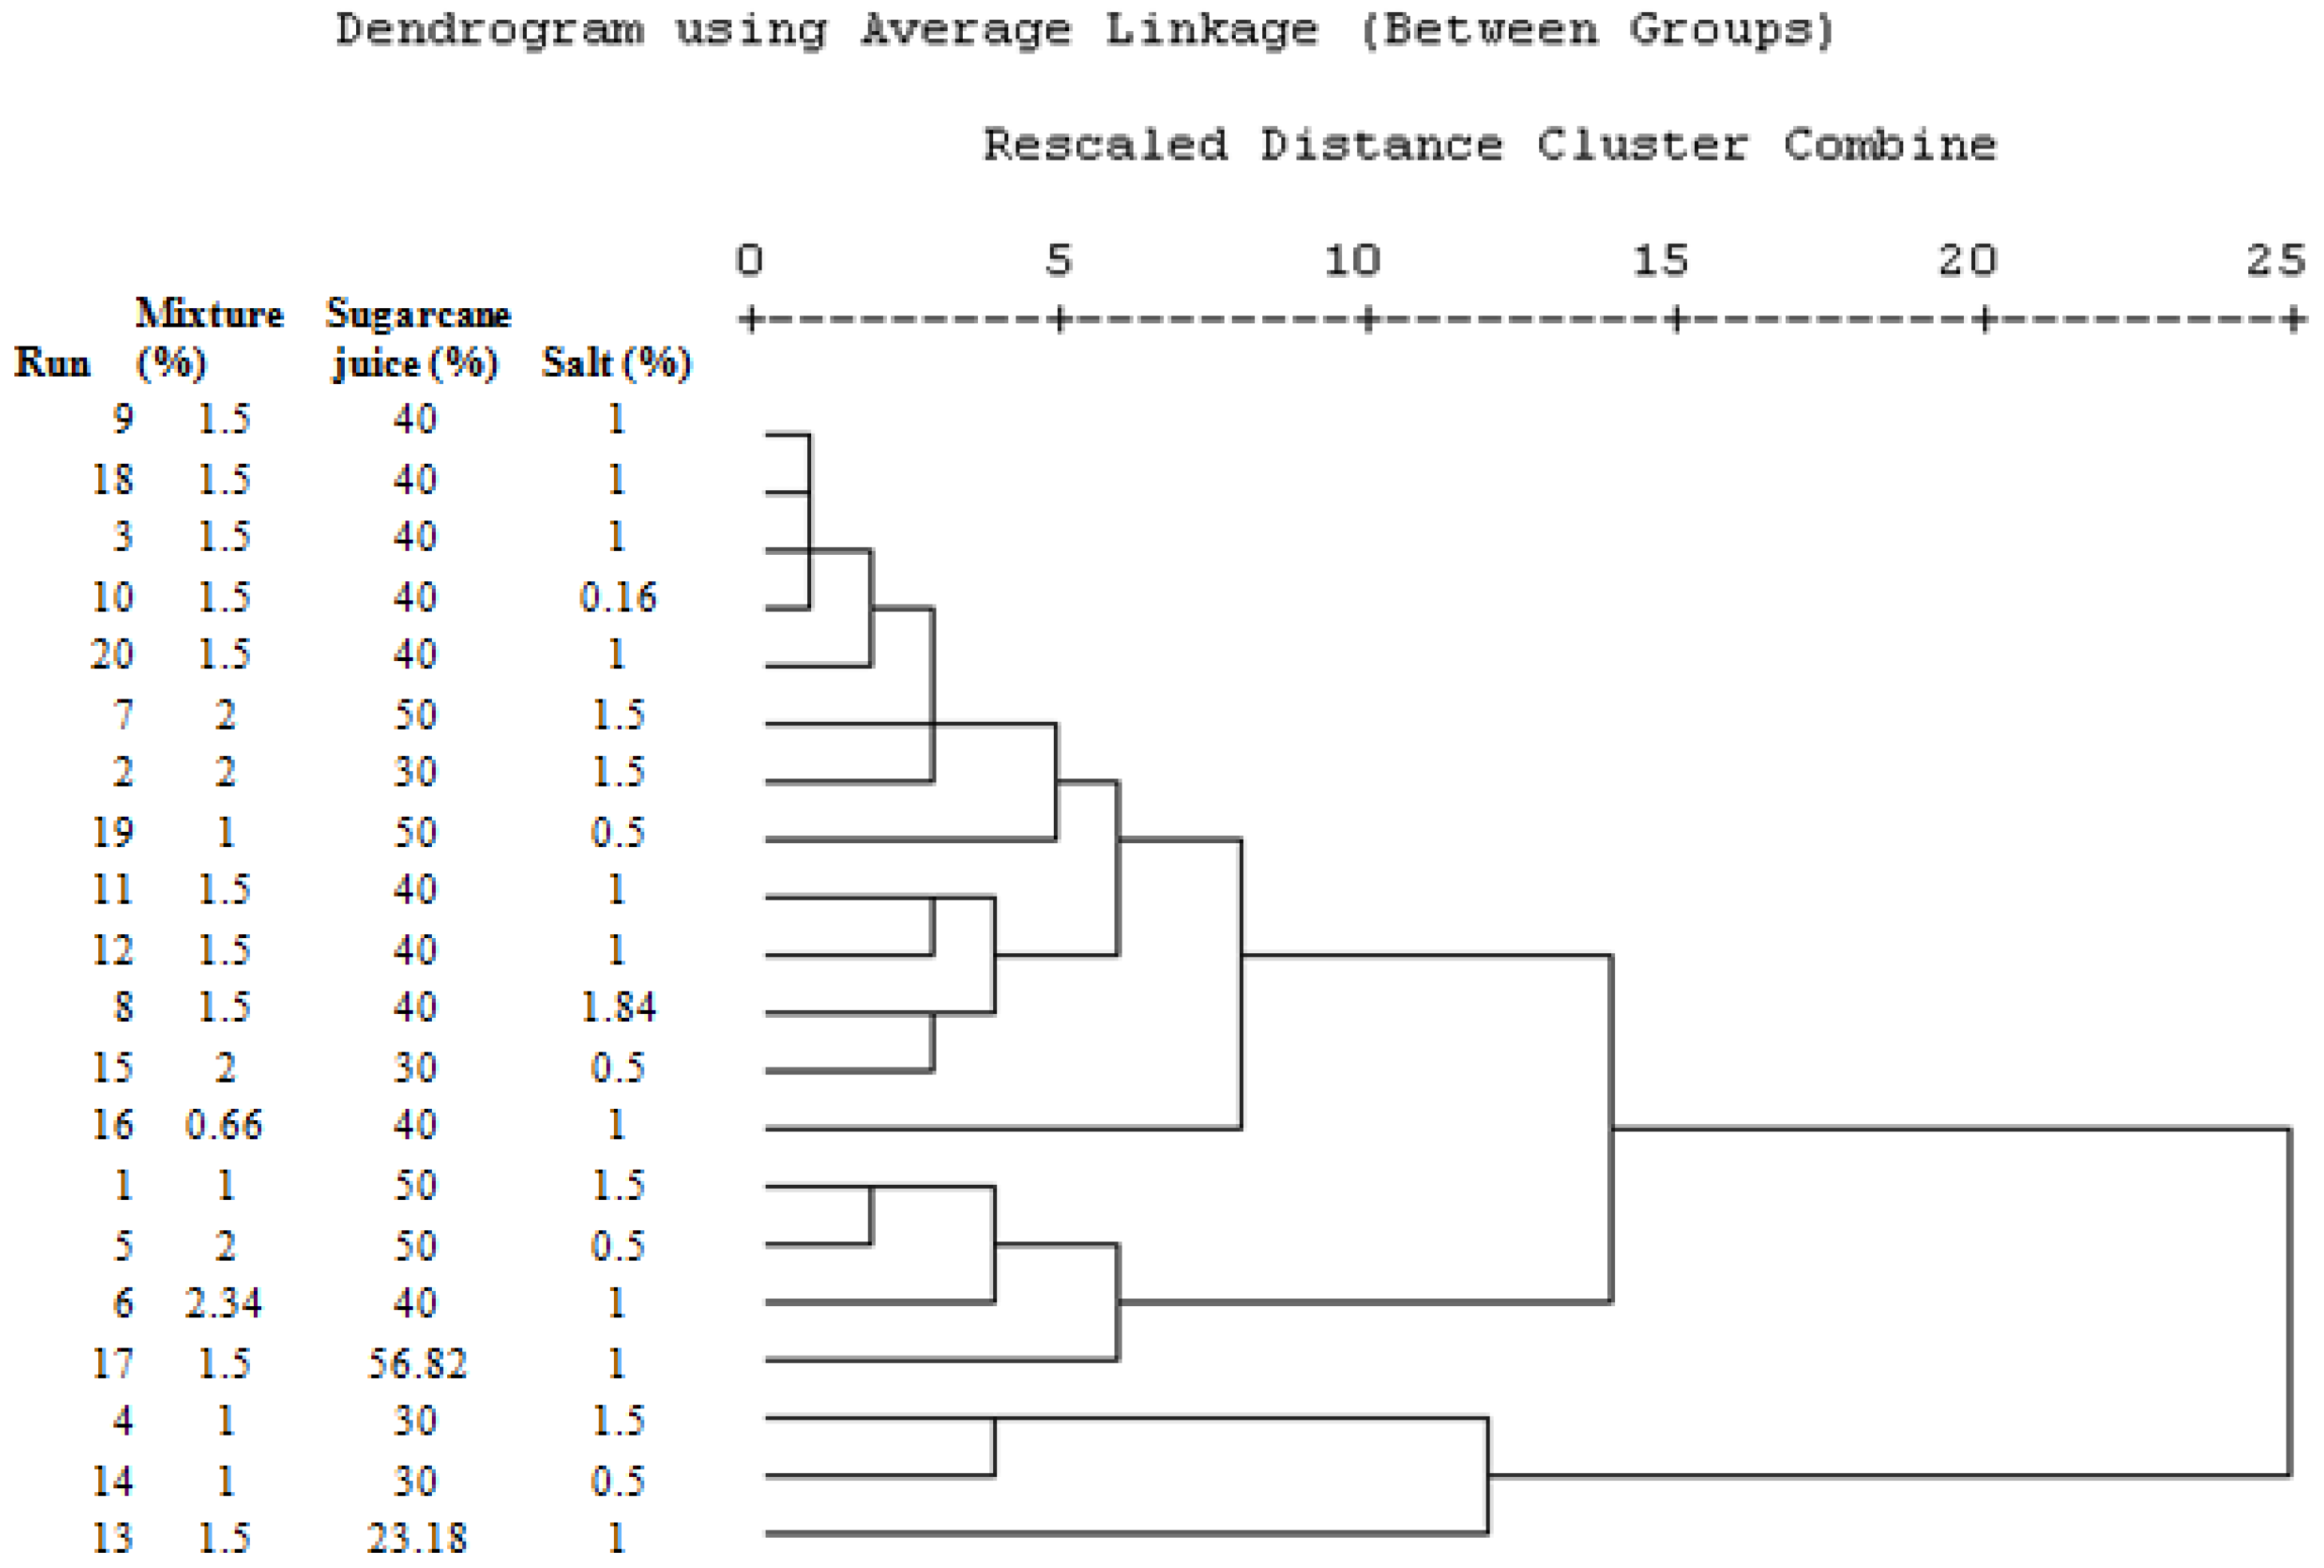
The data obtained from physico-chemical and sensory analyses of spiced cucumber juice were subjected to rescaled distance cluster analysis, and the results are shown in Figure 2. It is evident from the figure that there was the formation of two major clusters based on the concentration of the sugarcane juice. The first cluster comprises the herbal cucumber beverage developed by blending of 40–56.82% sugarcane juice; whereas, the second cluster comprises the herbal radish beverage prepared by blending of 23.18–30% sugarcane juice; which indicated that among all the variables under study, the concentration of sugarcane juice had a significant effect on the phyto-chemical, quality and nutritional characteristics of herbal cucumber beverage.

4. Conclusions

In this study, the optimization of the process for increasing the phyto-chemical, quality and nutritional attributes of spiced cucumber juice was successfully achieved by blending using RSM. The blended cucumber juice with a 30.14% sugarcane juice concentration, 1% herbal extract and a 1.5% salt concentration was the most effective blend with the highest acceptability, phytochemical and quality attributes. The developed product will add to the variety of the products in the beverage industry, but still, the shelf life and the scale up study are urgently needed to commercialize the same.

Acknowledgments

The authors are thankful to Lovely Professional University for providing infrastructure and financial support for the study.

Author Contributions

All authors contributed equally to this work, i.e., Heena conducted the research under the guidance of the advisory committee (Vikas Kumar, Yogesh Gat, Ashwani Chandel, Anil Panghal). Jaspreet Kaur helped in the documentation of the data, its analysis and paper writing.

Conflicts of Interest

The authors have no conflicts of interest to declare.

References

  1. Caswell, H. The role of fruit juice in the diet: An overview. Nutr. Bull. 2009, 34, 273–288. [Google Scholar] [CrossRef]
  2. Gupta, H.; Gupta, P. Fruit drinks how healthy and safe? Indian Pediatr. 2008, 45, 215. [Google Scholar] [PubMed]
  3. Randazzo, W.; Corona, O.; Guarcello, R.; Francesca, N.; Germana, M.A.; Erten, H.; Moschetti, G.; Settanni, L. Development of new non-dairy beverages from Mediterranean fruit juices fermented with water kefir microorganisms. Food Microbiol. 2016, 54, 40–51. [Google Scholar] [CrossRef] [Green Version]
  4. Corona, O.; Randazzo, W.; Miceli, A.; Guarcello, R.; Francesca, N.; Erten, H.; Moschetti, G.; Settanni, L. Characterization of kefir-like beverages produced from vegetable juices. LWT Food Sci. Technol. 2016, 66, 572–581. [Google Scholar] [CrossRef] [Green Version]
  5. Mukherjee, P.K.; Nema, N.K.; Maity, N.; Sarkar, B.K. Phytochemical and therapeutic potential of cucumber. Fitoterapia 2013, 84, 227–236. [Google Scholar] [CrossRef] [PubMed]
  6. Bhardwaj, R.L.; Pandey, S. Juice blends—A way of utilization of under-utilized fruits, vegetables, and spices: A review. Crit. Rev. Food Sci. Nutr. 2011, 51, 563–570. [Google Scholar] [CrossRef] [PubMed]
  7. Akusu, O.M.; Kiin-Kabari, D.B.; Ebere, C.O. Quality Characteristics of Orange/Pineapple Fruit Juice Blends. Am. J. Food Sci. Technol. 2016, 4, 43–47. [Google Scholar]
  8. Kadam, U.S.; Ghosh, S.B.; De, S.; Suprasanna, P.; Devasagayam, T.P.; Bapat, V.A. Antioxidant activity in sugarcane juice and its protective role against radiation induced DNA damage. Food Chem. 2008, 106, 1154–1160. [Google Scholar] [CrossRef]
  9. Abbas, S.R.; Sabir, S.M.; Ahmad, S.D.; Boligon, A.A.; Athayde, M.L. Phenolic profile, antioxidant potential and DNA damage protecting activity of sugarcane (Saccharum officinarum). Food Chem. 2014, 147, 10–16. [Google Scholar] [CrossRef] [PubMed]
  10. Zamir, R.; Khalil, S.A.; Shah, S.T.; Ahmad, N.; Saima, S. Antioxidant activity influenced by in vivo and in vitro mutagenesis in sugarcane (Saccharum officinarum L.). Afr. J. Biotechnol. 2012, 11, 11686–11692. [Google Scholar]
  11. Kamarul Zaman, A.A.; Shamsudin, R.; Mohd Adzahan, N. Effect of blending ratio on quality of fresh pineapple (Ananas comosus L.) and mango (Mangifera indica L.) juice blends. Int. Food Res. J. 2016, 23, 101–106. [Google Scholar]
  12. AOAC. Official Methods of Analysis, 15th ed.; Association of Official Analytical Chemists: Washington, DC, USA, 2000. [Google Scholar]
  13. Sadasivum, S.; Manickam, A. Biochemical Method for Agricultural Sciences; Wiley Eastern Limited: New Dehli, India, 1992. [Google Scholar]
  14. Brand-Williams, W.; Cuvelier, M.E.; Berset, C.L. Use of a free radical method to evaluate antioxidant activity. LWT Food Sci. Technol. 1995, 28, 25–30. [Google Scholar] [CrossRef]
  15. Ranganna, S. Handbook of Analysis and Quality Control for Fruit and Vegetable Products, 2nd ed.; Tata McGraw Hill Publication: New Delhi, India, 1986; pp. 12–15. [Google Scholar]
  16. Amerine, M.A.; Pangborn, R.M.; Roessler, E.B. Principles of Sensory Evaluation of Food; Academic Press: New York, NY, USA, 1965; pp. 338–339. [Google Scholar]
  17. Joshi, V.K.; Kumar, V. Influence of different sugar sources, nitrogen sources and inocula on the quality characteristics of apple tea wine. J. Inst. Brew. 2017, 123, 268–276. [Google Scholar] [CrossRef]
  18. Al-Juhaimi, F.; Ghafoor, K.A. Total phenols and antioxidant activities of leaf and stem extracts from coriander, mint and parsley grown in Saudi Arabia. Pak. J. Bot. 2011, 43, 2235–2237. [Google Scholar]
  19. Albano, S.M.; Miguel, M.G. Biological activities of extracts of plants grown in Portugal. Ind. Crops Prod. 2011, 33, 338–343. [Google Scholar] [CrossRef]
  20. Kim, I.S.; Yang, M.R.; Lee, O.H.; Kang, S.N. Antioxidant activities of hot water extracts from various spices. Int. J. Mol. Sci. 2011, 12, 4120–4131. [Google Scholar] [CrossRef] [PubMed]
  21. Bhat, S.; Kaushal, P.; Kaur, M.; Sharma, H.K. Coriander (Coriandrum sativum L.): Processing, nutritional and functional aspects. Afr. J. Plant Sci. 2014, 8, 25–33. [Google Scholar]
  22. Kranz, S.; Bolling, B. Sugars and Citric Acid Differently Modulate DPPH Antioxidant Activity in Polyphenol-rich Fruit Juices. FASEB J. 2015, 29, 922.14. [Google Scholar]
  23. Sangeeta, S.H.; Khatkar, B.S. Studies on stability of sugarcane juice blended with anola juice at refrigerated and room temperature. Int. J. Agric. Food Sci. Technol. 2013, 4, 1027–1036. [Google Scholar]
  24. Chauhan, O.P.; Singh, D.; Tyagi, S.M.; Balyan, D.K. Studies on preservation of sugarcane juice. Int. J. Food Prop. 2002, 5, 217–229. [Google Scholar] [CrossRef]
  25. Singh, R.K.; Jha, A.; Singh, CK.; Singh, K. Optimization of process and physico-chemical properties of ready-to-serve (RTS) beverage of cane juice with curd. Sugar Tech 2012, 14, 405–411. [Google Scholar] [CrossRef]
  26. Hamerski, F.; da Silva, V.R.; Corazza, M.L.; Ndiaye, P.M.; de Aquino, A.D. Assessment of variables effects on sugar cane juice clarification by carbonation process. Int. J. Food Sci. Technol. 2012, 47, 422–428. [Google Scholar] [CrossRef]
  27. Hussain, I.; Zeb, A.; Ayub, M. Evaluation of apple and apricot blend juice preserved with sodium benzoate at refrigeration temperature. World J. Agric. Sci. 2011, 7, 136–142. [Google Scholar]
  28. Rawat, K.; Pokhriyal, S. Preservation of sugarcane juice using hurdle technology. Int. J. Sci. Eng. Technol. 2014, 3, 1455–1458. [Google Scholar]
  29. Gopalan, C.R.; Rama Sastri, B.V.; Balasubramanian, S.C. Nutrition Value of Indian Foods; National Institute of Nutrition, Indian Council of Medical Research: Hyderabad, India, 1980. [Google Scholar]
  30. Dogan, S.; Diken, M.E.; Dogan, M. Antioxidant, phenolic and protein contents of some medicinal plants. J. Med. Plants Res. 2010, 4, 2566–2572. [Google Scholar]
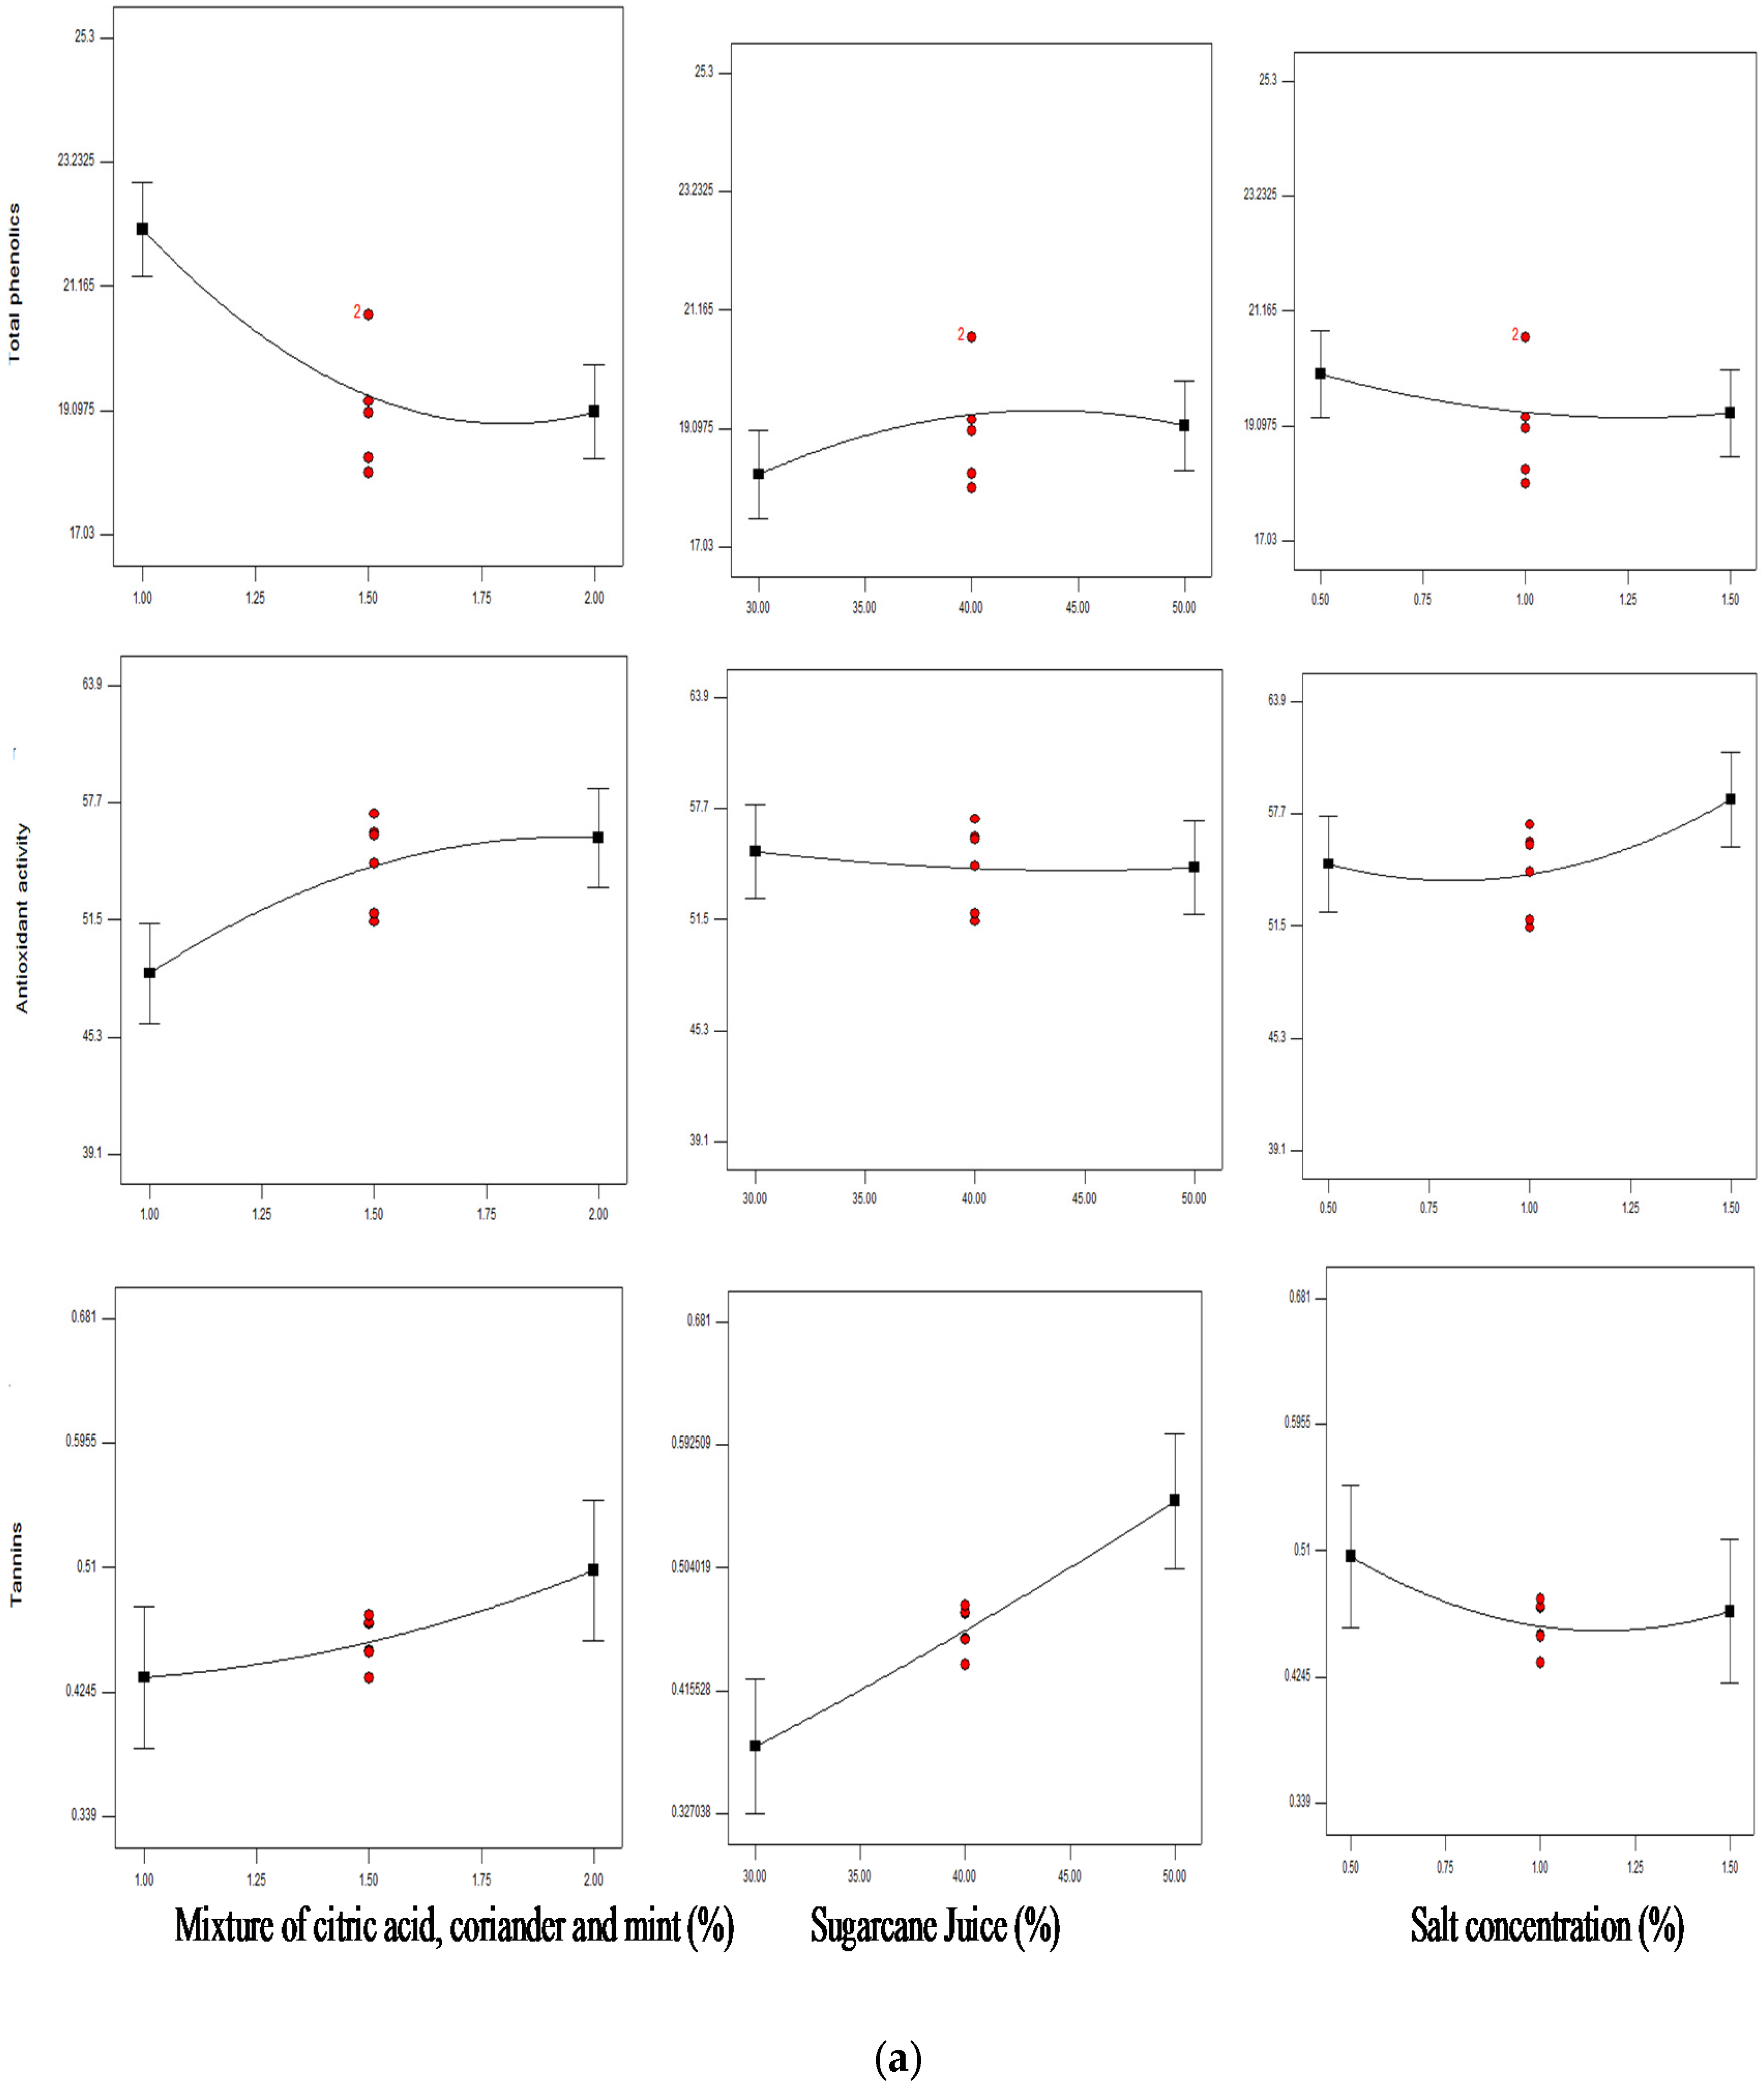
Figure 1. Influence of each processing variable on the response variables when other processing variables are held constant; numbers next to the X and Y axes labels correspond to the value of each variable at the red dotted point. (a) Influence of each processing variable on phytochemical attributes; (b) Influence of each processing variable on quality parameters; (c) Influence of each processing variable on nutritional parameters.
Beverages 03 00050 g001aBeverages 03 00050 g001bBeverages 03 00050 g001c
Figure 2. Cluster analysis of the different variables selected for the development of spiced cucumber beverage.
Beverages 03 00050 g002
Table 1. Treatment combinations along with their responses obtained during the preparation of blended cucumber juice.
TrialsABCTSS (°Brix)TA (%)pHRed. Sugars (%)Tot. Sugars (%)Total Proteins (mg)Phenols (mg)Ascorbic Acid (mg)Antioxidant Activity (%)Tannins (mg)Overall Acceptability
11.00501.50150.524.0120.277.151.28305.958.8140.6397.84
22.00301.50101.243.3617.643.980.73273.8255.6190.4047.83
31.50401.00100.833.4719.056.430.95279.557.1160.4537.71
41.00301.50100.643.621.623.630.78221.453.419.60.3398.36
52.00500.50110.953.3921.436.991.155310.6559.4140.6817.98
62.34401.00101.32.9620.536.551317.3553.216.50.5647.85
72.00501.50121.243.2218.027.031.29282.962.5150.6427.87
81.50401.8411.60.793.4721.045.890.99279.7563.915.90.4747.92
91.50401.00100.883.5218.315.140.955267.6554.516.30.4777.58
101.50400.1691.023.7519.625.341.14262.153.616.90.5736.65
111.50401.00100.983.4918.065.791.045195.2551.4160.4527.47
121.50401.00100.993.4620.696.561.05232.656.1160.4347.65
131.5023.181.0090.924.0117.033.260.755195.2557.821.50.4176.9
141.00300.509.20.584.3322.313.430.855232.651.818.50.3416.74
152.00300.5091.33.2517.673.320.83266.361.819.60.4466.95
160.66401.00100.225.325.36.480.965269.6539.116.70.3917.29
171.5056.821.00130.774.2118.238.951.37324.0549.26.60.4956.82
181.50401.0010.20.93.4719.255.661.065281.9556160.4727.62
191.00500.5010.80.444.7823.346.71.195292.450.214.50.6436.78
201.50401.0010.20.923.6720.696.530.935283.9551.84160.4717.33
A: mixture of citric acid, coriander and mint (%); B: sugarcane juice (%); C: salt concentration (%); TSS = total soluble solids; TA = titratable acidity; Red. sugars = reducing sugars; Tot. sugars = total sugars.
Table 2. ANOVA and regression coefficients of the second-order polynomial model for the response variables.
VariablesDFTSSTApHRSTSTPPhenolsAAAntioxidant ActivityTanninsOA
Model916.2320.3612.7819.4111.8911.936.598.583.433.359.20
A12.51169.66 *83.69 *0.0460.05312.17 *25.31 *0.01612.293.82 *4.96
B183.85 *6.62 *2.17164.57 *101.70 *80.11 *1.9972.90 *0.20 *22.040.30
C136.12 *2.515 × 10−36.24 *0.930.990.521.350.0173.080.9745.14 *
A210.234.158.47 *0.551.398 × 10−32.7417.99 *1.354.510.471.48
B219.63 *0.617.78 *1.220.723.904.401.630.250.0729.11 *
C211.610.0120.0691.353.660.0911.300.945.602.47 *0.23
AB13.220.121.910.0751.597 × 10−36.61 *1.990.0004.316 × 10−30.435.93 *
AC14.290.125.36 *0.0238.149 × 10−40.410.0102.541 × 10−31.560.159.01 *
BC15.51 *2.080.265.76 *0.0450.0933.310.0002.342.586 × 10−55.93 *
Lack of Fit 2.570.0640.450.0162.161147.036.0819.60113.670.0470.41
R2 0.93590.94820.92000.94580.91450.91480.85560.88540.75560.75100.8923
Adj R2 0.87830.90170.84800.89710.83760.83810.72570.78220.53560.52680.7953
CV% 4.884.885.895.7210.794.555.598.646.8714.183.02
A = herbal extract at the linear level, B = sugarcane juice at the linear level, C = salt concentration at the linear level, A2 = herbal extract at the quadratic level, B2 = sugarcane juice at the quadratic level, C2 = salt concentration at the quadratic level, AB = interaction between herbal extract and sugarcane juice, AC = interaction between herbal extract and salt concentration, BC = interaction between sugarcane juice and salt concentration. * Significant at the 5% level. TSS = total soluble solids, TA = titratable acidity, RS = reducing sugars, TS = total sugars, TP = total proteins, AA = ascorbic acid, OA = overall acceptability.
Table 3. Software generated optimum conditions for preparation of blended cucumber juice along with its predicted and experimental values for the best blend and phytochemicals.
ABC TSS (°Brix)TA (%)pHRed. Sugars (%)Tot. Sugars (%)Total Proteins (mg)Phenols (mg)Ascorbic Acid (mg)AA (%)Tannins (mg)OADesirability
1.0030.141.50Predicted10.140.533.880.7684.114223.9222.2719.43853.520.358.270.952
Actual10.000.503.810.7594.110223.8122.1519.43053.490.308.26
Difference0.0140.030.070.0090.0040.1100.120.0080.030.050.01
A: mixture of citric acid, coriander and mint (%); B: sugarcane juice (%); C: salt concentration (%); TSS = total soluble solids; TA = titratable acidity; Red. sugars = reducing sugars; Tot. sugars = total sugars; AA = antioxidant activity; OA = overall acceptability.