Article

Small Prizes Increased Plain Milk and Vegetable Selection by Elementary School Children without Adversely Affecting Total Milk Purchase

1
College of Medicine and Life Sciences, University of Toledo, Toledo, OH 43614, USA
2
Center for Better Health and Nutrition, Cincinnati Children’s Hospital Medical Center, Cincinnati, OH 45229, USA
3
Norwood City School District, Norwood, OH 45212, USA
4
James M. Anderson Center for Health Systems Excellence, Cincinnati Children’s Hospital Medical Center, Cincinnati, OH 45229, USA
*
Author to whom correspondence should be addressed.
Beverages 2017, 3(1), 14; https://doi.org/10.3390/beverages3010014
Submission received: 3 October 2016 / Revised: 5 February 2017 / Accepted: 13 February 2017 / Published: 17 February 2017
(This article belongs to the Special Issue Milk: Bioactive Components and Role in Human Nutrition)

Abstract

:
(1) Background: Pediatric obesity continues to be a major public health issue. Poor food selection in the school cafeteria is a risk factor. Chocolate or strawberry flavored milk is favored by the majority of elementary school students. Previous health promotion efforts have led to increased selection of plain milk, but may compromise total milk purchased. In our study, we examined the effectiveness of small prizes as incentives to improve healthy food and beverage selection by elementary school students; (2) Methods: In a small Midwestern school district, small prizes were given to elementary school students who selected a “Power Plate” (PP), the healthful combination of a plain milk, a fruit, a vegetable and an entrée with whole grain over two academic school years; (3) Results: PP selection increased from 0.05 per student to 0.19, a 271% increase (p < 0.001). All healthful foods had increased selection with plain milk having the greatest increase, 0.098 per student to 0.255, a 159% increase (p < 0.001); (4) Total milk purchased increased modestly from 0.916 to 0.956 per student (p = 0.000331). Conclusion: Giving small prizes as a reward for healthful food selection substantially improves healthful food selection and the effect is sustainable over two academic years.

Graphical Abstract

1. Introduction

Pediatric obesity continues to be a major worldwide health problem [1,2]. Poor food selection such as choosing flavored milk or not selecting fruits and vegetables in the cafeteria by elementary school students is a risk factor for obesity [3]. Milk consumption in children is associated with improved Body Mass Index (BMI) status and positive intake of essential nutrients [4]. Flavored milk, which has added sugar, is offered in many US schools as part of the US Department of Agriculture free and reduced lunch program. Plain milk is also offered but flavored milk is preferred by the majority of students [5].
Initiatives to promote better food selection such as product placement, attractive display and featured naming (foods are given playful names) and convenience lines (those selecting healthful choices go to a shorter check-out line) typically improve healthy food selection by 20% to 100% [6,7]. Privatera et al. showed that emoticons can be used to influence school aged children’s food choices [8].
Incentives to improve adult lifestyle behavior have been used successfully for several health goals including weight loss, smoking cessation and global wellness initiatives [9,10,11]. McDonald’s corporation successfully introduced the “Happy Meal” concept in 1978 to increase sales to children [12]. Hobin et al. used small prizes to increase healthful packaged meal selection by 100% [13]. Just et al. demonstrated that school aged children would increase fruits and vegetables selected at lunch by 80% if given an incentive [14]. This type of intervention was further explored by List and Samek who demonstrated that when small prizes were offered to school aged children in separate interventions, plain milk selection increased from 16% to 40% and a more healthful snack from 17% to 75% of students [15,16].
Our research group had previously piloted the use of emoticons alone and then emoticons with small prizes to increase selection of healthful food selection in a Cincinnati inner city elementary school [17,18]. With the placement of “green smiley-faced” emoticons alone, plain fat-free milk and vegetables increased by 141% and 29% respectively, but there was no improvement in fruit or entrée selection [17]. To further increase healthful selection, we then added the Power Plate Program (PPP) to the emoticons [18]. The “Power Plate” (PP) was defined as the most healthful combination of foods available within the school lunch program: a plain milk, a vegetable, a fruit and an entrée with whole grain (sold together). With the “Power Plate Program” (PPP), emoticons were placed near the individual PP food items. While children still selected food items separately, they received a small prize for selecting the PP combination of a fruit, a vegetable, an entrée with whole grain and plain milk on PP days. Prizes consisted of a sticker, temporary tattoo, or a small toy valued at 40 cents or less. During the initial 10 weeks of the PPP, selection of plain milk increased by over 500%, vegetable selection by 71% and fruit selection by 20%. Frequency of “PP Days” (twice a week versus everyday) and quality of the prizes were tested and had little effect. At 15 months follow up, plain milk selection was still 253% above baseline when stickers or tattoos were given twice a week [19].
Based on our initial pilots, we determined the addition of the small prizes to the emoticons increased healthful food selection. Additionally, we tested whether the PPP altered the amount of waste by students and found there was no significant difference in waste of any of the PP food items [20]. Finally, we piloted the PPP in the three elementary schools of the Norwood City School District (NCSD) which has a diverse and economically broad student body. During this brief three week pilot, PP selection increased by over 500% [21]. Thus the work of other investigators and our group show that emoticon labelling and small prizes as incentives can be used to improved healthful food purchase by elementary school age children. With our current study we describe using emoticons and small prizes on larger scale over two academic years in an ethnically diverse school system.

2. Materials and Methods
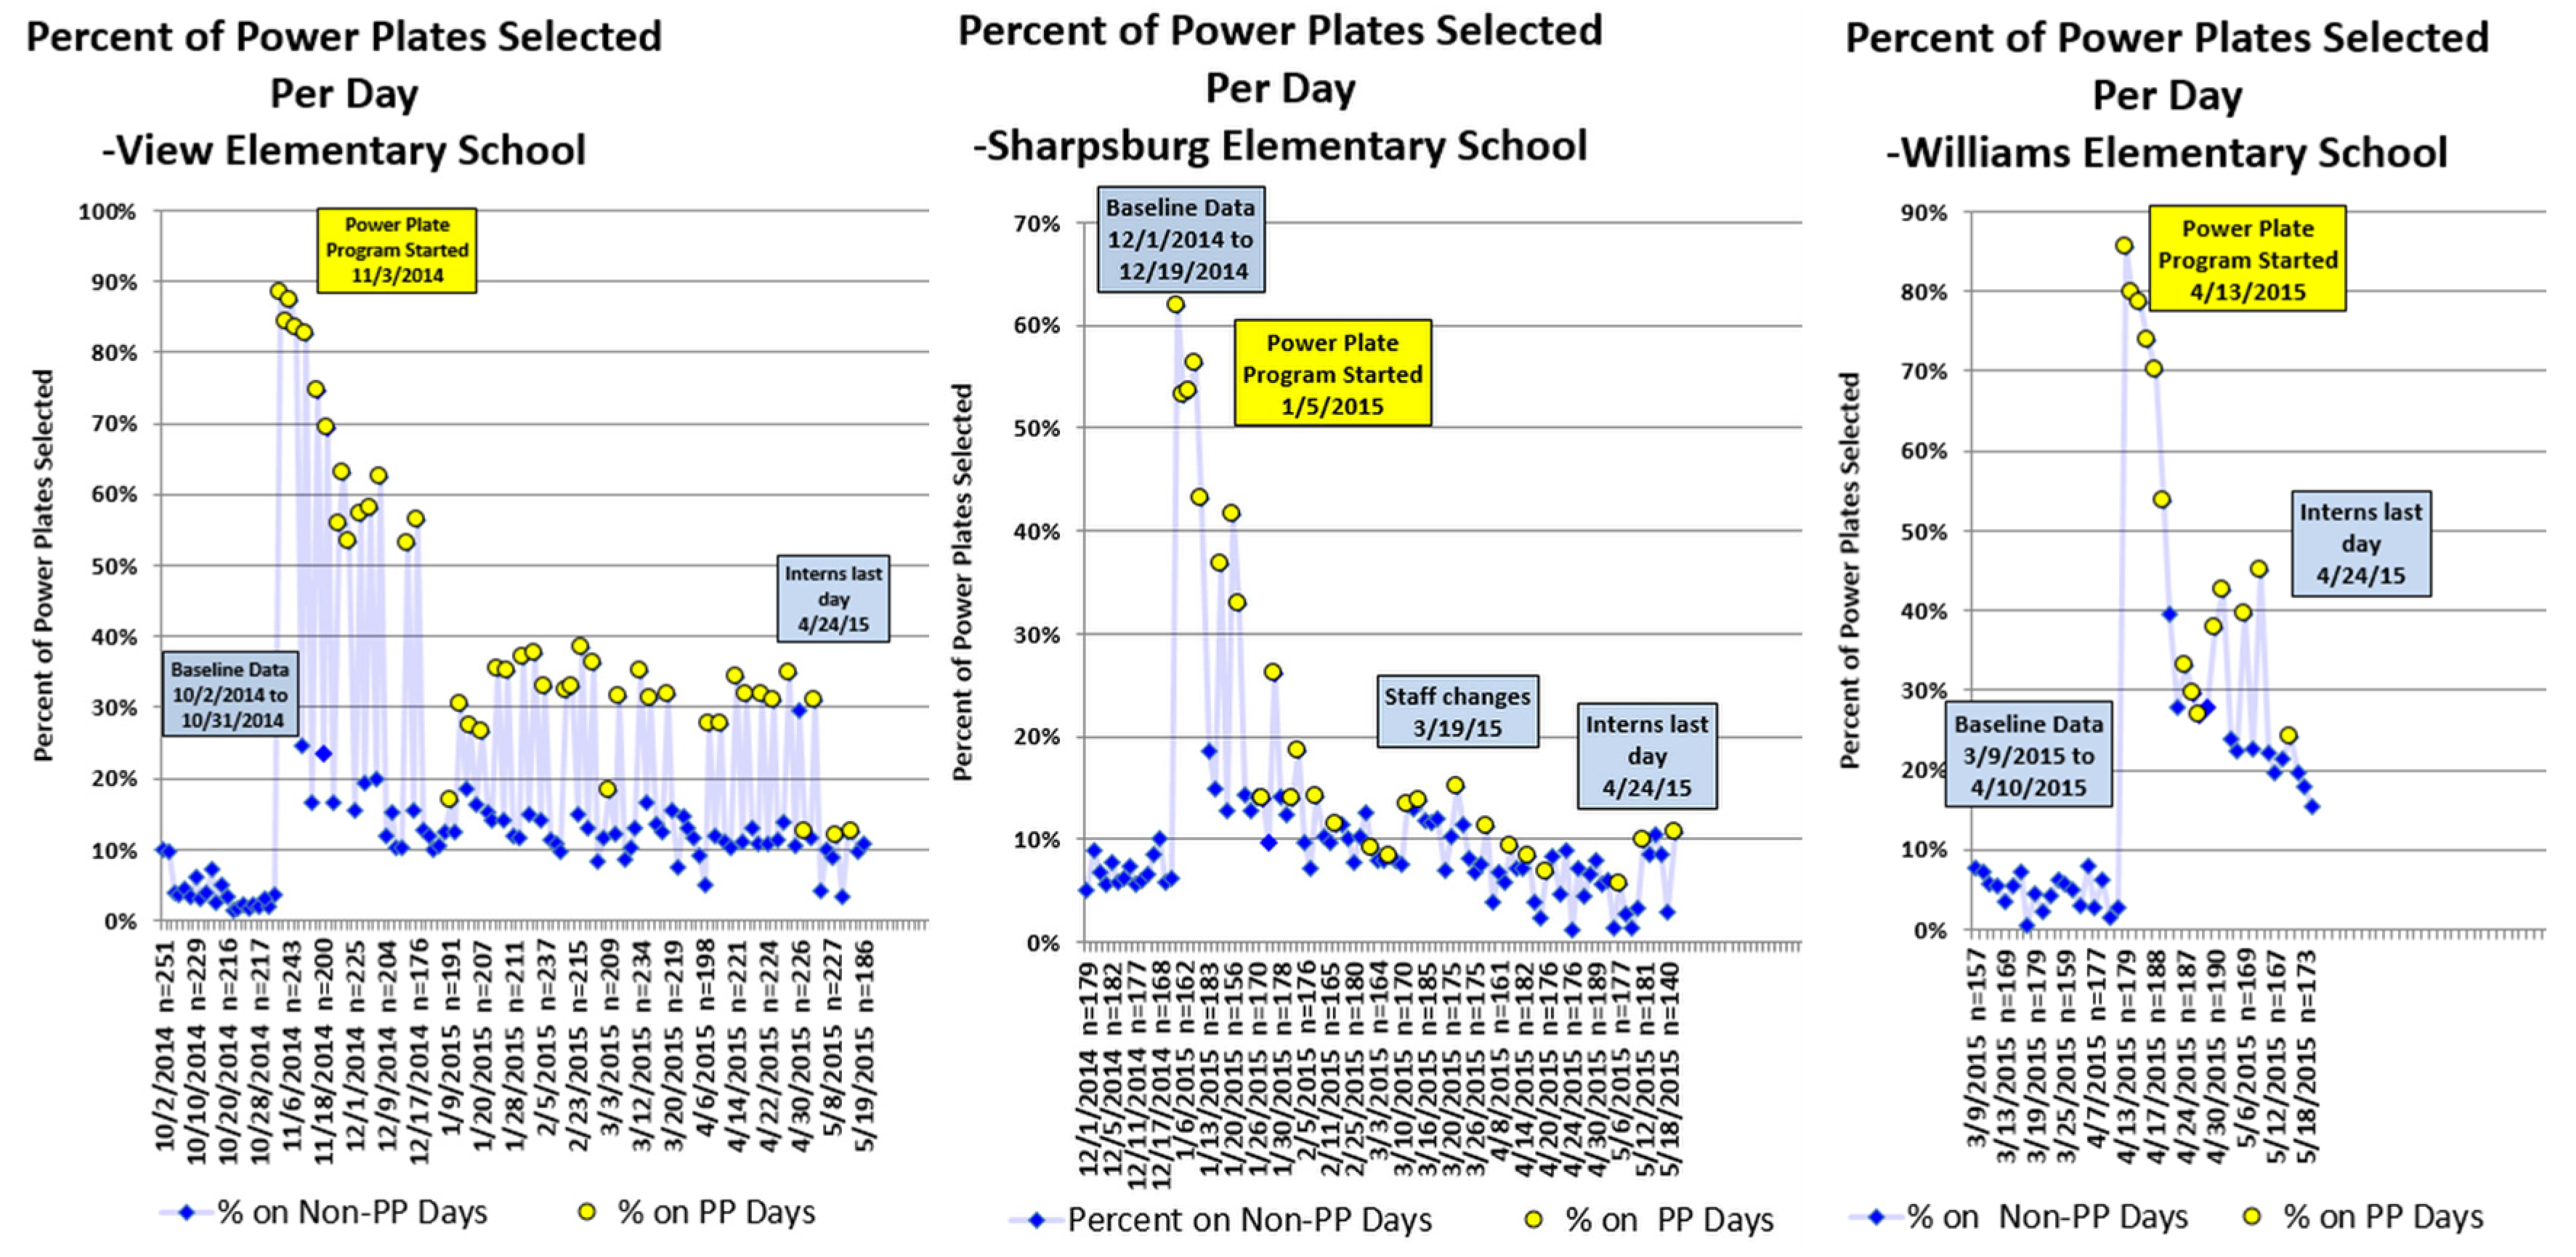
All three elementary schools in the Norwood City School District were recruited for the extended PPP. The demographics of the schools are described in Table 1.
Children in grades K through 6 participated in the PPP at Norwood View and Williams Avenue Elementary Schools. Only grades 3 through 6 of the Sharpsburg Elementary School participated as grades K to 2 have a separate lunch room that does not allow for children to select their own food items. For those participating in the NCSD Lunch Program, children must select an entrée with whole grain (these are served together) and a vegetable. The students have the option to select up to two fruits, a plain milk or chocolate milk and an additional vegetable if available. Thus on most days, students may select up to two vegetables (with a minimum of one) and two fruits per day. The PPP was rolled out in the three schools as follows: Norwood View Elementary on 3 November 2014, Sharpsburg Elementary on 5 January 2015, and Williams Ave. Elementary School 13 April 2015. The cafeteria cash registers at the schools were equipped with a button to record when a student selected the PP of fruit, vegetable, plain milk and entrée with whole grain. PP data collection was started four weeks before the PPP began at each of the schools. During the first week of the program, “green-smiley faced” emoticons were placed by the PP food items and beverages. Bracelets were given out on the first day if a PP was selected. Figure 1 demonstrates the “green smiley-faced” emoticon placed near the PFFM (a) and in (b) bracelets that were given out a small prize during the “kick-off” week with a PP that was selected by one of the students.
Thereafter, on Tuesdays and Thursdays, stickers or temporary tattoos were given to students who selected the PP combination for the remainder of the academic school year by cafeteria staff and volunteers. During the PPP, students still had to choose food and beverage items independently, but were rewarded on PP days if they chose the PP (a fruit, a vegetable, an entrée with whole grain and a plain milk). The PPP was resumed for all three schools in September 2015 during the second academic year of the program and continued through the end of May2016. Thus the intervention lasted for 56 weeks with a 3-week gap at the beginning of the 2nd academic year during weeks 23 to 26. Cafeteria cash register receipt data was collected for one month prior to the PPP intervention and then throughout the entire intervention period. Data were obtained for all food items except for entrée as all students who purchase a lunch receive automatically an entrée with whole grain. Purchase data obtained from cash register receipts were supplied by the Food Services Department of Norwood City School District (NCSD) Statistical analysis by Z-testing (OpenEpi, Version 3, http://www.openepi.com) was used to compare the differences in the rate of food item selected per student per day between the baseline period (no intervention) to the intervention period when emoticons plus PP prizes were used. The NCSD was involved in the design, implementation and analysis of our intervention. This project was reviewed by the Cincinnati Children’s Institutional Review Board, determined not to be a Human Subjects Research project and thus exempt.

3. Results

Observations were made on 158,596 school lunches purchased between October 2, 2014 and May 25, 2016 at the three elementary schools. Table 2 lists the PP and individual food item purchases comparing baseline (one month before the PPP was initiated) and throughout the intervention period to the end of the 2nd academic year. The rate is the number of a particular food item or beverage selected per student per lunch time. There were favorable increases reported for the PP (271%), plain milk (159%), fruits (18%), and vegetables (9%). Chocolate milk purchases decreased by 14% and total milk (plain + chocolate milk) had a more modest, but significant increase of 4%. The increase in vegetables selected, however, was somewhat surprising as students who participate in the school lunch program are automatically served a vegetable and entrée with whole grain in the NCSD schools at baseline. Selection of fruit and selection of the type of milk is at the student’s discretion. Since students are typically offered two fruits and two vegetables with each lunch, it was possible for students to have greater than one vegetable or fruit serving with each meal. There was a dip in PP selection at weeks 20 to 25 which corresponds to the end of the first academic year when there were no cafeteria volunteers to help with the program and the beginning of the second academic before the PPP was resumed.
Mean PP section increased from 0.0522 PP per student before incentives to 0.194 per student after implementing the incentives twice a week for PP selection. The graph is displayed with the baseline data period and PP initiation in phase (note: the initiation dates were different for the schools). Thus, week number is displayed rather than date. While the x-axis of the graph is numbered by week, each individual point represents a single day. The “zig-zag” pattern of the graph reflects increased PP sales on Tuesdays and Thursdays when prizes were given and decreased PP sales on non-prize days. The red “Mean” line shows the means for the entire pre-intervention (baseline) and the entire intervention period.
Figure 2 displays percent of students selecting the PP versus time at the three school individually during the 2014–15 academic year. Even though the dates of introduction are staggered, the effect is similar at each school suggesting that time of year is not a factor in PP selection. Events are annotated such as baseline period, when the PP was initiated and events that may have influenced the effectiveness of the program such as cafeteria staff changes at the Sharpsburg School or when the school dietary interns who helped run program left for summer break.

4. Discussion

This study shows that an incentive program to encourage school children to choose healthier food and beverage items in the lunch cafeteria was successful and the effect maintained on days prizes were given across a substantial time period and across schools with a diverse student body. The intervention resulted in a 5-fold increase in the selection of healthier items and this effect continued across two academic years. The intervention, which involved twice weekly provision of stickers or tattoos as ‘prizes’ for choosing healthier items (as indicated with a green happy face emoticon), compares favorably to other types of interventions to improve food selection in school cafeterias which typically see increases in the range of 20% to 100% [6,7,14]. Specifically, plain milk selection experienced the largest increase observed at 150% over baseline sales of plain milk. Given that about 60% of the 960 students participate in the school lunch program, this translates into an increase of about 100 cartons of plain milk per day for all the schools combined. Fruits had an 18% increase during the PPP compared to baseline. The smallest individual effect was with vegetables which increased by 9 percent over baseline purchase of vegetables. This increase is still remarkable as students are automatically served a vegetable by the school cafeteria staff.
Milk is recognized as an important source of calcium and other nutrients in children [23]. The majority of elementary school children select chocolate milk over plain milk when participating in the USDA school lunch program [24]. While there is some uncertainty on how chocolate milk selection over plain milk selection affects health status, chocolate milk contains about twice the sugar as plain milk. Attempts at eliminating chocolate milk and only offering plain milk in school cafeterias have led to increased plain milk purchase, but with a 10% to 26% overall milk purchase decrease and a decrease in consumption [25,26]. In our intervention, we successfully increased plain milk and even had a modest increase in overall milk purchase.
There are several limitations to our study. There are concerns as described previously by Birch et al. that giving external rewards for food selection may lead to avoiding a particular food when the rewards are stopped [27,28]. We did see PP purchases drop on days that rewards were not given with PP sales remaining marginally higher than baseline PP sales. Even with our extended intervention children reverted to close to their baseline choices on days without the incentives suggesting that the intervention is useful for changing foods purchased/chosen but not sufficient for changing preferences. Follow-up data post-intervention would show whether this marginal increase is sustained. Of concern, when the PPP was stopped at the end of the first academic year, there was a drop in PP selection. Also, this study did not evaluate the impact of the intervention on the overall diet of the children. Further, we only had purchase data and did not measure actual food / beverage consumption. We cannot comment on how consumption was affected or how individual purchases varied during the study. However, consumption data using the PPP in a previous inner city elementary school pilot showed that waste was unaffected by the program [20].
There are practical issues for implementation and sustainability of the PPP. The program was administered by existing cafeteria staff and volunteers. While this makes the PPP inexpensive to operate, school cafeterias are a busy environment and staff and volunteers may be distracted by other duties. This program was successfully implemented using the research format (i.e., with existing cafeteria staff and volunteers) over two academic years but that the data from one of the schools showed that cafeteria staff changes impacted negatively on the effectiveness of the PPP. Therefore scaling up of this intervention to more schools or even state-wide might need support mechanisms when cafeteria staff changes occur. The strengths of our study are that we have a very large observation of lunches purchased directly through cafeteria receipts over a two academic years. Given that the PPP was implemented with existing resources, the program could be cost-effective and sustainable when scaled up to a state-wide level.

5. Conclusions

We conclude that the PPP is an effective intervention in increasing healthful food selection in elementary school children. The greatest effect was in plain milk replacing flavored milk purchased.

Acknowledgments

We would like to thank the staff and students of the Norwood City School District for their help with this project. The project described was supported by the National Center for Advancing Translational Sciences of the National Institutes of Health, under Award Number 1UL1TR001425-01. The content is solely the responsibility of the authors and does not necessarily represent the official views of the NIH.

Author Contributions

All authors listed contributed substantially to this project and manuscript. R Siegel, M. Hudgens, D. Robison and R Kipp conceived and designed the experiments; A. Barnes, E. Hiller and M. Hudgens performed the experiments; R. Siegel, M. Emmerson, Ursula Bradshaw and M. Hudgens analyzed the data; M. Emmerson and U. Bradshaw contributed analysis tools; M. Emmerson, M. Hudgens, A. Barnes, R. Kipp, E. Hiller and R. Siegel wrote and reviewed the paper.

Conflicts of Interest

The authors declare no conflict of interest. The founding sponsors had no role in the design of the study; in the collection, analyses, or interpretation of data; in the writing of the manuscript, and in the decision to publish the results.

References

  1. Ng, M.; Fleming, T.; Robinson, M.; Thomson, B.; Graetz, N.; Margono, C.; Mullany, E.C.; Biryukov, S.; Abbafati, C.; Abera, S.F.; et al. Global, regional, and national prevalence of overweight and obesity in children and adults during 1980–2013: A systematic analysis for the Global Burden of Disease Study 2013. Lancet 2014, 384, 766–781. [Google Scholar] [CrossRef]
  2. Ogden, C.L.; Carroll, M.D.; Kit, B.K.; Flegal, K.M. Prevalence of childhood and adult obesity in the United States, 2011–2012. JAMA 2014, 311, 806–814. [Google Scholar] [CrossRef] [PubMed]
  3. Finkelstein, D.M.; Hill, E.L.; Whitaker, R.C. School food environments and policies in US public schools. Pediatrics 2008, 122, e251–e259. [Google Scholar] [CrossRef] [PubMed]
  4. Zheng, M.; Rangan, A.; Allman-Farinelli, M.; Rohde, J.F.; Olsen, N.J.; Heitmann, B.L. Replacing sugary drinks with milk is inversely associated with weight gain among young obesity-predisposed children. Br. J. Nutr. 2015, 114, 1448–1455. [Google Scholar] [CrossRef] [PubMed]
  5. Hutchins, E. Flavored Milk and the National School Lunch Program. Available online: http://uknowledge.uky.edu/cph_etds/23 (accessed on 11 October 2016).
  6. French, S.A.; Stables, G. Environmental Interventions to Promote Vegetable and Fruit Consumption Among Youth in School Settings. Prev. Med. 2003, 37, 593–610. [Google Scholar] [CrossRef] [PubMed]
  7. Hanks, A.S.; Just, D.R.; Smith, L.E.; Wansink, B. Healthy convenience: Nudging students toward healthier choices in the lunchroom. J. Pub. Health 2012, 34, 370–376. [Google Scholar] [CrossRef] [PubMed]
  8. Privitera, G.J.; Taylor, E.P.; Misenheimer, M.; Paque, R. The effectiveness of “emolabeling” to promote healthy food choices in children preschool through 5th grade. Int. J. Child. Health Nutr. 2014, 3, 48–54. [Google Scholar] [CrossRef]
  9. Cawley, J.; Price, J.A. A case study of a workplace wellness program that offers financial incentives for weight loss. J. Health Econ. 2013, 32, 794–803. [Google Scholar] [CrossRef] [PubMed]
  10. Volpp, K.G.; Troxel, A.B.; Pauly, M.V.; Glick, H.A.; Puig, A.; Asch, D.A.; Galvin, R.; Zhu, J.; Wan, F.; DeGuzman, J.; Corbett, E. A randomized, controlled trial of financial incentives for smoking cessation. N. Engl. J. Med. 2009, 360, 699–709. [Google Scholar] [CrossRef] [PubMed]
  11. Baicker, K.; Cutler, D.; Song, Z. Workplace wellness programs can generate savings. Health Aff. (Millwood) 2010, 29, 304–311. [Google Scholar] [CrossRef] [PubMed]
  12. Brownell, K.; Horgen, K. Food Fight: The Inside Story of the Food Industry, America’s Obesity Crisis, and What We Can Do About It; Contemporary Books: Chicago, IL, USA, 2004. [Google Scholar]
  13. Hobin, E.P.; Hammond, D.G.; Daniel, S.; Hanning, R.; Manske, S.R. The Happy Meal® effect: The impact of toy premiums on healthy eating among children in Ontario, Canada. Can. J. Public Health 2012, 103, e244–e248. [Google Scholar] [PubMed]
  14. Just, D.R.; Price, J. Using incentives to encourage healthy eating in children. J. Human Resour. 2013, 48, 855–872. [Google Scholar] [CrossRef]
  15. List, J.A.; Samek, A.S. The behavioralist as nutritionist: Leveraging behavioral economics to improve child food choice and consumption. J. Health Econ. 2015, 39, 135–146. [Google Scholar] [CrossRef] [PubMed]
  16. List, J.A.; Samek, A. A field experiment on the impact of incentives on milk choice in the lunchroom. Public Finan. Rev. 2015, 45, 44–67. [Google Scholar] [CrossRef]
  17. Siegel, R.M.; Anneken, A.; Duffy, C.; Simmons, K.; Hudgens, M.; Lockhart, M.K.; Shelly, J. Emoticon use increases plain milk and vegetable purchase in a school cafeteria without adversely affecting total milk purchase. Clin. Ther. 2015, 37, 1938–1943. [Google Scholar] [CrossRef] [PubMed]
  18. Siegel, R.M.; Hudgens, H.; Annekin, A.; Simmons, K.; Shelly, J.; Bell, I.; Kotagal, U.R. A Two-Tiered School Cafeteria Intervention of Emoticons and Small Prizes Increased Healthful Food Selection. IJFANS. 2016, 5. Available online: http://www.ijfans.com/ijfansadmin/upload/ijfans_5784ca415b87a.pdf (accessed on 12 October 2016).
  19. Barnes, A.S.; Hudgens, M.E.; Ellsworth, S.C.; Lockhart, M.K.; Shelley, J.; Siegel, R.M. Emoticons and Small Prizes to Improve Food Selection in an Elementary School Cafeteria: A 15 Month Experience. J. Pediatr. Child Nutr. 2016, 2, 100108. [Google Scholar]
  20. Hudgens, M.; Barnes, A.; Lockhart, M.K.; Ellsworth, S.; Beckford, M.; Siegel, R. Small Prizes Improve Food Selection in a School Cafeteria without Increasing Waste. Clin. Pediatr. 2016. [Google Scholar] [CrossRef] [PubMed]
  21. Siegel, R.; Lockhart, M.K.; Barnes, A.S.; Hiller, E.; Kipp, R.; Robison, D.L.; Ellsworth, S.C.; Hudgens, M.E. Small prizes increased healthful school lunch selection in a Midwestern school district. Appl. Physiol. Nutr. Metab. 2014, 41, 370–374. [Google Scholar] [CrossRef] [PubMed]
  22. Norwood City School District. Available online: http://public-schools.startclass.com/d/d/Norwood-City-%28District%29 (accessed on 16 February 2017).
  23. Ellery, J. The nutritional importance of milk and milk products in the national diet. Int. J. Dairy Tech. 1978, 31, 179–181. [Google Scholar] [CrossRef]
  24. Fayet-Moore, F. Effect of flavored milk vs plain milk on total milk intake and nutrient provision in children. Nutr. Rev. 2016, 74, 1–7. [Google Scholar] [CrossRef] [PubMed]
  25. Quann, E.E.; Adams, D. Impact on milk consumption and nutrient intakes from eliminating flavored milk in elementary schools. Nutr. Today 2013, 48, 127–134. [Google Scholar] [CrossRef]
  26. Hanks, A.S.; Just, D.R.; Wansink, B. Chocolate milk consequences: A pilot study evaluating the consequences of banning chocolate milk in school cafeterias. PLoS ONE 2014, 9, e91022. [Google Scholar] [CrossRef] [PubMed]
  27. Birch, L.L.; Birch, D.; Marlin, D.W.; Kramer, L. Effects of Instrumental Eating on Children's Food Preferences. Appetite 1982, 3, 125–134. [Google Scholar] [CrossRef]
  28. Birch, L.L.; Marlin, D.W.; Rotter, J. Eating as the “means” activity in a contingency: Effects on young children's food preference. Child Dev. 1984, 55, 431–439. [Google Scholar] [CrossRef]
Figure 1. Emoticon example and students wearing “kick off bracelets” by a Power Plate (PP): (a) Plain Milk Emoticon; (b) Students wearing bracelets by PP.
Beverages 03 00014 g001
Figure 2. Shows daily PP purchases at the individual school during the first academic year. Each point represents a single day. A “zig-zag” effect is noted with increased PP selection on prize days. The Sharpsburg School which had a change in cafeteria staff experienced the sharpest decline in PP selection towards the end of the school year.
Beverages 03 00014 g002
Table 1. Demographics of schools participating in intervention.
SchoolEnrollment%Black%White%Hispanic%Girls%Boys%Low income *
Norwood View40912.768.713.9485270.4
Sharpsburg Elementary26012.771.28.8445672.7
Williams Avenue29112.475.36.5485275.9
All Schools Combined 96012.671.310.2475372.7
Source: [22]. * Less than 130% of poverty level.
Table 2. Summary of Food Items selected by Norwood elementary students comparing pre-incentive rate and after initiating incentives. Z-tests were performed to determine significance between purchase rate before and during the intervention.
Food ItemRate Selected Per Student Pre-Incentives n = 13,506 lunches95% Confidence IntervalRate Selected Per Student with Incentives n = 145,090 lunches95% Confidence Intervalp Value Comparing Pre to with Incentives
Power Plate *0.05220.05-0.060.1940.19-0.20<0.0000001
Plain milk *0.09840.09-0.110.2550.25-0.26<0.0000001
Chocolate milk *0.8180.80-0.840.7000.70-0.71<0.0000001
Total (Chocolate + Plain) milk *0.9160.90-0.940.9560.95-0.960.000331
Vegetables *1.2991.27-1.321.4161.41-1.42<0.0000001
Fruits *0.6670.65-0.690.7900.79-0.80<0.0000001
* Experienced desirable, significant change comparing pre-intervention to intervention (p < 0.05).

