Article

Quality Markers of Functional Tomato Juice with Added Apple Phenolic Antioxidants

by
Laura Massini
1,*,
Daniel Rico
2,
Ana Belen Martín-Diana
2 and
Catherine Barry-Ryan
1
1
School of Food Science and Environmental Health, Dublin Institute of Technology, Dublin 1, Ireland
2
Agricultural Technological Institute of Castilla and Leon, Government of Castilla and Leon, Finca Zamadueñas, Valladolid 47071, Spain
*
Author to whom correspondence should be addressed.
Beverages 2016, 2(1), 4; https://doi.org/10.3390/beverages2010004
Submission received: 8 October 2015 / Revised: 18 January 2016 / Accepted: 20 January 2016 / Published: 2 February 2016

Abstract

:
Using natural antioxidants instead of synthetic additives for food stabilisation is at the forefront of research in food formulation. Matrix interactions and stability studies of the incorporated foods are necessary prior to further processing. In this study, apple peel phenolics were added to a commercial bottled tomato juice. The juice was opened and then stored in the presence of air in the headspace at 4 °C for four days to assess its physical-chemical stability (pH, turbidity, colour and total phenolic content) and nutritional content (ascorbic acid and total carotenoids); it was also stored at 4 °C for 10 days for the microbiological analysis. The antimicrobial capacity of the phenolic extracts was tested against a range of food borne pathogens and spoilage microorganisms. Results showed that apple peel phenolics could form complexes with colloidal pectins thus increasing the turbidity, even though this effect was not significant during the four-day storage; the colour of the enriched juice was brighter with enhanced yellowness due to added pigments such as flavonol glycosides. The presence of other natural antioxidants (ascorbic acid and carotenoids) in tomato juice was not affected by the addition of peel phenolics. Ascorbic acid was partially reduced during storage in all the juice samples; however, the presence of the added peel phenolics whose amount remained constant over time significantly contributed to a higher radical scavenging capacity compared to the control. The microbiological spoilage of the opened tomato juice was also delayed by two to three days in the presence of apple peel phenolics compared to the control. The antimicrobial capacity was due to a bacteriostatic effect of the phenolic extracts mostly against the growth of yeasts; the antimicrobial capacity was related to the acidity of phenolic acids and the presence of apple flavonoids such as flavan-3-ols.

1. Introduction

Apple waste lines have been widely investigated for the recovery of functional ingredients and nutraceuticals [1,2,3]. The combined presence of dietary fibre and phenolics in the apple fruit has multiple beneficial effects on the human body [4]. The recovery of phenolics from cooking apple varieties, such as cv. Bramley’s Seedling which is grown in the British Isles, was previously reported [5]; the peels are normally discarded from processing lines for non-valuable applications, such as land fertilising or as cattle feed. The recovery of plant waste-derived ingredients (i.e., botanicals, herbs and their essential oils) is regarded as an opportunity for the development of functional foods and dietary supplements [6]; botanicals were also added to foods and beverages in order to enhance taste or colour, especially herbs and spices (and their essential oils). Products already marketed with added botanicals and with a “healthy” image include smoothies, functional drinks, and yoghurts with green tea, grape seed, lemon balm, and Aloe Vera; these products are used mostly for well-being purposes, or for energy performance [7]. Over the last few years, the market of natural antioxidants has grown significantly compared to that of synthetic additives [8]. This trend is the result of a novel approach to food stabilisation with the use of additives recovered from natural sources instead of synthetic ones for the protection of essential fatty acids such as n-3 PUFAs (polyunsaturated) [9]; this approach is welcomed by final consumers who seek healthy foods that are also nutritious, tasty, and can remain as natural as possible [10]; the trend towards “naturalness” for food additives and preservatives also reflects the usage restrictions based on health grounds of synthetic food additives, in particular antioxidants such as butylated hydroxyanisole (BHA), butylated hydroxytoluene (BHT), and tert-butylhydroquinone (TBHQ), and preservatives such as sulphites [7,11,12]. As a consequence, food research and development is nowadays focused on the understanding of the underlying chemistry of the oxidation and biochemistry of natural plant substances in complex food matrices, and the development of more powerful and targeted, naturally derived additives [13].
The application of botanicals in beverages rather than in bulk oils or oil-in-water emulsions represents a growing market [14]. Functional beverages and smoothies, especially from vegetables which have low calories and with added fibre, are products with a healthy image that primarily quench thirst but also provide health benefits [15]. The present study investigates the quality and microbiological stability of a commercial tomato juice added with apple peel-waste derived phenolics. It aims at studying the addition effect of the natural antioxidants in the presence of other nutritional constituents (carotenoids, ascorbic acid) and the physico-chemical environment (pH, turbidity, colour) under storage conditions at refrigerated temperatures and in the presence of air in the headspace after four and ten days from opening the juice.

2. Experimental Section

2.1. Experimental Design
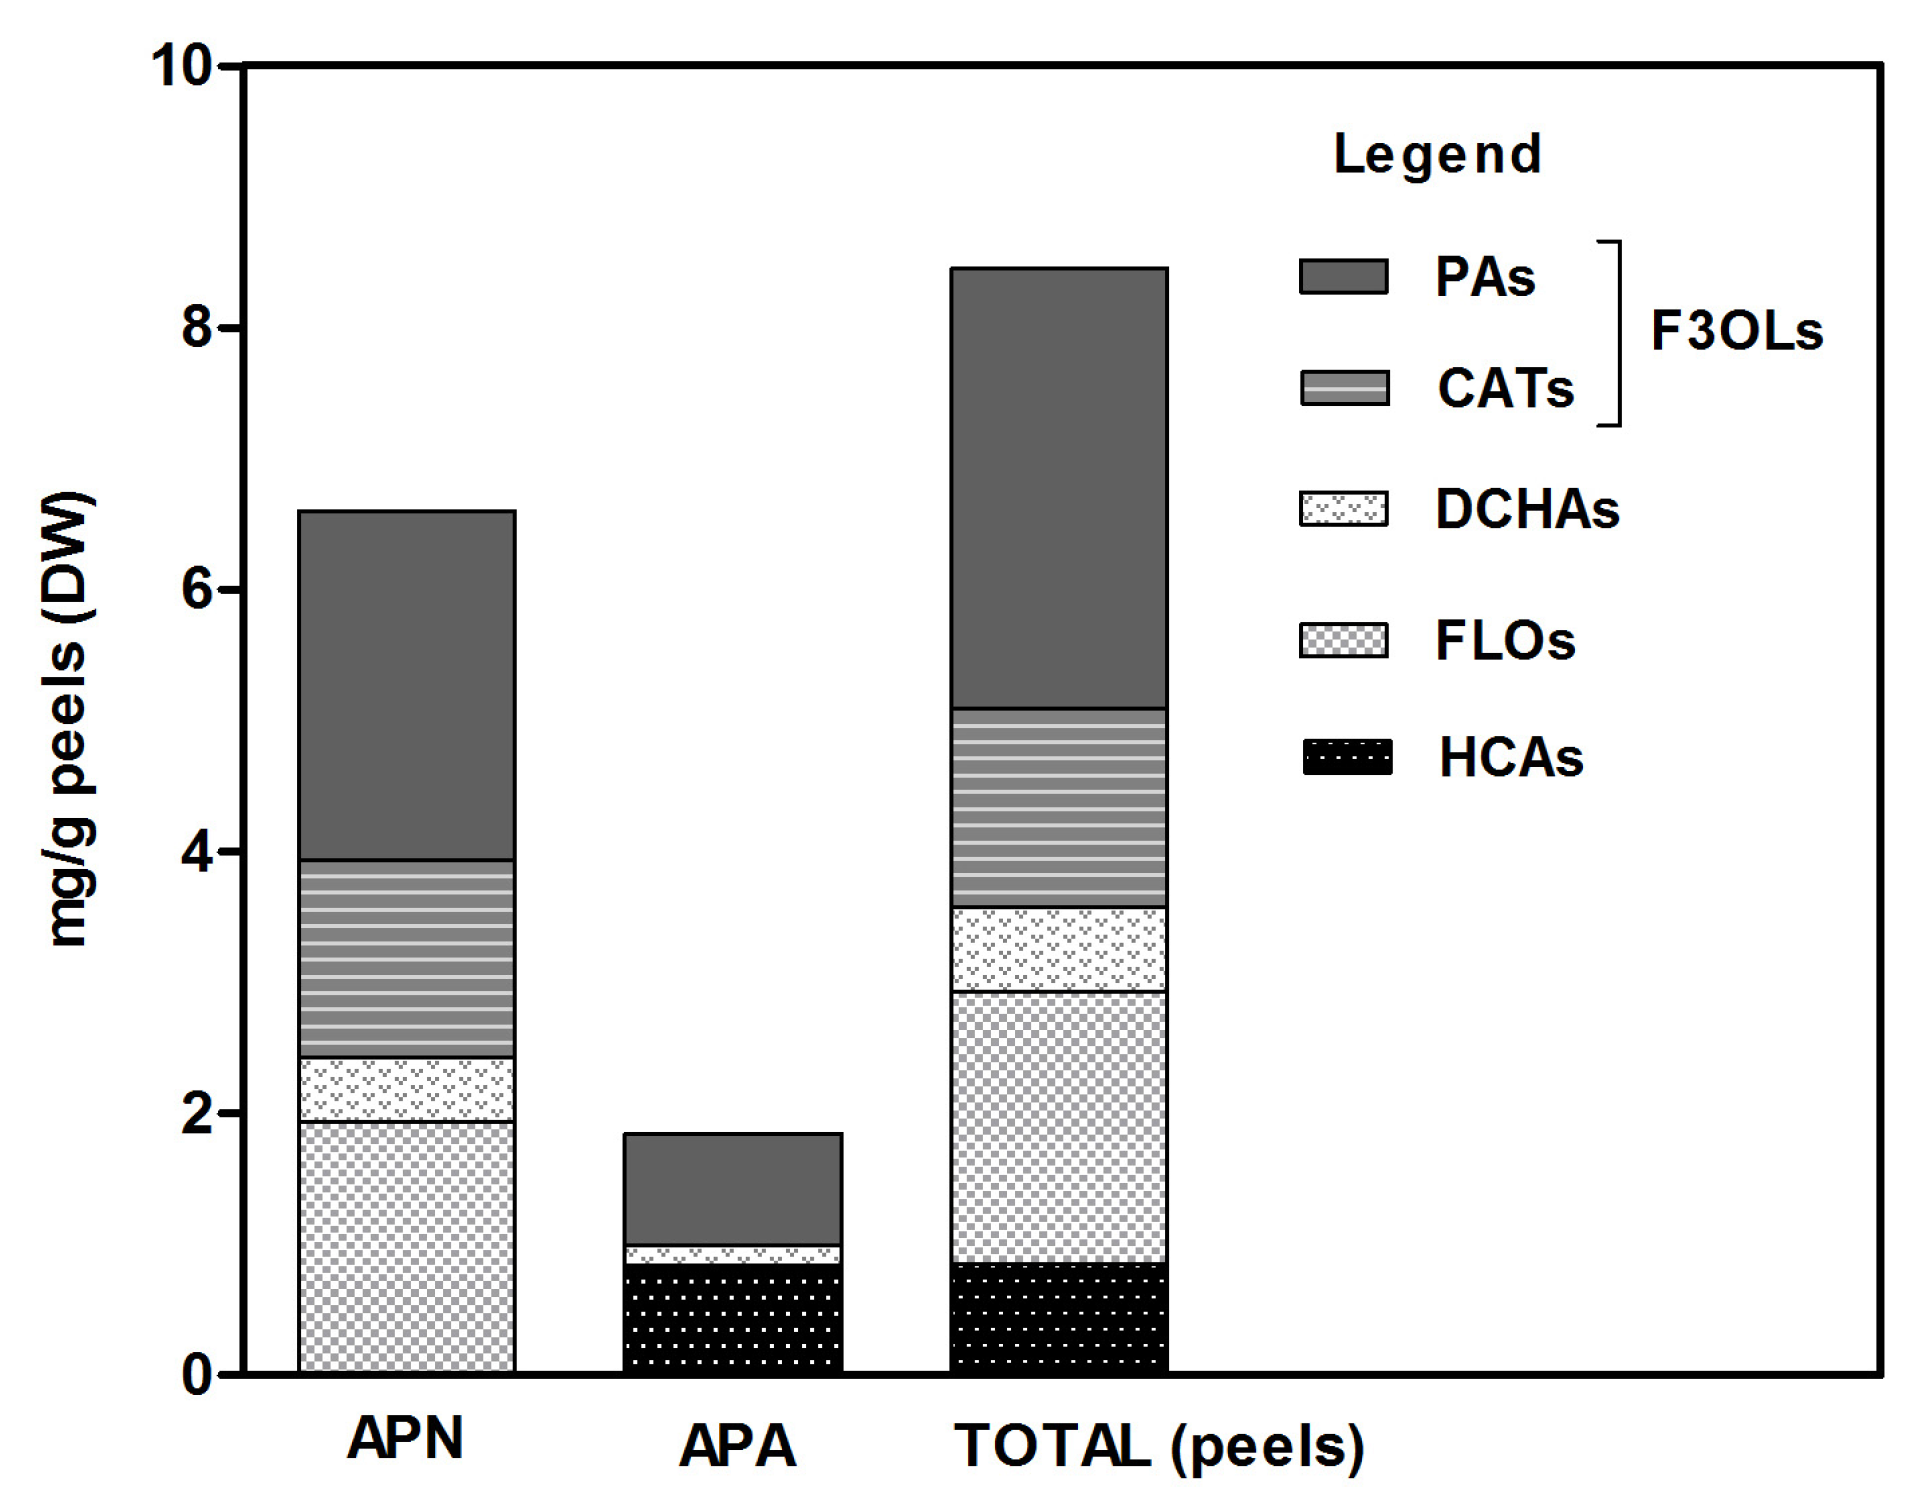
A commercially sterile tomato juice was used as the food model to test the effect of added peel phenolic antioxidants during a post-opening storage study. The use of bottled tomato juice ensured that the food matrix was standardised across the replicated experiments; the experiment was duplicated using two independent batches of samples. The bottles of tomato juice (Biona Organic, Kingston upon Thames, UK) were purchased in 2010 from a health shop/grocery store (The Organic Supermarket, Dublin, Ireland); according to the label information, the juice was organic certified and free from added preservatives. The juice was opened, an aliquot was taken and added with 10% of apple peel phenolics (i.e., final concentration: 200 mg GAE/L or gallic acid equivalents, as total phenolics) and then kept in capped glass jars in the presence of air in the headspace at 4 °C for 4 days; a control with distilled water instead of sample was also prepared and kept under the same storage conditions. The physical-chemical analysis of the enriched tomato juice and control was tested at time 0 (before storage) and after 4 days from opening. The storage time was selected based on the label indications of the juice manufacturer which recommended the consumption of the tomato juice within 4 days from opening at temperatures equal to or below 5 °C. In order to assess the preservative capacity of the phenolic extracts, the microbiological quality of the tomato juice was also evaluated. The microbial load of the samples was tested every 3–4 days over a 10-day storage period under the same post-opening storage conditions detailed above. The microbial load detected in the control after 4 days from opening was used as the threshold of acceptability for the microbial quality of the tomato juice according to the labeling information supplied by the manufacturer.

2.2. Apple Peels

Peel samples were obtained from apples (Malus domestica Borkh.) cv. Bramley’s Seedling that were purchased from a local store (Dublin, Ireland) in 2009–2010; the apples were stored at 4 °C in polyethylene bags until further processing. From each batch of apples (between 3 and 5 kg), three independent samples were prepared by randomly pooling fruits from different trays. After the fruits were washed under tap water, the peels were removed manually with a hand peeler and dried using stainless steel trays at 60 ± 2 °C in a convection oven with forced air ventilation (BS Oven 250, Weiss Gallenkamp, Loughborough, UK) until a constant weight was achieved. The dried peels were pulverised using a coffee grinder and the powders stored in glass jars at −20 °C until further analysis.

2.3. Extraction of Phenolic Compounds

Apple peel phenolics were solubilised from dried apple peels using a solvent extraction method using 80% aqueous ethanol (v/v). Crude extracts were obtained through homogenisation of the peel powder with the chilled solvent followed by filtration as previously described [16]. The filtrates were pooled and the organic solvent was removed at 40 °C in a rotary evaporator (Büchi Labortechnik, Flawil, Switzerland) until a final concentration of 10%–20% (v/v). Crude extracts were washed by partitioning twice with petroleum ether (1:1); the organic layers were discarded, while the aqueous phase was retained and extracted three times with ethyl acetate at pH 7.0. This fractionation based on acidity was required to isolate phenolics such as flavonoids and the obtained extract was referred to as APN. The pH of the aqueous phase was then shifted to pH 2.0 and extracted with ethyl acetate three times in order to isolate phenolic acids, as previously reported [17]. The acidic extract was referred to as APA. The extracts were pooled and the organic solvent was evaporated off under vacuum. The residues were dissolved in distilled water or LC methanol for the HPLC analysis. The aqueous extracts of peel flavonoids were finally filtered using a 0.20 μm PES (Polyether Sulfone) membrane disc filters (Sarstedt, Nümbrecht, Germany) and kept at −20 °C in the dark until further analysis. The amount of extracted phenolics in APN and APA was measured as total phenolics and expressed as mg GAE/L or gallic acid equivalents using Folin-Ciocalteu assay as previously reported [16].

2.4. Determination of Phenolic Content

The identification and quantification of phenolic compounds was carried out with a RP-HPLC-PDA method previously described, with minor modifications [18]. The phenolic extract in LC methanol was filtered through 0.45 µm PTFE membrane disc filter (Acrodisc, Pall, Portsmouth, UK) and then a volume of 0.02 mL was injected into e2695 Separation Module (Waters Alliance, Dublin, Ireland). The HPLC system was equipped with a quaternary solvent system pump, an inline vacuum degasser, a photodiode array detector (PDA 2998). Empower 2 Chromatographic Software was used to acquire and analyse the chromatograms and UV-Vis spectra (Waters Alliance, Ireland). The analysis was carried out on Nucleosil C18 column (250 × 4.6 mm I.D., 5 µm packing) (Varian, JVA Analytical, Dublin, Ireland) at a controlled temperature of 25.0 °C ± 0.2 and at a flow rate of 0.9 mL/min. The gradient consisted of a mixture of 0.33 mol/L acetic acid in water (solvent A) and 0.083 mol/L acetic acid in water:acetonitrile (50:50) (solvent B); it was increased linearly from 10% to 55% B in 45 min; from 55% to 57% B in 5 min; from 57% to 70% B in 10 min; from 70% to 100% B in 5 min; and from 100% to 10% in 1 min. The elution of target groups of phenolics was simultaneously monitored at 280 nm (flavan-3-ols; dihydrochalcones and derivatives); 320 nm (hydroxycinnamic acid and derivatives), and 370 nm (flavonols and flavonol glycosides). The identification of phenolic components was carried out through comparison of their retention times with commercial standards; the latter were of compatible purity for LC analysis and included: (+)-catechin; phloretin-2′-O-glucoside (phloridzin); quercetin; quercetin-3-O-rutinoside (rutin); gallic acid; caffeic acid; p-coumaric acid; 5′-caffeoylquinic acid (chlorogenic acid) (Sigma-Aldrich, Ireland). Procyanidin B2; (−)-epicatechin; quercetin-3-O-galactoside (hyperoside); and quercetin-3-O-glucoside (isoquercitrin) were from Extrasynthèse (Cedex, France). Provisional identification of unknown compounds for which commercial standards were not available was carried out based on the comparison of their UV-Vis spectral characteristics with known standards using the matching angle software of the Empower 2 chemical station (Waters Alliance, Ireland). The quantification study was carried out with calibration curves of standard phenolic compounds (20–200 mg/L): (+)-catechin for flavan-3-ols (280 nm); quercetin for flavonols and flavonol glycosides (370 nm); phloridzin for dihydrochalcones and derivatives (280 nm); chlorogenic acid for hydroxycinnamic acids and derivatives (320 nm).

2.5. Physical-Chemical Analysis

The quality of the enriched tomato and control juices in the post-opening storage was analysed with various markers of physical-chemical stability and antioxidant capacity.

2.5.1. pH

The pH was measured with a pH-meter (Orion-2 Star, Thermoscientific, Essex, UK) that was calibrated daily with standard buffered solutions at pH 4 and pH 7.

2.5.2. Turbidity

The turbidity was measured with a turbidimeter (2100Qis, Hach-Lange, Dublin, Ireland); the juices (1 mL) were diluted up to 25 mL with de-aerated distilled water in order to adjust their readings within the measuring range of the instrument (between 0 and 1000 FNU, Formazin Nephelometric Unit). The instrument was calibrated with a set of primary standards (20–1000 FNU) using StablCal® Stabilised Standards (Hach-Lange, Dublin, Ireland) on a 5-point scale. The turbidity was expressed as FNU. The measurements were repeated in triplicate.

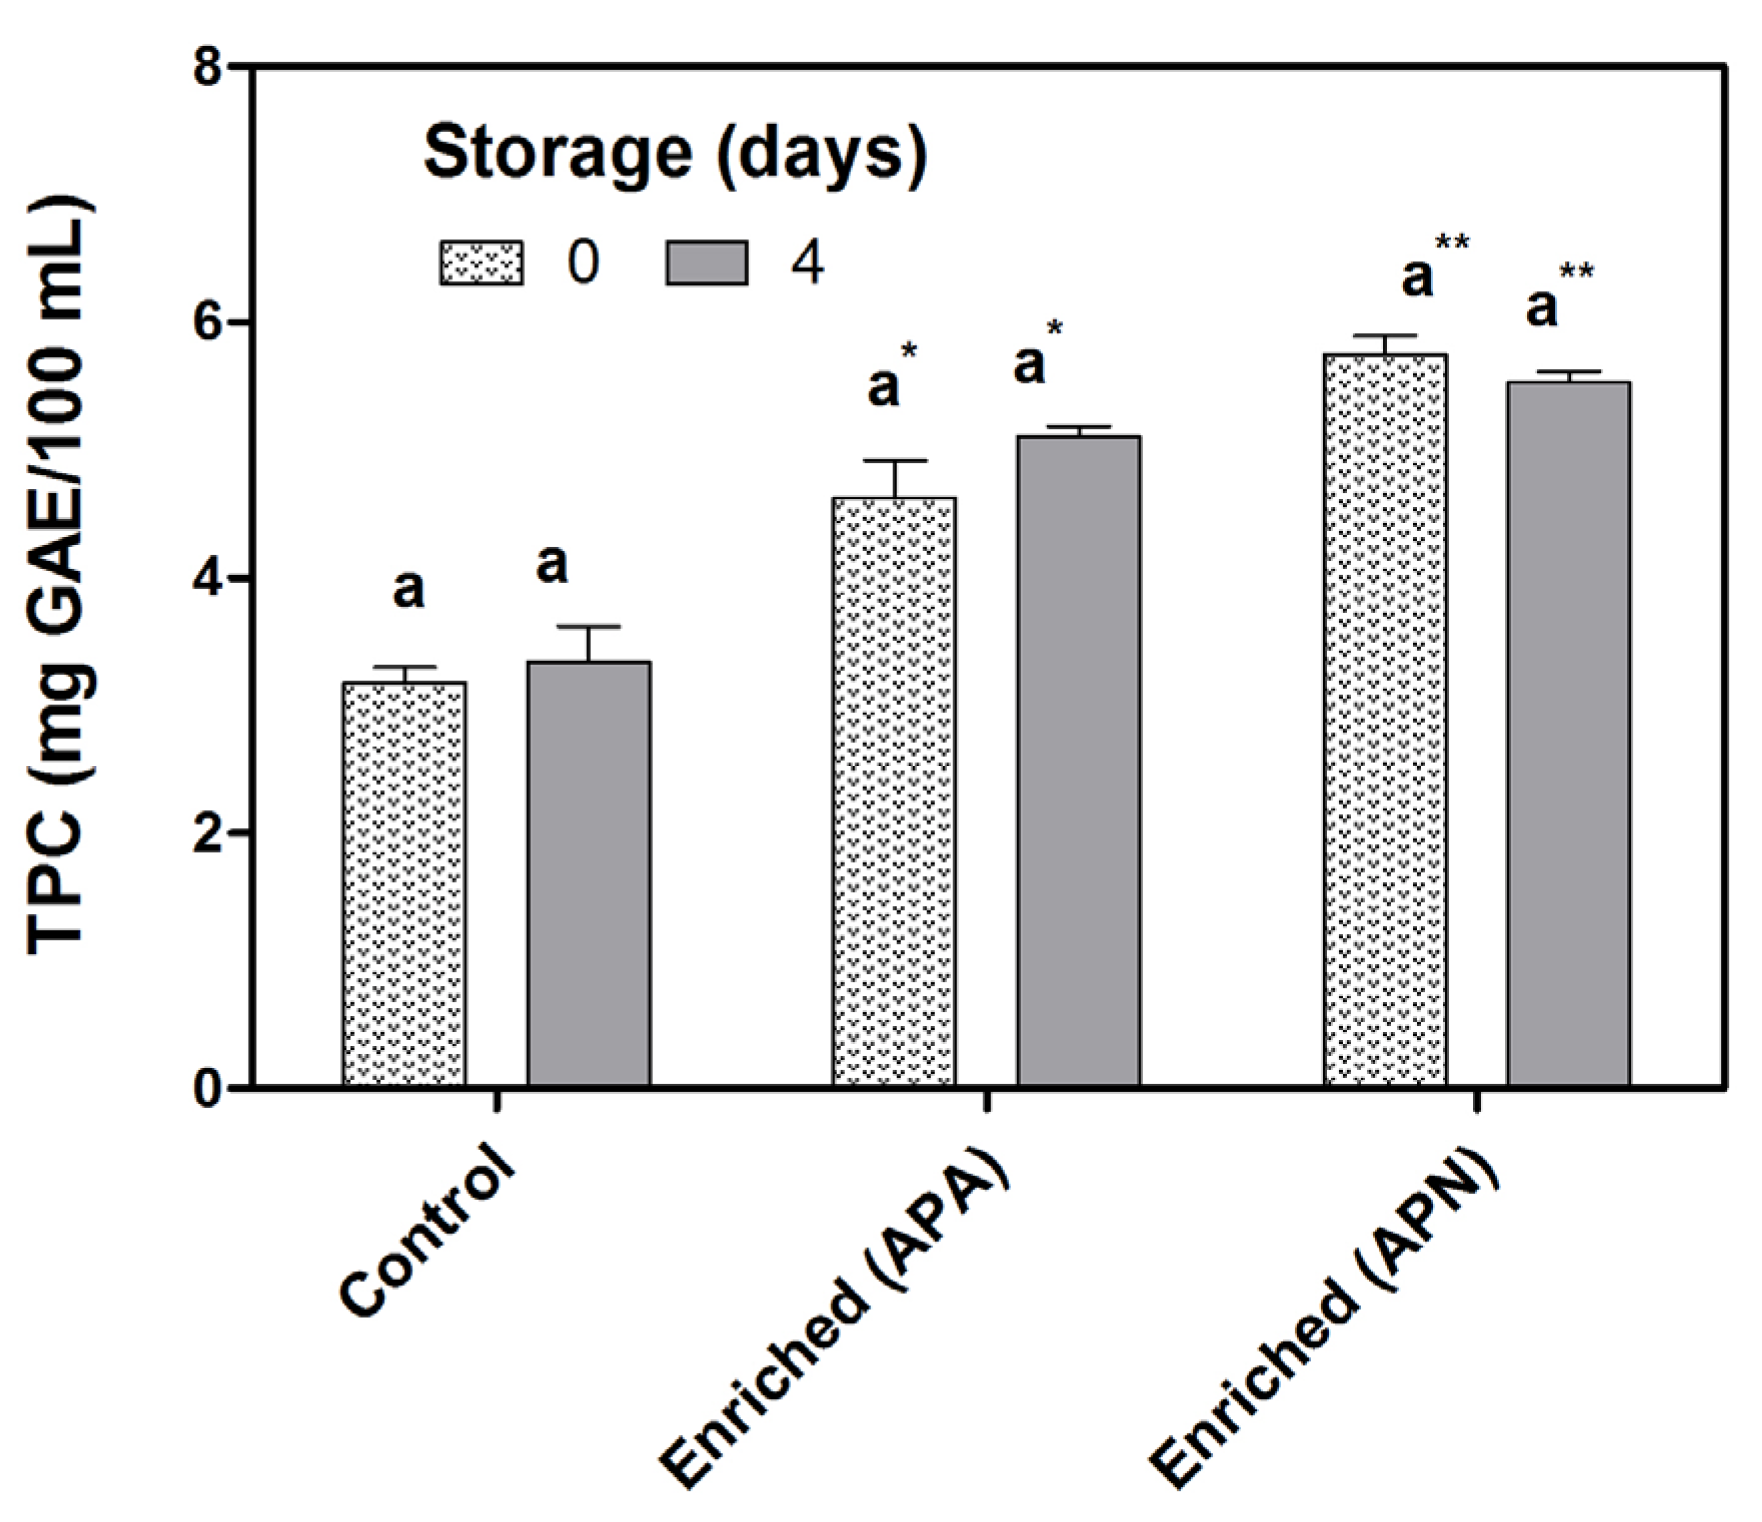
2.5.3. Total Phenolic Content

The total phenolic content (TPC) of enriched and control tomato juices was assessed before and after 4-day storage using Folin-Ciocalteu assay as previously described [16]. The TPC was expressed as mg GAE/100 mL juice. The measurements were carried out in triplicate.

2.5.4. Colour

A colorimeter (ColorFlex 45/0, Hunter Lab, Reston, VA, USA) was used for the analysis of the colour of the tomato juices. The instrument was calibrated with black and white tiles before use. A glass cell with a white ceramic lid on the top was used for holding the samples (20 mL). The colour of the samples was measured in reflectance mode, using the CIELAB* coordinate system (light source: D65; 10° observer). The colour difference between the enriched sample and the control was also calculated as:
Δ E * = Δ L * 2 + Δ a * 2 + Δ b * 2
where:
Δ L * = ( L * sample L * control )
Δ a * = ( a * sample a * control )
Δ b * = ( b * sample b * control )
The level of saturation indicated by the Chroma value was calculated as:
Chroma = a * 2 + b * 2

2.5.5. Ascorbic Acid Content

The extraction and analysis of ascorbic acid was carried out with a HPLC chromatographic technique as previously reported, with some modifications [19]. The juice (2 mL) was mixed with 1 mL of chilled extractant solution (3% metaphosphoric acid, w/v), homogenised for 1 min (in ice and darkness) at 9500–13,500 min−1 (Ultra-Turrax T25, IKA-Werke, Staufen, Germany) and then centrifuged at refrigerated temperatures for 15 min. The extraction was repeated in duplicate. The samples were filtered through 0.20 μm PES membrane disc filters (Sarstedt, Nümbrecht, Germany). The ascorbic acid content was analysed using an e2695 Separation Module (Waters Alliance, Dublin, Ireland). The HPLC system consisted of an auto sampler, a column heater, a quaternary solvent system pump, an inline vacuum degasser, a photodiode array detector (PDA 2998), and was equipped with Empower 2 Chromatographic Software (Waters Alliance, Ireland). The organic acids were separated on a hydrophilic C18 stationary phase (YMC-Pack ODS-AQ column, 5 μm particle size, 250 × 4.6 mm I.D.) (Apex Scientific, Maynooth, Ireland). The injection volume of the sample was 0.02 mL, the solvent system consisted of 50 mmol/L phosphate buffer (pH 2.8); the separation was carried out in isocratic mode (flow rate: 1 mL/min) for 15 min at 25 °C. The ascorbic acid content was quantified at λ = 245 nm by comparison with a calibration curve with standard l-ascorbic acid; the content was expressed as mg AA/100 mL juice. The measurements were carried out in duplicate.

2.5.6. Total Carotenoid Content

Carotenoids were extracted from the juices as previously reported, with minor modifications [20]. Samples were finally quantified as total carotenoids with a spectrophotometric method [21]. A volume of 0.3 mL of juice was added with 0.3 mL of distilled water and 0.6 mL of extractant solution (acetone/methanol, 70:30) by shaking for 10 min in an ice box (Gyrotory Shaker G-2, Mason Technology, Ireland), and then centrifuged at 8000 rpm for 10 min. The supernatant was recovered, and the pellet was mixed with 0.5 mL of extractant solution, then sonicated (Clifton Ultrasonic Bath, Nickel-Electro, UK) at 30–40 kHz for other 5 min and centrifuged again until discolouration. The supernatants were pooled and partitioned with petroleum ether (1:1) at least two times by adding saturated sodium chloride. The organic layers were collected, pooled and then weighed. An aliquot (1 mL) was evaporated in a rotary evaporator under vacuum. The remaining solids were resuspended in the same volume of acetone and their absorbance measured in a spectrophotometer at λ = 450 nm. The measurements were repeated in triplicate. The amount of total carotenoids (TCAR) was calculated according to [21]:
TCAR  ( mg / 100  mL juice ) = Abs 450 135310 × MW × df × 10 2   ( d = 1  cm )
where: MW, average molar mass for total carotenoids (548 g/mol); df, dilution factor, it includes the volume adjustments for extracting, drying and reconstituting the sample in acetone; d, optical path.

2.6. Antioxidant Capacity Equivalent to Ascorbic Acid (AEAC)

The antioxidant capacity equivalent to ascorbic acid (AEAC) of enriched and control juices was assessed as a sum of their hydrophilic (water-soluble) and lipophilic (fat-soluble) antioxidant components [22].
Preparation of hydrophilic antioxidants: For the extraction of the hydrophilic antioxidants, the juice (0.5 mL) was shaken in ice for 10 min, and after that, it was centrifuged at 10,000 rpm for 10 min. The supernatant was collected, and the pellet was re-extracted with 0.25 mL of chilled distilled water and further centrifuged; the protocol was repeated at least three times. The hydrophilic fractions were then pooled, weighed and stored at −20 °C.
Preparation of lipophilic antioxidants: The residual pellet was extracted with 0.25 mL of acetone/methanol (70:30) by sonicating (Clifton Ultrasonic Bath, Nickel-Electro, UK) at 30–40 kHz in ice for 10 min, then shaken for other 10 min, and finally centrifuged. The lipophilic components were recovered as the supernatant. The extraction protocol was repeated until discolouration of the pellet (a minimum of three times). The organic layers were pooled, weighed and stored at −20 °C until analysis.
The final volume of the hydrophilic and lipophilic extracts was determined taking into account the weight and the density of the extracting solvents; this allowed for a comparison between the liquid extracts when assessing their AEAC.

2.6.1. Ferric Reducing Antioxidant Power (FRAP)

The ferric reducing antioxidant power (FRAP) of the enriched and control juices, i.e., hydrophilic and lipophilic components was analysed according to Stratil et al. [23], with modifications as in Massini et al. [16]. The reduction capacity of the juice was measured using a FRAP reagent consisting of a ferric charge-transfer complex with the ligand 2,4,6,-tripyridyl-s-triazine (TPTZ). The FRAP reagent was freshly made by adding 10 mL of 10 mM TPTZ (Sigma-Aldrich, Saint-Louis, MO, USA) in 40 mM HCl and a volume of 10 mL of 20 mM FeCl3·6 H2O in 100 mL of 300 mM acetate buffer (pH 3.6). The reagent was heated in a water bath at 37 °C for 5 min before being transferred (0.9 mL) into tubes containing 0.1 mL of extract. The tubes were left at 37 °C for 40 min; the absorbance was measured in a spectrophotometer (Spectronic 1201, Milton Roy, Ivyland, PA, USA) at 593 nm. The reduction of the ligand through electron-transfer mechanism by the antioxidants was indicated by the increase in absorbance at 593 nm. The FRAP value was calculated from a calibration curve of l-ascorbic acid standard solutions (1–50 mg/L) and the AEAC was expressed as mg AAE/100 mL of juice. Distilled water or acetone/methanol (70:30) were used for the reference blank depending on the type of extract, i.e., hydrophilic or lipophilic, respectively. All measurements were carried out in triplicate.

2.6.2. Radical Scavenging Capacity (DPPH)

The radical scavenging capacity of the enriched and control juices, i.e., hydrophilic and lipophilic components was measured against the synthetic radical DPPH∙ as previously reported [24] with minor modifications as in Massini et al. [16]. The decrease in absorbance of a 0.9 mL of a DPPH∙ solution (0.08 mmol/L in 96% ethanol, v/v) added with 0.1 mL of diluted extracts and let run for at least 30 min was read at 515 nm in a spectrophotometer (Spectronic 1201, Milton Roy) and compared to that of a control solution of DPPH∙ prepared with 0.1 mL of distilled water or acetone/methanol (70:30) depending on the type of extract, i.e., hydrophilic or lipophilic, respectively.
The % Reduced DPPH∙ was calculated as:
% Reduced DPPH∙ = [(Abscontrol − Abssample)/Abscontrol] × 100
where: Abs, absorbance at 515 nm.

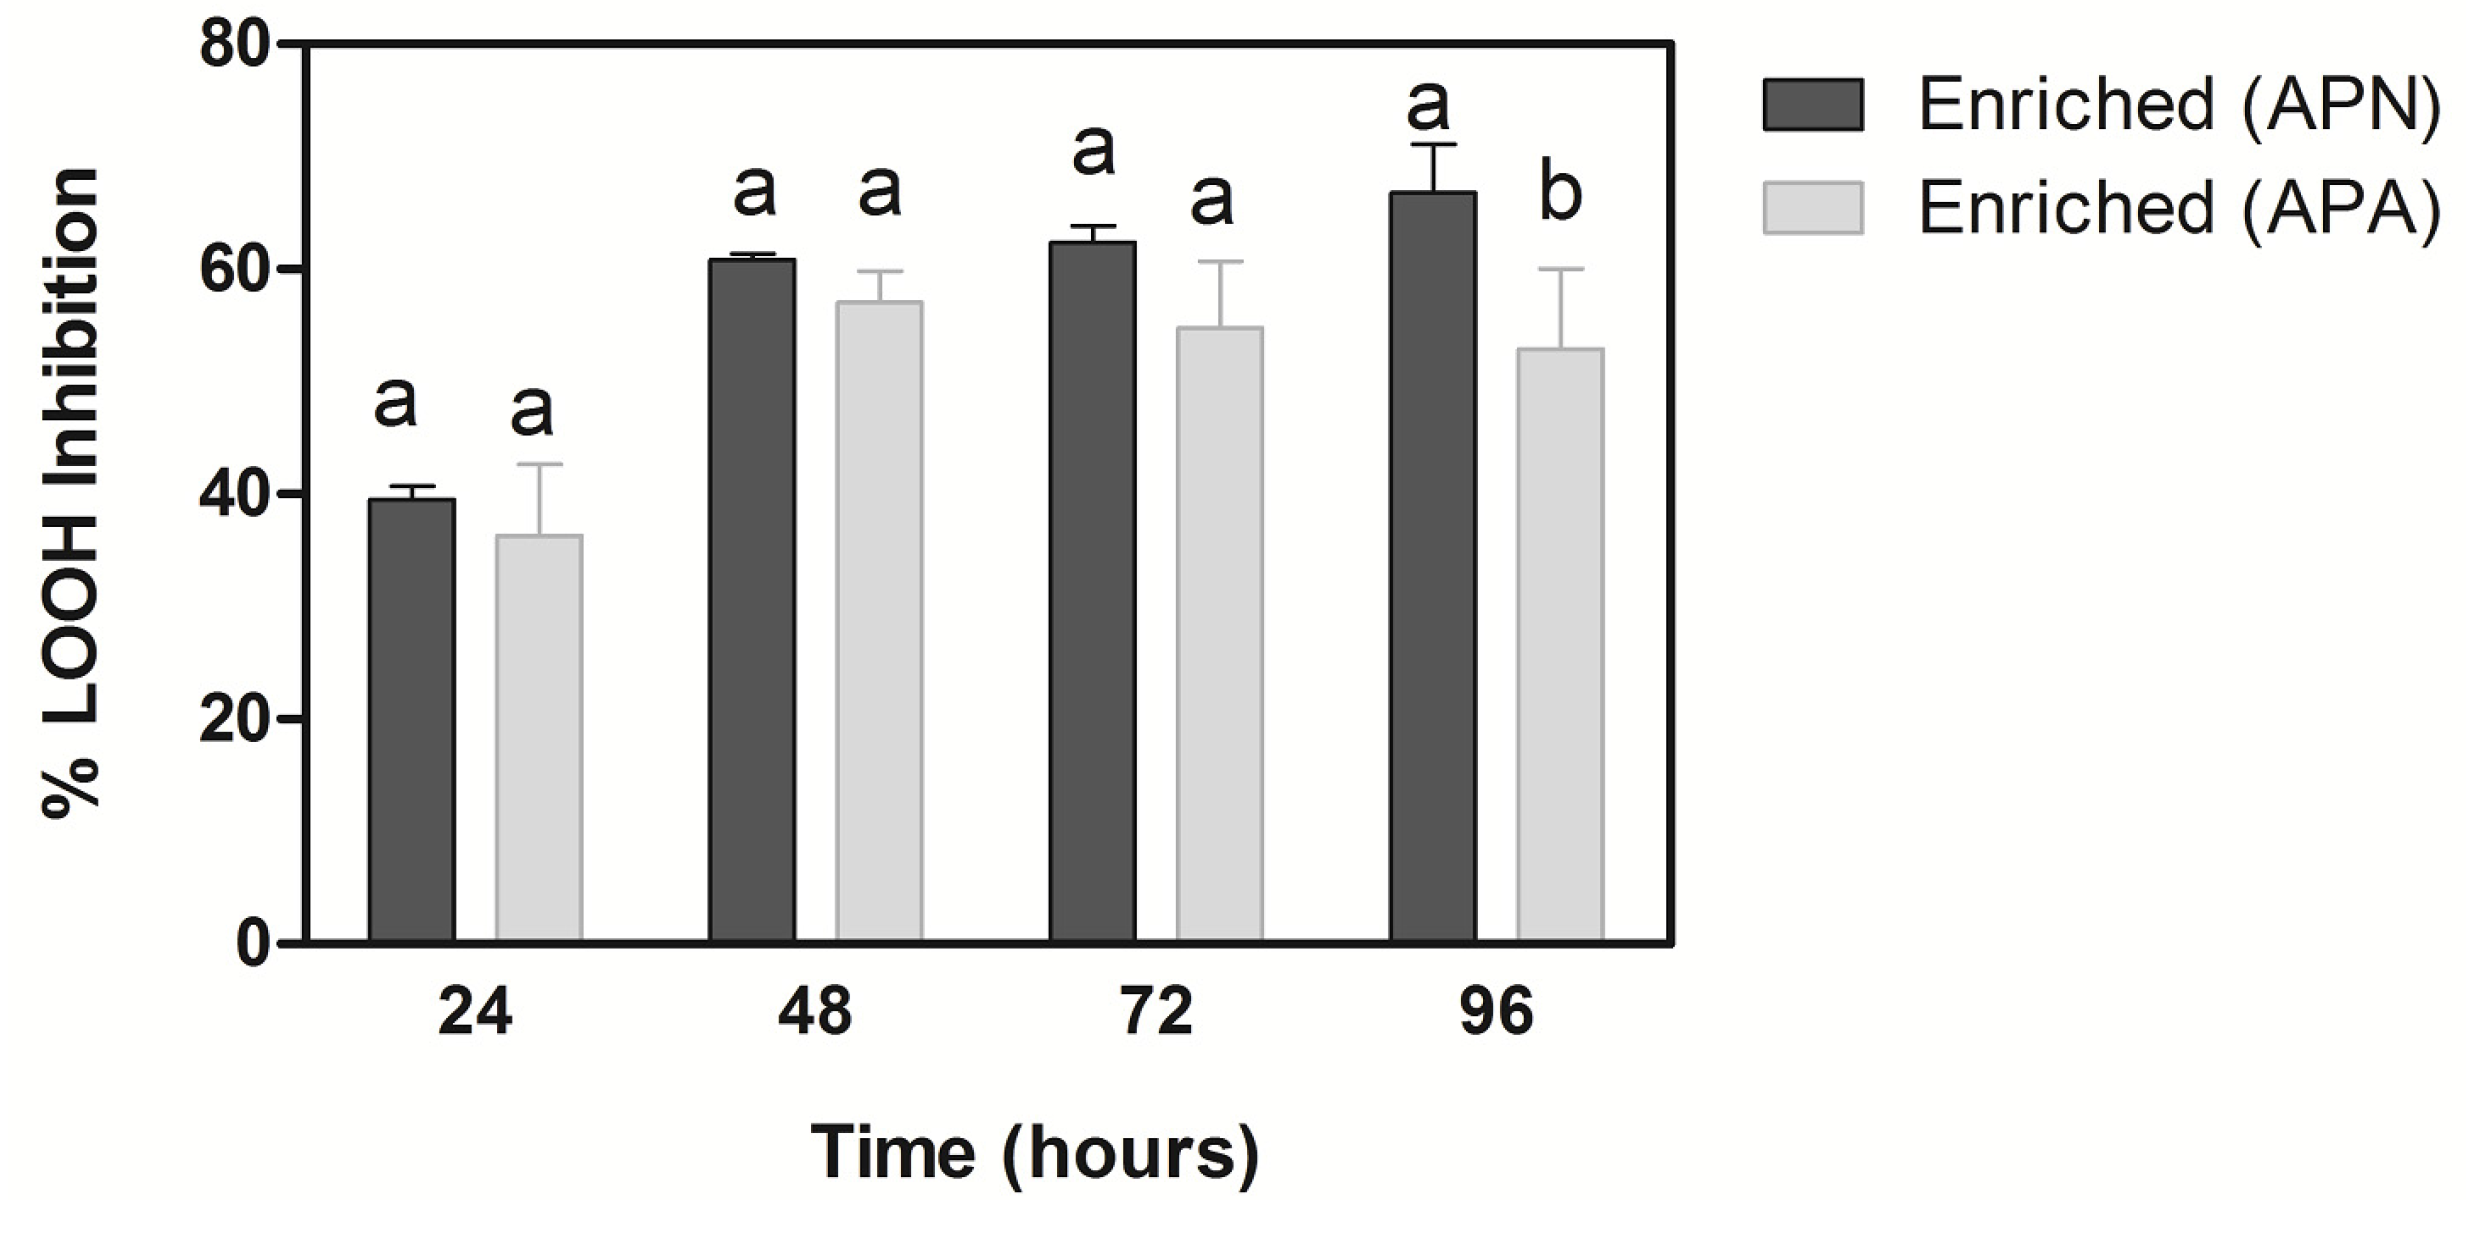
2.6.3. Lipid Peroxidation Test

The antioxidant capacity of raw enriched tomato juices at a concentration of 800 mg GAE/L was tested against the effects of lipid peroxidation in a model emulsified lipid using ethyl linoleate under accelerated oxidative conditions which were obtained with an oven test at 55 °C for 4 days. The production of hydroperoxides was conducted in the presence of a synthetic radical initiator (AAPH) (Sigma-Aldrich, Saint-Louis, MO, USA) and the level of accumulation in the emulsions was measured with ferric ammonium thiocyanate (FTC) assay and monitored until a maximum oxidation was achieved in the control reaction mixture [22].
The emulsified lipid was prepared with 0.25 mL of 2.5% linoleic acid in absolute ethanol, 1 mL of 50 mmol/L sodium phosphate buffer at pH 7, 0.25 mL ethanol, 0.425 mL of ultrapure deareated water, and 0.025 mL of AAPH (1.8 mM) [22]. To this mixture, 0.05 mL of raw juices enriched with phenolic extracts or distilled water (control) were added. The emulsions were placed in screw-capped Wheaton tubes, vortexed and incubated in an oven (BS Oven 250, Weiss Gallenkamp, Loughborough, UK) at 55 °C. Aliquots of 0.100 mL of these mixtures were assayed after 2 h (t0), and then every 24 h; they were added to 1 mL of deareated ultrapure water with 0.050 mL of 3.86 mol/L ammonium thiocyanate. Afterwards, 0.050 mL of 20 mmol/L ferrous chloride was added, and the absorbance of the mixtures was read after 20 min at 500 nm in a spectrophotometer. The measurements were carried out in triplicate.
The accumulation of hydroperoxides in the samples and control was calculated as Oxidative Index (OI) at each i-th interval with Equation (8) [25]; the OI values were calculated as a ratio with the assumption that Abst0 was equal to 1:
OIi-th = Absi-th/Abst0
The % Inhibition against hydroperoxides was calculated as:
%  Inhibition  = ( OI control OI sample OI control ) × 100

2.7. Microbiological Analysis

2.7.1. Microbial Load

The microbial load of the enriched tomato and control juices was assessed before (t0) and throughout storage, at 4, 7, and 10 days after opening. The samples were serially diluted (1:10) with sterile buffered peptone water (Biokar diagnostics, Beauvais, France) and then 0.1 mL of sterile solution was spread plated on Plate Count Agar (PCA) solid medium (Scharlau Chemie, Barcelona, Spain) for the determination of the total viable count (TVC) (incubation: 30 °C for 2 days) [26]. At the end of storage, the samples were assessed for their yeasts and moulds counts, using Potato Dextrose Agar (PDA) solid medium (Scharlau Chemie, Barcelona, Spain). For each serial dilution, a minimum of two plates were assayed. The experiment was duplicated. The average number of colony forming units per mL of juice (CFU/mL) was calculated using the first two consecutive serial dilutions with the number of colonies between 30 and 300 [27].

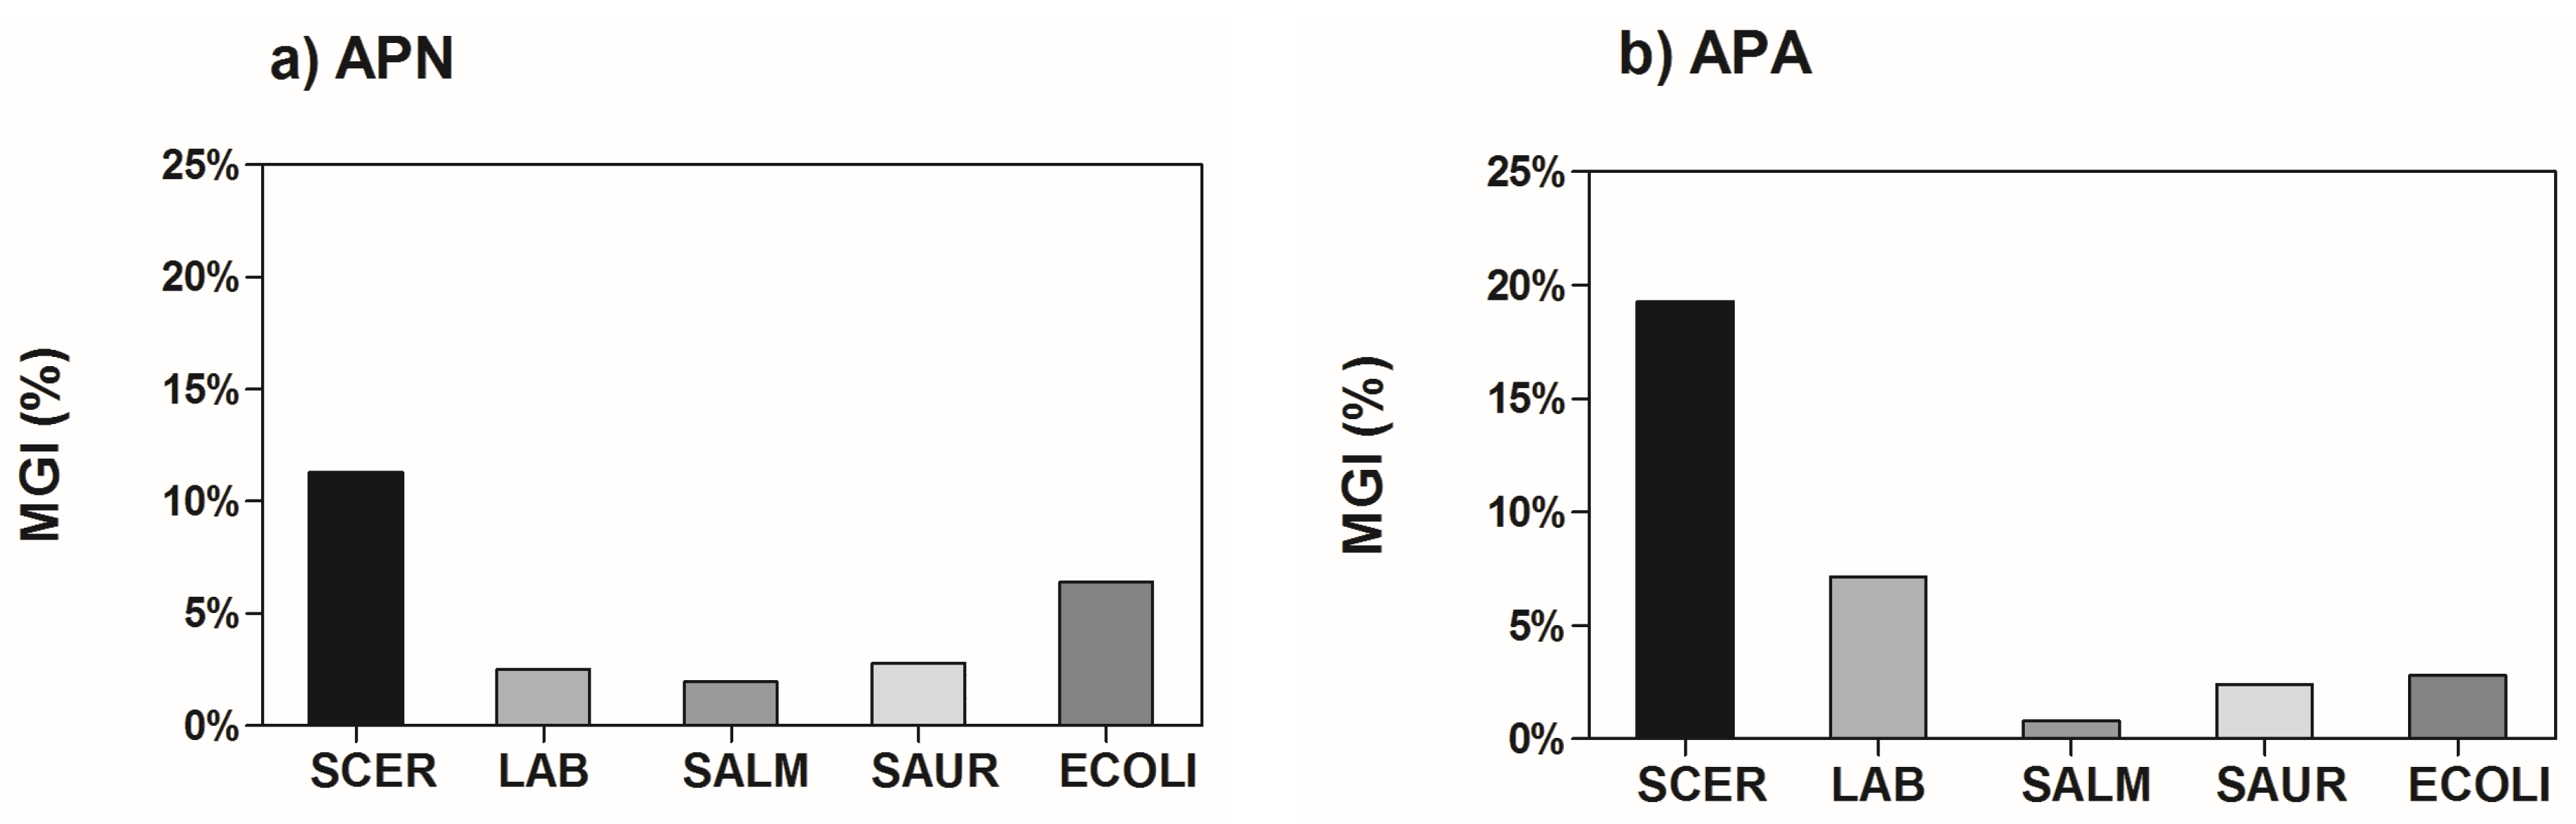
2.7.2. Antimicrobial Capacity

The antimicrobial capacity of phenolic extracts from apple peels was assessed against common food-borne pathogens and spoilage microorganisms using a microtitre plate-based assay. A list of bacterial and yeast strains used in the present work is shown in Table 1.
Table 1. List of strains of tested microorganisms.
StrainReference
Bacteria
Gram-positive
Lactobacillus plantarumATCC 8014
Staphylococcus aureusATCC 25923
Gram-negative
Escherichia coliATCC 25922
Salmonella typhimuriumATCC 14028
Yeast
Saccharomices cerevisiaeATCC 9763
Stock cultures were from Oxoid Ltd. (Basingstoke, UK), and were maintained in tryptic soy broth (TSB, Sharlau Chemie, Barcelona, Spain), or in potato dextrose broth (PDB) for S. cerevisiae, and were stored on Protect Cryobeads at −80 °C; stock cultures of L. plantarum (Kwik-stik Duo, Microbiologics, supplied by Medical Supply Co., Dublin, Ireland) were maintained in De Man, Rogosa and Sharpe broth (MRS, Scharlau Chemie, Barcelona, Spain) and similarly stored. Cultures were grown by subculturing a loopful of stock culture into 9 mL of medium and incubating at 37 °C for 18–24 h. They were maintained on tryptic soy agar (TSA), MRS agar or potato dextrose agar (PDA) plates at 4 °C and were discarded after sub-culturing for 2 weeks. Working cultures were prepared by inoculating a loop of pure culture into a suitable broth, and then incubating at the optimum temperature for each strain for 18–24 h. Microorganism suspensions were prepared in API ampoules with 0.85% (w/w) saline solutions (BioMérieux, Craponne, France); their turbidity was adjusted to 0.5 MacFarland standard units using a Densimat photometer (BioMérieux, Craponne, France). After that, the suspensions were diluted 1:100 in sterile TSB, MRS broth or PDB to obtain inocula with approximate concentrations of 106 CFU/mL (bacteria) or 104 CFU/mL (yeast).
Test solutions of phenolic extracts were serially diluted (1:2) with TSB, MRS or PD broths into a flat bottomed, sterile, polystyrene 96-well microtitre plate (Sarstedt, Nümbrecht, Germany) until a final concentration of 200 mg/L (final volume: 0.1 mL); their pH was between 6 and 6.5. The test solutions were mixed with the microorganism suspensions (1:1) and the plates were covered with a lid. The microbial growth was monitored using a microtitre plate reader (Powerwave, Biotek, Potton, UK, equipped with Gen5 software) by measuring the turbidity (O.D.) at 600 nm every hour, for 24 h, during an incubation at 37 °C. For each plate, positive controls with the inocula and the growth media were prepared and assayed. For the blank subtraction, the growth media were added to sterile distilled water instead of sample; sample blanks were also prepared by using the broths with test compounds. Sterile antibiotic solutions of streptomycin and ampicillin (Sigma-Aldrich, Saint-Louis, MO, USA) at concentration of 0.5% (w/v) were used for the negative control. The experiments were repeated in duplicate. The antimicrobial capacity of the phenolic extracts was measured as % Microbial Growth Inhibition (MGI) at the end of the incubation time by comparison with the control [28,29]:
%  MGI  = [ ( O . D . t 24 O . D . t 0 ) control ( O . D . t 24 O . D . t 0 ) sample ( O . D . t 24 O . D . t 0 ) control ] × 100
where: t0, before incubation; t24, after 24 h incubation; O.D., optical density at 600 nm.

2.8. Statistical Analysis

The variability of the physical-chemical analysis of tomato samples and control at different storage times (before and after 4-day storage), was subjected to the analysis of ANOVA using Statgraphics Centurion XV (Statpoint, Warrenton, VA, USA). The statistical difference was taken at p < 0.05 and Least-Significant Difference (LSD) was used as the post hoc test for the comparison of the mean values.

3. Results and Discussion

3.1. Composition of Apple Peel Phenolics

The neutral phenolics (APN) comprised mostly of flavan-3-ols including catechins and dimers, but also proanthocyanidins, followed by flavonol glycosides and dihydrochalcone derivatives including phloridzin and another phloretin derivative (Figure 1). The acidic phenolics (APA) mostly comprised of hydroxycinnamic acids derivatives, mainly of caffeic acid such as 5′-caffeoyilquinic acid or chlorogenic acid which is typically of the apple fruit [30], followed by dihydrochalcone derivatives and to a lesser extent procyanidins, e.g., trimers/tetramers that were not completely extracted at pH 7.
Figure 1. Phenolic composition of neutral (APN) and acidic (APA) phenolic extracts from apple peels. CATs, catechins; PAs, proanthocyanidins (oligomers, up to four units); F3OLs, flavan-3-ols; DCHAs, dihydrochalcone derivatives; FLOs, flavonol glycosides; HCAs, hydroxycinnamic acids and derivatives.
Beverages 02 00004 g001

3.2. Quality Markers

The physical-chemical analysis of enriched tomato juice compared to control before and after four-day storage is shown in Table 2. The effect of storage time was significant on the reduction of colour saturation (chroma values) and a* values in all juice samples, and this was attributed to the degradation of lycopene as a result of its instability in the presence of air in the headspace [31]. There was a colour difference measured as ΔE between enriched and control samples. A significantly increased luminosity was observed for the enriched juices compared to control (p < 0.05) with APN > APA; this was possibly due to the presence of natural phenolics with protein binding capacity such as proanthocyanidins, which can lead to binding of colloids, thus giving a brighter colour [32].
The b* values slightly increased after storage but such increase was significant (p < 0.05) only for APN and this was explained as due to the abundance of yellow pigments such as flavonol glycosides in the phenolic extract. There was no difference in terms of b* values between control and enriched samples because natural flavonoid pigments present in tomato juice also comprise of yellow flavonols [33] which are absorbed in the same UV-Vis region as those from apple peels. The levels of turbidity of the enriched juices compared to control were not significantly different (p > 0.05), however, a slightly increased turbidity was observed for the juice with added neutral phenolics (APN). The turbidity of juices is associated with the light scattering of the pectins surrounding the fragments of cell walls (pulp) in a colloidal serum of macromolecules, e.g., proteins, sugars, organic acids [34]. The presence of phenolic compounds, especially procyanidins with higher molecular weight such as trimers or tetramers, can lead to the formation of insoluble complexes with proteins and carbohydrates of the cell walls [35]. However, this phenomenon could take some time before becoming evident which means the turbidity is a quality marker to be monitored during storage of tomato juice added with mixtures of procyanidins. The addition of acidic phenolics to the juices significantly lowered the pH in comparison to the control; as it was expected, the same effect was not observed with the mixture of neutral phenolics. The pH of all samples increased after storage; this was possibly due to the reduction of ascorbic acid (Section 3.3) and the onset of microbial spoilage.

3.3. Ascorbic Acid and Total Carotenoids

There was no significant difference between the ascorbic acid content of the enriched tomato juices compared to control (Table 3) during the four-day storage. However, it was observed over time and in all the samples that the content of ascorbic acid reduced significantly during storage. It is known that ascorbic acid is particularly sensitive to the presence of oxygen, thus it degrades quickly. Moreover, in the presence of air in the headspace once the sterility is broken, ascorbic acid can also be degraded as a result of the growth of the resident microflora. Under less critical storage conditions and after being pasteurised, a bottled tomato juice stored for 28 days at 4 °C was reported to lose almost 50% of its original ascorbic acid content [31].The ascorbic acid content measured in tomato juice was in agreement with previous literature data [31,36]. The amount of total carotenoids in the juices (control and enriched) was not affected by the storage time (p > 0.05); the enriched samples and the control had similar contents. The amount of total carotenoids in the samples was similar to previous results by Podsędek et al. [36] who found the content of total carotenoids to be between 4.57 and 8.69 mg/100 g of tomato juice.
Table 2. Quality markers of tomato juice with added phenolic extracts compared to control before (t0) and after storage (t4).
Juice sampleTime (Days)pHTurbidity (FNU)Colour
L *a *b *Chroma∆E
Control04.10 ± 0.01 B232.87 ± 4.06 A26.77 ± 0.13 A31.04 ± 0.18 A30.36 ± 0.30 A43.79 ± 0.09 A-
44.19 ± 0.01 A242.08 ± 3.87 A26.52 ± 0.02 A30.51 ± 0.08 B30.89 ± 0.06 A43.03 ± 0.16 B-
Enriched (APA)04.07 ± 0.01 B268.76 ± 25.96 A26.95 ± 0.00 A31.02 ± 0.02 A30.37 ± 0.08 A43.92 ± 0.09 A0.28 ± 0.07 A
44.14 ± 0.01 A255.65 ± 30.70 A26.85 ± 0.05 A30.28 ± 0.04 B31.08 ± 0.14 A42.89 ± 0.09 B0.44 ± 0.12 A
Enriched (APN)04.10 ± 0.01 B256.28 ± 29.79 A27.29 ± 0.01 A30.88 ± 0.01 A30.41 ± 0.07 B44.01 ± 0.08 A0.74 ± 0.12 A
44.18 ± 0.01 A250.44 ± 17.95 A27.19 ± 0.01 A30.19 ± 0.06 B31.36 ± 0.11 A42.85 ± 0.06 B0.79 ± 0.06 A
Mean
Control 4.14 a237.48 a26.64 c30.77 a30.62 a43.39 a-
Enriched (APA) 4.10 b240.13 a26.90 b30.65 a,b30.73a43.40 a0.34 b
Enriched (APN) 4.14 a253.36 a27.24 a30.53 b30.88 a43.42 a0.76 a
F-test ***NS****NSNS*
LSD0.05 0.01-0.250.13--0.22
Storage time***NSNS*******NS
Storage time × SampleNSNSNSNSNSNSNS
*, **, ***, significant (p < 0.05), highly significant (p < 0.01), very highly significant (p < 0.001); NS: non-significant (p > 0.05). Values are expressed as mean ± SD (n = 4). Different capital letters within the same type of juice indicate significant difference between storage times; different small case letters indicate significant differences between juice samples. FNU, formazin nephelometric units.
Table 3. Antioxidant components (AA; TCAR) and total antioxidant capacity (AEAC) of tomato juice compared to control before (t0) and after storage (t4).
Juice sampleTime (Days)AA (mg/100 mL)TCAR (mg/100 mL)AEAC (mg AAE/100 mL Juice)
FRAPRadical Scavenging Capacity (DPPH)
Control05.97 ± 0.03 A5.72 ± 1.31 A47.70 ± 0.42 A34.31 ± 1.09 A
44.47 ± 0.01 B4.56 ± 0.80 A39.00 ± 0.24 B30.18 ± 0.36 B
Enriched (APA)06.06 ± 0.08 A5.21 ± 0.08 A56.15 ± 3.61 A34.85 ± 0.46 A
44.62 ± 0.04 B4.67 ± 0.17 A47.71 ± 0.46 A36.19 ± 0.24 A
Enriched (APN)05.83 ± 0.02 A5.61 ± 0.51 A86.20 ± 3.54 A48.03 ± 0.25 A
44.70 ± 0.01 B5.29 ± 0.45 A65.23 ± 1.78 B47.25 ± 0.49 A
Mean
Control 5.22 a5.12 a43.33 c32.24 c
Enriched (APA) 5.27 a5.14 a51.93 b35.52 b
Enriched (APN) 5.34 a5.62 a75.69 a47.64 a
F-testNSNS******
LSD0.05 --6.612.38
Storage time ***NS****
Storage time × SampleNSNSNS*
*, **, ***, significant (p < 0.05), highly significant (p < 0.01), very highly significant (p < 0.001); NS: non-significant (p > 0.05) Values are expressed as mean ± SD (n = 4). Different capital letters within the same type of juice indicate significant difference between storage times; different small case letters indicate significant differences between juice samples. AA, ascorbic acid content; TCAR, total carotenoids; AEAC, ascorbic acid equivalent antioxidant capacity.

3.4. Antioxidant Capacity

Despite the presence of peel phenolic components with medium-to-high polarity and condensed tannins with medium-to-low polarity, the enriched antioxidant mixtures did not add to the preservation of other hydrophilic (ascorbic acid) or lipophilic (carotenoids) components of tomato juice. However, it was observed that the total antioxidant capacity equivalent to ascorbic acid (AEAC) measured with FRAP and DPPH assays was significantly higher (p < 0.05) for the enriched tomato juices compared to the control. During storage, the antioxidant capacity of the control tomato juice decreased significantly (p < 0.05); such decrease was not significant in the presence of added phenolic extracts; the highest antioxidant capacity was achieved in the sample of tomato juice with added apple peel flavonoids, mostly because of the presence of catechins and dimers and flavonol glycosides with established radical scavenging capacity. The redox potential measured as FRAP depended on the type of phenolic extract added to the juices (APN > APA), and was possibly influenced by the presence of other reducing substances, in particular ascorbic acid. From these findings, it was suggested that the decrease of antioxidant capacity in the enriched and control tomato juices was mainly attributed to the reduction of ascorbic acid during the storage as a result of the presence of air in the headspace of the bottles, the beginning of microbial growth, increase of pH, etc. [36]. Unlike ascorbic acid, the content of the polyphenols including those from apple and those naturally present in the tomato juices remained stable during storage (Figure 2).
As a consequence, it was suggested that the maintenance of the antioxidant capacity, in particular radical scavenging capacity, in the enriched juices should be attributed to peel phenolics (Table 3). These findings are supported by previous results which indicate polyphenols as compounds that have higher physical-chemical stability during storage; unlike ascorbic acid, polyphenols can undergo chemical transformations while maintaining their antioxidant capacity [31,37,38]. The present findings did not suggest any interaction between the added apple polyphenols and some of the other antioxidant components in the juice (ascorbic acid and carotenoids). However, the present study aimed at the identification of quality markers of vegetable juices and was carried out under open-package conditions, thus under short storage time and without further processing of the juice. In literature, synergistic interactions between polyphenols and ascorbic acid were suggested to take place in pasteurised fruit juices in the presence of certain additives [39]; the mechanism was not detailed, even though it was reported that citric acid used as an additive could help stabilise ascorbic acid thanks to its metal chelating capacity [40]. It is known that polyphenols are metal chelators, especially hydroxycinnamic acids with the catechol structure, however, such a chemical property strongly depends on the environmental conditions and type of solvent medium which is influenced by the ionization pattern and pH [41]; it is not understood if phenolic chelators could behave as citric acid in the stabilisation of ascorbic acid. In a study by Yesil-Celiktas et al. [42], the addition of a pine bark extract consisting of catechins and taxifolin to orange juice resulted in a slightly decreased loss of ascorbic acid after six months of storage compared to the control (−10%). However, no statistical significance was reported at the end of the eight-month storage. It has been suggested that lipophilic phenolics such as flavonoids of higher molecular weight or procyanidins could interact with lipophilic components, such as tocopherols or carotenoids [31]. Even though this possibility cannot be excluded, it was not observed in the present study; this was likely due to the fact that carotenoids were quantified as total instead of being characterised as single components, and because of the short storage time. The mechanisms of interactions between polyphenols and carotenoids are still poorly understood; therefore, the research should focus on developing model systems that allow a better understanding of the interactions of single carotenoids with tannins before introducing them to the complexity of the food matrix and its constituents [8].
Figure 2. Total phenolic content of tomato juice with added phenolic extracts (neutral APN; or acidic APA) compared to control at time 0 and after four days of storage. Different letters within the same type of juice indicate significant differences between storage times (p < 0.05). An asterisk indicates a significant difference between the enriched sample (APA) and the control sample at the same storage time; a double asterisk indicates a significant difference between the enriched sample (APN) and the control at the same storage time. TPC, total phenolic content; GAE, gallic acid equivalents.
Beverages 02 00004 g002
The radical scavenging capacity of peel phenolics gave the enriched tomato juice the ability of inhibiting the oxidation of the emulsified model lipid (ethyl linoleate) thus reducing the level of accumulation of hydroperoxides in comparison to the control (Figure 3). The lipid oxidation inhibition increased over time in the emulsions added with enriched juice as a result of the progressive accumulation of lipid hydroperoxides in the control; the maximum oxidation was achieved in the control at 72 h (data not shown). The percentage of lipid oxidations calculated one day after reaching the maximum oxidation in the control were 66.7% ± 4.4% for the juice enriched with APN and 52.9% ± 7.1% for the juice enriched with APA. The presence of proanthocyanidins in both neutral and acidic extracts could explain the similar inhibition effects against the lipid oxidation of the emulsified lipid. Catechins and flavonol glycosides possibly added to the radical scavenging capacity of the neutral extract (APN) compared to the acidic one (APA) thus leading to a better protection at 96 h.
Figure 3. Inhibition of lipid peroxidation over time in a model emulsified lipid with enriched tomato juice added with phenolic extracts. APN, neutral phenolic extract; APA, acidic phenolic extract. Different letters in the same time slot indicate significant differences between extracts.
Beverages 02 00004 g003

3.5. Microbiological Analysis

The microbiological quality of the enriched tomato and control juices was assessed through the evaluation of the total viable counts (TVC) (Figure 4). Results showed that up until day 4, the microbial load of the enriched juices was lower in comparison to the control, with a significant reduction of TVC by 0.5 log (CFU/mL). The addition of peel phenolics extended the threshold of acceptability of the stored juice from 4 to 6/7 days. These results suggested that peel polyphenols could also act as mild preservatives against the growth of aerobic and mesophilic microorganisms in tomato juice. In order to establish the magnitude of such preservation, the storage was extended until day 10. At day 10, the quality of the tomato juice with added phenolic extracts was enhanced in comparison to the control (reduction of 1.1 log CFU/mL).
Most of the mesophilic aerobic microorganisms responsible for the spoilage of the tomato juices at day 10 were enumerated as yeasts and moulds on a selective growth medium at 30 °C (data not shown). Tomato juice had pH equal to or lower than 4.5, therefore, it is considered a high acidity food which is unlikely contaminated by pathogens. In literature, yeasts, lactic acid bacteria and moulds are reported as being the main spoilage microorganisms of vegetable juices with high acidity [43]. The antimicrobial capacity of the phenolic extracts from apple peels was related to their phenolic composition, the presence of phenolic acids as in APA maintained lower pH compared the control, and this could delay the onset of microbial spoilage. However, some bacteria could use phenolic acids as substrates for their metabolism, such as coumaric and chlorogenic acid [44]. The study of the inhibition against microbial growth confirmed the antimicrobial capacity of the apple peel extracts against the test strain of Saccharomices cerevisiae (Figure 5). The presence of flavan-3-ol oligomers in both APN and APA is likely to have an antimicrobial effect.
Figure 4. Total viable counts of tomato juices with added phenolic extracts (neutral, APN; acidic, APA) compared to control during the storage time of 10 days at 4 °C. The acceptability threshold at day 4 is indicated with a dotted line. Different letters indicate significant differences (p < 0.05) between samples. CFU, colony forming unit.
Beverages 02 00004 g004
Figure 5. Microbial growth inhibition (MGI%) of selected foodborne pathogens and food spoilage microorganisms in the presence of apple peel phenolic extracts (APN, neutral phenolics; APA, acidic phenolics) with final concentration of 200 mg GAE/L. SCER, Saccharomices cerevisiae; LAB, Lactobacillus plantarum; SALM, Salmonella typhimurium; SAUR, Staphylococcus aureus; ECOLI, Escherichia coli.
Beverages 02 00004 g005
Catechins and oligomeric flavan-3-ols could supply antimicrobial capacity because of their ability to interact with both lipid and protein components of biological membranes, thus altering their biochemical properties (membrane permeation) [45]. Flavonols and flavan-3-ols with strong membrane affinities could decrease membrane fluidity, thus affecting the functions of membrane enzymes and receptors, and the reaction efficacy of membrane components such as transporter proteins [46]. Both apple peel extracts had a preservative effect up until day 10 by significantly (p < 0.05) reducing the spoilage of tomato juice compared to the control. These findings are promising for the application of peel phenolics as natural additives with antioxidant and/or preservative capacity.

4. Conclusions

The addition of apple peel phenolics to tomato juice provided increased antioxidant protection which resulted in a higher radical scavenging capacity of the enriched juices compared to control with increased protection against lipid peroxidation, thus counterbalancing the loss of ascorbic acid during storage. Lipophilic components such as carotenoids remained constant during the storage time in all samples. The visual appearance of the enriched juices was characterized by an increased luminosity, possibly due to the formation of complexes between proanthocyanidins and colloids such as pectins, and an increased yellowness, due to pigments such as flavonol glycosides. It was also suggested that turbidity could increase in the presence of apple phenolics especially flavonoids, however, a significant effect could take some time to become evident during storage and should therefore be monitored throughout as it could negatively impact the sensorial characteristics of the juice. Finally, the addition of apple peel phenolics enhanced the microbiological quality of the enriched juices compared to control; the bacteriostatic effect was observed for both extracts and was mainly attributed to the antimicrobial capacity against the spoilage due to yeast which was supplied in the presence of phenolics such as oligomeric flavan-3-ols. These findings suggest the recovery of natural apple peel phenolics as novel antioxidants/preservatives for functional applications with vegetable juices.

Author Contributions

All authors have contributed equally to the submitted work.

Conflicts of Interest

The authors declare no conflict of interest.

References

  1. Moure, A.; Cruz, J.M.; Franco, D.; Domínguez, J.M.; Sineiro, J.; Domínguez, H.; José Núñez, M.; Parajó, J.C. Natural antioxidants from residual sources. Food Chem. 2001, 72, 145–171. [Google Scholar] [CrossRef]
  2. O’Shea, N.; Arendt, E.K.; Gallagher, E. Dietary fibre and phytochemical characteristics of fruit and vegetable by-products and their recent applications as novel ingredients in food products. Innov. Food Sci. Emerg. Technol. 2012, 16, 1–10. [Google Scholar] [CrossRef]
  3. Rabetafika, H.N.; Bchir, B.; Blecker, C.; Richel, A. Fractionation of apple by-products as source of new ingredients: Current situation and perspectives. Trends Food Sci. Technol. 2014, 40, 99–114. [Google Scholar] [CrossRef]
  4. Boyer, J.; Liu, R.H. Apple phytochemicals and their health benefits. Nutr. J. 2004, 3, 5. [Google Scholar] [CrossRef] [PubMed] [Green Version]
  5. Massini, L.; Martín Diana, A.B.; Barry-Ryan, C.; Rico, D. Apple (Malus domestica Borkh. cv Bramley’s Seedling) peel waste as a valuable source of natural phenolic antioxidants. In Total Food—Sustainability of the Agri-Food Chain; Waldron, K.W., Moates, G.K., Faulds, C.B., Eds.; RCS: Cambridge, UK, 2010; pp. 90–95. [Google Scholar]
  6. Eussen, S.R.B.M.; Verhagen, H.; Klungel, O.H.; Garssen, J.; van Loveren, H.; van Kranen, H.J.; Rompelberg, C.J.M. Functional foods and dietary supplements: Products at the interface between pharma and nutrition. Eur. J. Pharmacol. 2011, 668, S2–S9. [Google Scholar] [CrossRef] [PubMed]
  7. Berdahl, D.R.; Nahas, R.I.; Barren, J.P. Synthetic and natural antioxidant additives in food stabilization: Current applications and future research. In Oxidation in Foods and Beverages and Antioxidant Applications, Volume 1—Understanding Mechanisms of Oxidation and Antioxidant Activity; Decker, E.A., Elias, R.J., McClements, D.J., Eds.; Woodhead Publishing: Cambridge, UK, 2010; pp. 272–313. [Google Scholar]
  8. Decker, E.A.; Elias, R.J.; McClements, D.J. Oxidation in Foods and Beverages and Antioxidant Applications, Volume 1—Understanding Mechanisms of Oxidation and Antioxidant Activity; Woodhead Publishing: Cambridge, UK, 2010. [Google Scholar]
  9. Medina, I.; González, M.J.; Pazos, M.; Della Medaglia, D.; Sacchi, R.; Gallardo, J.M. Activity of plant extracts for preserving functional food containing n-3-PUFA. Eur. Food Res. Technol. 2003, 217, 301–307. [Google Scholar] [CrossRef]
  10. Bech-Larsen, T.; Scholderer, J. Functional foods in Europe: Consumer research, market experiences and regulatory aspects. Trends Food Sci. Technol. 2007, 18, 231–234. [Google Scholar] [CrossRef]
  11. Balasundram, N.; Sundram, K.; Samman, S. Phenolic compounds in plants and agri-industrial by-products: Antioxidant activity, occurrence, and potential uses. Food Chem. 2006, 99, 191–203. [Google Scholar] [CrossRef]
  12. Lück, E.; Jager, M. Antimicrobial Food Additives: Characteristics, Uses, Effects, 2nd ed.; Springer: Berlin, Germany, 1997. [Google Scholar]
  13. Pokorný, J. Are natural antioxidants better—And safer—Than synthetic antioxidants? Eur. J. Lipid Sci. Technol. 2007, 109, 629–642. [Google Scholar] [CrossRef]
  14. Gruenwald, J. Novel botanical ingredients for beverages. Clin. Dermatol. 2009, 27, 210–216. [Google Scholar] [CrossRef] [PubMed]
  15. Harbourne, N.; Marete, E.; Jacquier, J.C.; O’Riordan, D. Stability of phytochemicals as sources of anti-inflammatory nutraceuticals in beverages: A review. Food Res. Int. 2013, 50, 480–486. [Google Scholar] [CrossRef]
  16. Massini, L.; Rico, D.; Martin-Diana, A.; Barry-Ryan, C. Valorisation of apple peels. Eur. J. Food Res. Rev. 2013, 3, 1–15. [Google Scholar]
  17. Delage, E.; Bohuon, G.; Baron, A.; Drilleau, J.F. High-performance liquid chromatography of the phenolic compounds in the juice of some French cider apple varieties. J. Chromatogr. A 1991, 555, 125–136. [Google Scholar] [CrossRef]
  18. Schieber, A.; Keller, P.; Carle, R. Determination of phenolic acids and flavonoids of apple and pear by high-performance liquid chromatography. J. Chromatogr. A 2001, 910, 265–273. [Google Scholar] [CrossRef]
  19. Hernández, Y.; Lobo, M.G.; González, M. Determination of vitamin C in tropical fruits: A comparative evaluation of methods. Food Chem. 2006, 96, 654–664. [Google Scholar] [CrossRef]
  20. Llorach, R.; Espín, J.C.; Tomás-Barberán, F.A.; Ferreres, F. Artichoke (Cynara scolymus L.) byproducts as a potential source of health-promoting antioxidant phenolics. J. Agric. Food Chem. 2002, 50, 3458–3464. [Google Scholar] [CrossRef] [PubMed]
  21. Biehler, E.; Mayer, F.; Hoffmann, L.; Krause, E.; Bohn, T. Comparison of 3 spectrophotometric methods for carotenoid determination in frequently consumed fruits and vegetables. J. Food Sci. 2010, 75, C55–C61. [Google Scholar] [CrossRef] [PubMed]
  22. Larrosa, M.; Llorach, R.; Espín, J.C.; Tomás-Barberán, F.A. Increase of antioxidant activity of tomato juice upon functionalisation with vegetable byproduct extracts. LWT Food Sci. Technol. 2002, 35, 532–542. [Google Scholar] [CrossRef]
  23. Stratil, P.; Klejdus, B.; Kubáň, V. Determination of total content of phenolic compounds and their antioxidant activity in vegetables—Evaluation of spectrophotometric methods. J. Agric. Food Chem. 2006, 54, 607–616. [Google Scholar] [CrossRef] [PubMed]
  24. Makris, D.P.; Boskou, G.; Andrikopoulos, N.K. Polyphenolic content and in vitro antioxidant characteristics of wine industry and other agri-food solid waste extracts. J. Food Compos. Anal. 2007, 20, 125–132. [Google Scholar] [CrossRef]
  25. Sánchez-Moreno, C.; Larrauri, J.A.; Saura-Calixto, F. Free radical scavenging capacity and inhibition of lipid oxidation of wines, grape juices and related polyphenolic constituents. Food Res. Int. 1999, 32, 407–412. [Google Scholar] [CrossRef]
  26. CCFRA. Manual of Microbiological Methods for the Food and Drinks Industry—Guideline No. 43, 4th ed.; Campden & Chorleywood Food Research Association Group (CCFRA): Gloucestershire, UK, 2003. [Google Scholar]
  27. Adams, M.R.; Moss, M.O. Food Microbiology, 2nd ed.; RCS: Cambridge, UK, 2000. [Google Scholar]
  28. Casey, J.T.; O’Cleirigh, C.; Walsh, P.K.; O’Shea, D.G. Development of a robust microtiter plate-based assay method for assessment of bioactivity. J. Microbiol. Methods 2004, 58, 327–334. [Google Scholar] [CrossRef] [PubMed]
  29. Patton, T.; Barrett, J.; Brennan, J.; and Moran, N. Use of a spectrophotometric bioassay for determination of microbial sensitivity to manuka honey. J. Microbiol. Methods 2006, 64, 84–95. [Google Scholar] [CrossRef] [PubMed]
  30. Clifford, M.N. Chlorogenic acids and other cinnamates—Nature, occurrence and dietary burden. J. Sci. Food Agric. 1999, 79, 362–372. [Google Scholar] [CrossRef]
  31. García-Alonso, F.J.; Bravo, S.; Casas, J.; Pérez-Conesa, D.; Jacob, K.; Periago, M.J. Changes in antioxidant compounds during the shelf life of commercial tomato juices in different packaging materials. J. Agric. Food Chem. 2009, 57, 6815–6822. [Google Scholar] [CrossRef] [PubMed]
  32. Marete, E.; Jacquier, J.C.; O’Riordan, D. Effects of extraction temperature on the phenolic and parthenolide contents, and colour of aqueous feverfew (Tanacetum parthenium) extracts. Food Chem. 2009, 117, 226–231. [Google Scholar] [CrossRef]
  33. Neveu, V.; Perez-Jiménez, J.; Vos, F.; Crespy, V.; du Chaffaut, L.; Mennen, L.; Knox, C.; Eisner, R.; Cruz, J.; Wishart, D.; et al. Phenol-Explorer: An online comprehensive database on polyphenol contents in foods. Database 2010. [Google Scholar] [CrossRef]
  34. Hsieh, C.W.; Ko, W.C. Effect of high-voltage electrostatic field on quality of carrot juice during refrigeration. LWT Food Sci. Technol. 2008, 41, 1752–1757. [Google Scholar] [CrossRef]
  35. Alonso-Salces, R.M.; Barranco, A.; Abad, B.; Berrueta, L.A.; Gallo, B.; Vicente, F. Polyphenolic profiles of Basque cider apple cultivars and their technological properties. J. Agric. Food Chem. 2004, 52, 2938–2952. [Google Scholar] [CrossRef] [PubMed]
  36. Podsędek, A.; Sosnowska, D.; Anders, B. Antioxidative capacity of tomato products. Eur. Food Res. Technol. 2003, 217, 296–300. [Google Scholar] [CrossRef]
  37. Pacheco-palencia, L.A.; Hawken, P.; Talcott, S.T. Phytochemical, antioxidant and pigment stability of açai (Euterpe oleracea Mart.) as affected by clarification, ascorbic acid fortification and storage. Food Res. Int. 2007, 40, 620–628. [Google Scholar] [CrossRef]
  38. Pacheco-palencia, L.A.; Hawken, P.; Talcott, S.T. Juice matrix composition and ascorbic acid fortification effects on the phytochemical, antioxidant and pigment stability of açai (Euterpe oleracea Mart.). Food Chem. 2007, 105, 28–35. [Google Scholar] [CrossRef]
  39. Pernice, R.; Borriello, G.; Ferracane, R.; Borrelli, R.C.; Cennamo, F.; Ritieni, A. Bergamot: A source of natural antioxidants for functionalized fruit juices. Food Chem. 2009, 112, 545–550. [Google Scholar] [CrossRef]
  40. Lo Scalzo, R. Organic acids influence on DPPH scavenging by ascorbic acid. Food Chem. 2008, 107, 40–43. [Google Scholar] [CrossRef]
  41. Hider, R.C.; Liu, Z.D.; Khodr, H.H. Metal chelation of polyphenols. Methods Enzymol. 2001, 335, 190–203. [Google Scholar] [PubMed]
  42. Yesil-Celiktas, O.; Isleten, M.; Vardar-Sukan, V.; Oyku Cetin, E. In vitro release kinetics of pine bark extract enriched orange juice and the shelf stability. Br. Food J. 2010, 112, 1063–1076. [Google Scholar] [CrossRef]
  43. Ashurst, P. Chemistry and Technology of Soft Drinks and Fruit Juices, 2nd ed.; Blackwell: Oxford, UK, 2004. [Google Scholar]
  44. Rodríguez, H.; Curiel, J.A.; Landete, J.M.; de las Rivas, B.; de Felipe, F.L.; Gómez-Cordovés, C.; Mancheño, J.M.; Muñoz, R. Food phenolics and lactic acid bacteria. Int. J. Food Microbiol. 2009, 132, 79–90. [Google Scholar] [CrossRef] [PubMed] [Green Version]
  45. Hendrich, A.B. Flavonoid-membrane interactions: Possible consequences for biological effects of some polyphenolic compounds. Acta Pharmacol. Sin. 2009, 27, 27–40. [Google Scholar] [CrossRef]
  46. Cushnie, T.T.P.; Lamb, A.J. Antimicrobial activity of flavonoids. Int. J. Antimicrob. Agents 2005, 26, 343–356. [Google Scholar] [CrossRef]

