Article

Advanced Multimodeling for Isotopic and Elemental Content of Fruit Juices

1
National Institute for Research and Development of Isotopic and Molecular Technologies, 67-103 Donat Street, 400293 Cluj-Napoca, Romania
2
Faculty of Horticulture and Business in Rural Development, University of Agricultural Sciences and Veterinary Medicine of Cluj-Napoca, Calea Mănăştur 3-5, 400372 Cluj-Napoca, Romania
*
Authors to whom correspondence should be addressed.
Beverages 2025, 11(5), 145; https://doi.org/10.3390/beverages11050145
Submission received: 7 May 2025 / Revised: 12 August 2025 / Accepted: 26 September 2025 / Published: 9 October 2025

Abstract

The aim of the present study was to test the prediction ability of three different supervised chemometric algorithms, such as linear discriminant analysis (LDA), k-nearest Neighbor (k-NN) and artificial neural networks (ANNs), for fruit juice classification and differentiation, based on isotopic and multielemental content. To accomplish this, a large experimental dataset was analyzed using inductively coupled plasma mass spectrometry (ICP-MS) together with isotope ratio mass spectrometry (IRMS), and a low data fusion approach was applied. Three classifications were tested, namely the following: (i) fruit differentiation of different juice types; (ii) apple and orange juice differentiation; and (iii) distinguishing between processed versus directly pressed apple juices. The results demonstrated that ANNs can offer the most accurate results, compared with LDA and k-NN, for all three cases of classification, highlighting once again the advantages of deep learning models for modeling complex data. The work revealed the higher potential of advanced chemometric methods for accurate classification of fruit juices, compared with traditional approaches. This approach could represent a realistic tool for ensuring the juice’s quality and safety, along with complying with regulations and combating fraud.

Graphical Abstract

1. Introduction

In 2023, the global market for fruit beverages was assessed at USD 46.12 billion [1] and is expected to grow in the next few years. The consumer interest in these products increased during the COVID-19 pandemic, boosting the immune system and increasing the health benefits. Generally, soft drinks (e.g., non-alcoholic beverages, flavored sodas and other sugar-sweetened beverages) present no nutritional advantage versus fruit and vegetable juices. Fruit juices’ benefits depend on the type of juice (orange, cranberry, tomato, apple, etc.).
Due to their nutritional value, fruit and vegetable juices contribute significantly to the economy through satisfying consumer demand, contributing to sales growth, and at the same time, generating important earnings for beverage industries. The place of natural juices in dietary guidelines and models of healthy eating remains intangible. Apart from orange juice, which remains the most popular and widely consumed fruit juice produced in the largest volume worldwide, apple juice takes the second position in this ranking [2] and other fruit juice types, such as pomegranate or berry-based juices, have gained a high reputation and are being sold as high-quality food items, due to their remarkable health benefits [3].
In Romania, apple production has a long history, with this fruit being considered the national fruit [4]. Gradually, from 2020 and 2021—when Romania ranked fifth in apple production (cultivation/harvested/production) (1000 ha)—to 2024, Romania reached the second position in this top, after Poland, according to the 2024 Eurostat data [5]. But, against all odds, apple imports are very high. Although Romania is a significant fruit producer, high volume of imported fruit may reflect consumer preferences for specific visual or quality standards, which are more rigorously controlled in certain exporting countries. Supermarkets have imposed some standards to sell impeccable, washed and polished food, and a lot of consumers prefer large and perfect apples. In this situation, the remaining apple production is transformed into juice and different alcoholic beverages [4]. Thus, in the last few years, on the Romanian market, many apple producers transformed their remaining fruits into juices, thus leading to the development of autochthonous brands that make 100% fruit juices not from concentrate, without added sugar. These beverages are directly pressed juices, being squeezed straight from the fruit, preserving all components of the fruit.
Given the background, food authenticity [6] is still a major concern for all actors involved in the food chain: consumers, consumer protection authorities and also producers and dealers [7]. The issue of food adulteration presents significant economic and public health concerns [8], and previously published papers suggest that combining spectroscopic techniques with machine learning algorithms could represent an effective quality control strategy [9]. Multi-element and isotopic analyses represent the key techniques and the methods of choice when geographical origins are the goal for a large variety of food stuffs [10]. Fruit juices are prepared from ripe, fresh, frozen or refrigerated fruits. They are made by mechanically rubbing raw materials or by pressing juice out of pulp [11]. For juices, adulteration is usually caused through the addition of water or other exogenous substances (sugars, coloring or flavoring agents) [12] or by dilution with cheaper quality juices [13]. The result of any of these fraudulent practices will be a drop in the value of final products. The diversity in adulteration practices, alongside fruit fingerprints (different fruits, different geographical areas, different varieties, etc.) and also with manufacturing methods and processing, creates a difficult scenario for detection and prevention of juice adulteration [3,8].
The isotope ratio mass spectrometry (IRMS) and inductively coupled plasma mass spectrometry (ICP-MS) techniques represent a knowledge tool for authenticity purposes, due to the fact that the isotopic and elemental fingerprints of the investigated juices will reflect the following: the geographical origin of the raw material, the exogenous water and/or sugars, the fruit type, the mineral composition of the soil and irrigation water, the weather conditions and/or the agricultural practices (e.g., fertilizers) [14,15,16,17]. At this time, there is a progressive effort towards the use of different methods (non-targeted) coupled with machine learning methods to ascertain the authenticity of food products [13,18].
In the context presented above, the aim of the present study was firstly to obtain a detailed fingerprint of fruit juices through IRMS (δ2H, δ18O, δ13C) and ICP-MS (Na, Mg, K, Ca, Cr, Mn, Fe, Co, Ni, Cu, Zn, As, Rb, Sr, Pb) analysis, followed by classical and advanced chemometric models, applied for identification of distinct characteristic of each juice type [19]. Additionally, another aim was to explore the potential of fusion between analytical results and an advanced multimodeling approach for the prediction of fruit type and processing method. To our knowledge, this is among the first studies that employ this type of chemometric approach for fruit juice prediction, based on elemental and isotopic contents.

2. Materials and Methods

2.1. Sample Description

A total of 101 juice samples were investigated for this study (Table S1). The distribution according to fruit type was as follows: apple juices (n = 41), orange juices (n = 37) and juices obtained from other fruits (n = 23) (lemon, blueberries, plums, mango, tomato, cherry, peaches, etc.). Regarding the provenance of the samples, 28 were apple juices coming from Romanian manufacturers, labelled “100% fruit juices not from concentrate, without added sugar” (mentioned in the manuscript as “directly pressed/ freshly squeezed juice”), while 73 were produced by other foreign brands, being processed juices, commercially available on the Romanian market.

2.2. IRMS Measurements

The 2H/1H, 18O/16O and 13C/12C ratios were expressed in the delta notation, δ2H, δ18O, δ13C, as deviation, in parts per million (‰), from the Vienna Standard Mean Ocean Water (VSMOW) (for hydrogen and oxygen), and the Vienna Pee Dee Belemnite (VPDB) (for carbon) international standards. The isotopic signatures of 2H and 18O in the juice samples were determined by using a liquid-water isotope analyzer (DLT 100, Los Gatos Research, San Jose, CA USA). The uncertainty of the isotopic analysis was ±0.2‰ for δ18O, and ±0.6‰ for δ2H. A set of five reference materials, calibrated against Vienna Standard Mean Ocean Water international standard, V-SMOW, was used for calibration purposes, covering a wide isotopic scale: standard 1 (δ18O = −19.6‰, δ2H = −154.1‰), standard 2 (δ18O = −15.6‰, δ2H = −117.0‰), standard 3 (δ18O = −11.5‰, δ2H = −79.0‰), standard 4 (δ18O = −7.1‰, δ2H = − 43.6‰) and standard 5 (δ18O = −2.9‰, δ2H = −9.8‰), respectively. All samples were measured in duplicate. Each analysis consisted of 7 acquisition cycles; the first 3 cycles were eliminated to avoid sample-to-sample memory effects and run drift. The final result was calculated as the average of the remaining 4 cycles.
To obtain the 13C signature of whole juice, the first step consisted of removing the water by drying the juice in an oven at 65 °C (72 h). In the next stage, the conversion of each sample to CO2, by dry combustion (550 °C, 3 h) in excess oxygen, was carried out. The resulting CO2 was isolated from the other combustion gases by a cryogenic separation. Then, measurements of samples were made using an isotope ratio mass spectrometer (Delta V Advantage, Thermo Scientific, Waltham, MA, USA) in line with a dual inlet system. The measurement of each sample consisted of two replicates, and the average was calculated. For each replicate, an analysis containing eight cycles was accomplished. The standard deviation per analysis was consistently below 0.05‰, and the associated measurement uncertainty was ±0.3‰. Prior to analyzing the samples each day, a working standard was measured. This standard had been calibrated against the certified reference material NBS-22 oil, provided by the IAEA (International Atomic Energy Agency), in order to correct the raw data for run drift. Uncertainty for the δ13C analysis was ±0.2‰. NBS-22 oil, as certified reference material (IAEA—International Atomic Energy Agency), with a value of δ13CVPDB = −30.03‰, was used as a standard and used to correct the instrumental drift.

2.3. ICP-MS Measurements

Samples of fruit juices were digested using microwave-assisted acid digestion. A total of 4 mL of HNO3 (Chempur, Piekary Śląskie, Poland) and 1 mL of H2O2 (Chempur, Poland) were added to 2.5 mL of the homogenized fruit juice samples and digested in the microwave oven system from Berghof® (Speed ENTRY, Berlin, Germany), using the following program: heating from room temperature to 150 °C in 8 min (for 5 min) and heating from 150 °C to 200 °C in 2 min (for 18 min), from 200 °C to 75 °C in 1 min (for 19 min), and 50 °C in 1 min (for 5 min). After mineralization, all samples were transferred to 50 mL volumetric flasks and diluted with ultrapure water. This procedure was carried out in duplicate for all samples and analytical blanks (4 mL of HNO3 and 1 mL of H2O2).
The elemental analysis (Na, Mg, K, Ca, Cr, Mn, Fe, Co, Ni, Cu, Zn, As, Rb, Sr and Pb) was performed using inductively coupled mass spectrometry (ICP-MS ELAN DRC (e) mass spectrometer, Perkin Elmer SCIEX, Billerica, MA, USA). Important operation factors were as follows: nebulizer gas flow rates (0.92 L/min); auxiliary gas flow (1.2 L/min); plasma gas flow (15 L/min); lens voltage (7.25 V); radiofrequency power (1100 W); CeO/Ce = 0.015; Ba++/Ba+ = 0.025. For the standard stock solutions preparation, 10 µg/mL (Ag, Al, As, Ba, Be, Bi, Ca, Cd, Co, Cr, Cs, Cu, Fe, Ga, In, K, Li, Mg, Mn, Na, Ni, Pb, Rb, Se, Sr, Tl, U, V, Zn, in 5% HNO3 Chempur, Poland) solution from Perkin Elmer Pure Plus was used. For the calibration curves, successive dilutions were made to obtain the working solutions at different concentrations.
The working standard solutions, covering a range of 0.1–0.5 mg/L for Na, Mg, K and Ca were prepared by successive dilutions of multi-element calibration standard 3 (matrix: 5% HNO3, 10 μg/mL: Ag, Al, As, Ba, Be, Bi, Ca, Cd, Co, Cr, Cs, Cu, Fe, Ga, In, K, Li, Mg, Mn, Na, Ni, Pb, Rb, Se, Sr, Tl, U, V, Zn, in 5% HNO3). In the analytical determination conducted by ICP-MS analysis, the external calibration standards were employed within a concentration of 0.05 to 150 µg/L for Cr, Mn, Fe, Co, Ni, Cu, Zn, As, Rb, Sr and Pb, using multi-element calibration standard 3 (matrix: 5% HNO3, 10 μg/mL).
The following parameters were taken into account and evaluated for the validation of the analytical method for quantitative determination of Na, Mg, K, Ca, Cr, Mn, Fe, Co, Ni, Cu, Zn, As, Rb, Sr and Pb in fruit juices by ICP-MS: linearity, limits of detection (LOD), limits of quantification (LOQ), precision and accuracy. Highly satisfactory linear relationships were observed, as indicated by correlation coefficients (r > 0.999) for the calibration curves. LOD and LOQ were calculated with 3 and 10 times the standard deviation of the prepared blank solutions (n = 10). The instrumental LODs in μg/L were as follows: 0.06 (Na), 0.04 (Mg), 0.2 (K), 0.3 (Ca), 0.01 (Cr), 0.03 (Mn), 0.04 (Fe), 0.001 (Co), 0.01 (Ni), 0.05 (Cu), 0.02 (Zn), 0.003 (As), 0.005 (Rb), 0.001 (Sr) and 0.002 (Pb). The instrumental LOQs in μg/L were as follows: 0.18 (Na), 0.12 (Mg), 0.6 (K), 0.9 (Ca), 0.03 (Cr), 0.10 (Mn), 0.13 (Fe), 0.003 (Co), 0.03 (Ni), 0.15 (Cu), 0.07 (Zn), 0.01 (As), 0.015 (Rb), 0.015 (Sr) and 0.007 (Pb). The LOD and LOQ values obtained for each element were adequate for the expected contamination levels in fruit juices and met the requirements of international regulations and the specificity of the analyzed matrix. The precision of the analytical method was studied in terms of repeatability and reproducibility. The repeatability was studied by analyzing ten replicates of the same sample under the same conditions. The reproducibility was studied by repeating measurements on different days with different analysts. The RSDs were lower than 10%. The accuracy was estimated using recovery tests, using a digested sample at three concentration levels: low (5 μg/L, 10 μg/L), medium (100 μg/L, 250 μg/L) and high (10,000 μg/L). Recovery rates of 87–113% in fruit juice samples were obtained. For most analyses, the expanded uncertainties were found to range between 5 and 15%, depending on concentration levels. Matrix effects were minimized by using internal standard correction and matrix-matched calibration. Differences between matrix-matched and aqueous calibrations were within ±15%. Rh (10 μg/L) was employed as the internal standard.

2.4. Data Acquisition and Chemometric Processing

Chemometric analysis was carried out using SPSS v.24 (IBM, New York, NY, USA) software. The working data matrix was obtained through a low-level data fusion approach, which involved the concatenation of isotopic and elemental profiles into a single data file, used further for generation of chemometric models. By combining the results from two or more different analytical techniques, the reliability and robustness of the generated chemometric model are very much improved, due to the complementarity of information provided [19]. In this study, for classification and prediction purposes, three different chemometric methods were applied, as follows: linear discriminant analysis (LDA), k-nearest neighbor (k-NN) and artificial neural networks (ANNs), each time using different working data files, depending on the desired aim. Due to its simplicity and versatility, one of the most commonly used supervised statistical models is LDA. It works by finding linear combination of initial variables, weighted by numerical coefficients, which directly reflect their contribution to the developed model. These discriminant functions (DFs) offer a maximum separation among predefined groups of samples, juices in this case, and a minimum of variability within one group. The validation of the model is carried out using “leave-one-out cross validation” (LOOCV), which means, as the name suggests, a model development by omitting one sample at a time, and then the testing of that sample as a new one, using the model. This stage is repeated for each sample, and the results are expressed in accuracy by comparing the predicted and actual class labels across all iterations.
The second classification method applied in this study is k-NN, as LDA is a supervised method, used for both classification and prediction purposes. The k-NN algorithm stands out as a robust distance-based classifier within machine learning methods. As a prediction algorithm, the main elements of k-NN are as follows: measurement of the distance between the testing sample and predefined groups, then establishment of the neighbor’s number to consider, and finally prediction of the final classification group. The validation in this case is made using “hold-out method” which splits the dataset into training and validation subgroups. An important variable herein is the number of k, which represents the number of closest data points (neighbors) that the algorithm considers when making a classification or prediction [20].
The simplest type of ANN is constructed by at least three layers: an input layer, one or more hidden layers and an output layer. The most common type of ANNs is the multilayer perceptron; in this case, the information is moving forward from the input layer, through hidden layers, towards the output layer [21,22]. The number of neurons from the input layer corresponds to each measured characteristic, and then the hidden layer receives information from the input layer. In this stage, a bias node is added and weights for inputs are estimated. The neurons from the output layer correspond to the predicted category, as in this case, the type of fruit processing method applied for juice production [23]. There are several domains where neural networks have good results, e.g., business, finance, medicine or industry, in terms of prediction or pattern recognition problems. In the food industry, food processing, food engineering, food properties or quality control [24], statistical tools are frequently present, and ANNs can more efficiently process data comprising multiple input and output variables. Important parameters used for performance evaluation are represented through sensitivity and specificity values, which evaluate the model’s ability to discriminate between predefined classes, along with the area under the curve (AUC). The closer to 1 the AUC values, the more appropriate the model is for the respective dataset. It should be mentioned here that the above-mentioned algorithms were implemented in SPSS software by selecting their own specific predefined parameters. Thus, for a more consistent interpretation, in terms of cross-validation performances, all three machine learning algorithms were implemented in Python version 3.14 using the Anaconda interface. The imported libraries were Pandas, Numpy, Sklearn and Tensorflow.

3. Results and Discussion

3.1. Isotopic Fingerprint of Fruit Juices

The fruits absorb the water from precipitation and irrigation during the growing process [25]. This fruit water presents a unique isotopic signature of 2H and 18O related to the place of origin where the plant was grown. And it is well-known that the isotopic composition of the water from a specific location depends on temperature, altitude, latitude and precipitation amount [26]. In this regard, the isotopic fingerprints of 2H and 18O of the studied fruit juices will give information about the water source and sample origin [27].
For all investigated fruit juice samples, δ2H values ranged between −88.4 and −7.8‰, and δ18O between −12.5 and 2.3‰ (Figure 1). The sample with the highest content of hydrogen and oxygen is an orange juice, produced by a Spanish brand. These enriched values validate an authentic orange juice and could be explained by the Mediterranean climate of this country, with warm to hot summers. The lowest isotopic signatures of 2H and 18O were recorded for a berry fruit juice.
The fruit juice water has elevated isotopic values compared to groundwater and also tap water. If a concentrated fruit juice is re-diluted with tap water, the final product will have a depleted result. It can be observed that (Figure 1), with two exceptions, the other fruit juices presented similar isotopic values to those of orange juices, confirming that all these samples represent juices obtained from concentrates re-diluted with tap water. Taking into account that orange trees prosper in warm climates and the ideal temperatures for citrus tree growth range between 15 and 32 °C [28], the isotopic signatures of 2H and 18O should be higher, reflecting the geographical origin and climatic effects. But, except for the authentic orange juice from Spain, the other orange juices recorded depleted values. Regarding the two exceptions from the “other fruit juices” category, much higher values for these samples are observed.
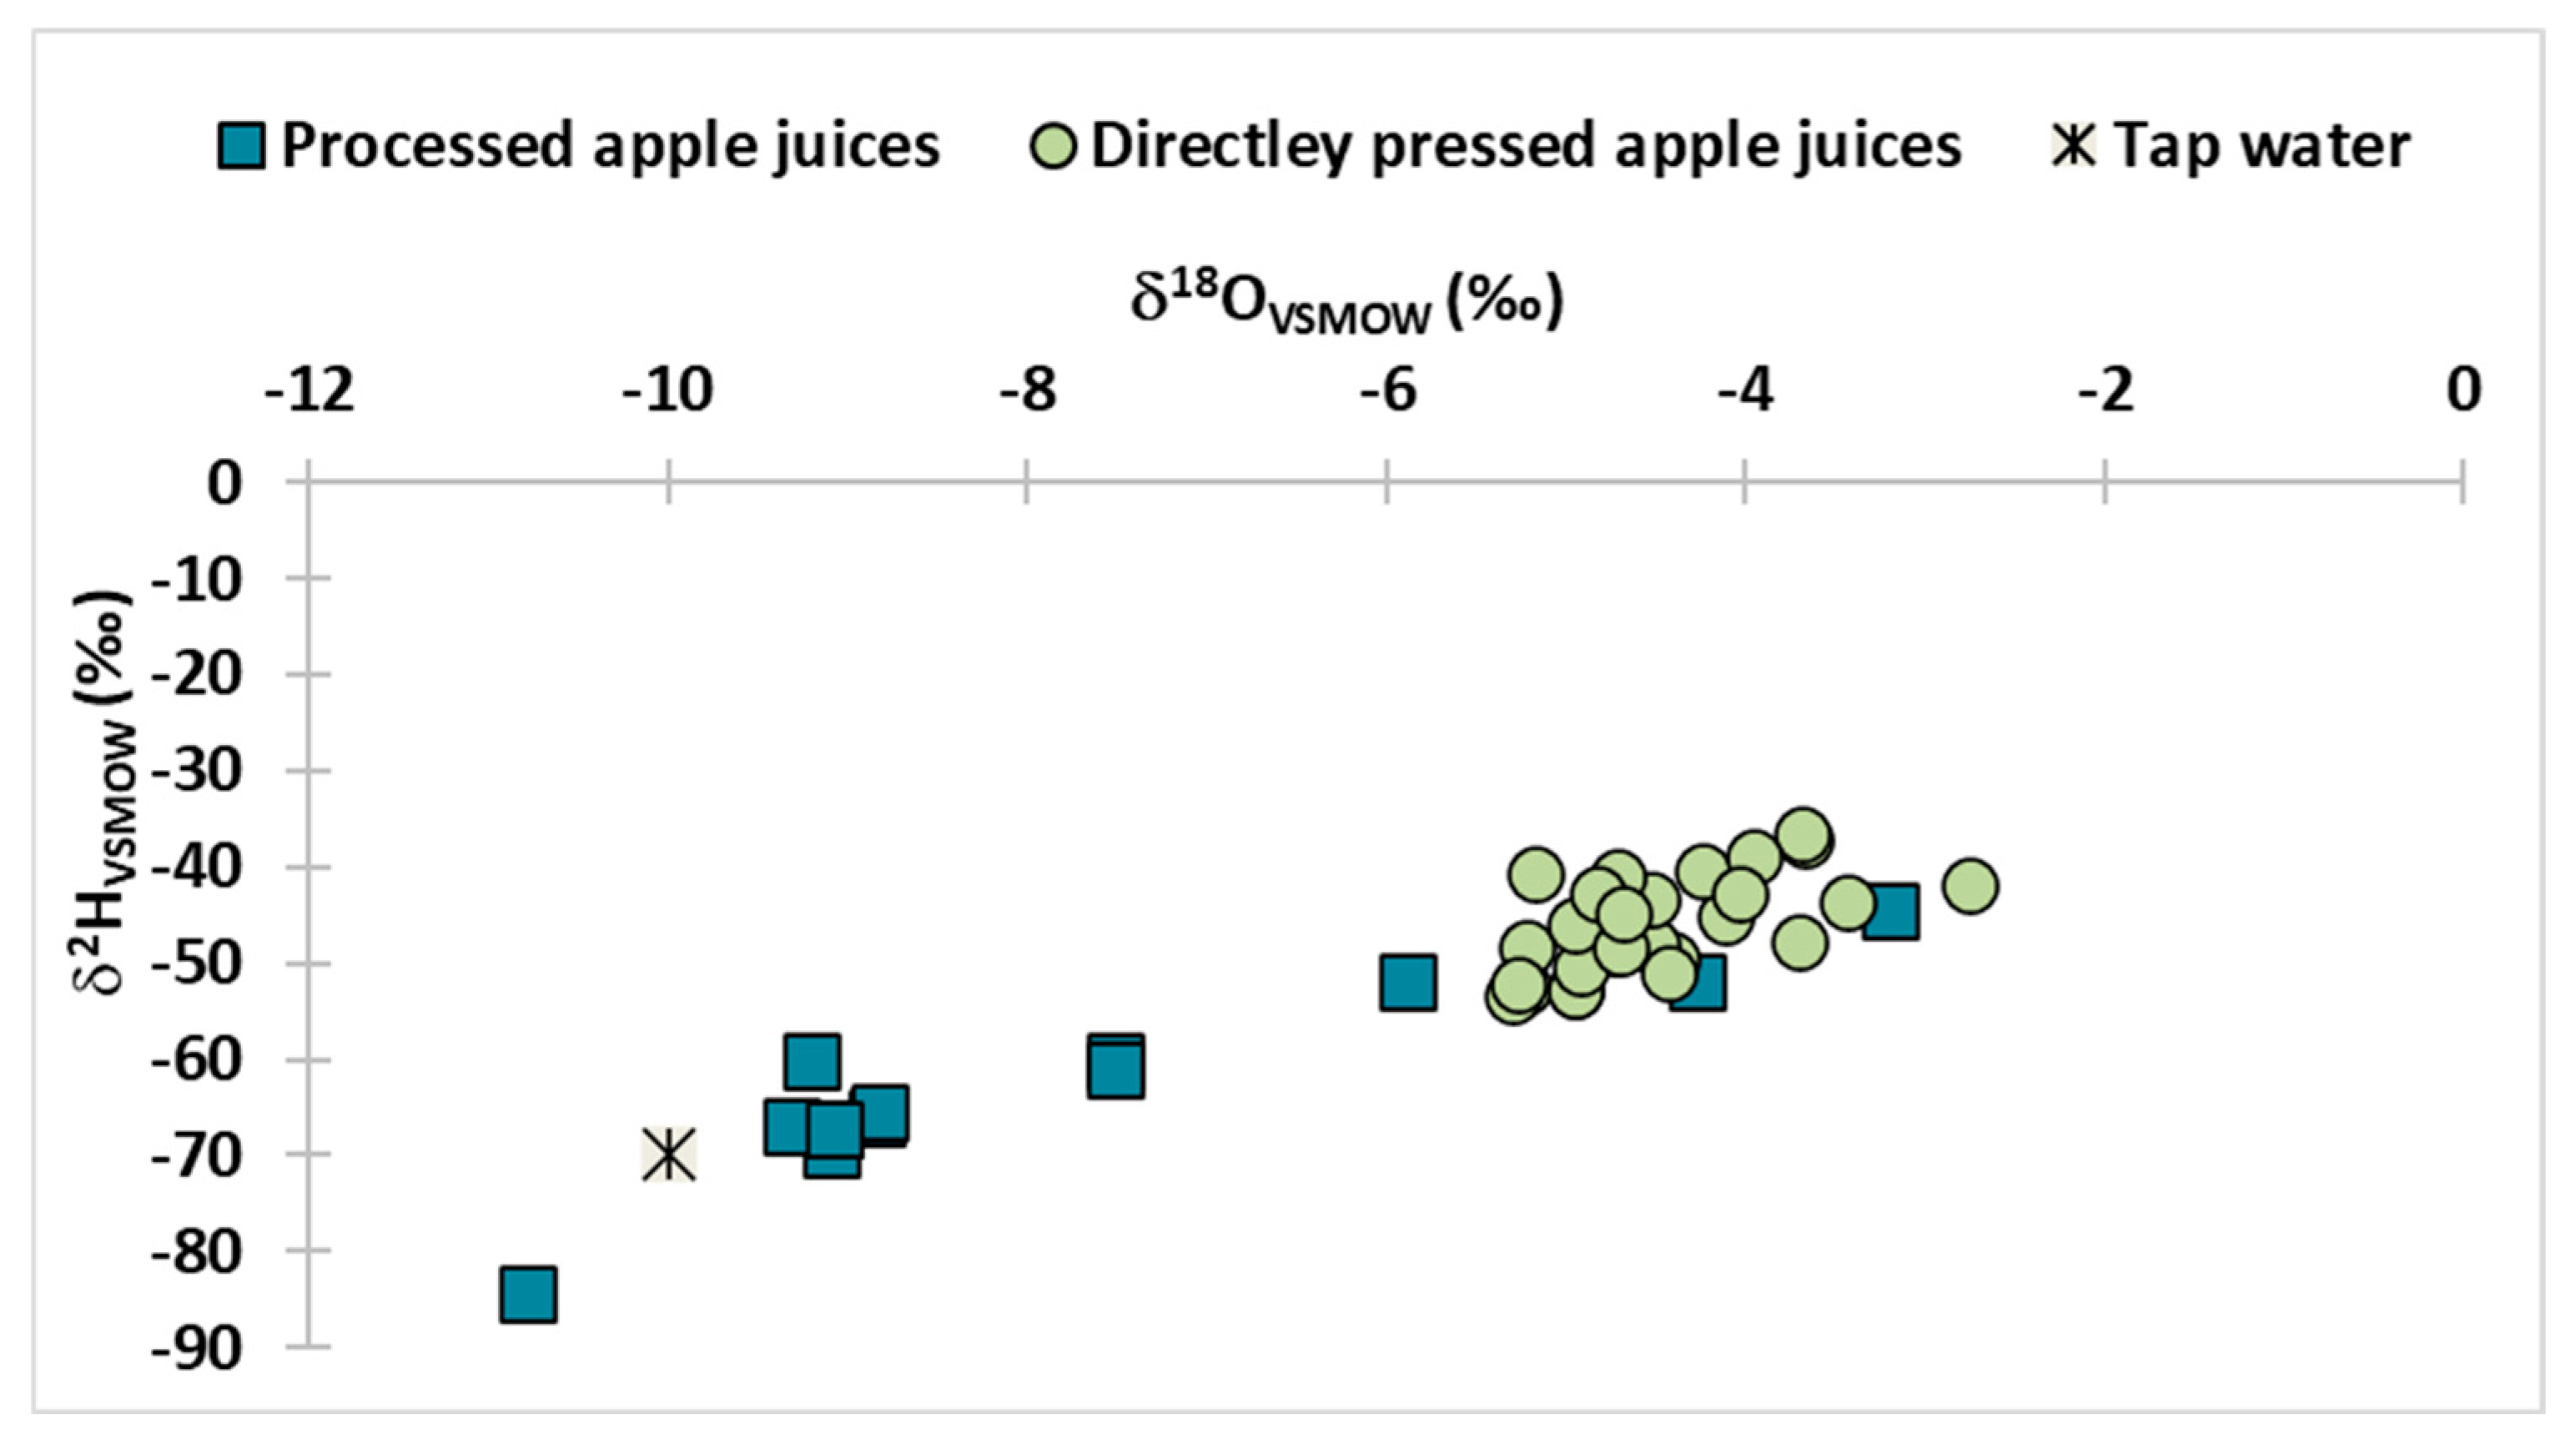
To better highlight the differences in isotopic signatures between the two categories of apple juices (labeled “directly pressed juice, not from concentrate, without added sugar” and regular label, processed juices), from Figure 1 were eliminated the results for the rest of the fruit juices, and Figure 2 is presented below.
In this graphic (Figure 2), a usual tap water (Cluj-Napoca, Romania) was plotted (with mean values of δ2H = −10.0‰ and δ18O = −70.0‰). The group tagged “directly pressed juices” was clearly separated from the other group. δ2H values ranged from −53.4 to −36.6‰ (mean of −46.0‰), and δ18O from −5.3 to −2.8‰ (mean of −4.5‰). The isotopic results for these samples are very close, confirming that the raw material apples come from the same area, namely Transylvania, as mentioned on the label. These results are consistent with those previously reported for directly pressed apple juices from the Transylvania region (Romania) by [29,30]. Thus, for 28 single-strength apple juices from the same region of Romania [30], the isotopic signature of 2H ranged between −56.5 and −39.0‰, and that of 18O from −5.6 to −3.0‰. Regarding the group of processed apple juices (which had no specific mention on the label), with three exceptions, the isotopic fingerprints of 2H and 18O were lower, proving the re-dilution with tap water. Thus, the isotopic signature of 2H varied between −84.2 and −44.4‰ (mean of −62.7‰), and that of 18O between −10.8 and −3.2‰ (mean of −7.9‰). Three samples from this category presented results in the same isotopic interval as those of directly pressed apple juices, confirming their authenticity.
For terrestrial plants, the 13C isotopic signature depends on the photosynthetic pathway. There are two main groups of photosynthesis: C3 (Calvin cycle) and C4 (Hatch-Slack cycle), as they function on different enzymes involved in the carboxylation process, with CO2 from the atmosphere being first incorporated into a three-carbon or four-carbon compound. Fruits follow a C3 cycle, having δ13C values between −30 and −23‰. C4 plants (corn, sugarcane) present a higher isotopic value of 13C, ranging from −14 to −12‰ [31]. Thus, if exogenous sugars, from corn or sugarcane, are added during the juice manufacturing process, the final 13C isotopic fingerprint of that juice will be higher.
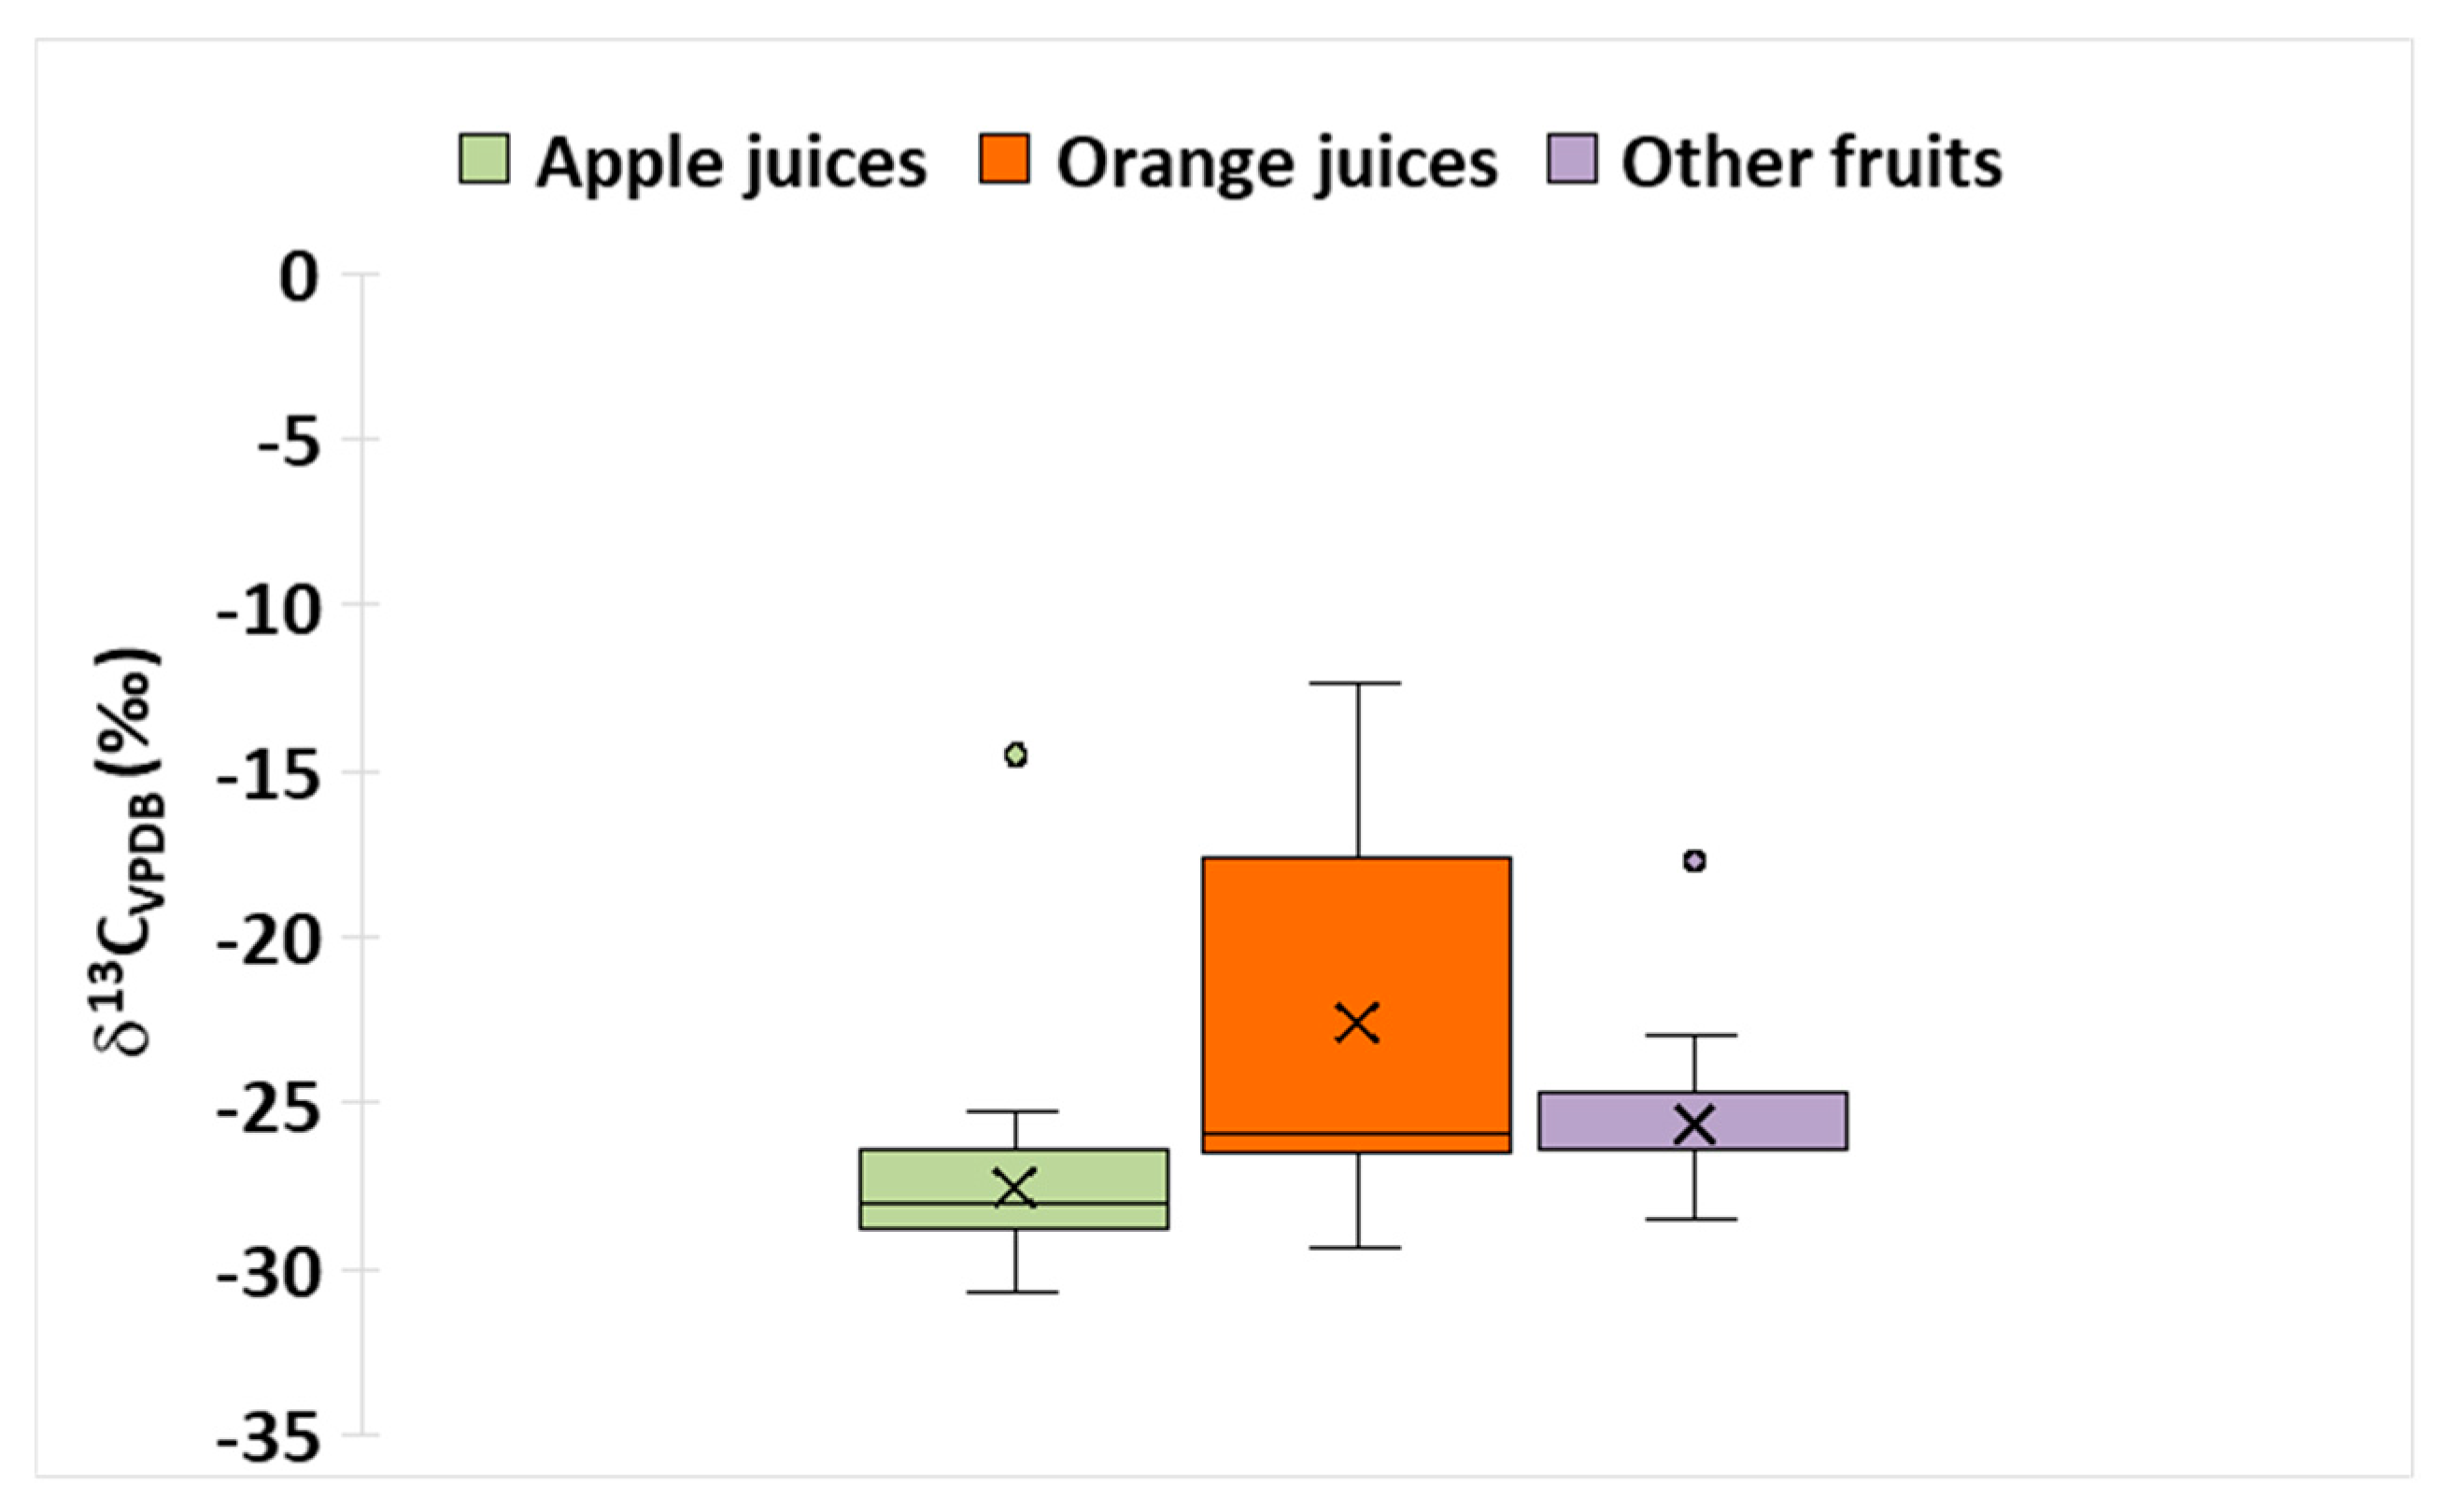
δ13C values ranged, for all investigated samples, from −30.8 to −12.3‰ (Figure 3). In the case of apple juice, the presence of C4 sugars was identified in one sample (δ13C = −14.5‰). Of the 37 orange juices, 14 samples had 13C values higher than those for C3 plants, confirming the presence of exogenous sugars from C4 plants. For “the other fruit juices” group, one sample, with a value of −17.7‰, was found to contain C4 sugars. A previously reported study presented similar results regarding the range values for δ13C (−27.9‰ and −15.1‰) for commercial orange juices. For commercial apple juices, there was a slight difference; the δ13C values ranged between −27.4‰ and −25.3‰. On the other hand, values between −27.8‰ and −23.3‰ were obtained for the directly pressed apple juices [29].

3.2. Distribution of Macro-, Micro- and Trace Elements in Fruit Juices

The concentration variations of the investigated elements in the fruit juices are indicated in Table 1. The average concentration values for most of the elements investigated in the analysis of commercial apple juice samples are lower than the average levels obtained for orange juice samples, in accordance with the study performed by [32]. Orange fruit juice samples had the highest mean concentrations of K (623.10 mg/L), Ca (80.24 mg/L), Mg (60.06 mg/L), Rb (901.15 µg/L) and Sr (435.39 µg/L), with maximum concentrations of K (1471.70 mg/L), Ca (407.80 mg/L), Mg (135.89 mg/L), Rb (2135.37 µg/L) and Sr (1658.44 µg/L), respectively. The highest concentrations of Na (1324.98 mg/L), Fe (6413.26 µg/L), Mn (2240.12 µg/L), Zn (1186.06 µg/L), Cu (2143.00 µg/L) and Co (76.00 µg/L) were found in mixed fruit juices, with the highest mean concentration of 125.09 mg/L for Na, 1037.72 µg/L for Fe, 416.20 µg/L for Mn, 358.93 µg/L for Zn, 536.22 µg/L for Cu and 23.63 µg/L for Co. Apple juices had the highest mean concentration of Cr (308.99 µg/L) and Ni (137.17 µg/L) among all the juices. Finally, the directly pressed apple juice samples have the highest As and Pb concentrations (0.85 µg/L and 0.69 µg/L, as mean values) and the lowest mean concentrations of Ca (15.70 mg/L), Mg (18.54 mg/L), Na (0.84 mg/L), Rb (552.79 µg/L), Cr (50.59 µg/L), Mn (143.11 µg/L), Ni (15.44) and Co (0.89 µg/L). The lowest mean K (297.68 mg/L) and As (0.17 µg/L) contents were measured in mixed fruit juices, Fe (425.76 µg/L) in orange fruit juices, and Sr (228.64 µg/L), Zn (163.19 µg/L), Cu (139.92) and Pb (0.27 µg/L) in apple fruit juices.
The World Health Organization (WHO) and the Food and Agriculture Organization (FAO) have delineated permissible concentrations of Pb in fruit juices, specifically establishing a threshold of 0.03 mg/L, with the caveat that this maximum limit does not extend to juices derived exclusively from berries and other diminutive fruits; for grape juice, the stipulated level is 0.04 mg/L, whereas for fruit juices sourced solely from berries and other small fruits, the permissible concentration is set at 0.05 mg/L [33]. Nonetheless, definitive reference concentrations for Cu, Fe and Zn in fruit juices have not been established. Standards pertaining to drinking water delineate reference values for various heavy metals, encompassing Cu, Fe and Zn. The presence of heavy metals in beverages, including packaged fruit juices, is often compared with drinking water standards, given that the quality of water is a critical determinant of the purity of these beverages.
Table 1. Macro-, micro- and trace elements concentrations in fruit juice samples.
ElementsType of Fruit JuiceWater Quality Standards
Apple
(n = 13)
Orange
(n = 37)
Others
(n = 23)
Directly Pressed Juice (Apple)
(n = 28)
USEPA [34]
2018
WHO [35]
2017
N (%)
Min–Max Values
(Mean Value ± SD)
Na
(mg/L)
1.13–53.50
(20.30 ± 13.81)
1.82–206.19
(51.70 ± 55.97)
5.08–1324.98
(125.09 ± 267.12)
0.32–1.42
(0.84 ± 0.30)
nmnm-
Mg
(mg/L)
23.79–50.43
(38.10 ± 7.91)
7.48–135.89
(60.06 ± 37.58)
13.80–142.16
(46.63 ± 36.83)
9.76–30.39
(18.54 ± 5.42)
nmnm-
K
(mg/L)
332.11–812.18
(514.86 ± 171.40)
48.96–1471.70
(623.10 ± 466.88)
52.52–824.83
(297.68 ± 206.73)
324.74–533.52
(399.65 ± 65.78)
nmnm-
Ca
(mg/L)
22.00–72.44
(43.11 ± 16.79)
10.31–407.80
(80.24 ± 78.15)
0.43–107.41
(40.70 ± 28.47)
6.03–32.47
(15.70 ± 6.52)
nmnm-
Cr
(µg/L)
16.41–1055.20
(308.99 ± 344.02)
8.44–1121.78
(203.09 ± 220.85)
30.70–554.50
(147.17 ± 133.62)
6.04–144.84
(50.59 ± 34.45)
1005045 (44.6%) [34]
Mn
(µg/L)
5.92–391.23
(256.05 ± 106.63)
6.44–483.38
(210.68 ± 154.88)
59.60–2240.12
(416.20 ± 476.67)
54.10–262.18
(143.11 ± 57.89)
50nm94 (93.1%) [34]
Fe
(µg/L)
54.45–2719.02
(824.22 ± 796.16)
2.46–3167.88
(425.76 ± 638.80)
60.30–6413.26
(1037.72 ± 1731.16)
338.06–1720.96
(940.11 ± 375.29)
300nm55 (54.5%) [34]
Co
(µg/L)
0.26–11.37
(4.89 ± 3.36)
0.66–13.92
(4.63 ± 3.78)
1.22–76.00
(23.63 ± 26.48)
0.22–5.06
(0.89 ± 0.95)
nmnm0 (0%)
Ni
(µg/L)
13.75–1083.98
(137.17 ± 289.66)
0.83–492.50
(70.22 ± 105.95)
1.52–321.40
(70.46 ± 77.26)
0.10–69.16
(15.44 ± 17.02)
nm7020 (19.8%) [35]
Cu
(µg/L)
37.58–800.61
(139.92 ± 201.65)
12.86–1297.40
(231.41 ± 229.31)
162.60–2143.00
(536.22 ± 429.16)
109.86–1215.10
(302.23 ± 216.00)
130020001 (1.0%) [35]
Zn
(µg/L)
12.36–379.10
(163.19 ± 128.98)
6.78–830.57
(299.36 ± 223.96)
112.62–1186.06
(358.93 ± 259.66)
83.06–573.06
(180.74 ± 117.67)
nmnm0 (0%)
As
(µg/L)
0.01–0.44
(0.20 ± 0.13)
0.07–3.02
(0.35 ± 0.52)
0.02–0.38
(0.17 ± 0.11)
0.02–2.52
(0.85 ± 0.77)
10100 (0%)
Rb
(µg/L)
422.74–2247.23
(771.91 ± 490.57)
57.82–2135.37
(901.15 ± 702.89)
147.10–1279.04
(620.49 ± 343.98)
87.76–1748.48
(552.79 ± 437.18)
nmnm0 (0%)
Sr
(µg/L)
71.46–771.63
(228.64 ± 193.33)
28.73–1658.44
(435.39 ± 309.09)
121.62–878.74
(400.89 ± 209.05)
63.80–705.80
(233.11 ± 173.42)
nmnm0 (0%)
Pb
(µg/L)
0.03–0.78
(0.27 ± 0.22)
0.10–1.92
(0.32 ± 0.32)
0.12–0.67
(0.33 ± 0.19)
0.01–3.73
(0.69 ± 0.99)
15100 (0%)
nm—not mentioned. The water quality standard levels are in µg/L. a-values are secondary maximum contaminant limits, which are non-enforceable as stated in USEPA. N—the number of samples exceeding the value of water standard.
There were variations in the concentrations of both essential and nonessential elements within the analyzed fruit juices when compared to previously published data (Table 2 and Table 3). These differences are attributed to the elemental composition of the fruit, the mineral content of the water utilized in the juice production process, and any additional ingredients incorporated. In addition, essential and non-essential elements profiles can be influenced by factors such as geographic origin, agricultural practices, seasonal variation and processing methods.

3.3. Chemometric Modeling Based on Isotopic and Multielemental Data

The chemometric modeling consisted of several approaches, including classical (LDA) and advanced (k-NN and ANNs) analysis. Classical chemometric models are widely used, are easier to implement and to interpret, have a linear character, while advanced models encompass more flexible and sophisticated algorithms, suitable for modeling nonlinear relationships among different types of samples. The first dataset was a matrix formed by 73 processed juice samples (having a regular label “fruit juice”), having as characteristics the isotopic (three variables corresponding to each isotope) and multielemental contents (fifteen variables corresponding to each macro, micro and essential element). A new dependent variable was created having values corresponding to different classes (code 1—for apple juices, code 2—orange juices, code 3—other fruit juices).

3.3.1. Development of LDA for Fruit Juices Classifications

For the first classification aim, more precisely the fruit juices classification according to the fruit type LDA provided an acceptable percent of classification, 80.8% accuracy for initial classification and for leave-one-out cross-validation, based on several features, each having the following standardized canonical coefficients: K (0.979), Ca (0.435), Mn (−0.498), Zn (1.117), Co (−0.430) and δ13C (0.696). Some minerals (K, Mg) were reported by other authors to have higher values in commercial juices [46]. Another published study, which employed linear discriminant analysis for differentiation of commercially available orange and apple juices, highlighted, among other features, the strong contribution of K, Ca and δ13C in the classification step [29].
As can be observed in Figure 4, the separation among the juices is not very good (Wilks’ Lambda 0.346, p < 0.001 for DF1 and 0.790, p = 0.007 for DF2); some serious overlapping areas can be observed among all groups. Since three categories of samples were compared, two discriminant functions were obtained, each one explaining a percent of dataset variability, DF 1 = 82.8% and DF 2 = 17.2%.
When LDA was implemented in Python, using the scikit-learn library, to classify juice samples based on isotopic and elemental profiles, the following stages were carried out: standardization of features using StandardScaler preprocessing method, and the dataset was split into training and test sets with stratification to preserve class distribution. Model evaluation was assessed using stratified 5-fold cross-validation. Also, the performance metrics of the model, such as accuracy, confusion matrix, precision, recall, F1-score (macro and micro) and AUC, were computed.
Having the same purpose, LDA was implemented in Anaconda notebook, and the results are presented below. The canonical coefficients values obtained for each significant features, in decreasing order of importance are as follows: K = 2.226457, Co = 1.487596, Rb = 1.327064, Zn = 1.174625, Pb = 1.124423, δ13C = 1.029280, δ18O = 0.984907, Mg = 0.958271, δ2H = 0.896743, Fe = 0.73376, Mn = 0.580611, Ca = 0.49079, As = 0.463236, Ni = 0.459750, Sr = 0.359329, Na = 0.316334, Cu = 0.306442, Cr = 0.191181. The confusion matrix and performance parameters are presented below, in Table 4.
Micro-averaged scores, which weight classes by their sample counts, are influenced heavily by the majority class, in this particular case, “Orange group”, which dominates the predictions. In contrast, because the sample sizes are imbalanced, macro metrics are critical in this context for assessing the true accuracy across all three categories. Macro-averaged scores treat all classes equally, revealing that the model tries to correctly classify the minority class, in this case, “Apple group” and “Other fruits group”. These differences between values highlight that although the overall accuracy and micro scores appear reasonable, the model performs unevenly across classes, having higher prediction capabilities for the majority class.
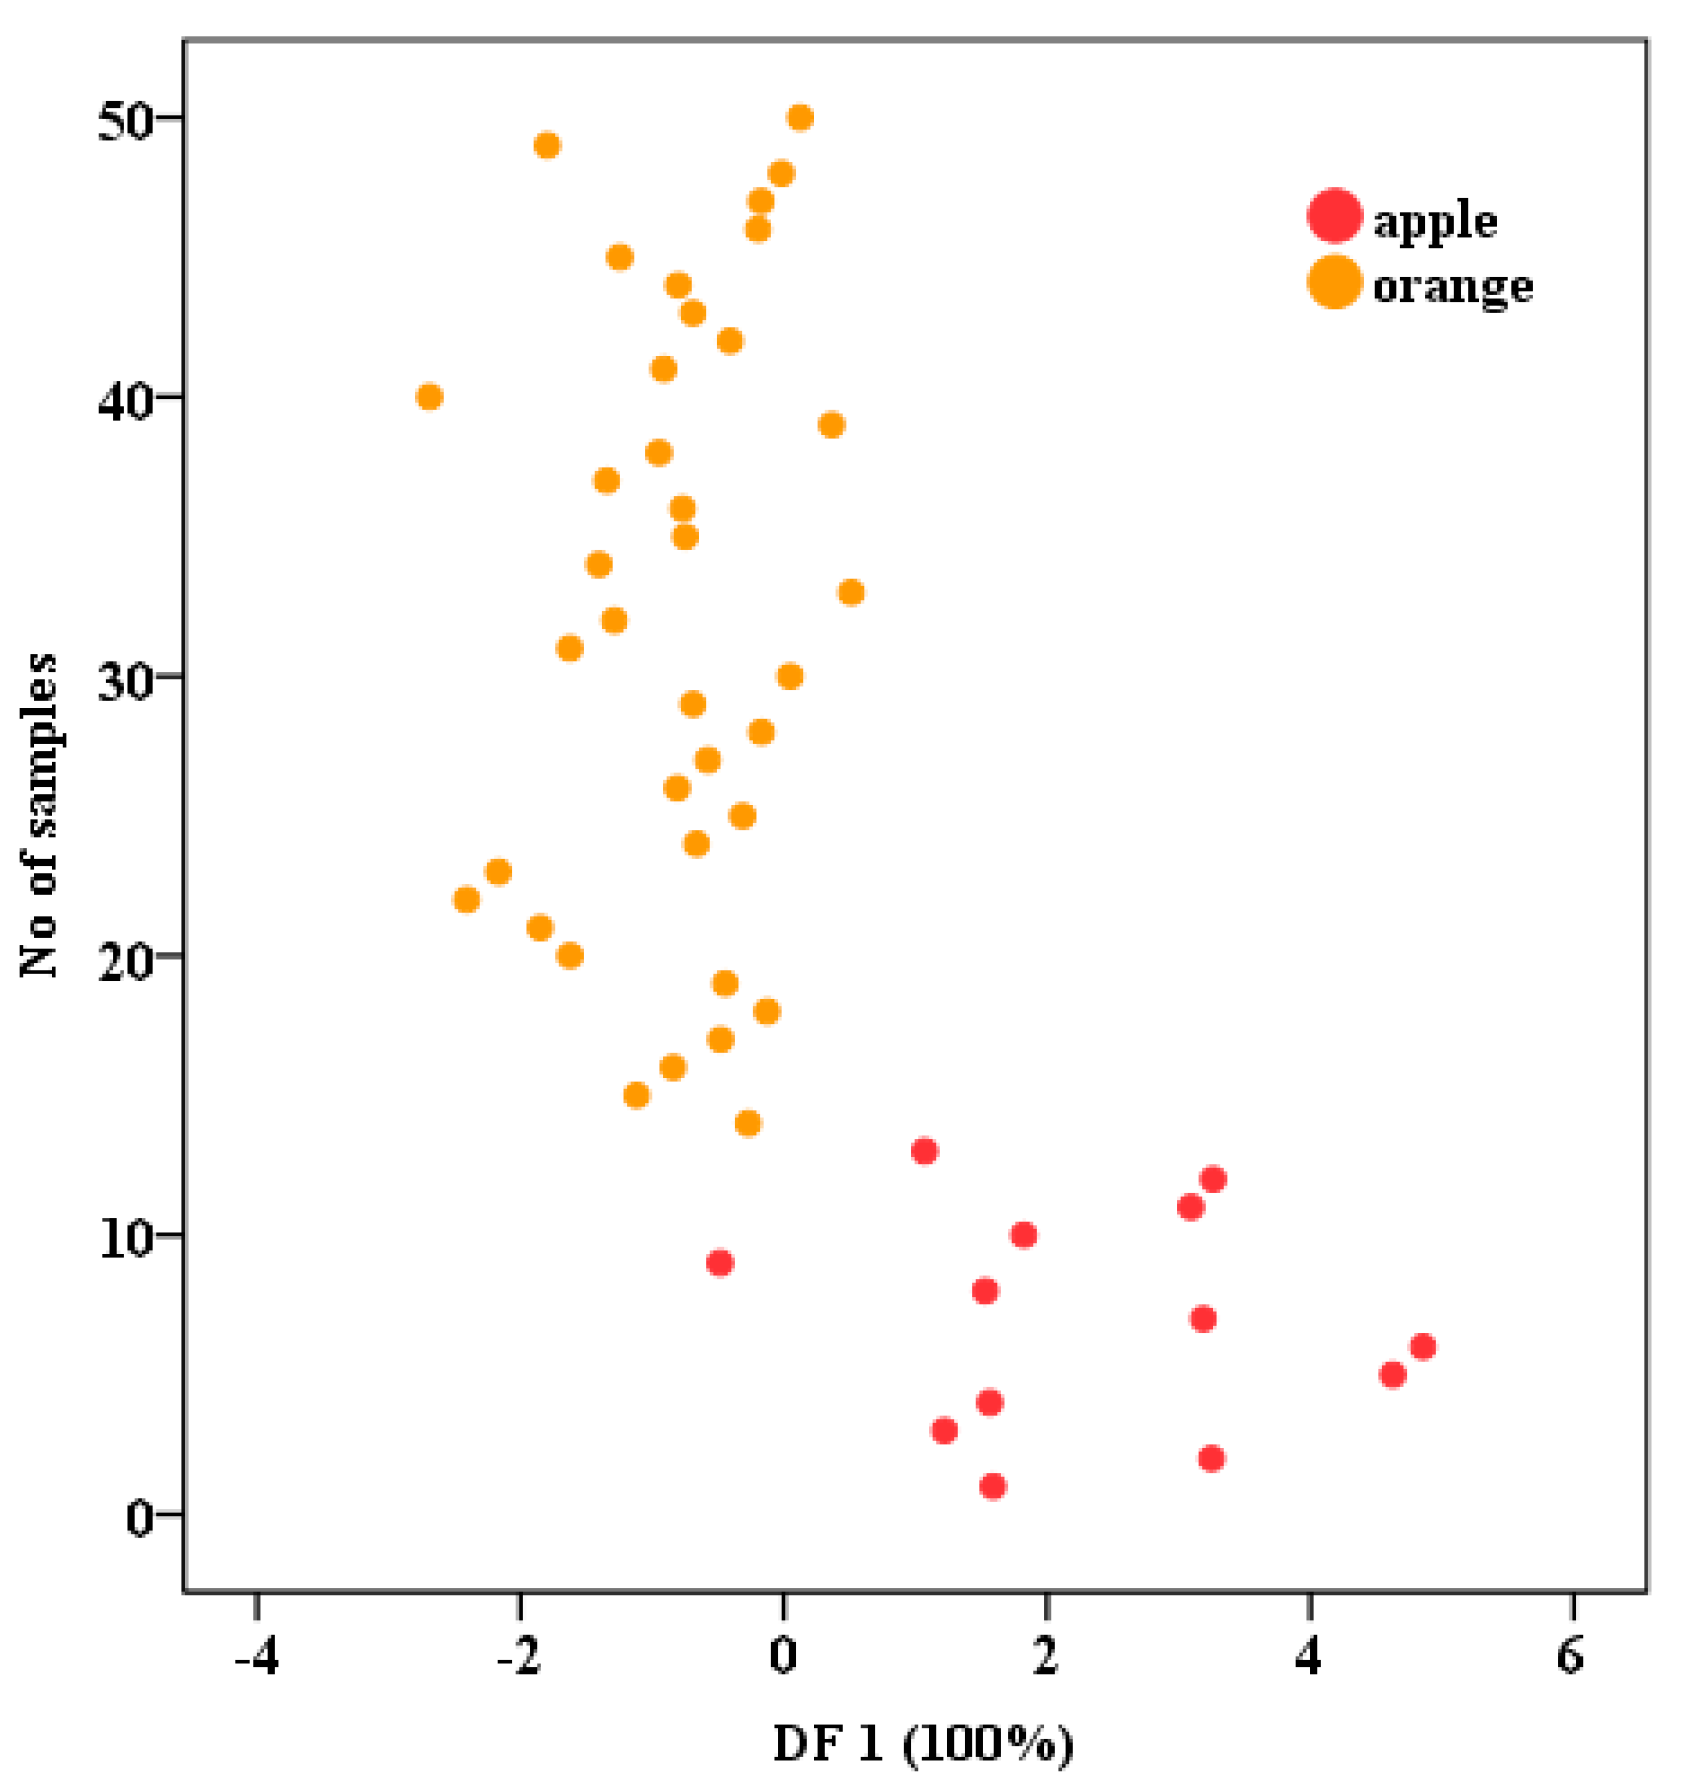
Generally, for chemometric analysis, a very important aspect is given by the representativeness of samples, which refers to how well the selected samples reflect the system under study. For accurate and reliable results, it is crucial that sample groups be well represented, with small variability within the group. In this case, the classification is lowered by the third group, which contains a mix of fruit juices. To better assess model performances between the dominant classes of juices—apple and orange juices and to overcome this aspect, these samples were removed from the analysis. The binary classification task (apple vs. orange) was performed and this strategy provided a percent of 98% for initial classification (only one sample was misclassified) and 96% for the cross-validation step (two samples were misclassified). The graphical distribution is presented in Figure 5. For this classification, the main predictors were Mn (2.734), Mg (−2.931), Cu (0.840) and Cr (−0.501).
For the same dataset LDA was implemented in Anaconda notebook; the results are presented below. The canonical coefficients values obtained for each significant features in decreasing order of importance are as follows: Mg = 12.706607, Mn = 10.000922, Pb = 5.622907, Ni = 4.167398, Rb = 3.060786, δ18O = 3.035185, Cr = 2.774942, Cu = 2.470939, Zn = 1.943464, Fe = 1.573172, Sr = 1.283760, Co = 0.967749, Ca = 0.961272, As = 0.953146, K = 0.867724, δ2H = 0.541309, δ13C = 0.470545, Na = 0.319847. The confusion matrix and performance parameters are presented below, in Table 5.
The LDA metrics showed almost perfect separation in the training step, but in the testing step, it seems that the performances are unequal among the two classes. The percent drop in the testing step indicates an imbalance in class correct assignment. At the same time, the lower values obtained for macro-metrics compared with micro-metrics are a clear suggestion that the model does not have the same prediction power for both classes. This fact represents a need for a comprehensive evaluation using all available metrics when imbalanced datasets are classified.
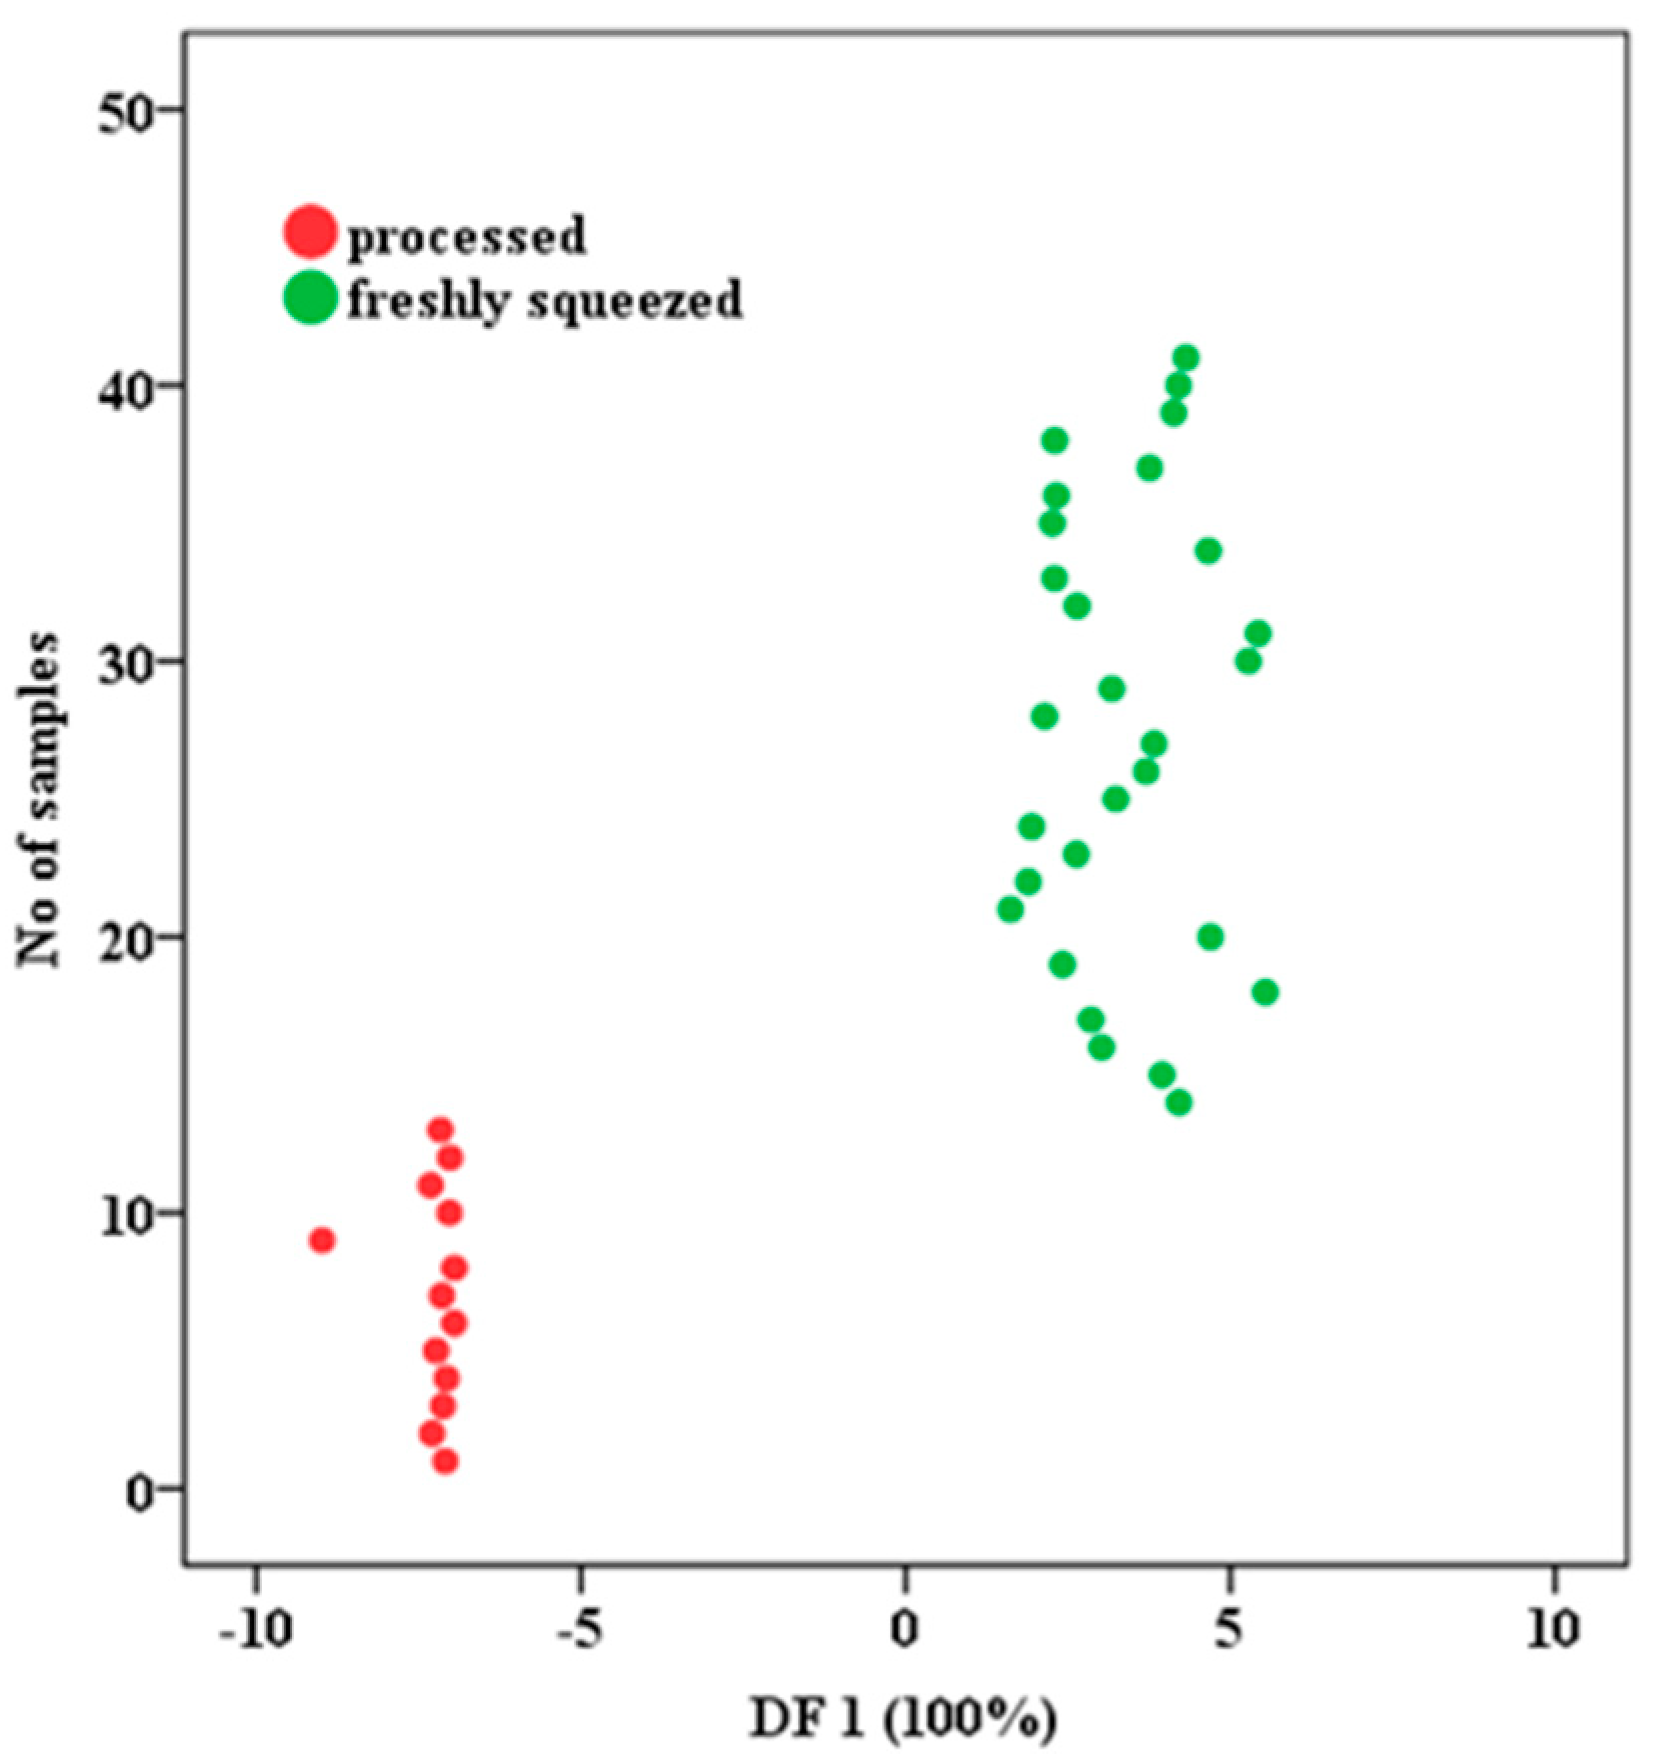
For the last classification, a new dataset was created, containing only apple sample juices, but from two categories (labeled “directly pressed juice, not from concentrate, without added sugar” and processed apple juice, regular label). In this case, LDA provided the best results, with 100% for both stages (Figure 6), the initial and cross-validation steps. The only discriminant function, which explained the whole dataset’s variability, had as variables the content of K (1.184), Mn (0.781), Rb (−0.406) and δ13C (−0.327).
For the same dataset LDA was implemented in Anaconda notebook; the results are presented below. The canonical coefficients values obtained for each features, in decreasing order of importance, are as follows, K = 255.854175, Mg = 205.255458, Ca = 201.464697, Mn = 145.956611, Sr = 128.050872, Fe = 89.347313, D = 55.740929, O = 52.416983, Pb = 52.113992, Ni = 43.892672, As = 38.662091, Cu = 34.931385, Co = 32.259463, Rb = 18.564292, Na = 17.216694, Cr = 10.573513, Zn = 6.342348, C = 1.559464. The confusion matrix and performance parameters are presented below, in Table 6.
This perfect separation, which was obtained here, should be interpreted taking into consideration the split sample set among the training and testing steps (9 processed juices vs. 19 freshly squeezed and 4 processed juices vs. 9 freshly squeezed). To confirm the model performances and to increase the generalizability power, future work should be focused on extension of datasets.

3.3.2. Development of k-NN Algorithm for Fruit Juice Classifications

As in the case of LDA, the same dependent variable is used in this case for implementation of k-nearest neighbor. The analysis was run with the following parameters: the target variable was the type of fruit used for juices and the isotopic and elemental content were selected as features. The normalization of variables (autoscaling to zero mean and unit variance) was made before any other computations. There were two options for neighbor selection (automatically or specified by the user) and the number of neighbors was automatically selected (between 3 and 5). A moderate value of k neighbors can provide a balanced performance, can help to smooth the noise, while still capturing the data pattern. The similarities or differences among a new sample and predefined groups were evaluated by computing Euclidean measurements. Also, the features were weighted by importance when the distances were computed. The maximum number of selected features was set to 10 and forward selection was applied. Two sample subsets were created by randomly assigning cases to partitions, as follows: 70% for the training stage, while the rest were used for the testing stage. The results are presented in Table 7 below.
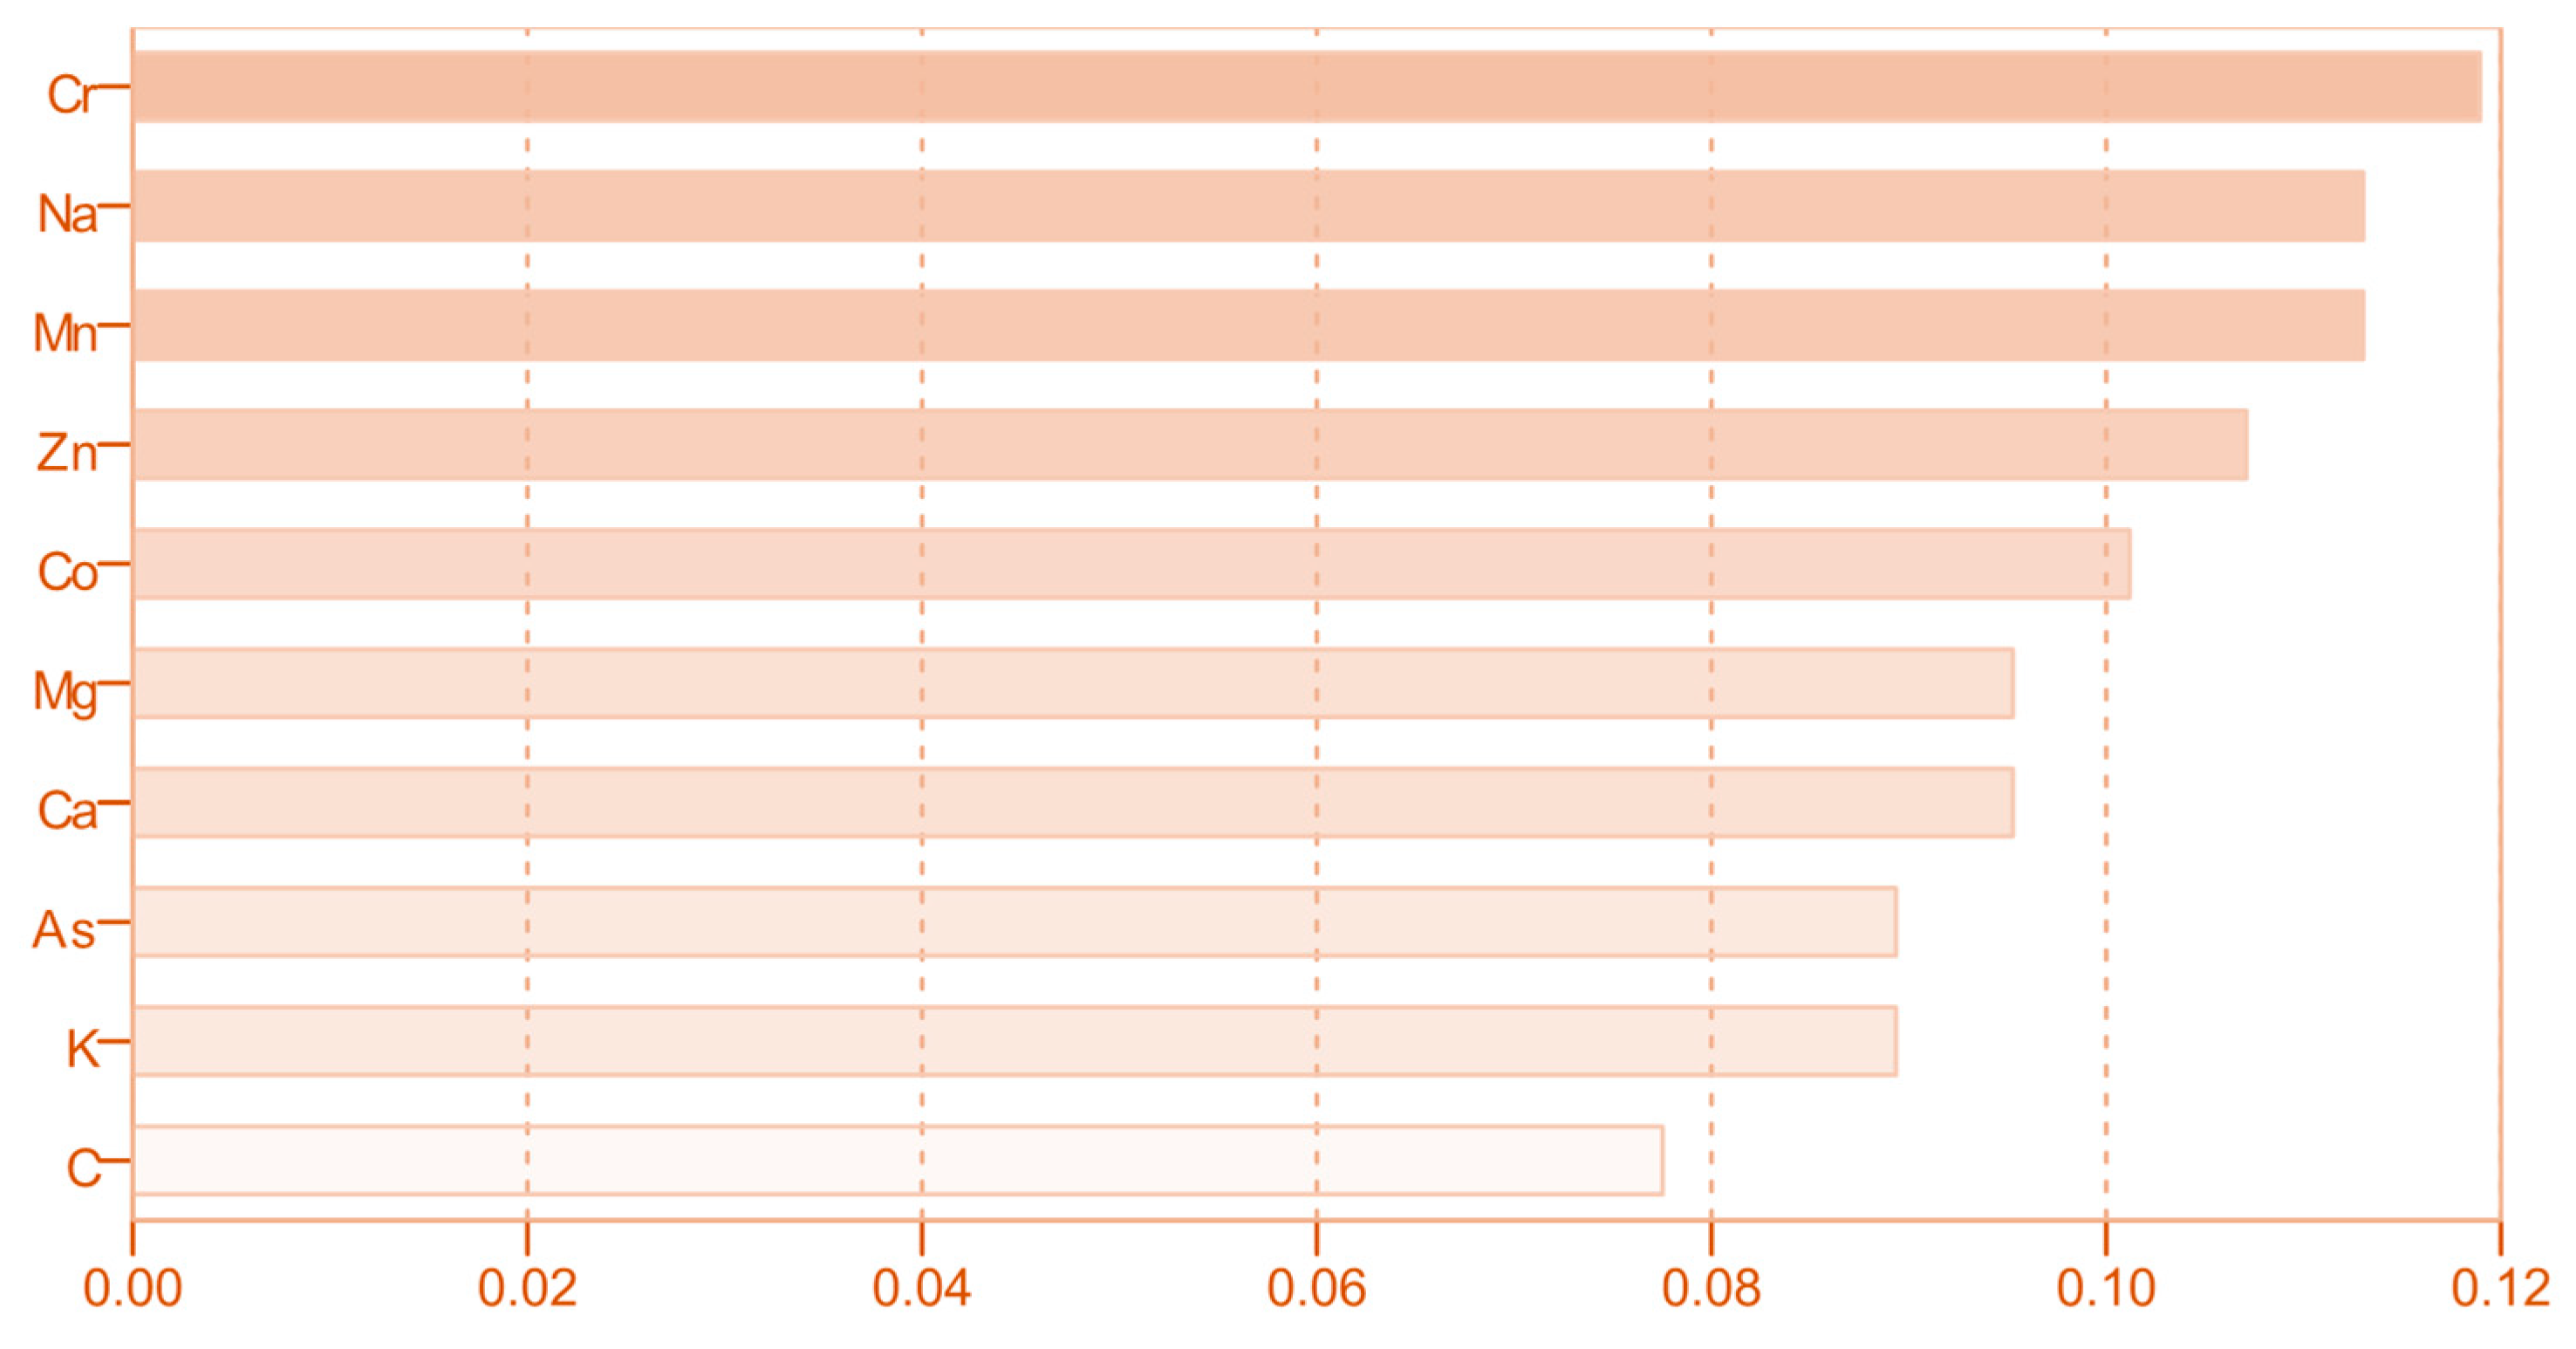
As can be observed in Table 4, the obtained results are very low compared with LDA. For the training set, eight samples were misclassified (one apple juice sample was put in the orange juice group, five orange juices were wrongly assigned to the other two groups, and three juices from the third group were placed in the orange juice group), a fact that provided a percent of 82.4% correct assignments. In the testing phase of the model, the value obtained for classification was 81.8%. In this case, two samples from the apple group were placed in the mixed fruit group and two samples from the orange group were distributed to the other group. Surprisingly, all the samples from the third group, in the testing step, taking into consideration the variability here, were correctly assigned.
In this case, the most significant contributions (Figure 7) to this classification were given by Cr, Na, Mn, Zn, among other features. By the forward selection option, a certain feature is selected if the model results in the smallest error. It is interesting that the obtained markers are complementary to those obtained from LDA. Another previous study, which investigated the distribution of egg yolk between two grouping systems (backyard and barn), reached the same conclusion. LDA and k-NN, even if they are both classification methods, provide complementary markers [47].
Some recently published studies in the literature stated that, based on electrochemical fingerprint, followed by exploratory data analysis, three types of fruit juices (apple, orange and grapefruit) could be distinguished according to type of fruit. In the same study, a clear differentiation between two types of apple juices (concentrated and non-concentrated) was obtained, a fact that reinforced the potential of this comprehensive approach [48].
The k-nearest neighbor (kNN) algorithm implemented in Python to classify fruit juice samples based on isotopic and elemental features had the following stages: standard scaling (mean-variance autoscaling), the optimal number of neighbors was selected via grid search, using stratified k fold on training set Model performance was assessed on both training and testing sets using accuracy, precision, recall, F1-score (macro/micro), confusion matrices and AUC. A separate 5-fold cross-validation confirmed the model’s prediction capabilities and highlighted the most discriminative variables.
For the same dataset k-NN was implemented in Anaconda notebook; the results are presented below. The optimum number of neighbors was 1, and the features received the F-score as followed: Co = 6.213821, δ13C = 4.732673, Pb = 4.451300, Mn = 3.873651, K = 3.761525, Cu = 3.091055, δ18O = 3.034481, Ca = 2.874591, Zn = 2.717297, Fe = 2.171628, δ2H = 2.100974, Na = 1.779755, Sr = 1.726436, Mg = 1.680934, Cr = 1.187886, As = 1.036946, Rb = 0.889065, Ni = 0.085812. A high F-score means that the features’ average values differ significantly across classes, indicating strong prediction power. The evaluation of k-NN with optimized number of neighbors gave an accuracy of 1 for the training set, and 0.455 for the testing set. The confusion matrix and performance parameters are presented below, in Table 8.
The gap that occurred between macro and micro metrics was somewhat expected, given the small sample size and uneven class distribution. The particularly low macro-average on the test set indicates that minority classes were poorly classified, and that the model’s performance was higher for the majority class. Further studies could imply stratified cross-validation, using class-weighted loss functions or employing data augmentation strategies. For the second classification, k-NN modeling was conducted using the same parameters as in the previous case. The results were improved, reaching a percent of 97% for the training set (only one sample of apple juice was misclassified), while the testing stage resulted in an overall classification of 82.4%. The results are summarized in Table 9.
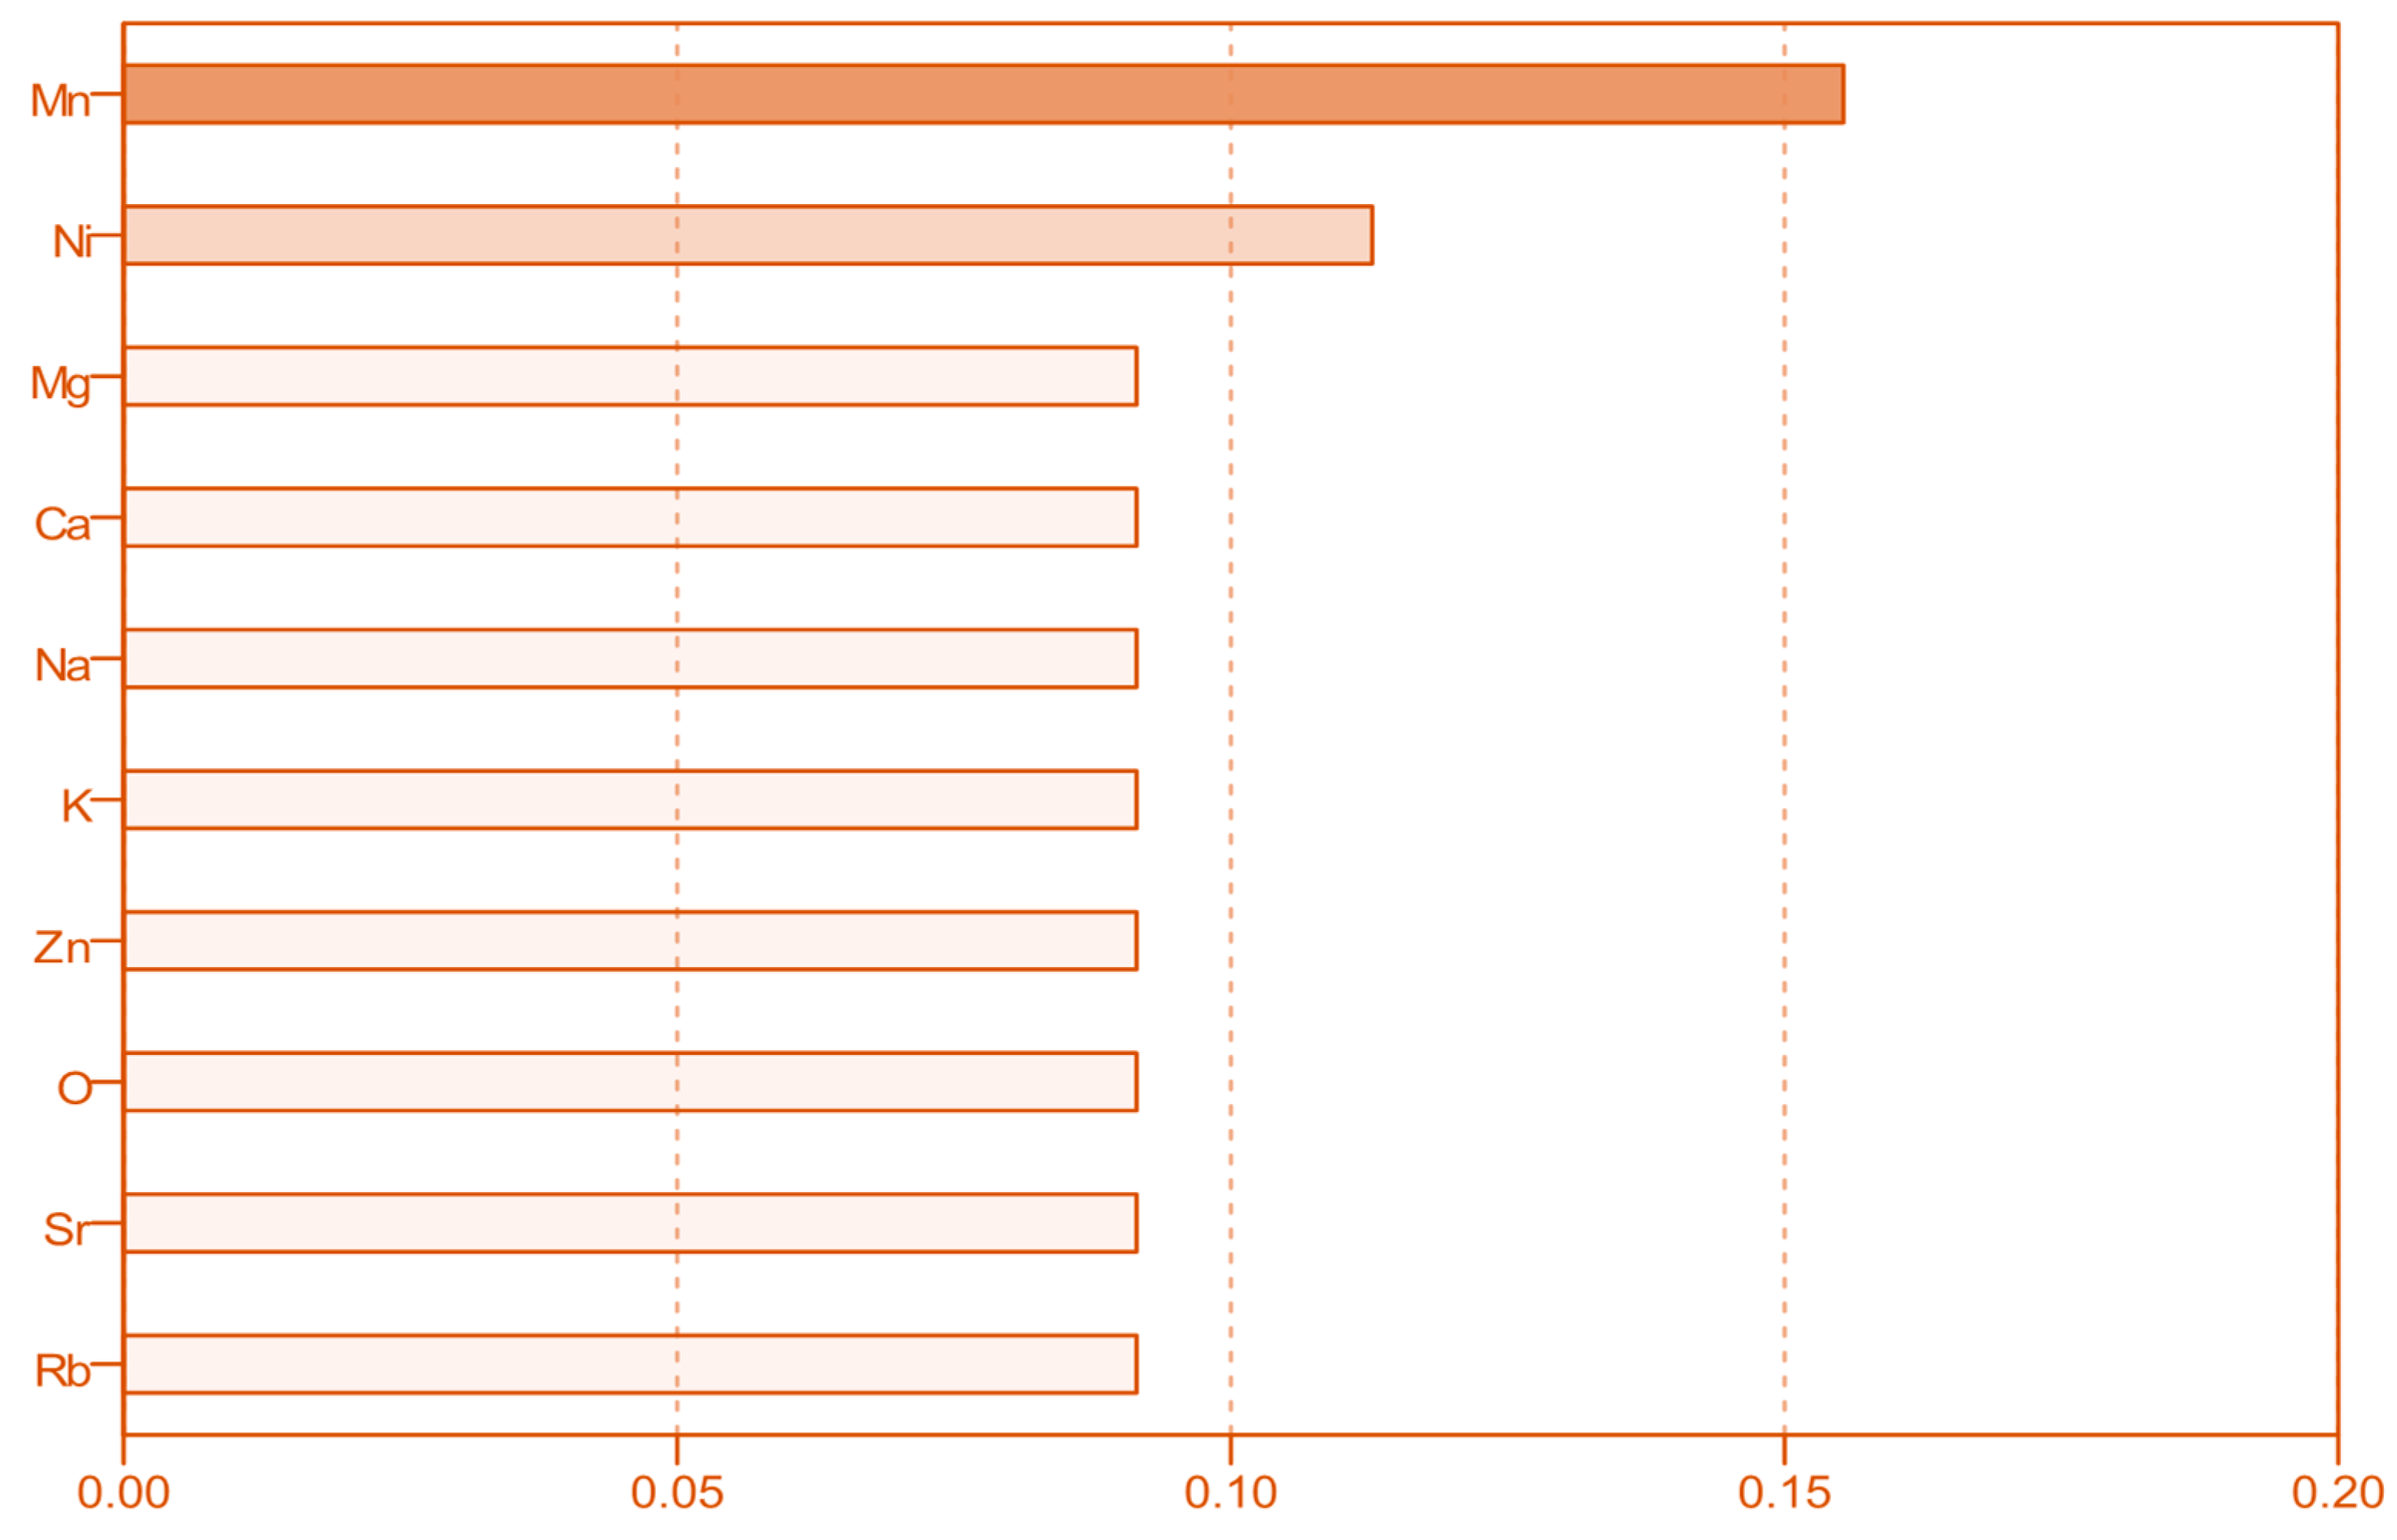
The decreasing order of main discriminant features is presented in Figure 8. In the herein case, some of the obtained markers are complementary to those obtained from LDA.
For the same dataset k-NN was implemented in Anaconda notebook; the results are presented below. The optimum number of neighbors was 1 (established via grid search procedure), and the features received the F-score as followed: Pb = 8.280409, δ18O = 7.592272, Co = 6.095005, δ2H = 5.280132, Na = 3.741775, Fe = 3.260273, Sr = 3.039438, Zn = 2.918290, Mg = 2.556000, δ13C = 2.471367, Ca = 2.018293, Cu = 1.828603, Cr = 1.677375, Mn = 1.486894, K = 0.110866, Ni = 0.076611, As = 0.002599, Rb = 0.002512. The presented F-scores were computed using a univariate ANOVA F-test, which compares the variance of the feature values between groups to the variance within each group. A high F-score means that the feature’s average values differ significantly across classes, indicating it’s a useful predictor, while a low F-score suggests that the feature does not separate the classes well and may be less informative.
The evaluation of k-NN with optimized number of neighbors gave an accuracy of 1 for the training set, and 0.733 for the testing set. The confusion matrix and performance parameters are presented below, in Table 10. Although the k-NN model achieved perfect accuracy on the training set, for the test set, the performance was a little bit lower (0.733), indicating an overfitting phenomenon. In order to overcome this inconvenience, several strategies were implemented, which included feature selection using SelectKBest method and hyperparameter tuning via GridSearchCV. A stratified 5-fold cross-validation was also conducted to better estimate generalization performances.
The k-NN algorithm provided the same degree of separation, the best markers in this case being Na, Mg and K.
For the same dataset k-NN was implemented in Anaconda notebook; the results are presented below. The optimum number of neighbors was 1, and the features received the F-score as followed: K = 299.945575, Mg = 103.012821, Mn = 56.399466, Cu = 53.028053, Ca = 51.541488, Fe = 41.014175, Na = 30.621821, H = 29.613217, O = 25.851024, Zn = 17.433719, Rb = 15.781985, Cr = 14.099524, Sr = 11.899781, C = 10.362635, Co = 9.817302, Ni = 8.355571, As = 7.205356, Pb = 3.540496. The evaluation of k-NN with optimized number of neighbors gave an accuracy of 1 for both datasets. The confusion matrix and performance parameters are presented below, in Table 11.
As in the case of LDA, when a perfect separation was obtained for apples classification (processed vs. freshly squeezed), the limited number of samples, as well as class imbalance from the testing set should be considered. Future studies should validate these findings on larger datasets and consider additional evaluation strategies, such as stratified cross-validation or external validation, to provide more reliable performances.

3.3.3. Development of ANNs for Fruit Juices Classifications

For the enhancement of previous results, the ANNs were applied. The first neuronal network model was assembled using the first data matrix with 73 juice samples, having as characteristics the isotopic and elemental contents. Its purpose is to classify the juice samples into the three fruit classes: apples, oranges and other fruits. Thus, the network architecture includes 18 input neurons, corresponding to 18 measured parameters, and 3 output neurons, corresponding to the three classification classes (apples, oranges, other fruits). All variables were min–max normalized to ensure an equal contribution before any other step. The sample set was split randomly between training (70%) and testing (30%) subgroups, based on relative number of samples. The number of units from the hidden layer was automatically selected between 1 and 50, while the training of the network was made in batch mode. Optimization was made by applying a scale conjugate gradient. The hidden and the output layers used a hyperbolic tangent and Softmax function, respectively.
As in the case of LDA and k-NN, the result of classification was not satisfactory, around 78.4% for the training subset and 68.2% for the testing subset. The most significant contribution to this classification, based on the importance of independent variables in the importance chart, in decreasing order, was given by the following: Mn, K, Na, As, δ13C, Cr and Ca. The AUC values were 0.703, 0.877 and 0.965 for the three investigated classes, the resulting macro-AUC being 0.848, suggesting that the model does not perfectly fit the experimental data and does not perfectly separate between the three classes.
The main characteristics that were used for implementing ANNs in Python are described below. Firstly, all features (18 variables corresponding to isotopic and elemental content) were scaled with StandardScaler to normalize the input variables. The target variable was encoded using numeric values corresponding to each, for multi-class classification. The ANN model was constructed using Keras. The following parameters were selected for optimization: number of hidden layers (1–2), neurons per layer (16, 32 or 64), and a dropout layer (rate 0.1–0.3) applied after each dense layer to prevent overfitting. The ReLU activation function was used for hidden layers, and Softmax for the output layer. The model was compiled using the Adam optimizer, sparse categorical cross-entropy, and accuracy as the evaluation metric. Hyperparameter tuning was performed via GridSearchCV, including parameters such as number of epochs (50–100), batch size (16–64), dropout rate and hidden layer structure. A 5-fold stratified cross-validation was employed to ensure generalization, and the best model was refit on the entire training data. Model performance was evaluated on both training and test sets using confusion matrices and classification metrics (accuracy, precision, recall, F1-score), including both macro and micro averages. Finally, SHAP (Shapley additive explanation) was applied to assess feature importance and model interpretability. This approach is a powerful tool in machine learning analysis, which assigns importance values to each characteristic from the model, corresponding to its contribution to the final model prediction.
After implementing the ANNs in Anaconda notebook, for the first classification, the following results were obtained (Table 12). The optimized parameters in this case were as follows: batch size: 16; number of epochs: 50; dropout rate: 0.1; number of hidden layers: 1; number of neurons: 32.
In the training phase, the model exhibited good prediction for the “orange group” (92.31%) and lower for the other two groups, and this tendency was maintained in the testing step, but with lower accuracy. The diminished values of AUC from training to testing phase suggest a reduced discrimination potential for new data, especially for less representative classes. The second use of ANNs was for the prediction of fruit juices, using the sample set containing only apple and orange juices. In this case, all the running parameters were the same as in the previous case. The architecture was identical for the input layer, containing 18 neurons, while the output layer contained only 2 neurons, corresponding to the apple and orange juice classes. The results were very much improved: 100% for the training subset and 91.7% for the testing subset. The most significant parameters were Mn, Pb, Zn, Mg, Co and Na. Among these predictors, some of them are essential elements (Zn, Co) and are required by the human body, but heavy metals like (Pb) are potentially toxic to humans [49]. Also, the graphical representation of the ROC is improved; the two curves, corresponding to the two classes, are quite high, suggesting a well-fitted model. The AUC values were 0.981 for both groups. The results are presented in Table 13, presented below:
After implementation of ANNs in Anaconda notebook, the optimized parameters in this case were as follows: batch size: 16; number of epochs: 100; dropout rate: 0.1; number of hidden layers: 1; number of neurons: 32. The following results were obtained (Table 14).
The difference between micro and macro precision from the training and testing phases is an indicator of the fact that the model has limited generalization capabilities, especially when using small sample datasets.
The last type of ANNs was applied to predict the method of obtaining apple juices (processed vs. freshly squeezed). All the running parameters were the same as in previous case, the architecture was identical for the input layer, containing 18 neurons, while the output layer contained only 2 neurons, corresponding to processed apple juices (code 1), having a regular label, and freshly squeezed class (code 2), having a special mark “100% fruit juices not from concentrate, without added sugar”. This is the best obtained model (Table 15), with the best evaluation parameters (AUC = 1 for both classes and perfect representation of ROC). All the results suggested a perfect discrimination, with the most representative factors being the content of 13C, K, Mg and Ca.
After implementation of ANNs in Anaconda notebook, the optimized parameters in this case were as follows: batch size: 16; number of epochs: 50; dropout rate: 0.1; number of hidden layers: 1; number of neurons: 16 (Table 16).
As in the case of LDA and k-NN, these optimal accuracies obtained for both training and testing data should be interpreted in the context of a small dataset (13 processed apple juices and 28 freshly squeezed apple juices). Future studies should take into consideration the confirmation power of the model with a larger data sample set. In the case of three classification, after average rank of obtained features, the marker list consisted of Ca, K, Mn and Zn, while for apple vs. orange, it consisted of Cu, Cr, Mn and Mg. The characteristic order for apple juice classification was Mn, Rb, δ13C and K. Regarding the main predictors that were selected according to the SHAP method, Na and Mg were highlighted for all three classifications. Moreover, for commercial juices, besides Na and Mg, K was given as the main predictor. In order to test the predictive ability, the stratified 5-fold cross-validation was also implemented in Python, for each prediction algorithm (LDA, k-NN and ANN) for all three classification datasets. The comparative results are presented in Table 17 below:
As can be observed from Table 17, for the classification of commercial juices (three classes), the performances of all three algorithms are modest, around 0.6%, but when the binary classes (orange vs. apples) were classified, the sensitivity achieved higher values with k-NN and ANN rather than LDA, although k-NN showed lower specificity, compared with ANN. For the last classification (processed apples vs. freshly squeezed apples), all three machine learning algorithms achieved maximum accuracy, sensitivity, specificity and AUC, suggesting well-separated clusters with low variability. Anyway, in the context of a small dataset available in the herein case, this result should be interpreted carefully and future studies should consider larger datasets, with a clear class balance.
The studies published by [9,21,50] revealed a few classification approaches, based on multiple spectroscopic methods (UV–visible, NIR, fluorescence and 1H-NMR) combined with machine learning models (SVM and ANN) for detection and classification of adulterants in apple juice concentrate. It was proven that through the association between spectroscopic and machine learning techniques, unique insights could be provided. The association between an analytical technique and a chemometric approach should be very wisely chosen, depending very much on its purpose.
In the present study, the association between IRMS and ICP-MS data fusion and machine learning algorithms was conducted to highlight several points: δ2H isotopic results confirmed that almost all juices (except two samples) are obtained from concentrates re-diluted with tap water. Regarding the 13C values, among 37 orange juices, 14 samples had values higher than those for C3 plants, confirming the presence of exogenous sugars from C4 plants. For “the other fruit juices” group, one sample, with a value of −17.7‰, was found to contain C4 sugars. The average concentration values for most of the elements investigated in the analysis of commercial apple juice samples are lower than the average levels obtained for orange juice samples. Regarding experimental data processing, two approaches were conducted, as follows: the first was implemented directly in SPSS software, by applying default parameters for each algorithm (LDA, k-NN and ANN), while in the second case, a more rigorous configuration was implemented in Anaconda Notebook, and key parameters were aligned in order to ensure a fairer comparison. This dual processing strategy allowed the enhancement of experimental data interpretability and highlighted the model performances, even within the case of small datasets with class imbalance. Regarding the disproportion among the three investigated class juices (apples n = 41, oranges n = 37 and other fruits n = 23), micro-average accuracy is higher than the macro-average, indicating that overall performance is disproportionately influenced by the two majority classes, while the third category, “other fruits”, is misclassified. This can be attributed to juice distribution among classes and to overcome this, other classifications were made using only two classes.
It should be mentioned here that the current models were developed for a limited set of fruit juices (apple, orange and mixed juices), and their applicability to other fruit types, or products with added ingredients, has not been evaluated. Moreover, elemental and isotopic profiles can be influenced by external factors such as geographic origin, agricultural practices, seasonal variation and processing methods, which were not comprehensively covered in the present dataset. Thus, future studies should focus on expanding the dataset in terms of diversity and quantity, incorporating metadata and exploring model adaptability across different production systems and sample types.

4. Conclusions

The present study showed the feasibility of using isotopic and elemental fingerprints in combination with chemometrics as a screening method for fruit juices authentication, within the limits of our dataset (commercial sample juices, n = 73; and freshly squeezed, n = 28). Afterward, the obtained predictive models, which were developed using three different algorithms, showed high values for both classification and prediction purposes. Among all three algorithms, ANNs provided the best results in terms of accuracy, with high values for AUC parameters for all three classifications. When three categories of fruit juices were classified, ANNs provided 78.4% correct assignments for the training set and 68.2% for the testing set, using Mn, K, Na, As, Cr, Ca and δ13C. When the variability of the sample set was lowered, by omitting the class that contained sample juices obtained from other fruits except oranges and apples, the percent of correct assignment increased up to 100% for the training set and 91.7% for the testing set, based on Mn, Pb, Zn, Mg, Co and Na, as principal discrimination features. For the last classification, ANNs successfully classified apple juices (100% for both subsets), according to the production system, using fewer markers: δ13C, K, Mg and Ca. The same approach was implemented in Anaconda notebook, and the obtained results followed almost the same pattern as before, meaning the three-class classification was the most difficult to perform, while the binary classification was improved, highlighting the power and the limitation of model generalization. Moreover, k-NN sometimes matched or exceeded ANN sensitivity on apples/oranges (0.918 vs. 0.918) and LDA remains competitive given its simplicity.
Also, the developed algorithms in the present study demonstrated good performance within our dataset, regarding their generalizability to unseen samples. Several points must be considered. First, the number of samples and their imbalance distribution among classes could limit the ability to predict with sufficient accuracy new samples. Juice samples might pose significant variations regarding the raw materials, composition and processing technologies, which might not have been fully captured within this dataset.
For generalizability enhancement of obtained models, future studies should include a larger dataset, covering aspects related to juice types, production systems or other conditions, along with other measured parameters. In this way the robustness and predictive power will be increased, and the risk of overfitting and class imbalance will be diminished.

Supplementary Materials

The following supporting information can be downloaded at https://www.mdpi.com/article/10.3390/beverages11050145/s1, Table S1: Fruit juices description investigated in this study.

Author Contributions

Conceptualization, I.F., A.D. and G.C.; Methodology, A.D., G.C., R.P. and D.A.M.; Software, I.F.; Validation, I.F. and D.A.M.; Formal Analysis, A.D., G.C. and R.P.; Investigation, A.D., G.C. and V.T.; Resources, I.F., A.D., G.C., D.A.M. and V.T.; Data Curation, I.F., A.D. and D.A.M.; Writing—Original Draft Preparation, I.F., G.C. and A.D.; Writing—Review and Editing, I.F., G.C., A.D. and D.A.M.; Visualization, I.F., G.C., A.D. and D.A.M.; Supervision, G.C. and D.A.M.; Project Administration, G.C. and D.A.M.; Funding Acquisition, G.C. and D.A.M. All authors have read and agreed to the published version of the manuscript.

Funding

This work was supported by the MCID through the “Nucleu” Program within the National Plan for Research, Development and Innovation 2022–2027, Contract No. 27N/2023, PN 23 24 03 01.

Institutional Review Board Statement

Not applicable.

Informed Consent Statement

Not applicable.

Data Availability Statement

The original contributions presented in this study are included in the article. Further inquiries can be directed to the corresponding author.

Conflicts of Interest

The authors declare no conflicts of interest.

Abbreviations

The following abbreviations are used in this manuscript:
LDALinear discriminant analysis
k-NNK-nearest neighbor
LODLimit of detection
LOQLimit of quantification
RSDRelative standard deviation
DFDiscriminant function
ANNArtificial neural network
IRMSIsotope ratio mass spectrometry
ICP-MSInductively coupled plasma mass spectrometry
LOOCVLeave-one-out cross-validation
SHAPShapley additive explanation
AUCArea under the curve

References

  1. Grand View Research. Fruit Beverages Market Size, Share & Trends Analysis Report. Available online: https://www.grandviewresearch.com/industry-analysis/fruit-beverages-market (accessed on 10 April 2025).
  2. Cheng, J.; Wang, Q.; Yu, J. Life cycle assessment of concentrated apple juice production in China: Mitigation options to reduce the environmental burden. Sustain. Prod. Consum. 2022, 32, 15–26. [Google Scholar] [CrossRef]
  3. Dasenaki, M.E.; Thomaidis, N.S. Quality and Authenticity Control of Fruit Juices-A Review. Molecules 2019, 24, 1014. [Google Scholar] [CrossRef]
  4. Vlad, I.M.; Butcaru, A.C.; Fîntîneru, G.; Bădulescu, L.; Stănică, F.; Toma, E. Mapping the Preferences of Apple Consumption in Romania. Horticulturae 2023, 9, 35. [Google Scholar] [CrossRef]
  5. Eurostat. APRO_CPSH1—Custom Dataset. Available online: https://ec.europa.eu/eurostat/databrowser/view/apro_cpsh1__custom_16005223/default/bar?lang=en (accessed on 2 April 2025).
  6. Xu, L.; Xu, Z.; Liao, X. A review of fruit juice authenticity assessments: Targeted and untargeted analyses. Crit. Rev. Food. Sci. Nutr. 2021, 22, 6081–6102. [Google Scholar] [CrossRef] [PubMed]
  7. Katerinopoulou, K.; Kontogeorgos, A.; Salmas, C.E.; Patakas, A.; Ladavos, A. Geographical Origin Authentication of Agri-Food Products: A Review. Foods 2020, 9, 489. [Google Scholar] [CrossRef] [PubMed]
  8. Liu, X.; Mu, J.; Tan, D.; Mao, K.; Zhang, J.; Ahmed Sadiq, F.; Sang, Y.; Zhang, A. Application of stable isotopic and mineral elemental fingerprints in identifying the geographical origin of concentrated apple juice in China. Food Chem. 2022, 391, 133269. [Google Scholar] [CrossRef]
  9. Cavdaroglu, C.; Altug, N.; Serpen, A.; Őztop, B. Comparative performance of artificial neural networks and support vector machines in detecting adulteration of apple juice concentrate using spectroscopy and time domain NMR. Food Res. Int. 2025, 201, 115616. [Google Scholar] [CrossRef]
  10. Kelly, S.; Heaton, K.; Hoogewerff, J. Tracing the geographical origin of food: The application of multi-element and multi-isotope analysis. Trends Food Sci. Technol. 2005, 16, 555–567. [Google Scholar] [CrossRef]
  11. Niu, H.; Zhang, M.; Yu, Q.; Liu, Y. Status and trends of artificial intelligence in the R&D of future fruit & vegetable juices. Innov. Food Sci. Emerg. Technol. 2024, 97, 103796. [Google Scholar] [CrossRef]
  12. Calle, J.L.P.; Ferreiro-González, M.; Ruiz-Rodríguez, A.; Fernández, D.; Palma, M. Detection of Adulterations in Fruit Juices Using Machine Learning Methods over FT-IR Spectroscopic Data. Agronomy 2022, 12, 683. [Google Scholar] [CrossRef]
  13. Mac, H.X.; Pham, T.T.; Ha, N.T.T.; Nguyen, L.L.P.; Baranyai, L.; Friedrich, L. Current Techniques for Fruit Juice and Wine Adulterant Detection and Authentication. Beverages 2023, 9, 84. [Google Scholar] [CrossRef]
  14. Harmankaya, M.; Gezgin, S.; Özcan, M.M. Comparative evaluation of some macro- and micro-element and heavy metal contents in commercial fruit juices. Environ. Monit. Assess. 2012, 184, 5415–5420. [Google Scholar] [CrossRef]
  15. Dehelean, A.; Magdas, D.A. Analysis of mineral and heavy metal content of some commercial fruit juices by inductively coupled plasma mass spectrometry. Sci. World J. 2013, 2013, 215423. [Google Scholar] [CrossRef]
  16. Huang, Y.; Wang, D.; Zhong, Q.; Feng, D.; An, H.; Yue, H.; Wu, Z.; Zhang, L.; Guo, X.; Wang, S.F. Application of gas chromatography-stable isotope mass spectrometry to determine the oxygen isotope ratio of water in concentrated fruit juice. J. Agric. Food Res. 2024, 15, 100940. [Google Scholar] [CrossRef]
  17. Magdas, D.A.; Cristea, G.; Puscas, R.; Tusa, F. The use of isotope ratios in commercial fruit juices authentication. Rom. J. Phys. 2013, 59, 355–359. [Google Scholar]
  18. Danezis, G.P.; Tsagkaris, A.S.; Camin, F.; Brusic, V.; Georgiou, C. Food authentication: Techniques, trends & emerging approaches. Trends Anal. Chem. 2016, 85, 123–132. [Google Scholar] [CrossRef]
  19. Borràs, E.; Ferré, J.; Boqué, R.; Mestres, M.; Aceña, L.; Busto, O. Data Fusion Methodologies for Food and Beverage Authentication and Quality Assessment—A Review. Anal. Chim. Acta 2015, 891, 1–14. [Google Scholar] [CrossRef]
  20. Messai, H.; Farman, M.; Sarraj-Laabidi, A.; Hammami-Semmar, A.; Semmar, N. Chemometrics Methods for Specificity, Authenticity and Traceability Analysis of Olive Oils: Principles, Classifications and Applications. Foods 2016, 5, 77. [Google Scholar] [CrossRef]
  21. Rasekh, M.; Karami, H. E-nose coupled with an artificial neural network to detection of fraud in pure and industrial fruit juices. Int. J. Food Prop. 2021, 24, 592–602. [Google Scholar] [CrossRef]
  22. Granato, D.; Putnik, P.; Kovačević, D.B.; Sousa Santos, J.; Calado, V.; Silva Rocha, R.; Gomes Da Cruz, A.; Jarvis, B.; Rodionova, O.Y.; Pomerantsev, A. Trends in Chemometrics: Food Authentication, Microbiology, and Effects of Processing. Compr. Rev. Food Sci. Food Saf. 2018, 17, 663–677. [Google Scholar] [CrossRef]
  23. Funes, E.; Allouche, Y.; Beltrán, G.; Jiménez, A. A Review: Artificial Neural Networks as Tool for Control Food Industry Process. J. Sens. Technol. 2015, 5, 28–43. [Google Scholar] [CrossRef]
  24. Goyal, S. Artificial Neural Networks in Fruits: A Comprehensive Review. Int. J. Image Graph. Signal Process. 2014, 6, 53–63. [Google Scholar] [CrossRef]
  25. Oerter, E.; Malone, M.; Putman, A.; Drits-Esser, D.; Stark, L.; Bowen, G. Every Apple Has a Voice: Using Stable Isotopes to Teach about Food Sourcing and the Water Cycle. Hydrol. Earth Syst. Sci. 2017, 21, 3799–3810. [Google Scholar] [CrossRef]
  26. Brencic, M.; Vreca, P. Identification of Sources and Production Processes of Bottled Waters by Stable Hydrogen and Oxygen Isotope Ratios. Rapid Commun. Mass Spectrom. 2006, 20, 3205–3212. [Google Scholar] [CrossRef] [PubMed]
  27. Cristea, G.; Dehelean, A.; Puscas, R.; Covaciu, F.-D.; Hategan, A.R.; Müller Molnár, C.; Magdas, D.A. Characterization and Differentiation of Wild and Cultivated Berries Based on Isotopic and Elemental Profiles. Appl. Sci. 2023, 13, 2980. [Google Scholar] [CrossRef]
  28. Available online: https://wikifarmer.com/library/en/article/orange-tree-climate-and-soil-requirements (accessed on 8 April 2025).
  29. Cristea, G.; Dehelean, A.; Voica, C.; Feher, I.; Puscas, R.; Magdas, D.A. Isotopic and Elemental Analysis of Apple and Orange Juice by Isotope Ratio Mass Spectrometry (IRMS) and Inductively Coupled Plasma—Mass Spectrometry (ICP-MS). Anal. Lett. 2021, 54, 212–226. [Google Scholar] [CrossRef]
  30. Magdas, D.A.; Puscas, R. Stable isotopes determination in some Romanian fruit juices. Isot. Environ. Health Stud. 2011, 47, 372–378. [Google Scholar] [CrossRef]
  31. Camin, F.; Bontempo, L.; Perini, M.; Piasentier, E. Stable Isotope Ratio Analysis for Assessing the Authenticity of Food of Animal Origin. Compr. Rev. Food Sci. Food Saf. 2016, 15, 868–877. [Google Scholar] [CrossRef]
  32. Simpkins, W.A.; Louie, H.; Wub, M.; Harrison, M.; Goldberg, D. Trace elements in Australian orange juice and other products. Food Chem. 2000, 71, 423–433. [Google Scholar] [CrossRef]
  33. FAO; WHO. Codex Alimentarius Commission (2024). General Standard for Contaminants in Food and Feed (GSCTFF). Joint FAO/WHO Food Standards Programmer, Contaminants in foods. Codex Alimentarius. Available online: https://www.fao.org/fao-who-codexalimentarius/thematic-areas/contaminants/en/ (accessed on 15 April 2025).
  34. US Environmental Protection Agency (EPA). National Primary Drinking Water Regulations; US Environmental Protection Agency (EPA): Washington, DC, USA, 2018.
  35. World Health Organization (WHO). Guidelines for Drinking-Water Quality, 4th ed.; World Health Organization (WHO): Geneva, Switzerland, 2017.
  36. Bao, S.X.; Wang, Z.H.; Liu, J.S. X-ray fluorescence analysis of trace elements in fruit juice. Spectrochim. Acta Part B At. Spectrosc. 1999, 54, 1893–1897. [Google Scholar] [CrossRef]
  37. Demir, F.; Kipcak, A.S.; Dere Ozdemir, O.; Moroydor Derun, E. Determination of essential and non-essential element concentrations and health risk assessment of some commercial fruit juices in Turkey. J. Food Sci. Technol. 2020, 57, 4432–4442. [Google Scholar] [CrossRef]
  38. Madeja, A.S.; Welna, M. Evaluation of a simple and fast method for the multi-elemental analysis in commercial fruit juice samples using atomic emission spectrometry. Food Chem. 2013, 141, 3466–3472. [Google Scholar] [CrossRef]
  39. Farid, S.M.; Enani, M.A. Levels of trace elements in commercial fruit juices in Jeddah, Saudi Arabia. Med. J. Islam. World Acad. Sci. 2010, 18, 31–38. [Google Scholar]
  40. Krejpcio, Z.; Sionkowski, S.; Bartela, J. Safety of fresh fruits and juices available on the polish market as determined by heavy metal residues. Pol. J. Environ. Stud. 2005, 14, 877–881. [Google Scholar]
  41. Velimirović, D.S.; Mitić, S.S.; Tošić, S.B.; Kaličanin, B.M.; Pavlović, A.N.; Mitić, M.N. Levels of major and minor elements in some commercial fruit juices available in Serbia. Trop. J. Pharm. Res. 2013, 12, 805–811. [Google Scholar] [CrossRef]
  42. Demir, N.; Acar, J. An investigation on the mineral contents of some fruit juices marketed in Ankara. GIDA 1995, 20, 305–311. [Google Scholar]
  43. Barners, K.W. The Analysis of Trace Metals in Fruit, Juice and Juice Production Using a Dual-View Plasma. Perkin Elmer Instruments. 2017. Available online: https://www.perkinelmer.com.cn/PDFs/downloads/APP_TraceMetalsinFruitJuicesViewPlasma.pdf (accessed on 13 April 2025).
  44. Akhtar, S.; Ali, J.; Javed, B.; Khan, F.A. Studies on the preparation and storage stability of pomegranate juice based drink. Middle-East J. Sci. Res. 2013, 16, 91–195. [Google Scholar]
  45. Bayızıt, A.A. Analysis of mineral content in pomegranate juice by ICP-OES. Asian J. Chem. 2010, 8, 6542–6546. [Google Scholar]
  46. Cámara, M.; Domínguez, L.; Medina, S.; Mena, P.; García-Viguera, C. A Comparative Analysis of Folate and Mineral Contents in Freshly Squeezed and Commercial 100% Orange Juices Available in Europe. Nutrients 2024, 16, 3605. [Google Scholar] [CrossRef]
  47. Cristea, G.; Covaciu, F.-D.; Feher, I.; Puscas, R.; Voica, C.; Dehelean, A. Multivariate Modelling Based on Isotopic, Elemental, and Fatty Acid Profiles to Distinguish the Backyard and Barn Eggs. Foods 2024, 13, 3240. [Google Scholar] [CrossRef]
  48. Monago-Maraña, O.; Palenzuela, A.Z.; Crevillén, A.G. Untargeted authentication of fruit juices based on electrochemical fingerprints combined with chemometrics. Adulteration of orange juice as case of study. LWT 2024, 209, 116797. [Google Scholar] [CrossRef]
  49. James, V.R.; Panchal, H.J.; Shah, A.P. Estimation of selected elemental impurities by inductively coupled plasma-mass spectroscopy (ICP-MS) in commercial and fresh fruit juices. Environ. Monit. Assess. 2023, 195, 1390–1404. [Google Scholar] [CrossRef]
  50. Fortunato de Carvalho Rocha, W.; Bezerra do Prado, C.; Blonder, N. Comparison of chemometric problems in food analysis using non-linear methods. Molecules 2020, 25, 3025. [Google Scholar] [CrossRef]
Figure 1. δ2H versus δ18O for studied fruit juices.
Beverages 11 00145 g001
Figure 2. Comparison of the isotopic fingerprints of processed and directly pressed apple juices.
Beverages 11 00145 g002
Figure 3. Box diagram for the fruit juice samples. The line across the box represents the median. Whiskers indicate the higher and lower values in the entire data range. Circles represent outliers. Crosses indicate mean markers.
Beverages 11 00145 g003
Figure 4. Juices samples distribution after LDA processing, using significant isotopic and multielemental content. The numbers represent the group centroids as follows: 1 for apple, 2 for orange and 3 for other fruits, respectively.
Beverages 11 00145 g004
Figure 5. Apple and orange juice distribution after LDA.
Beverages 11 00145 g005
Figure 6. The differentiation between processed and freshly squeezed apple juices, after applying LDA.
Beverages 11 00145 g006
Figure 7. The strongest elemental and isotopic markers for different fruit juice distribution.
Beverages 11 00145 g007
Figure 8. The strongest elemental and isotopic markers for commercial distribution of apple and orange juices.
Beverages 11 00145 g008
Table 2. Published literature data regarding essential (Na, Mg, K, Ca, Cr, Mn, Fe, Co, Cu and Zn) and non-essential elements (Ni, As and Pb) levels in apple and orange fruit juices.
ElementConcentration (mg/L)
AppleOrangeRefs.
Na-88.00[36]
20.0039.80[15]
22.907.70[37]
20.3051.70This study
Mg-29.00[36]
44.3071.20[38]
44.7051.20[15]
33.0473.30[37]
38.1060.06This study
K-825[36]
371.00277.20[15]
896.001350.00[37]
514.9623.1This study
Ca-52.00[36]
83.401082.00[38]
51.3043.30[15]
64.10-[37]
43.1180.24This study
Concentration (μg/L)
Cr6.305.90[39]
22.009.00[38]
20.6014.20[15]
12.00-[37]
308.99203.09This study
Mn23.4020.90[39]
-200.00[36]
406.00316.00[38]
242.03120.27[15]
256.05120.68This study
Fe325.00361.00[39]
-4900.00[36]
1790.00549.00[38]
227.00455.00[37]
824.22425.76This study
Co8.007.90[39]
13.772.47[15]
4.894.63This study
Cu317.00500.00[39]
283.00245.00[40]
-130.00[36]
83.00198.00[38]
86.17132.83[15]
7.0048.00[37]
139.92231.41This study
Zn524.00895.00[39]
550.001177.00[40]
-4700.00[36]
210.00235.00[38]
230.00180.56[15]
15.0049.00[37]
163.19299.36This study
Ni6.205.70[39]
-100.00[36]
69.0063.00[38]
80.6479.23[15]
BDL *BDL *[37]
137.1770.22This study
As1.731.04[15]
0.200.35This study
Pb130.0095.00[40]
670.00-[38]
22.713.28[15]
58.00BDL *[37]
0.270.32This study
* BDL—below detection limit.
Table 3. Published literature data regarding essential (Na, Mg, K, Ca, Cr, Mn, Fe, Co, Cu and Zn) and non-essential elements (Ni and Pb) levels in other fruit juices (cherry, apricot, peach, grape and pomegranate).
ElementConcentration (mg/L)
CherryApricotPeachGrapePomegranateRefs.
Na-79.8052.00--[15]
75.80-50.5888.20-[41]
68.4068.3050.51--[42]
-30.00---[43]
----96.02[44]
----133.00[45]
23.003.074.7617.0116.00[37]
193.8079.8052.00-132.70This study
Mg---48.80-[38]
-34.8032.30--[15]
39.90-24.6032.20-[41]
91.00150.90110.70--[42]
-50.00---[43]
----67.20[44]
----13.80[45]
31.4030.8127.7071.0161.70[37]
142.2034.8032.30-13.80This study
K-339.70191.80--[15]
157.00 185.00144.00 [41]
264.001046.00679.00 [42]
1140.00 [43]
1283.00 [44]
207.00 [45]
565.001038.00842.001080.00941.00[37]
756.90339.70191.80-207.50This study
Ca 123.00 [38]
-48.7032.90--[15]
42.80 38.6049.40 [41]
54.70102.0542.90 [42]
70.00 [43]
107.53[44]
0.42[45]
68.8066.0953.80177.00162.00[37]
107.4048.7032.90-0.40This study
Concentration (μg/L)
Cr---25.00-[38]
-41.2025.23--[15]
246.00-377.00330.00-[41]
7.007.0010.007.00BDL *[37]
64.3041.2025.23-82.0This study
Mn 886.00 [38]
-225.72162.77--[15]
272.00 346.00284.00 [41]
96.00[44]
15.0047.0090.0087.0013.00[37]
538.74225.72162.77-122.72This study
Fe---2750.00-[38]
5150.00-7370.005300.00-[41]
9110.0010,250.0010,290.00--[42]
-3800.00---[43]
----1810.00[44]
195.00894.00205.00343.00211.00[37]
129.273157.243635.69-60.30This study
Co-4.104.81--[15]
21.00-17.0022.00-[41]
8.804.104.81-1.23This study
Cu---1680.00-[38]
-336.78747.54--[15]
284.00-1360.00321.00-[41]
-730.00---[43]
----100.00[44]
13.0074.0083.0083.0082.00[37]
493.00336.78747.54-1120.60This study
Zn---351.00-[38]
-481.08663.97--[15]
158.00-536.00322.00-[41]
-900.00---[43]
6.0081.00830.0094.0080.00[37]
261.98481.08663.97-112.62This study
Ni---55.00-[38]
-90.8234.88--[15]
15.30-331.0041.30-[41]
----40.00[45]
BDL *18.003.00BDL *BDL *[37]
65.5290.8234.88-9.10This study
Pb 106.00 [38]
3.00[45]
BDL *121.00135.0032.0055.00[37]
0.180.440.33-0.17This study
* BDL—below detection limit.
Table 4. The LDA confusion matrices (counts and percentages) and macro- and micro-metrics obtained for three commercial classes of juices.
LDA AlgorithmAppleOrangeOther Fruits
Training
(Accuracy = 0.941)
Apple2 (22.22%)1 (11.11%)6 (66.67%)
Orange26 (100%)0 (0%)0 (0%)
Other fruits0 (0%)16 (100%)0 (0%)
RecallF1-scoreAUCPrecision
Macro0.9570.9110.9990.889
Micro0.9410.9410.9970.941
Testing
(Accuracy = 0.636)
Apple2 (50%)1 (25%)1 (25%)
Orange10 (90.91%)0 (0%)1 (9.09%)
Other fruits4 (57.14%)3 (42.86%)0 (0%)
RecallF1-scoreAUCPrecision
Macro0.6250.5400.7780.529
Micro0.6360.6360.8060.636
Table 5. The LDA confusion matrices (counts and percentages) and macro- and micro-metrics obtained for apple and orange commercial classes of juices.
LDA AlgorithmAppleOrange
Training
(Accuracy = 0.941)
Apple9 (100%)0 (0%)
Orange0 (0%)26 (100%)
PrecisionRecallF1-score
Macro111
Micro111
Testing
(Accuracy = 0.636)
Apple3 (75%)1 (25%)
Orange3 (27.27%)8 (72.73%)
PrecisionRecallF1-score
Macro0.6940.7390.700
Micro0.7330.7330.733
Table 6. The LDA confusion matrices (counts and percentages) and macro- and micro-metrics obtained for commercial apples and orange juices.
LDA AlgorithmProcessedFreshly Squeezed
Training
(Accuracy = 1)
Processed9 (100%)0 (0%)
Freshly squeezed0 (0%)19 (100%)
PrecisionRecallF1-score
Macro111
Micro111
Testing
(Accuracy = 1)
Processed4 (100%)0 (0%)
Freshly squeezed0 (0%)9 (100%)
PrecisionRecallF1-score
Macro111
Micro111
Table 7. Processed juices distribution after k-NN modeling.
PartitionPredicted
AppleOrangeOther FruitsClassifications
TrainingApple71087.5%
Orange221380.8%
Other fruits031482.4%
Overall
classifications
17.7%49.0%33.3%82.4%
TestingApple30260.0%
Orange19181.8%
Other fruits006100%
Overall
classifications
18.2%40.9%40.9%81.8%
Table 8. The k-NN confusion matrices (counts and percentages) and macro- and micro-metrics obtained for commercial juices.
k-NN PartitionAppleOrangeOther Fruits
Training
(Accuracy = 1)
Apple9 (100%)0 (0%)0 (0%)
Orange0 (0%)26 (100%)0 (0%)
Other fruits0 (0%)0 (0%)16 (100%)
PrecisionRecallF1-scoreAUC
Macro1111
Micro1111
Testing
(Accuracy = 0.455)
Apple0 (0%)3 (75%)1 (25%)
Orange0 (0%)8 (72.73%)3 (27.27%)
Other fruits0 (0%)5 (71.43%)2 (28.57%)
PrecisionRecallF1-scoreAUC
Macro0.2780.3380.3000.503
Micro0.4550.4550.4550.591
Table 9. Commercially apple and orange juice distribution after k-NN modeling.
PartitionPredicted
AppleOrangeClassifications
TrainingApple8188.9%
Orange024100%
Overall
classifications
24.3%75.8%97.0%
TestingApple1325.0%
Orange013100.0%
Overall
classifications
5.9%94.1%82.4%
Table 10. The k-NN confusion matrices (counts and percentages) and macro- and micro-metrics obtained for apples and orange juices.
k-NN PartitionAppleOrange
Training
(Accuracy = 1)
Apple9 (100%)0 (0%)
Orange0 (0%)26 (100%)
PrecisionRecallF1-score
Macro111
Micro111
Testing
(Accuracy = 0.733)
Apple1 (25%)3 (75%)
Orange1 (9.09%)10 (90.91%)
PrecisionRecallF1-score
Macro0.6350.5800.583
Micro0.7330.7330.733
Table 11. The k-NN confusion matrices (counts and percentages) and macro- and micro-metrics obtained for apple juices.
k-NN PartitionProcessedFreshly Squeezed
Training
(Accuracy = 1)
Processed9 (100%)0 (0%)
Freshly squeezed0 (0%)19 (100%)
PrecisionRecallF1-score
Macro111
Micro111
Testing
(Accuracy = 0.733)
Processed4 (25%)0 (75%)
Freshly squeezed0 (9.09%)9 (90.91%)
PrecisionRecallF1-score
Macro111
Micro111
Table 12. The ANN confusion matrices (counts and percentages) and macro- and micro-metrics obtained for commercial fruit juices.
ANN StageAppleOrangeOther Fruits
Training
(Accuracy = 0.863)
Apple6 (66.67%)2 (22.22%)1 (11.11%)
Orange0 (0%)24 (92.31%)2 (7.69%)
Other fruits0 (0%)2 (12.5%)14 (87.5%)
PrecisionRecallF1-scoreAUC
Macro0.8940.8220.8460.977
Micro0.8630.8630.8630.976
Testing
(Accuracy = 0.682)
Apple1 (25%)2 (50%)1 (25%)
Orange0 (0%)10 (90.91%)1 (9.09%)
Other fruits0 (0%)3 (42.86%)4 (57.14%)
PrecisionRecallF1-scoreAUC
Macro0.7780.5770.5950.867
Micro0.6820.6820.6820.857
Table 13. ANN results classification for commercial apple and orange juices.
SampleGroupsApple JuicesOrange JuicesClassifications
TrainingApple juices120100%
Orange juices026100%
Overall percent31.6%68.4%100%
TestingApple juices10100%
Orange juices11090.9%
Overall percent16.7%83.3%91.7%
Table 14. The ANN confusion matrices (counts and percentages) and macro- and micro-metrics obtained for apple and orange fruit juices.
ANN StageAppleOrange
Training
(Accuracy = 1)
Apple9 (100%)0 (0%)
Orange0 (0%)26 (100%)
PrecisionRecallF1-score
Macro111
Micro111
Testing
(Accuracy = 0.800)
Apple1 (25%)3 (75%)
Orange0 (0%)11 (100%)
PrecisionRecallF1-score
Macro0.8930.6250.640
Micro0.8000.8000.800
Table 15. ANN classification results for apple juices.
SampleGroupsProcessed JuiceDirectly Pressed JuiceClassifications
TrainingProcessed juice90100%
Directly pressed juice024100%
Overall percent27.3%72.7%100%
TestingProcessed juice40100%
Directly pressed juice04100%
Overall percent50%50%100%
Table 16. The ANN confusion matrices (counts and percentages) and macro- and micro-metrics obtained for apple juices.
ANN StageProcessedFreshly Squeezed
Training
(Accuracy = 1)
Processed9 (100%)0 (0%)
Freshly squeezed0 (0%)19 (100%)
PrecisionRecallF1-score
Macro111
Micro111
Testing
(Accuracy = 1)
Processed4 (100%)0 (0%)
Freshly squeezed0 (0%)9 (100%)
PrecisionRecallF1-score
Macro111
Micro111
Table 17. Stratified 5-fold cross-validation results for LDA, k-NN and ANN. Results are expressed as mean ± standard deviation.
ParameterCommercial JuicesCommercial Apple and Orange JuicesProcessed and Freshly Squeezed Apple Juices
LDAk-NNANNsLDAk-NNANNsLDAk-NNANNs
Accuracy0.669 ± 0.0900.617 ± 0.0870.698 ± 0.0850.820 ± 0.0750.820 ± 0.0400.820 ± 0.0751.0001.0001.000
Sensitivity---0.868 ± 0.1370.918 ± 0.0670.918 ± 0.0671.0001.0001.000
Specificity---0.667 ± 0.3650.467 ± 0.1250.700 ± 0.2671.0001.0001.000
AUC0.814 ± 0.0540.674 ± 0.0730.835 ± 0.0900.858 ± 0.0950.837 ± 0.1350.927 ± 0.0751.0001.0001.000
Disclaimer/Publisher’s Note: The statements, opinions and data contained in all publications are solely those of the individual author(s) and contributor(s) and not of MDPI and/or the editor(s). MDPI and/or the editor(s) disclaim responsibility for any injury to people or property resulting from any ideas, methods, instructions or products referred to in the content.