

Design and Production of an Instant Coffee Product Based on Greek Coffee Oil: Study of the Effect of Storage Conditions on Product Aroma and Quality


 and
and
Abstract

1. Introduction
2. Materials and Methods
2.1. Experimental Design
2.1.1. Raw Material
2.1.2. Coffee Oil Extraction and Treatments
2.1.3. Extraction of Coffee Water-Soluble Compounds
2.1.4. Formulation of Instant Greek Coffee Samples
2.1.5. Storage of the Optimum Instant Greek Coffee
2.2. Analytical Tools
2.2.1. Purge-And-Trap-Gas Chromatography-Mass Spectrometry Analysis
2.2.2. Mathematical Modelling
2.2.3. Sensory Evaluation
Shelf-Life Calculation Based on Sensory Quality
2.2.4. Other Measurements
2.3. Data and Statistical Analysis
3. Results and Discussion
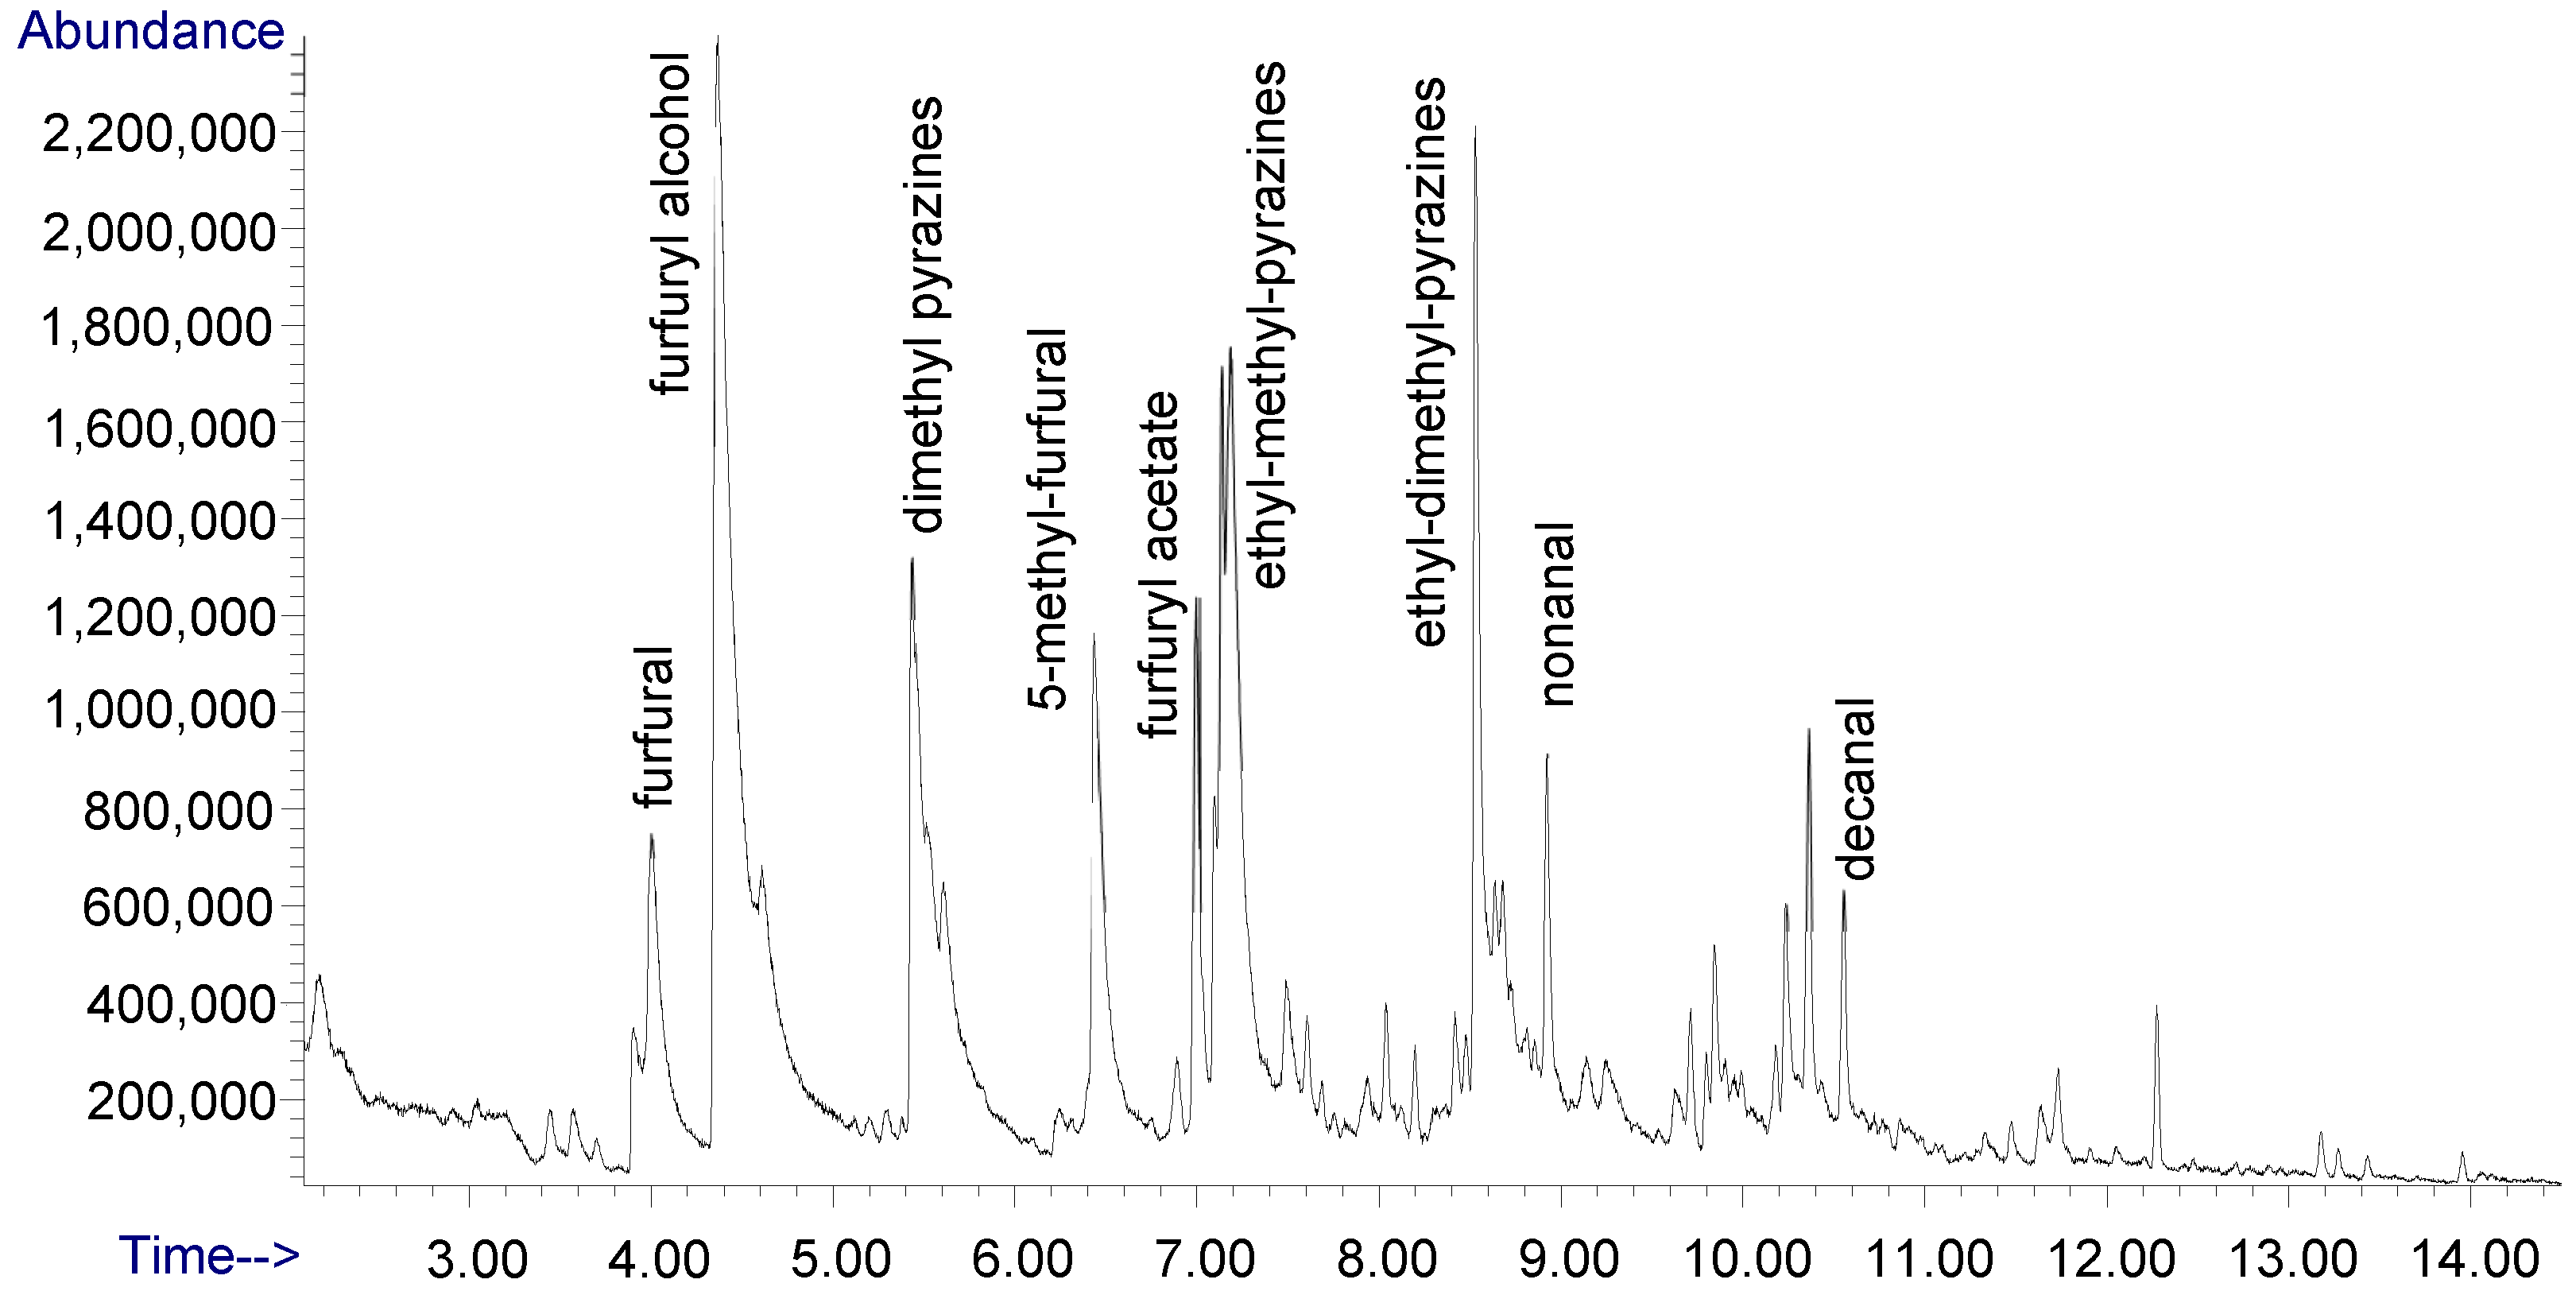
3.1. Analysis of Greek Coffee Oil Aroma
3.2. Shelf-Life Determination of the Instant Coffee Product
3.2.1. Sensory Quality Loss of the Instant Coffee Product
3.2.2. Instrumental Analysis of the Instant Coffee Product Aroma
3.2.3. Other Quality Parameters
4. Conclusions
Supplementary Materials
Author Contributions
Funding
Institutional Review Board Statement
Informed Consent Statement
Data Availability Statement
Conflicts of Interest
References
- De Melo Pereira, G.V.; De Carvalho Neto, D.P.; Magalhaes Júnior, A.I.; Vásquez, Z.S.; Medeiros, A.B.P.; Vandenberghe, L.P.S.; Soccol, C.R. Exploring the impacts of postharvest processing on the aroma formation of coffee beans—A review. Food Chem. 2019, 272, 441–452. [Google Scholar] [CrossRef] [PubMed]
- Saratale, G.D.; Bhosale, R.; Shobana, S.; Banu, J.R.; Pugazhendhi, A.; Mahmoud, E.; Sirohi, R.; Bhatia, S.K.; Atabani, A.E.; Mulone, V.; et al. A review on valorization of spent coffee grounds (SCG) towards biopolymers and biocatalysts production. Bioresour. Technol. 2020, 314, 123800. [Google Scholar] [CrossRef]
- ICO (Internacional Coffee Organization). Trade Statistics Tables. 2020. Available online: https://ico.org/what-we-do/world-coffee-statistics-database/ (accessed on 12 April 2020).
- CECAFE (Brazilian Coffee Exportes Council). Consumption. 2019. Available online: https://www.cecafe.com.br/en/about-coffee/consumption/ (accessed on 12 February 2020).
- Sanz, C.; Czerny, M.; Cid, C.; Schieberle, P. Comparison of potent odorants in a filtered coffee brew and in an instant coffee beverage by aroma extract dilution analysis (AEDA). Eur. Food Res. Technol. 2002, 214, 299–302. [Google Scholar] [CrossRef]
- Zeller, B.; Gaonkar, A.; Ceriali, S.; Wragg, A. Novel Microencapsulation System to Improve Controlled Delivery of Cup Aroma During Preparation of Hot Instant Coffee Beverages (Chapter 35). In Microencapsulation in the Food Industry; Academic Press: Cambridge, MA, USA, 2014; pp. 455–468. [Google Scholar] [CrossRef]
- Abraham-Barna, C.G. The term of Turkish coffee e a semasiological approach. J. Agroaliment. Process. Technol. 2013, 19, 271–275. [Google Scholar]
- Ozdestan, O. Evaluation of bioactive amine and mineral levels in Turkish coffee. Food Res. Int. 2014, 61, 167–175. [Google Scholar] [CrossRef]
- Yilmaz, B.; Acar-Tek, N.; Sozlu, S. Turkish cultural heritage: A cup pf coffee. J. Ethn. Foods 2017, 4, 213–220. [Google Scholar] [CrossRef]
- Küçükkömürler, S.; Özgen, L. Coffee and Turkish coffee culture. Pak. J. Nutr. 2009, 8, 1693–1700. [Google Scholar] [CrossRef]
- López, J.A.S.; Wellinger, M.; Gloess, A.N.; Zimmermann, R.; Yeretzian, C. Extraction kinetics of coffee aroma compounds using a semi-automatic machine: On-line analysis by PTR-ToF-MS. Int. J. Mass Spectrom. 2016, 401, 22–30. [Google Scholar] [CrossRef]
- Siasos, G.; Oikonomou, E.; Chrysohoou, C.; Tousoulis, D.; Panagiotakos, D.; Zaromitidou, M.; Zisimos, K.; Kokkou, E.; Marinos, G.; Papavassiliou, A.G.; et al. Consumption of a boiled Greek type of coffee is associated with improved endothelial function: The Ikaria Study. Vasc. Med. 2013, 18, 55–62. [Google Scholar] [CrossRef]
- Seninde, D.R.; Chambers, E., IV. Coffee Flavor: A Review. Beverages 2020, 6, 44. [Google Scholar] [CrossRef]
- Marek, G.; Dobrzanski, B., Jr.; Oniszczuk, T.; Cwikła, D.; Rusinek, R.; Combrzynski, M. Detection and differentiation of volatile compound profiles in roasted coffee Arabica beans from different countries using an electronic nose and GC-MS. Sensors 2020, 20, 2124. [Google Scholar] [CrossRef] [PubMed]
- Rusinek, R.; Dobrzanski, B., Jr.; Oniszczuk, A.; Siger, A.; Karami, H.; Ptaszynska, A.A.; Gawrysiak-Witulska, M.; Zytek, A.; Gancarz, M. How to identify roast defects in coffee beans based on the volatile compound profile. Molecules 2022, 27, 8530. [Google Scholar] [CrossRef] [PubMed]
- Dong, W.J.; Tan, L.H.; Zhao, J.P.; Hu, R.S.; Lu, M.Q. Characterization of fatty acid, amino acid and volatile compoundcompositions and bioactive components of seven co ee (Coffea robusta) cultivars grown in Hainan province, China. Molecules 2015, 20, 16687–16708. [Google Scholar] [CrossRef]
- Yang, N.; Liu, C.J.; Liu, X.K.; Degn, T.K.; Munchow, M.; Fisk, I. Determination of volatile marker compounds of common coffee roast defects. Food Chem. 2016, 211, 206–214. [Google Scholar] [CrossRef]
- Santanatoglia, A.; Alessandroni, L.; Fioretti, L.; Sagratini, G.; Vittori, S.; Maggi, F.; Caprioli, G. Discrimination of filter coffee extraction methods of a medium roasted specialty coffee based on Volatile Profiles and Sensorial Traits. Foods 2023, 12, 3199. [Google Scholar] [CrossRef]
- Nooshkam, M.; Varidi, M.; Bashash, M. The Maillard reaction products as food-born antioxidant and antibrowning agents in model and real food systems (Review). Food Chem. 2019, 275, 644–660. [Google Scholar] [CrossRef]
- Obando, A.M.; Figueroa, J.G. Effect of roasting level on the development of key aroma-active compounds in coffee. Molecules 2024, 29, 4723. [Google Scholar] [CrossRef]
- Makri, E.; Tsimogiannis, D.; Dermesonluoglu, E.K.; Taoukis, P.S. Modeling of Greek coffee aroma loss during storage at different temperatures and water activities. Procedia Food Sci. 2011, 1, 1111–1117. [Google Scholar] [CrossRef]
- Piergiovanni, M.; Gosetti, F.; Rocío-Bautista, P.; Termopoli, V. Aroma determination in alcoholic beverages: Green MS-based sample preparation approaches. Mass Spectrom. Rev. 2024, 43, 660–682. [Google Scholar] [CrossRef]
- d’Acampora Zellner, B.; Dugo, P.; Dugo, G.; Mondello, L. Gas chromatography–olfactometry in food flavour analysis. J. Chromatogr. A 1186, 2008, 123–143. [Google Scholar] [CrossRef]
- Angeloni, S.; Mustafa, A.M.; Abouelenein, D.; Alessandroni, L.; Acquaticci, L.; Nzekoue, F.K.; Petrelli, R.; Sagratini, G.; Vittori, S.; Torregiani, E.; et al. Characterization of the aroma profile and main key odorants of espresso coffee. Molecules 2021, 26, 3856. [Google Scholar] [CrossRef] [PubMed]
- Weschenfelder, T.A.; Lantin, P.; Viegas, M.C.; De Castilhos, F.; Scheer, A.D.P. Concentration of aroma compounds from an industrial solution of soluble coffee by pervaporation process. J. Food Eng. 2015, 159, 57–65. [Google Scholar] [CrossRef]
- Đorđević, V.; Balanč, B.; Belščak-Cvitanović, A.; Lević, S.; Trifković, K.; Kalušević, A.; Kostić, I.; Komes, D.; Bugarski, B.; Nedović, V. Trends in encapsulation technologies for delivery of food bioactive compounds. Food Eng. Rev. 2015, 7, 452–490. [Google Scholar] [CrossRef]
- Zanin, R.C.; Smrke, S.; Kurozawa, L.E.; Yamashita, F.; Yeretzian, C. Modulation of aroma release of instant coffees through microparticles of roasted coffee oil. Food Chem. 2020, 341, 128–193. [Google Scholar] [CrossRef] [PubMed]
- Calligaris, S.; Munari, M.; Arrighetti, G.; Barba, L. Insights into the physicochemical properties of coffee oil. Eur. J. Lipid Sci. Technol. 2009, 111, 1270–1277. [Google Scholar] [CrossRef]
- Hurtado-Benavides, A.; Dorado, D.A.; Sánchez-Camargo, A.D.P. Study of the fatty acid profile and the aroma composition of oil obtained from roasted Colombian coffee beans by supercritical fluid extraction. J. Supercrit. Fluids 2016, 113, 44–52. [Google Scholar] [CrossRef]
- Buffo, R.A.; Cardelli-Freire, C. Coffee flavour: An overview. FFJ 2004, 19, 99–104. [Google Scholar] [CrossRef]
- Boger, B.R.; Mori, A.L.B.; Viegas, M.C.; Benassi, M.T. Quality attributes of roasted Arabica coffee oil extracted by pressing: Composition, antioxidant activity, sun protection factor and other physical and chemical parameters. Grasas Aceites 2021, 72, e394. [Google Scholar] [CrossRef]
- Gloess, A.N.; Vietri, A.; Wieland, F.; Smrke, S.; Schönbächler, B.; López, J.A.; Petrozzi, S.; Bongers, S.; Koziorowski, T.; Yeretzian, C. Evidence of different flavour formation dynamics by roasting coffee from different origins: On-line analysis with PTR-ToF-MS. Int. J. Mass Spectrom. 2014, 365–366, 324–337. [Google Scholar] [CrossRef]
- Oliviera, A.L.; Cabral, F.A.; Eberlin, M.N.; Cordello, H.M.A.B. Sensory evaluation of black instant coffee beverage with some volatile compounds present in aromatic oil from roasted coffee. Cienc. Tecnol. Aliment. Campinas. 2009, 29, 76–80. [Google Scholar] [CrossRef]
- Oliviera, A.L.; Silva, S.S.; Da Silva, M.A.P.; Eberlin, M.N.; Cabral, F.A. Sensory and yield response surface analysis of supercritical CO2 extracted aromatic oil from roasted coffee. J. Food Sci. Technol. 2001, 38, 38–42. [Google Scholar] [CrossRef]
- Lopez-Garcia, E.; Guallar-Castillon, P.; Leon-Muñoz, L.; Graciani, A.; Rodriguez-Artalejo, F. Coffee consumption and health-related quality of life. Clin. Nutr. Res. 2014, 33, 143–149. [Google Scholar] [CrossRef] [PubMed]
- Roselius, W.; Vitzthum, O.; Hubert, P. mMethod of Extraction of Coffee Oil Containing Aroma Constitutes from roasted coffee. German Federal Republic Patent Application. United Sates Patent. US4328255, 4 May 1982. [Google Scholar]
- Ramos, E.; Valero, E.; Ibanez, E.; Reglero, G.; Tabera, J. Obtention of a brewed coffee aroma extract by an optimized supercritical CO2-based process. J. Agric. Food Chem. 1998, 46, 4011–4016. [Google Scholar] [CrossRef]
- Araujo, M.A.; Sandi, D. Extraction of coffee diterpenes and coffee oil using supercritical carbon dioxide. Food Chem. 2006, 101, 1087–1094. [Google Scholar] [CrossRef]
- Sarrazin, C.; LeQuéré, J.-L.; Gretsch, C.; Liardon, R. Representativeness of coffee aroma extracts: A comparison of different extraction methods. Food Chem. 2000, 70, 99–106. [Google Scholar] [CrossRef]
- Guan, W.; Li, S.; Ruixiang, Y.; Tang, S.; Quan, C. Comparison of essential oils of clove buds extracted with supercritical carbon dioxide and other three traditional extraction methods. Food Chem. 2007, 101, 1558–1564. [Google Scholar] [CrossRef]
- Shofinita, D.; Lestari, D.; Aliwarga, L.; Sumampouw, G.A.; Ambarwati, S.A.; Gunawan, K.C.; Achmadi, A.B. Drying methods of coffee extracts and their effects on physicochemical properties: A review. Food Bioprocess Technol. 2024, 17, 47–72. [Google Scholar] [CrossRef]
- Saifullah, M.; Shishir, M.R.I.; Ferdowsi, R.; Rahman, M.R.T.; Vuong, Q.V. Micro and nano encapsulation, retention and controlled release of flavor and aroma compounds: A critical review. Trends Food Sci. Technol. 2019, 86, 230–251. [Google Scholar] [CrossRef]
- ISO 8586-1; Sensory Analysis—General Guidance for the Selection, Training and Monitoring of Assessors, Part 1: Selected As-sessors. International Organization for Standardization: Geneva, Switzerland, 1993.
- Lim, J. Hedonic scaling: A review of methods and theory. Food Qual. Prefer. 2011, 22, 733747. [Google Scholar] [CrossRef]
- Dermesonlouoglou, E.; Seretis, G.; Katsouli, M.; Katsimichas, A.; Giannakourou, M. Effect of Pulsed Electric Fields and Osmotic Dehydration on the Quality of Modified-Atmosphere-Packaged Fresh-Cut and Fried Potatoes. Foods 2025, 14, 420. [Google Scholar] [CrossRef]
- Orfanou, F.; Dermesonlouoglou, E.K.; Taoukis, P.S. Greek Coffee Quality Loss During Home Storage: Modeling the Effect of Temperature and Water Activity. J. Food Sci. 2019, 84, 2983–2994. [Google Scholar] [CrossRef]
- Tsimogianns, D.; Oreopoulou, V. A kinetic study of essential oil components distillation for the recovery of carvacrol rich fractions. JARMAP 2018, 9, 117–123. [Google Scholar] [CrossRef]
- Puvipirom, J.; Chaiseri, S. Contribution of roasted grains and seeds in aroma of oleang (Thai coffee drink). Int. Food Res. J. 2012, 19, 583–588. [Google Scholar]
- Piccino, D.; Boulanger, R.; Descroix, F.; Sing, A.S.C. Aromatic composition and potent odorants of the “specialty coffee” Brew “Bourbon Pointu” correlated to its three trade classifications. Food Res. Int. 2014, 61, 264–271. [Google Scholar] [CrossRef]
- Albouchi, A.; Murkovic, M. Formation kinetics of furfuryl alcohol in a coffee model system. Food Chem. 2018, 243, 91–95. [Google Scholar] [CrossRef] [PubMed]
- Hashim, L.; Chaveron, H. Use of methylpyrazine ratios to monitor the coffee roasting. Food Res. Int. 1996, 28, 619–623. [Google Scholar] [CrossRef]
- Maeztu, L.; Sanz, C.; Andueza, S.; de Penna, M.P.; Bello, J.; Cid, C. Characterization of espresso coffee aroma by static headspace GC-MS and sensory flavour profile. J. Agric. Food Chem. 2001, 49, 5437–5444. [Google Scholar] [CrossRef]
- Roberts, D.D.; Pollien, P.; Milo, C. Solid-phase microextraction method development for headspace analysis of volatile flavour compounds. J. Agric. Food Chem. 2000, 48, 2430–2437. [Google Scholar] [CrossRef]
- Cordoba, N.; Moreno, F.L.; Osorio, C.; Velasquez, S.; Ruiz, Y. Chemical and sensory evaluation of cold brew coffees using different roasting profiles and brewing methods. Food Res. Int. 2021, 141, 110141. [Google Scholar] [CrossRef]
- Caporaso, N.; Whitworth, M.B.; Fisk, I.D. Prediction of coffee aroma from single roasted coffee beans by hyperspectral imaging. Food Chem. 2022, 371, 131159. [Google Scholar] [CrossRef]
- Toci, A.T.; Farah, A.; Pezza, H.R.; Pezza, L. Coffee Adulteration: More than Two Decades of Research. Crit. Rev. Anal. Chem. 2015, 46, 83–92. [Google Scholar] [CrossRef] [PubMed]
- Choi, Μ.H.; Kim, G.H.; Lee, H.S. Effects of ascorbic acid retention on juice color and pigment stability in blood orange (Citrus sinensis) juice during refrigerated storage. Food Res. Int. 2002, 35, 753–759. [Google Scholar] [CrossRef]
 ), 45 (
 ) and 60 (
 ) °C for the instant coffee brew. 1: CGr and 2: F3Gr-D. (Mean value of three ± standard deviation). Dashed lines represent the fitting of the zero-order equation, Equation (5), to the experimental data.
), 45 () and 60 () °C for the instant coffee brew. 1: CGr and 2: F3Gr-D. (Mean value of three ± standard deviation). Dashed lines represent the fitting of the zero-order equation, Equation (5), to the experimental data.
) °C for the instant coffee brew. 1: CGr and 2: F3Gr-D. (Mean value of three ± standard deviation). Dashed lines represent the fitting of the zero-order equation, Equation (5), to the experimental data.
), 45 () and 60 () °C for the instant coffee brew. 1: CGr and 2: F3Gr-D. (Mean value of three ± standard deviation). Dashed lines represent the fitting of the zero-order equation, Equation (5), to the experimental data.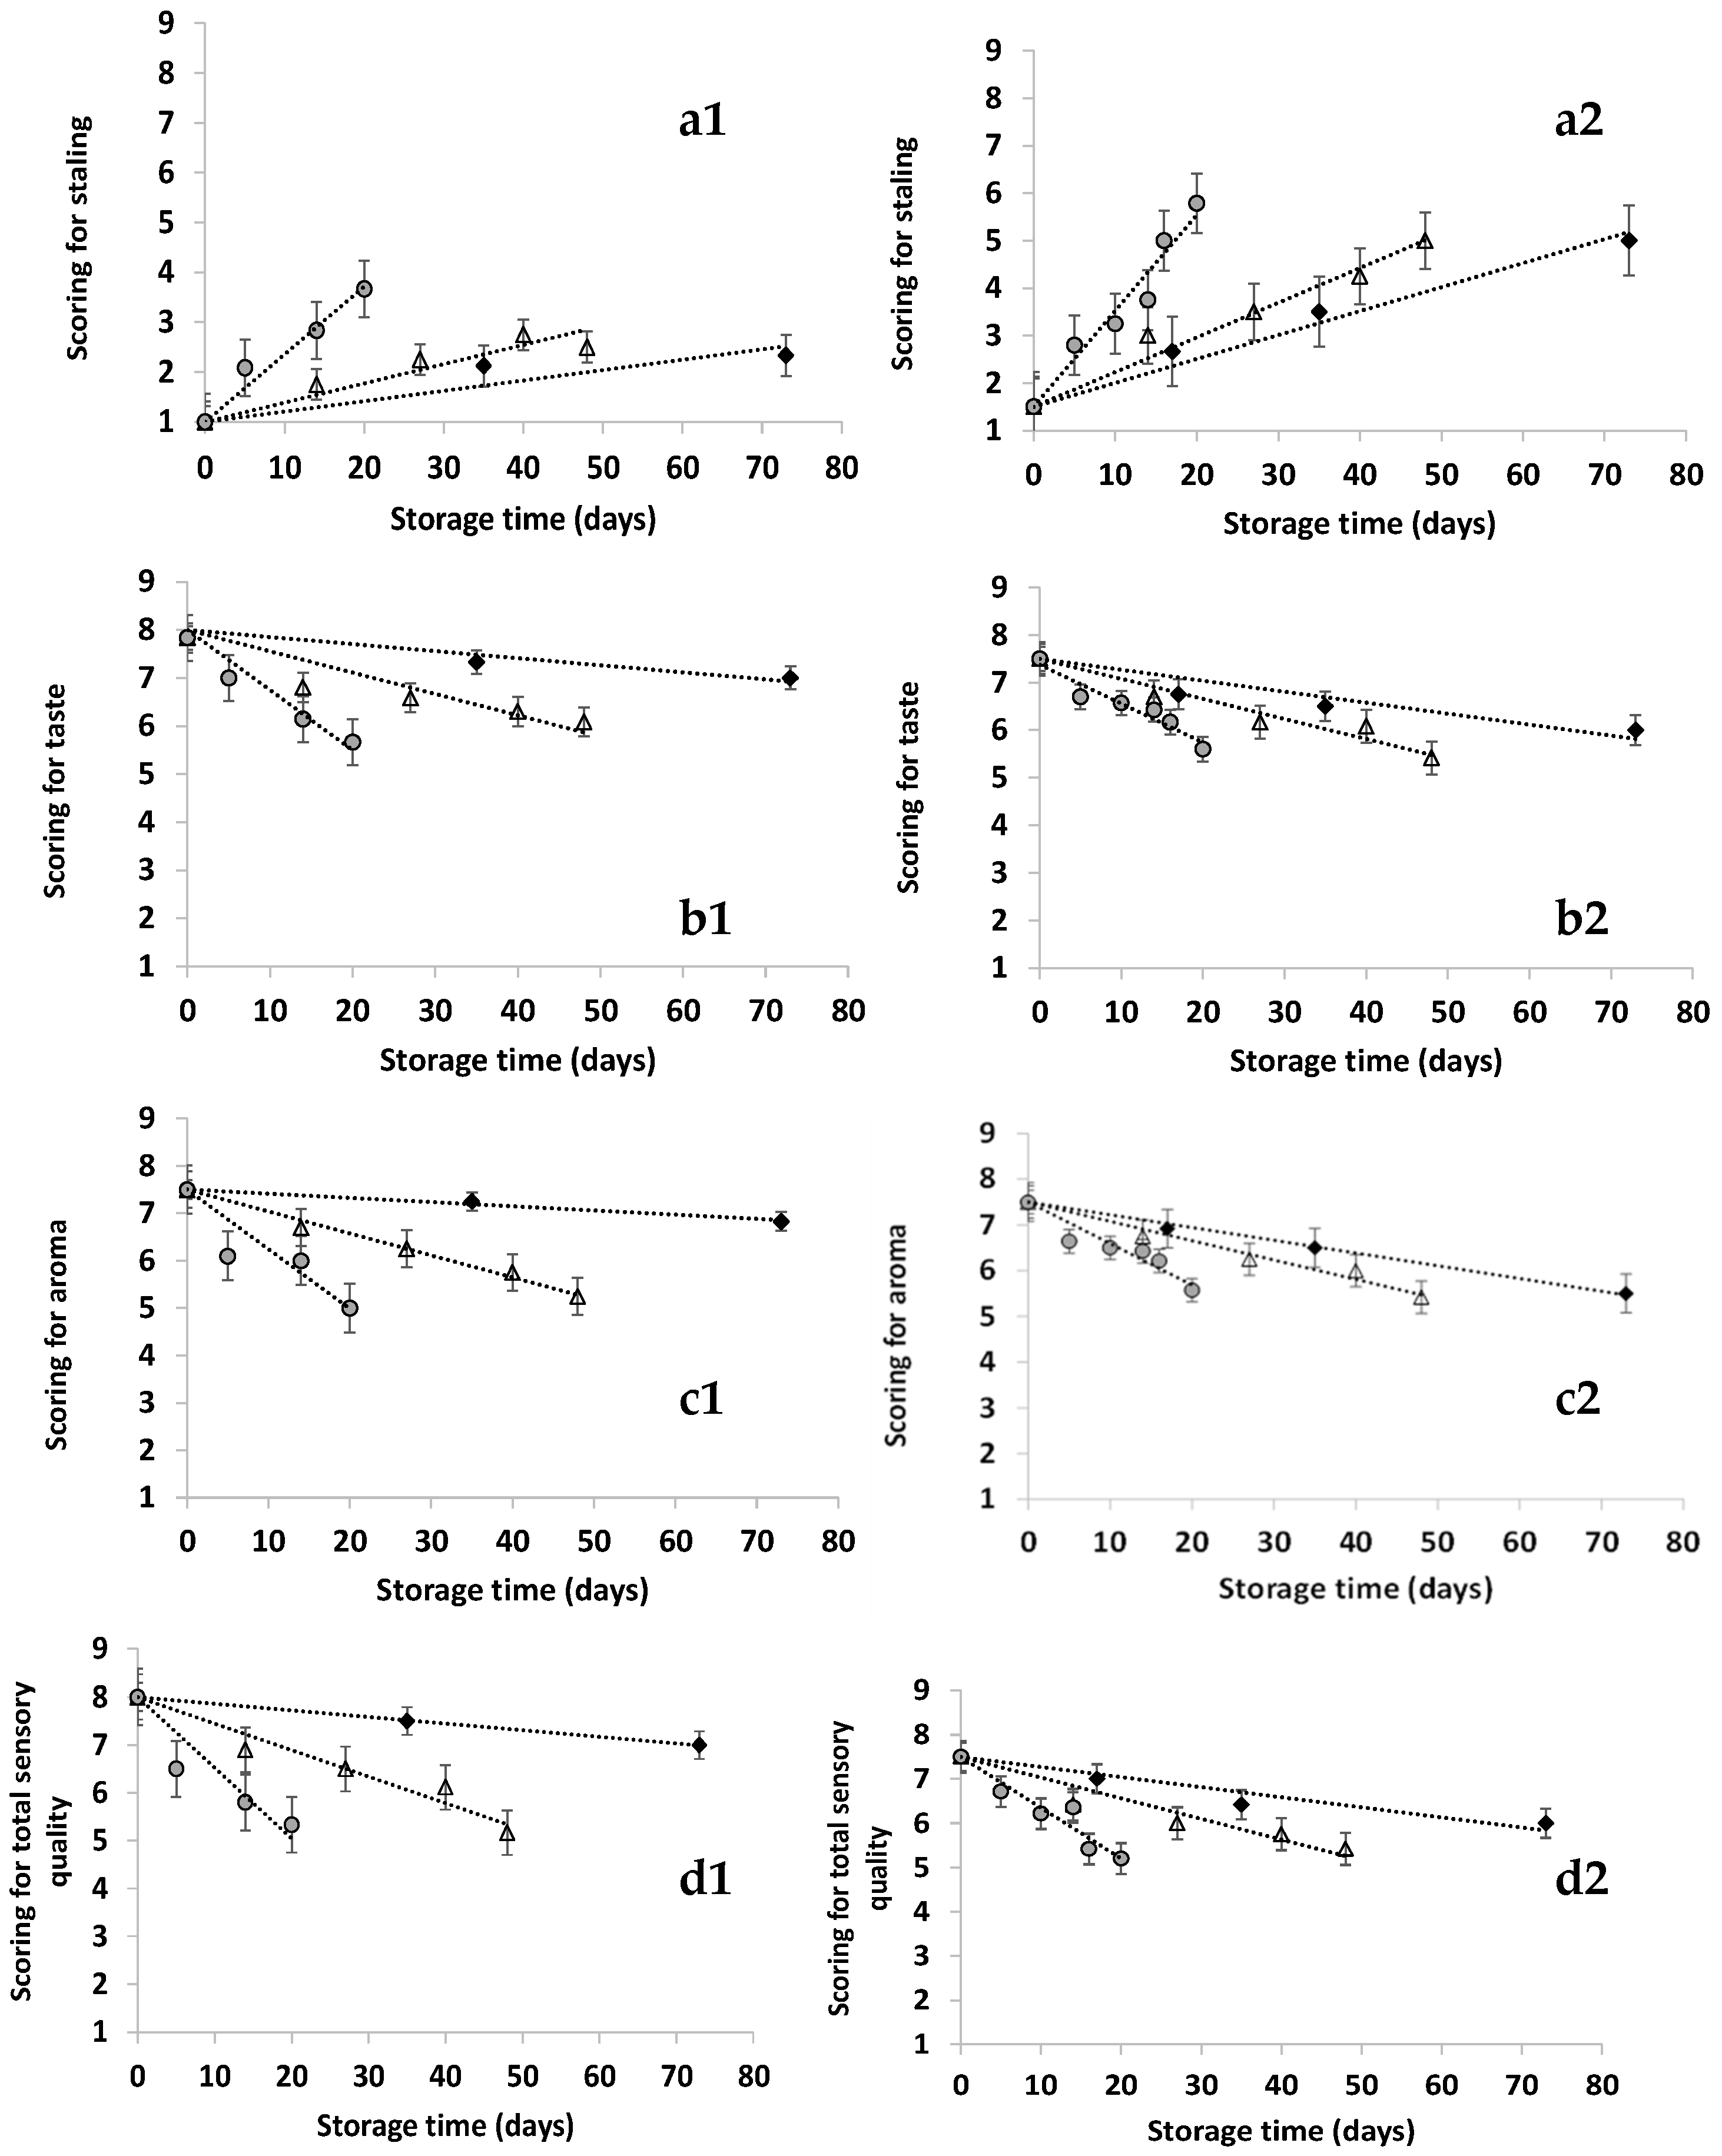
 ), 45 (
 ), 60 (
 ) °C.
), 45 (), 60 () °C.
) °C.
), 45 (), 60 () °C.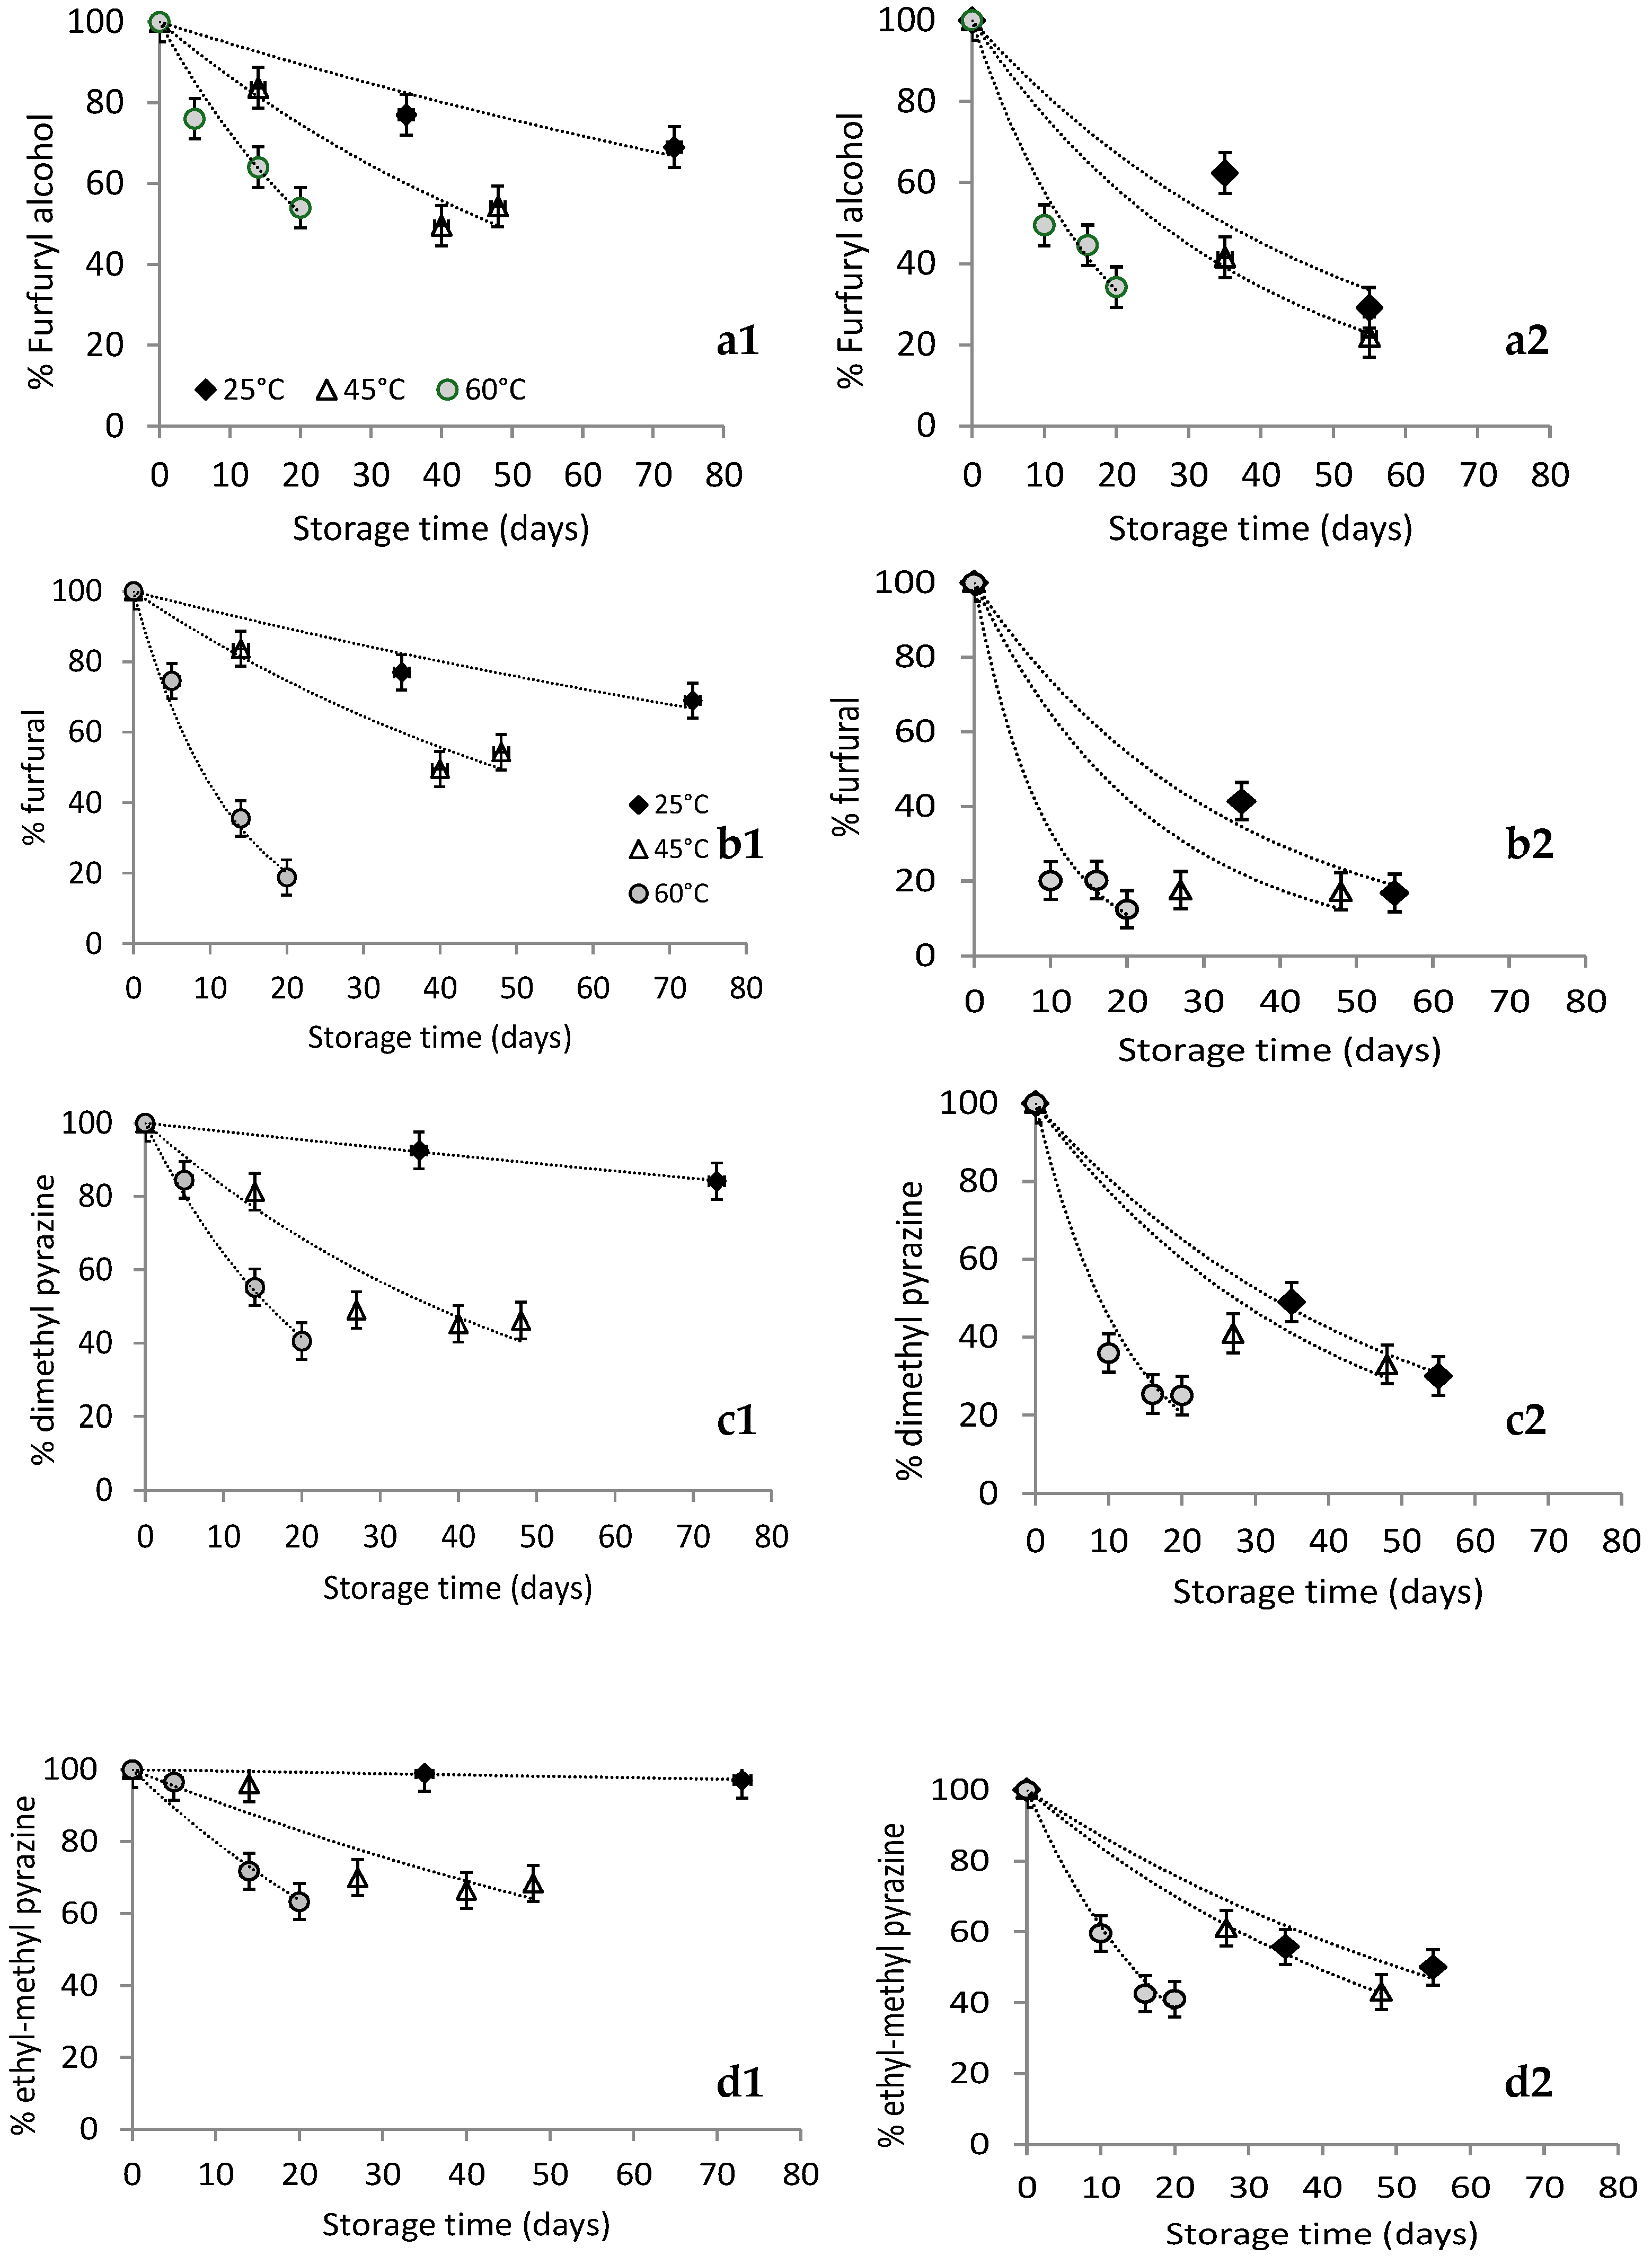

| Samples | CGr | F3Gr-D | ||||
|---|---|---|---|---|---|---|
| Storage Temperature (T) | 25 °C | 45 °C | 60 °C | 25 °C | 45 °C | 60 °C |
| Sampling time (t, days) | 17 | 14 | 5 | 35 | 27 | 10 |
| 35 | 27 | 10 | 55 | 48 | 16 | |
| 55 | 40 | 14 | 20 | |||
| 73 | 48 | 16 | ||||
| 20 | ||||||
| No. | Compound | r.t. | r.i. | Aroma Descriptor [c] | Odor Detection Threshold (ng/gwater) |
|---|---|---|---|---|---|
| 1 | 2-methyl pyrazine | 3.80 | 902 | nutty, cocoa-like | 60 [48] |
| 2 | furfural | 3.94 | 913 | pungent, sweet, bread-like, caramelly, cinnamon-almond-like flavor odor resembles benzaldehyde | 3000 [48] |
| 3 | furfuryl alcohol | 4.35 | 943 | mild, warm, oily, burnt | 5000 [48] |
| 4 | furfuryl formate | 5.25 | 1010 | ethereal | |
| 5 | 2,5-dimethyl pyrazine | 5.37 | 1019 | earthy, potato-like | 1700 [48] |
| 6 | 2,3-dimethyl pyrazine | 5.54 | 1032 | nutty, cocoa-like | 2500 [48] |
| 7 | 5-methyl furfural | 6.38 | 1095 | spicy-sweet, warm and slightly caramelly | 6000 [48] |
| 8 | furfuryl acetate | 6.94 | 1142 | mild, ethereal-floral fruity | 100 [48] |
| 9 | 2-ethyl, 6-methyl pyrazine | 7.07 | 1153 | roasted baked potato | 40 [48] |
| 10 | 2-ethyl, 5-methyl pyrazine | 7.12 | 1157 | nutty, roasted, grassy | 100 [48] |
| 11 | 2-ethyl, 3-methyl pyrazine | 7.12 | 1157 | strong raw potato | 130 [48] |
| 12 | 3-ethyl-2,5-dimethyl pyrazine | 8.47 | 1280 | 8.6 [48] | |
| 13 | nonanal | 8.88 | 1321 | fruity | 1 [48] |
| 14 | 2,3-diethyl-5-methyl pyrazine | 9.79 | 1418 | nutty, roasted vegetable | |
| 15 | decanal | 10.61 | 1512 | floral-orange on dilution | 20 [49] |
| Compound | Ground Coffee | Crude Coffee Oil F1 | Coffee Oil F2 | Coffee Oil F3 | Coffee Oil F4 | Final Product |
|---|---|---|---|---|---|---|
| furfuryl alcohol | 1 | 1 | 1 | 1 | 1 | 1 |
| furfural | 0.423 ± 0.045 * a | 0.265 ± 0.023 b | 0.249 ± 0.032 b | 0.307 ± 0.032 b | 0.313 ± 0.036 b | 0.25 ± 0.04 b |
| 5-methyl-furfural | 0.118 ± 0.024 a | 0.239 ± 0.023 b | 0.305 ± 0.078 b | 0.310 ± 0.017 b | 0.305 ± 0.029 b | 0.32 ± 0.06 b |
| furfuryl acetate | 0.087 ± 0.008 a | 0.113 ± 0.029 ab | 0.092 ± 0.015 a | 0.162 ± 0.048 ab | 0.193 ± 0.032 ab | 0.13 ± 0.02 ab |
| total dimethyl pyrazines | 0.837 ± 0.094 a | 0.332 ± 0.060 b | 0.455 ± 0.098 c | 0.535 ± 0.065 c | 0.479 ± 0.033 c | 0.83 ± 0.19 a |
| total ethyl-methyl pyrazines | 0.496 ± 0.130 a | 0.503 ± 0.053 a | 0.514 ± 0.066 a | 0.803 ± 0.177 b | 1.046 ± 0.101 c | 0.61 ± 0.18 c |
| total ethyl-dimethyl pyrazines | 0.181 ± 0.018 a | 0.329 ± 0.045 b | 0.351 ± 0.047 b | 0.617 ± 0.092 c | 0.512 ± 0.052 c | 0.450 ± 0.10 d |
| Sensory score for the total aroma quality | 7.5 ± 0.1 | 3.2 ± 0.2 | 6.2 ± 0.4 | 6.5 ± 0.4 | 4.7 ± 0.3 | 7.2 ± 0.5 |
| Sample | CGr | F3Gr-D | ||
|---|---|---|---|---|
| T (°C) | ks (d−1) * | R2 | ks (d−1) * | R2 |
| staling | ||||
| 25 | 0.0218 aA | 0.81 | 0.0753 aB | 0.99 |
| 45 | 0.0386 bA | 0.87 | 0.0930 aB | 0.99 |
| 60 | 0.132 cA | 0.95 | 0.2399 bB | 0.84 |
| Ea (kJ/mol) (R2) | 37.2 (0.89) | 22.1 (0.77) | ||
| taste | ||||
| 25 | 0.002 aA | 084 | 0.004 aA | 0.99 |
| 45 | 0.006 bA | 0.80 | 0.006 aA | 0.99 |
| 60 | 0.019 cA | 0.93 | 0.021 bA | 0.79 |
| Ea (kJ/mol) (R2) | 49.8 (0.98) | 30.1 (0.78) | ||
| aroma | ||||
| 25 | 0.001 aA | 094 | 0.007A b | 0.99 |
| 45 | 0.007 bA | 0.99 | 0.009 aA | 0.99 |
| 60 | 0.020 cA | 0.95 | 0.021 bA | 0.93 |
| Ea (kJ/mol) (R2) | 62.9 (0.99) | 22.7 (0.85) | ||
| total sensory quality | ||||
| 25 | 0.0139 aA | 0.99 | 0.0203 aB | 0.92 |
| 45 | 0.0553 bA | 0.94 | 0.039 bB | 0.99 |
| 60 | 0.1434 cA | 0.83 | 0.1045 cB | 0.87 |
| Ea (kJ/mol) (R2) | 54.7 (0.98) | 35.2 (0.94) | ||
| Shelf Life (Days) | ||||
|---|---|---|---|---|
| Based on Total Sensory Quality SL = 5/9 | Based on Aroma Loss 20% | |||
| Τ (°C) | CGr | F3Gr-D | CGr | F3Gr-D |
| 25 | 215 aA | 123 aB | 268 aB | 80 aB |
| 45 | 54 bA | 64 bB | 107 bB | 50 bB |
| 60 | 20 cA | 23 cA | 50 cB | 29 cB |
| Τ (°C) | kvol (d−1) (R2) | |
|---|---|---|
| CGr | F3Gr-D | |
| furfuryl alcohol | ||
| 25 | 0.006 (0.944) | 0.020 (0.939) |
| 45 | 0.015 (0.962) | 0.033 (0.998) |
| 60 | 0.032 (0.949) | 0.055 (0.972) |
| Ea (kJ/mol) kref (d−1) | 39.3 (0.996) 0.005 | 23.5 (0.985) 0.019 |
| furfural | ||
| 25 | 0.006 (0.944) | 0.030 (0.988) |
| 45 | 0.015 (0.962) | 0.043 (0.960) |
| 0.1160 | 0.080 (9.89) | 0.110 (0.967) |
| Ea (kJ/mol) kref (d−1) | 59.1 (0.923) 0.005 | 29.3 (0.872) 0.026 |
| dimethyl pyrazines | ||
| 25 | 0.002 (0.998) | 0.021 (0.968) |
| 45 | 0.019 (0.928) | 0.035 (0.956) |
| 60 | 0.044 (0.993) | 0.079 (0.938) |
| Ea (kJ/mol) kref (d−1) | 74.1 (0.979) 0.002 | 30.4 (0.941) 0.019 |
| Ethyl, methyl pyrazines | ||
| 25 | 0.0004 (0.974) | 0.014 (0.975) |
| 45 | 0.009 (0.858) | 0.028(0.961) |
| 60 | 0.022 (0.960) | 0.049 (0.979) |
| Ea (kJ/mol) kref (d−1) | 96.7 (0.961) 0.0004 | 29.3 (0.997) 0.013 |
| Color Parameters * | ||||
|---|---|---|---|---|
| Storage Time | L | a | b | ΔΕ |
| CGr | ||||
| Day 0 | 52.09 a | 0.60 a | −5.24 a | _ |
| Day 55, 25 °C | 51.85 a | 0.70 a | −5.18 a | 1.94 |
| Day 48, 45 °C | 52.33 a | 0.63 a | −5.17 a | 2.09 |
| Day 20, 60 °C | 52.31 a | 0.62 a | −5.13 a | 2.62 |
| F3Gr-D | ||||
| Day 0 | 51.25 a | 0.20 b | −6.13 b | _ |
| Day 73, 25 °C | 51.66 a | 0.42 c | −5.68 ab | 5.30 |
| Day 48, 45 °C | 51.57 a | 0.37 c | −5.96 b | 3.26 |
| Day 20, 60 °C | 51.41 a | 0.25 c | −6.15 b | 0.16 |
Disclaimer/Publisher’s Note: The statements, opinions and data contained in all publications are solely those of the individual author(s) and contributor(s) and not of MDPI and/or the editor(s). MDPI and/or the editor(s) disclaim responsibility for any injury to people or property resulting from any ideas, methods, instructions or products referred to in the content. |
© 2025 by the authors. Licensee MDPI, Basel, Switzerland. This article is an open access article distributed under the terms and conditions of the Creative Commons Attribution (CC BY) license (https://creativecommons.org/licenses/by/4.0/).
Share and Cite
Dermesonlouoglou, E.; Palaioxari-Kampisiouli, V.; Tsimogiannis, D.; Taoukis, P. Design and Production of an Instant Coffee Product Based on Greek Coffee Oil: Study of the Effect of Storage Conditions on Product Aroma and Quality. Beverages 2025, 11, 88. https://doi.org/10.3390/beverages11030088
Dermesonlouoglou E, Palaioxari-Kampisiouli V, Tsimogiannis D, Taoukis P. Design and Production of an Instant Coffee Product Based on Greek Coffee Oil: Study of the Effect of Storage Conditions on Product Aroma and Quality. Beverages. 2025; 11(3):88. https://doi.org/10.3390/beverages11030088
Chicago/Turabian StyleDermesonlouoglou, Efimia, Vassiliki Palaioxari-Kampisiouli, Dimitrios Tsimogiannis, and Petros Taoukis. 2025. "Design and Production of an Instant Coffee Product Based on Greek Coffee Oil: Study of the Effect of Storage Conditions on Product Aroma and Quality" Beverages 11, no. 3: 88. https://doi.org/10.3390/beverages11030088
APA StyleDermesonlouoglou, E., Palaioxari-Kampisiouli, V., Tsimogiannis, D., & Taoukis, P. (2025). Design and Production of an Instant Coffee Product Based on Greek Coffee Oil: Study of the Effect of Storage Conditions on Product Aroma and Quality. Beverages, 11(3), 88. https://doi.org/10.3390/beverages11030088