
Synergistic Bioactive Potential of Combined Fermented Kombucha and Water Kefir


Abstract
1. Introduction
2. Materials and Methods
2.1. Chemicals and Reagents
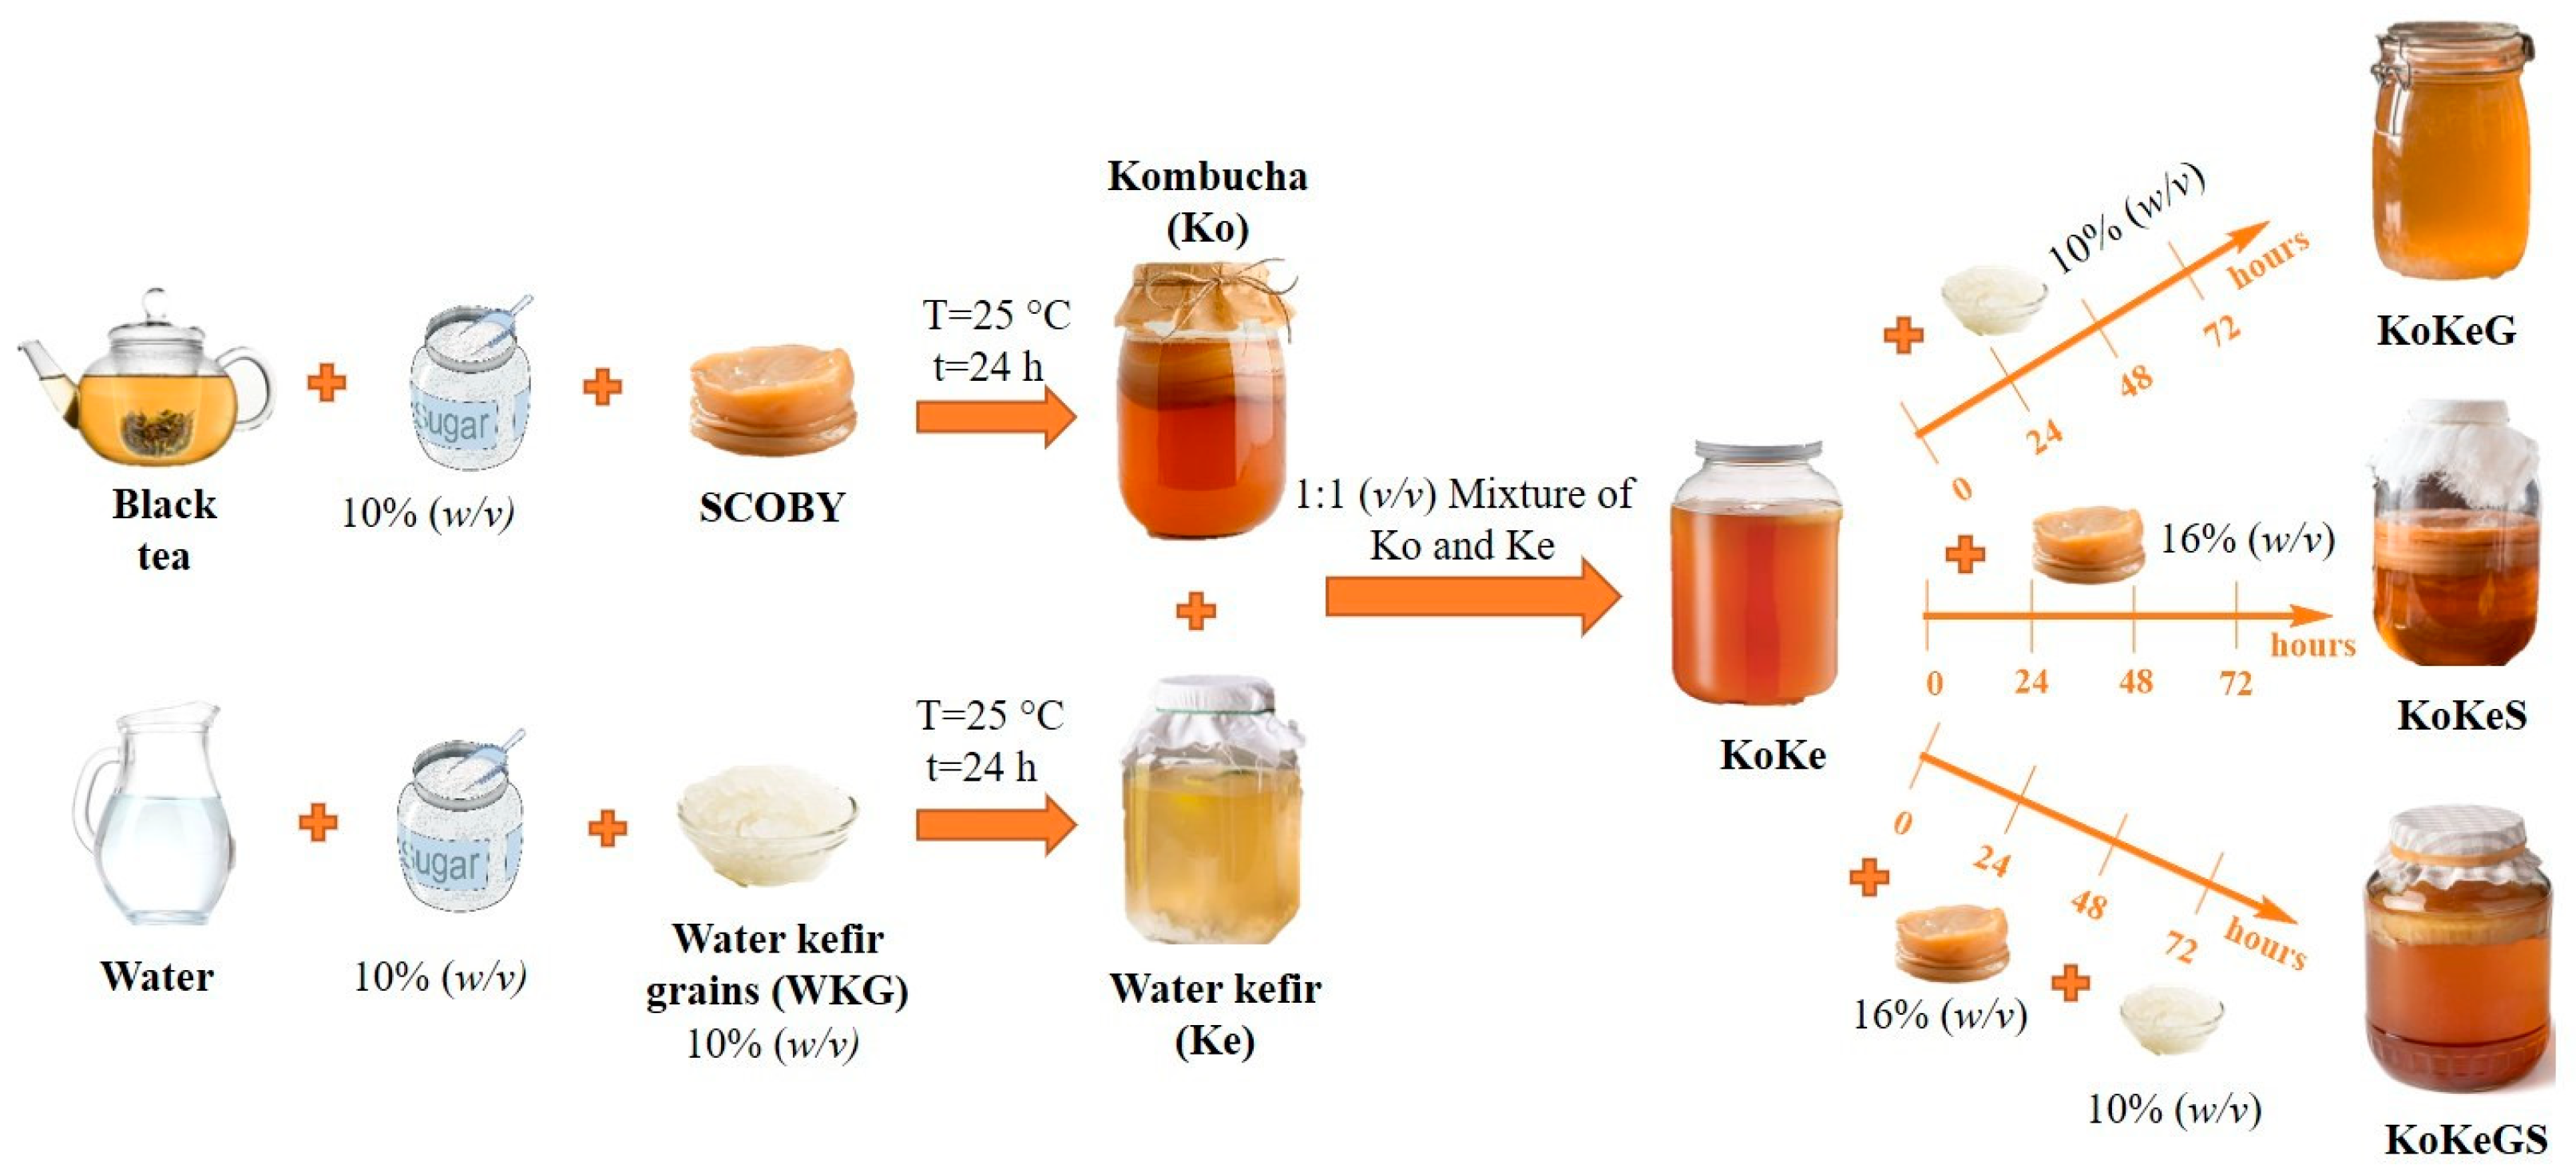
2.2. Fermentation Conditions
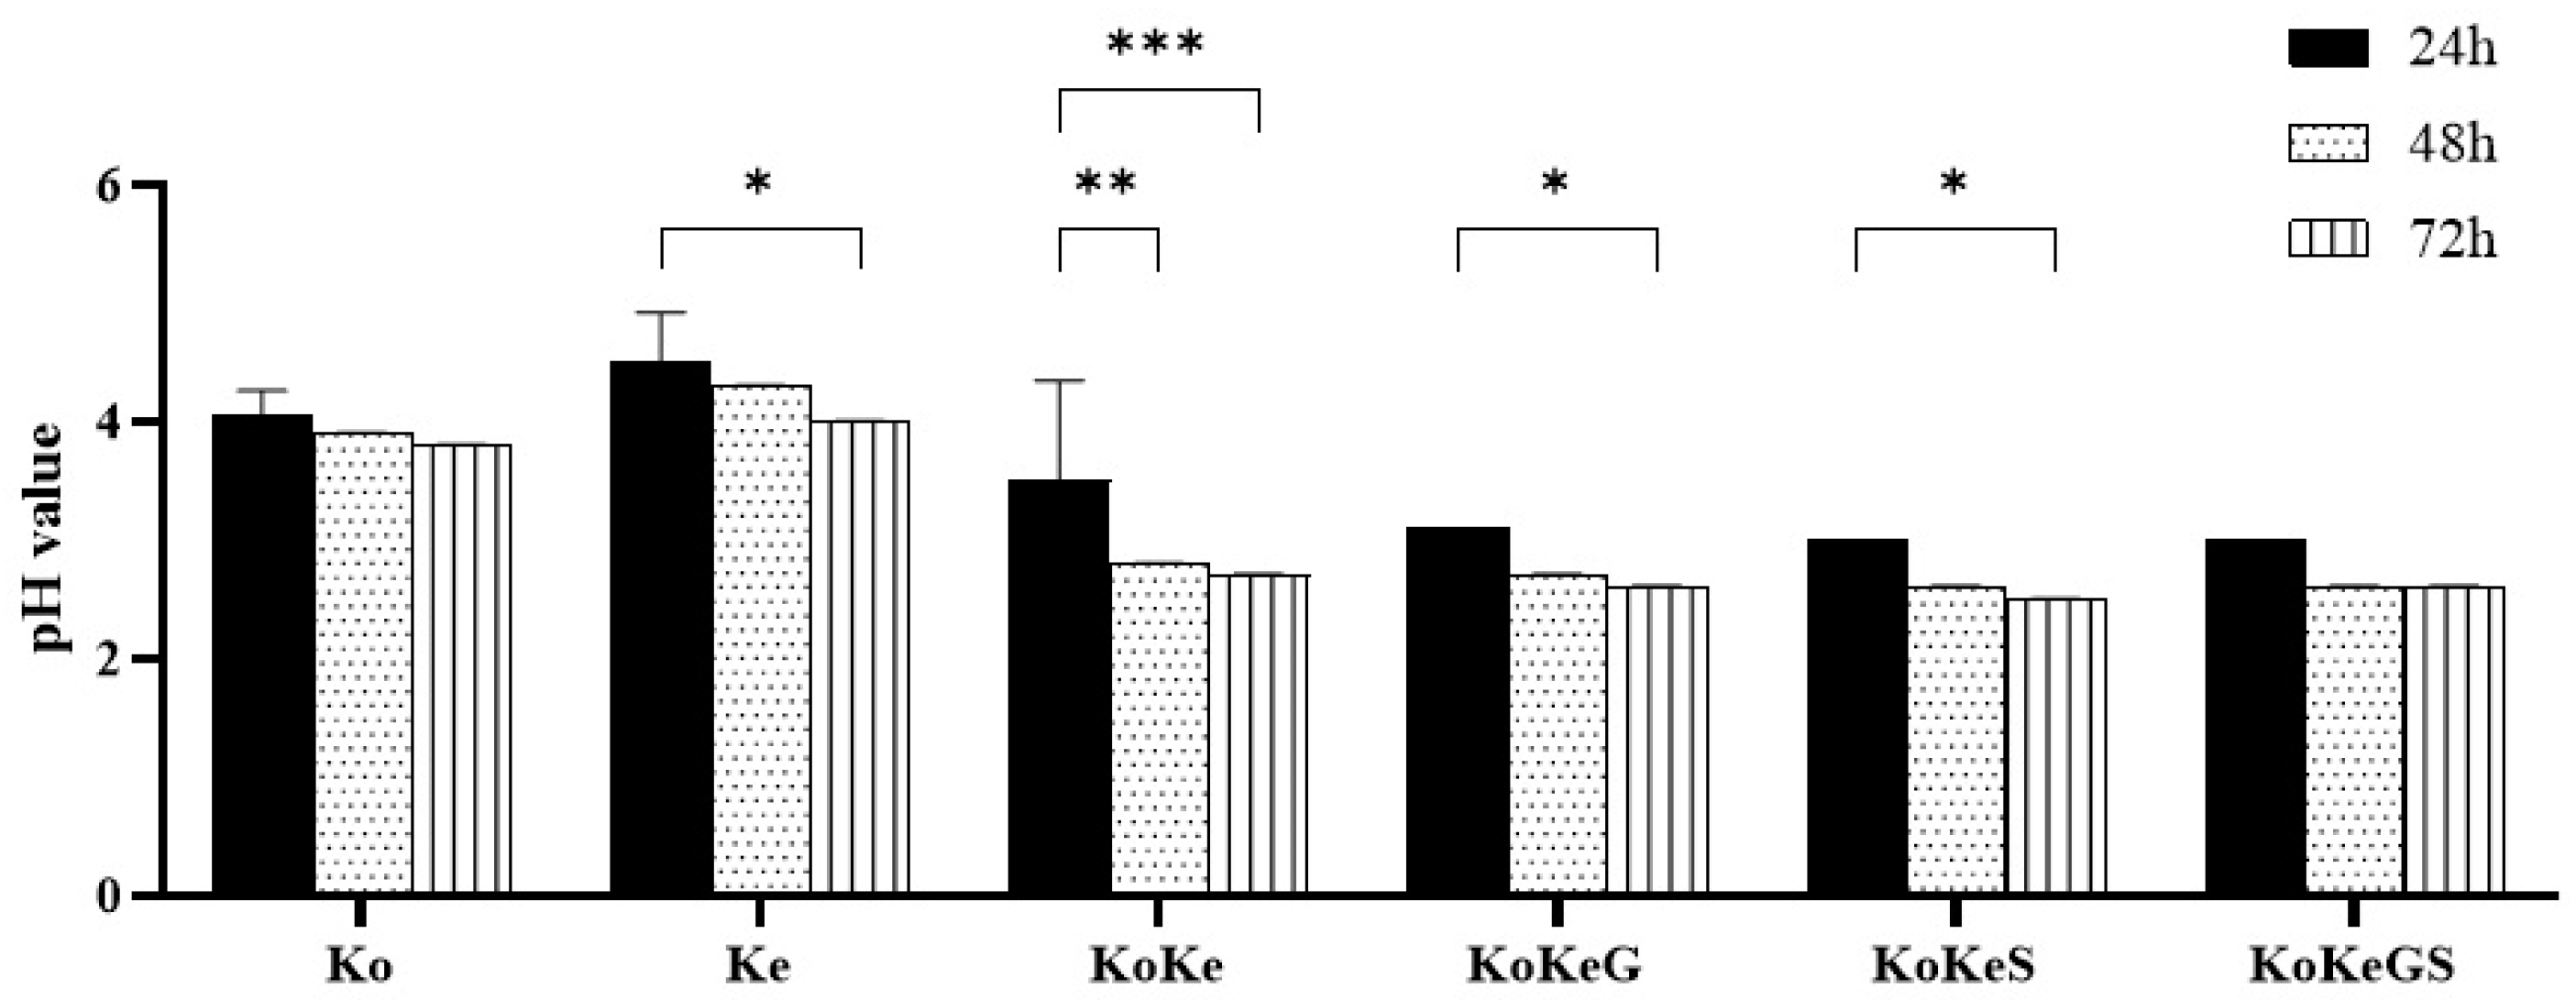
2.3. pH Evaluation
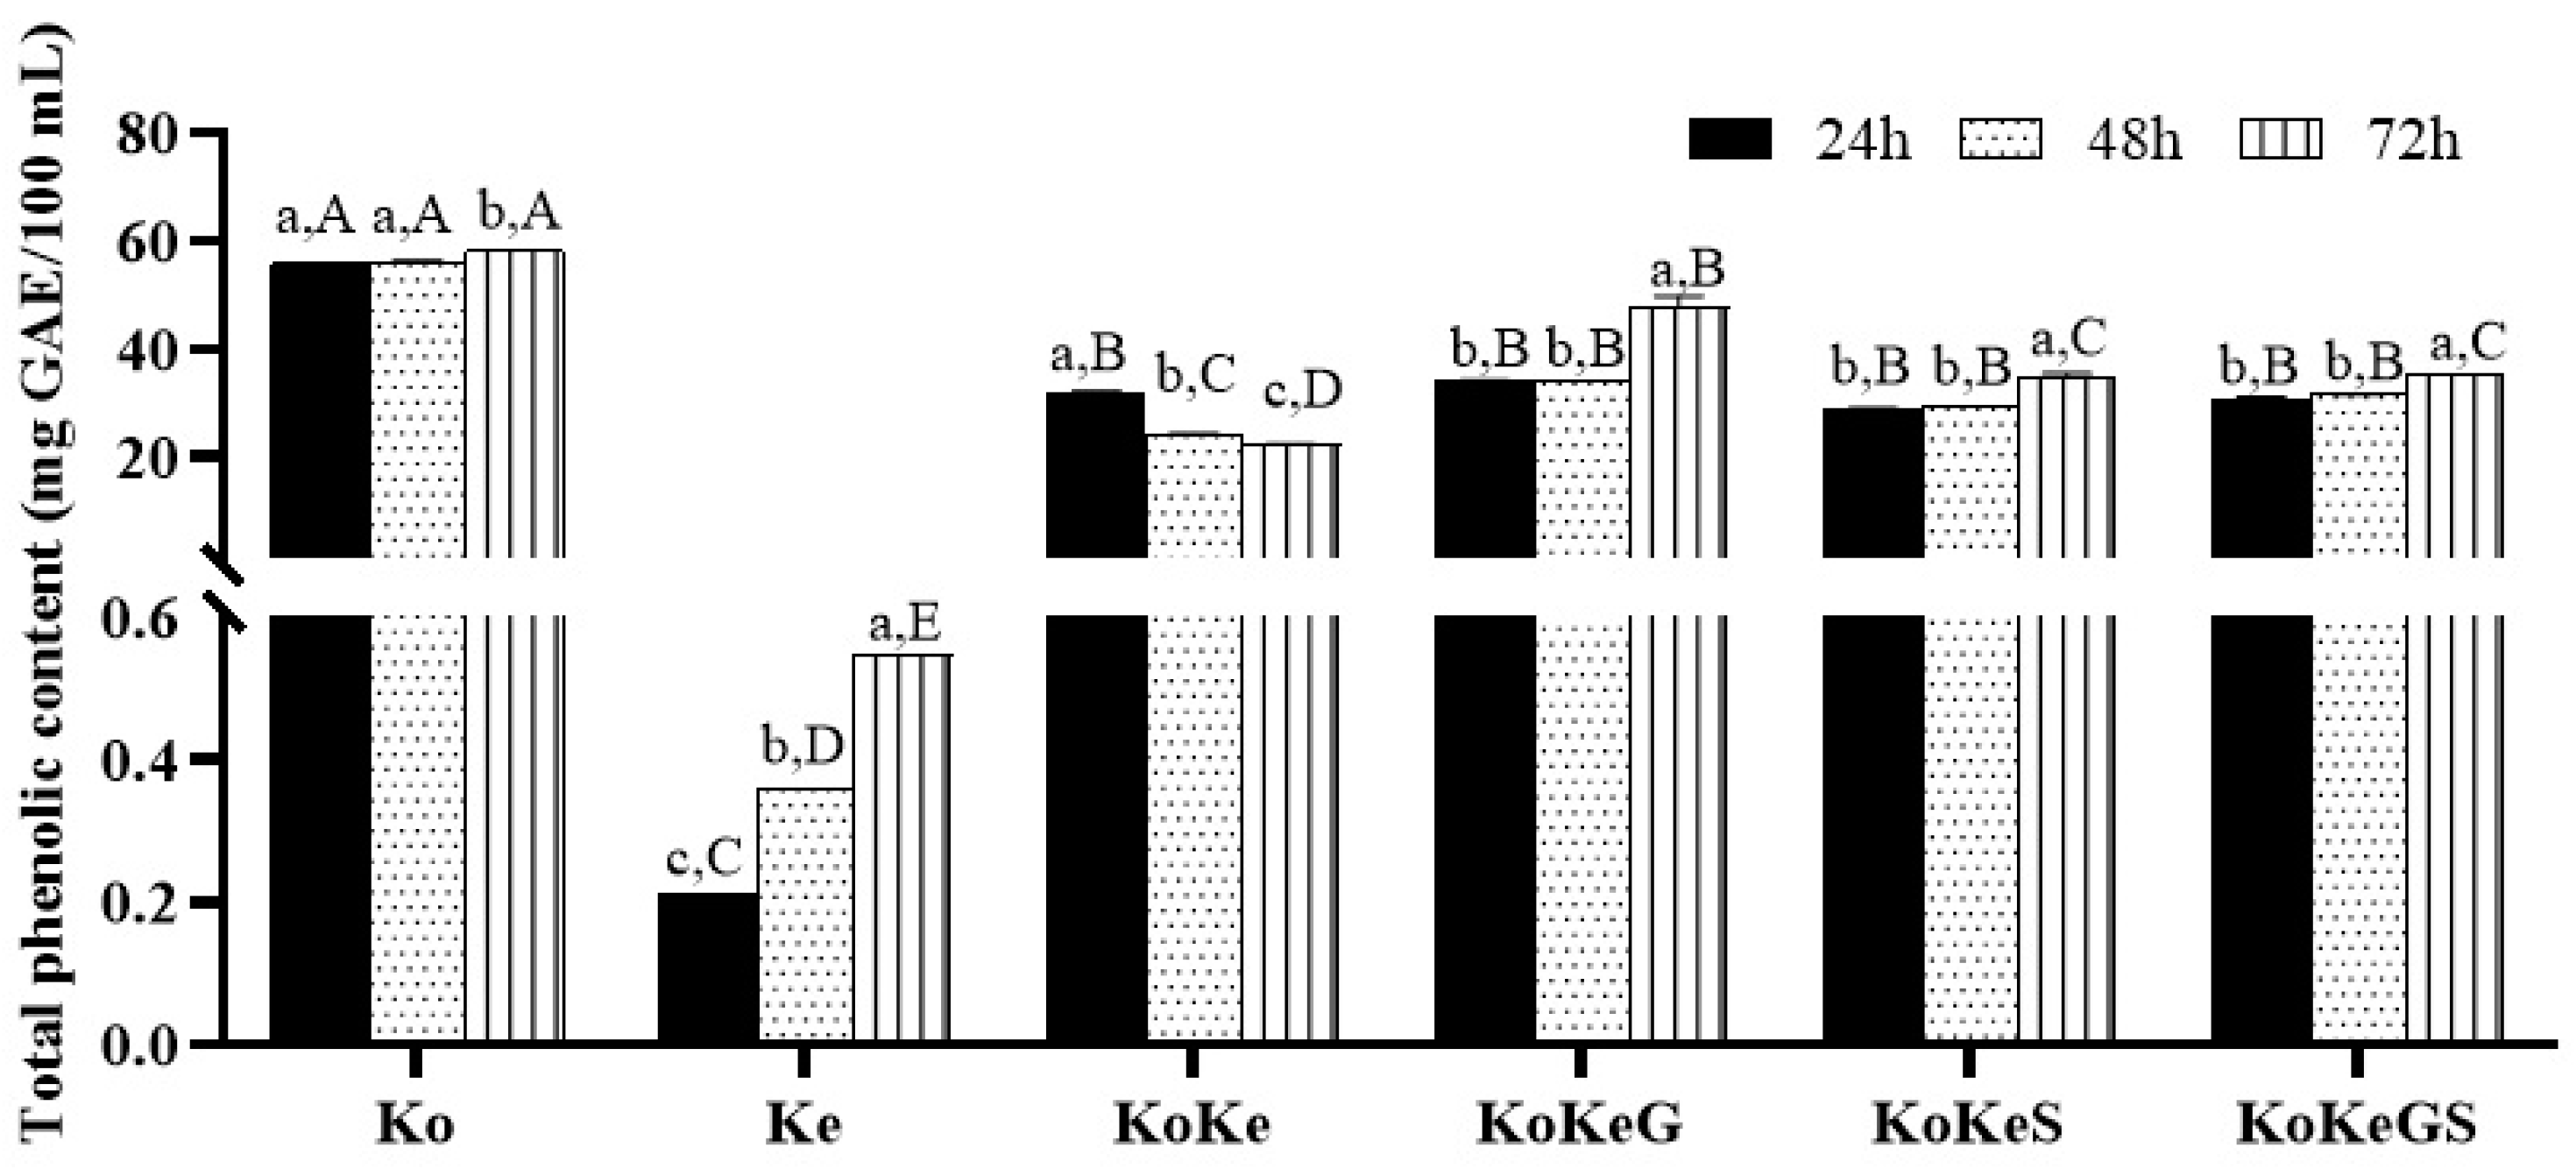
2.4. Total Phenolic Content (TPC) Determination
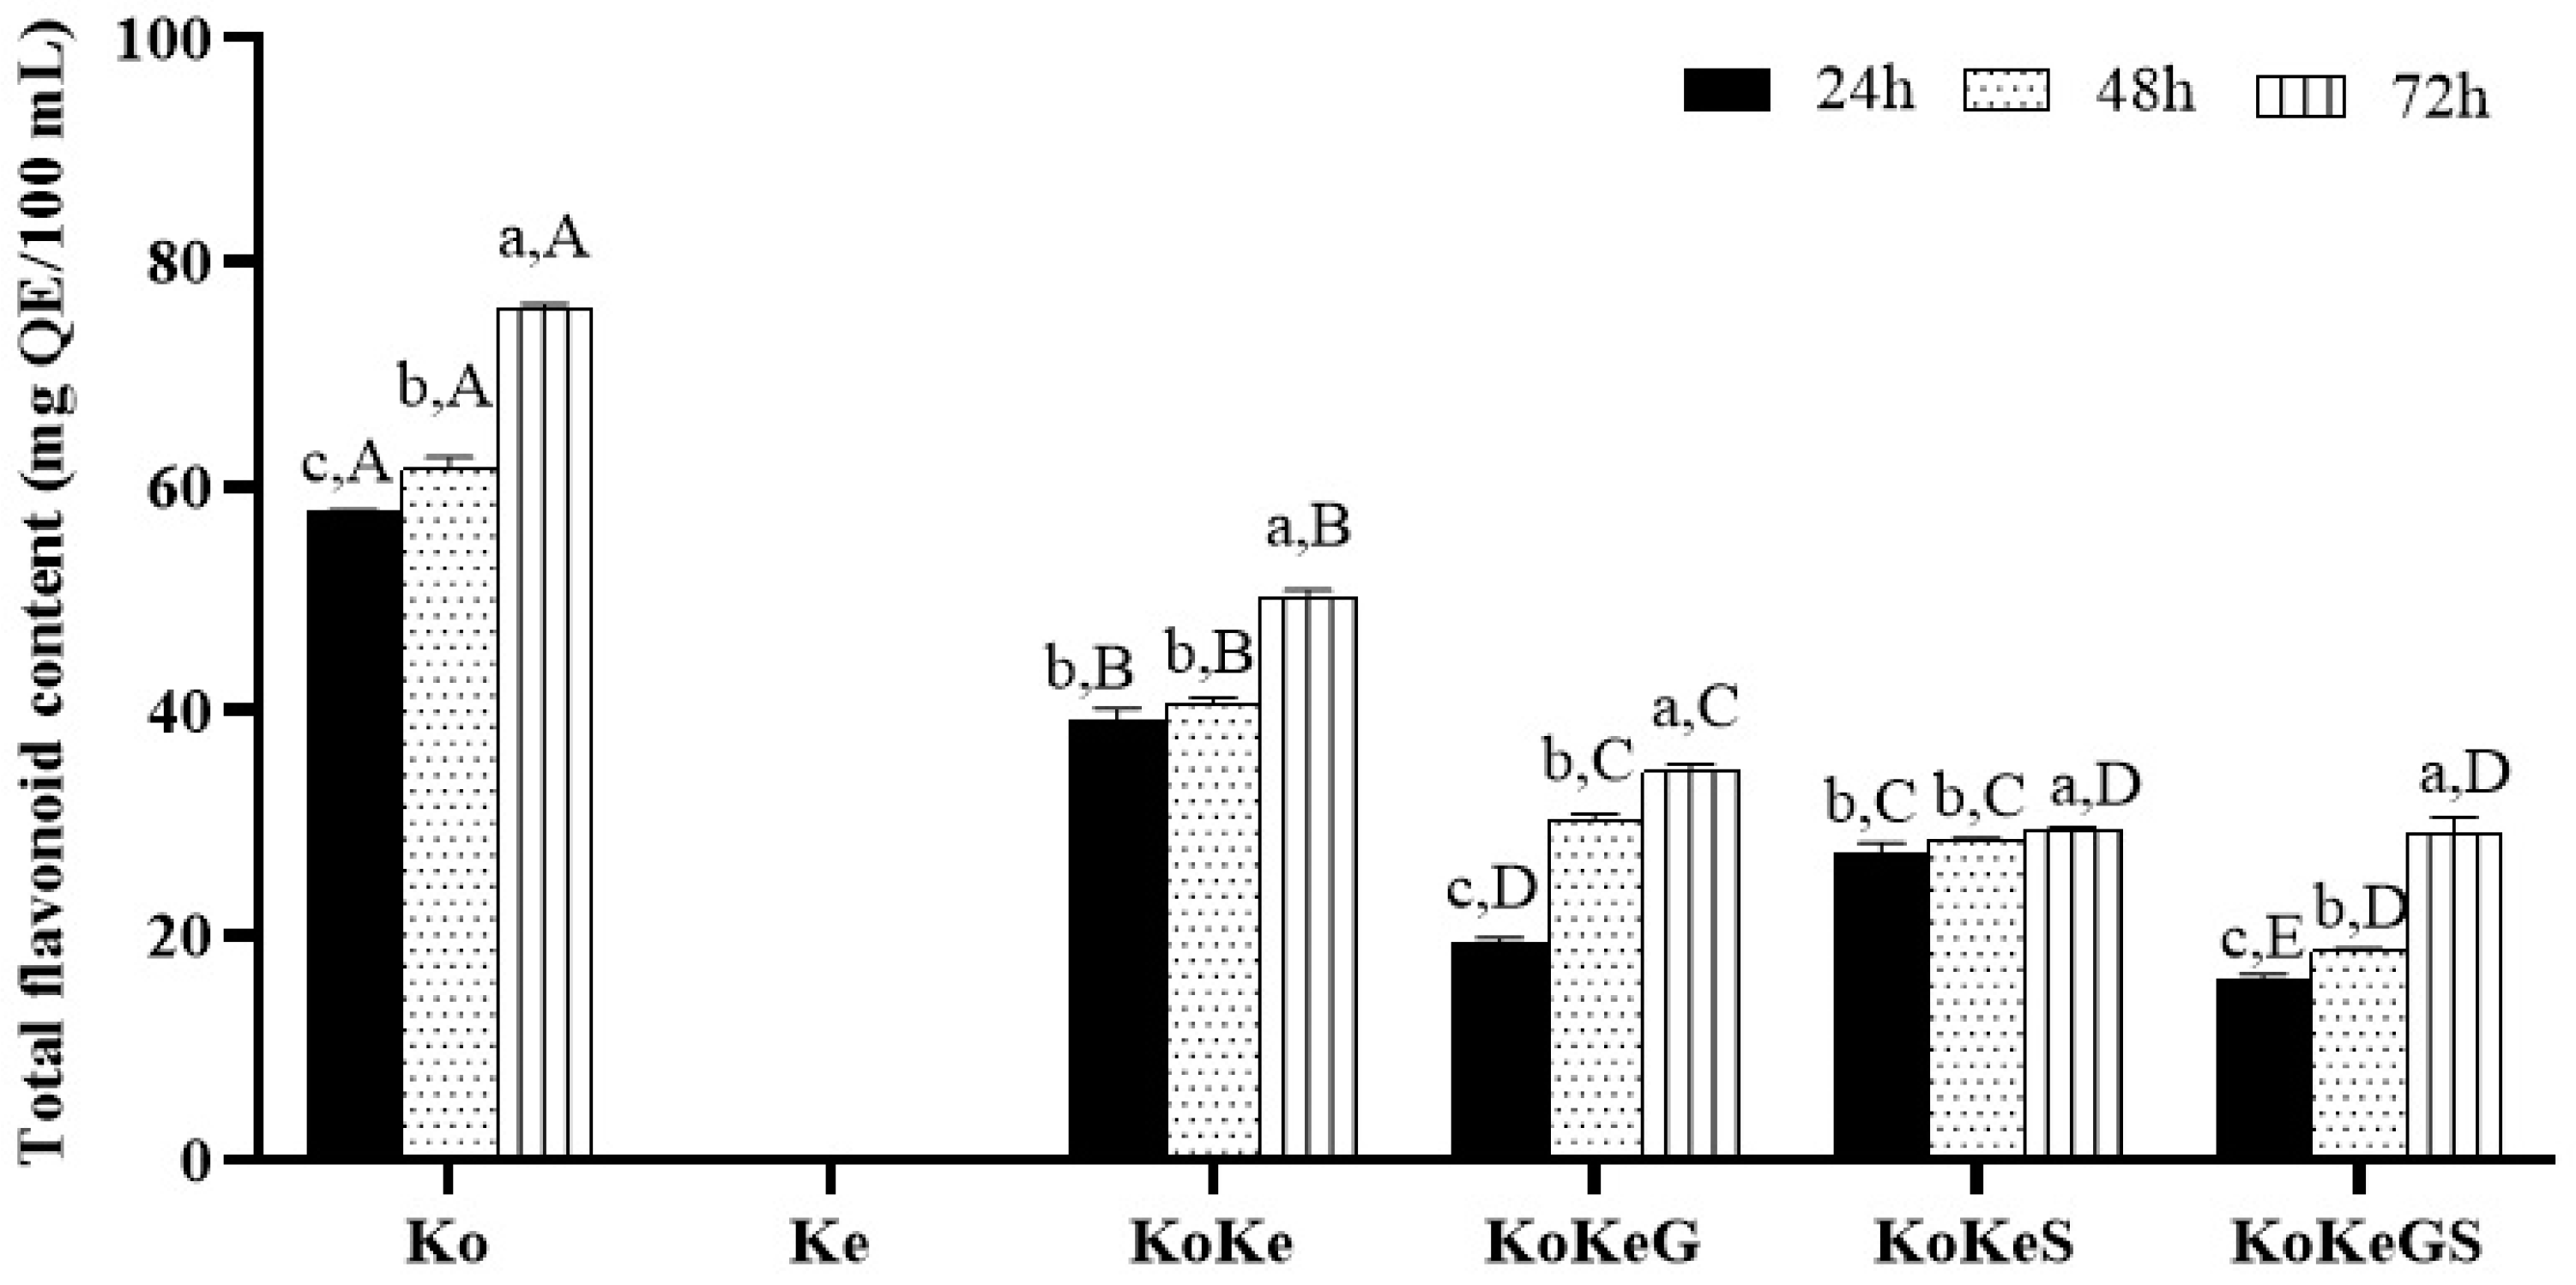
2.5. Total Flavonoid Content (TFC) Determination
2.6. Antioxidant Activity Evaluation
2.6.1. DPPH Assay
2.6.2. ABTS Assay
2.6.3. FRAP Test
2.7. Determination of the Phenolic Acids, Flavonoids, and Caffeine Content by High-Performance Liquid Chromatography (HPLC-DAD) Analysis
2.8. Colorimetric Analysis
2.9. Enzyme Inhibitory Activities
2.10. Statistical Analysis
3. Results and Discussion
3.1. pH Values
3.2. TPC
3.3. TFC
3.4. Content of Phenolic Acids, Flavonoids, and Caffeine Determined by HPLC Analysis
3.5. Antioxidant Activity
3.5.1. DPPH
3.5.2. ABTS
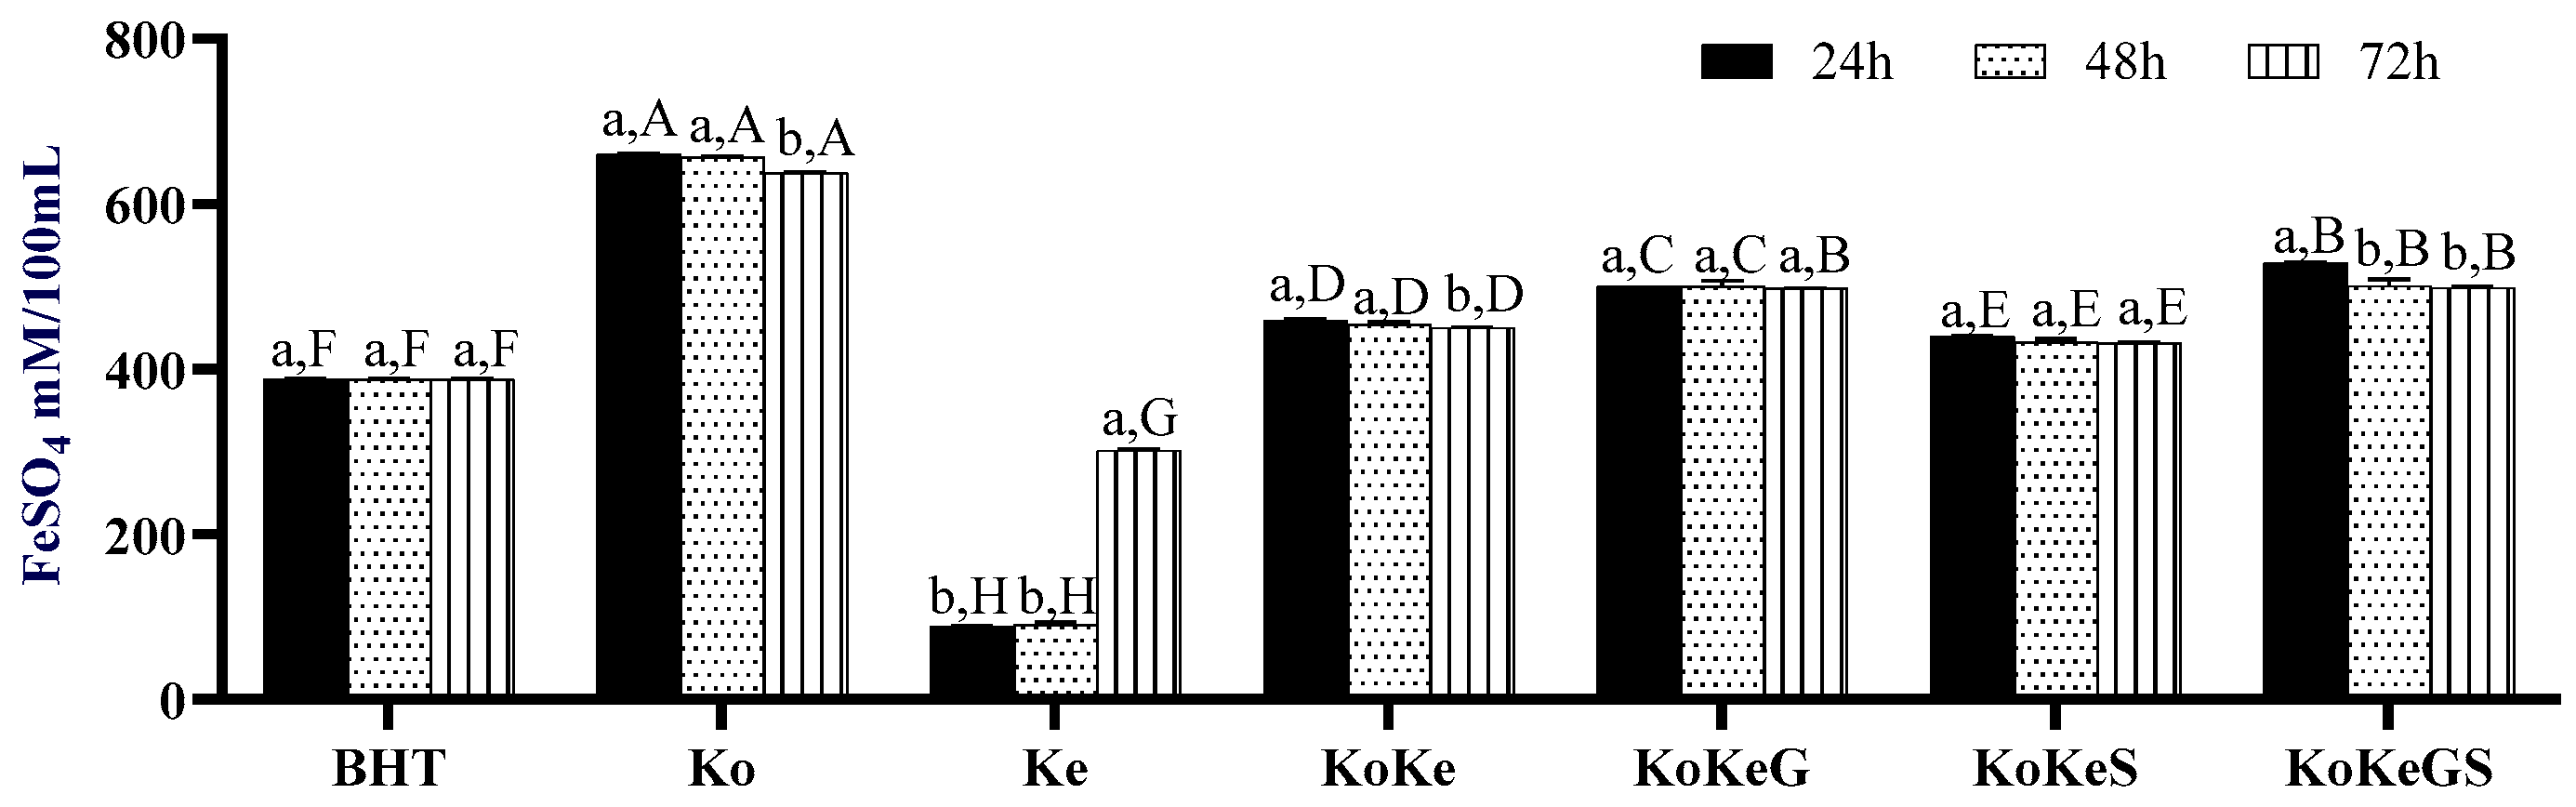
3.5.3. FRAP
- 1.
- Microbial synergy in kombucha fermentationKombucha is produced through fermentation by a SCOBY, a symbiotic culture of acetic acid bacteria (e.g., Acetobacter and Gluconobacter) and yeasts (e.g., Saccharomyces and Zygosaccharomyces) that grow well in a tea-based, acidic environment. This microbial consortium enables coordinated metabolic processes [62].During fermentation, yeasts break down sucrose into glucose and fructose, which are then converted into ethanol and carbon dioxide. Acetic acid bacteria subsequently oxidize ethanol into acetic acid and produce additional bioactive compounds such as gluconic and glucuronic acids, both known for their antioxidant and detoxifying properties. Simultaneously, the microbial community facilitates the breakdown and transformation of complex tea polyphenols such as catechins and theaflavins into more bioavailable and bioactive antioxidant molecules. This process results in the production of a diverse range of antioxidant metabolites, including organic acids, vitamins, and bioactive peptides, which together contribute to the potent antioxidant activity observed in kombucha [59,63,64].
- 2.
- Alteration of microbial synergy in mixed fermentationsWhen kombucha and water kefir are combined in a 1:1 (v/v) ratio and fermented using a SCOBY, water kefir grains (WKGs), or both, the fermentation process and antioxidant production become less effective [59,65]. This reduced performance is likely due to several factors:
- (a)
- Dilution of substrate and microbial preferencesKombucha microbes are adapted to a polyphenol-rich, acidic tea environment. Mixing with water kefir dilutes these substrates and introduces a sweeter, less complex nutrient profile. This change makes the environment less suitable for SCOBY microbes, which may lead to a reduced ability to transform polyphenols into antioxidant compounds.
- (b)
- Microbial Competition and InterferenceWater kefir grains introduce lactic acid bacteria (LAB) and sugar-tolerant yeasts that prefer simple, carbohydrate-rich environments with low tannin content. LAB rapidly consume sugars and lower the pH by producing acids. This acidification can inhibit the activity of acetic acid bacteria, which are essential for ethanol oxidation and the production of key antioxidant compounds like acetic and gluconic acids [66]. In addition, yeasts from both cultures may compete or co-ferment, but the resulting byproducts such as ethanol and CO₂ are not efficiently utilized. This loss of microbial synergy can further reduce the antioxidant potential of the fermentation.
- (c)
- Reduced activity of the oxidative pathwayKombucha’s strong antioxidant effects mainly come from oxidative fermentation, especially through pathways driven by Acetobacter bacteria. However, in mixed fermentations, LAB become more dominant, shifting the process toward lactic acid fermentation. While lactic acid helps with taste and preservation, it does not significantly contribute to antioxidant production. As a result, the transformation of polyphenols into more active antioxidant compounds is less efficient. This is likely due to lower enzyme activity related to oxidative metabolism. In these mixed systems, antioxidant levels tend to stabilize or even decrease. Experimental results show that although total polyphenol levels may remain high, they do not match the antioxidant activity, indicating that the polyphenols are not being converted into their active forms. This points to a loss of coordination between the microbes involved in fermentation.
- 3.
- Stability and efficiency of the natural kombucha systemThe natural fermentation system of kombucha is both stable and well suited for producing antioxidant compounds over time. This system has been improved through repeated fermentation cycles, ensuring consistent results and high yields. In contrast, adding new microbial populations from water kefir or changing the fermentation conditions can disrupt this balance, often leading to less efficient antioxidant production. The SCOBY-based system, however, ensures a reliable conversion of tea polyphenols into active antioxidant compounds.
- 4.
- Functional efficiency and biochemical outputIn functional fermentation, efficiency should be measured not just by sugar consumption or acid production but also by the quality and strength of the bioactive compounds created. Kombucha, with its specialized and cooperative microbial community, effectively converts the limited substrates (tea and sugar) into a wide range of beneficial antioxidant compounds. On the other hand, the mixed kombucha–kefir fermentation is less effective at producing these bioactive compounds due to microbial conflict, incompatible substrates, and interference in metabolic pathways [67].
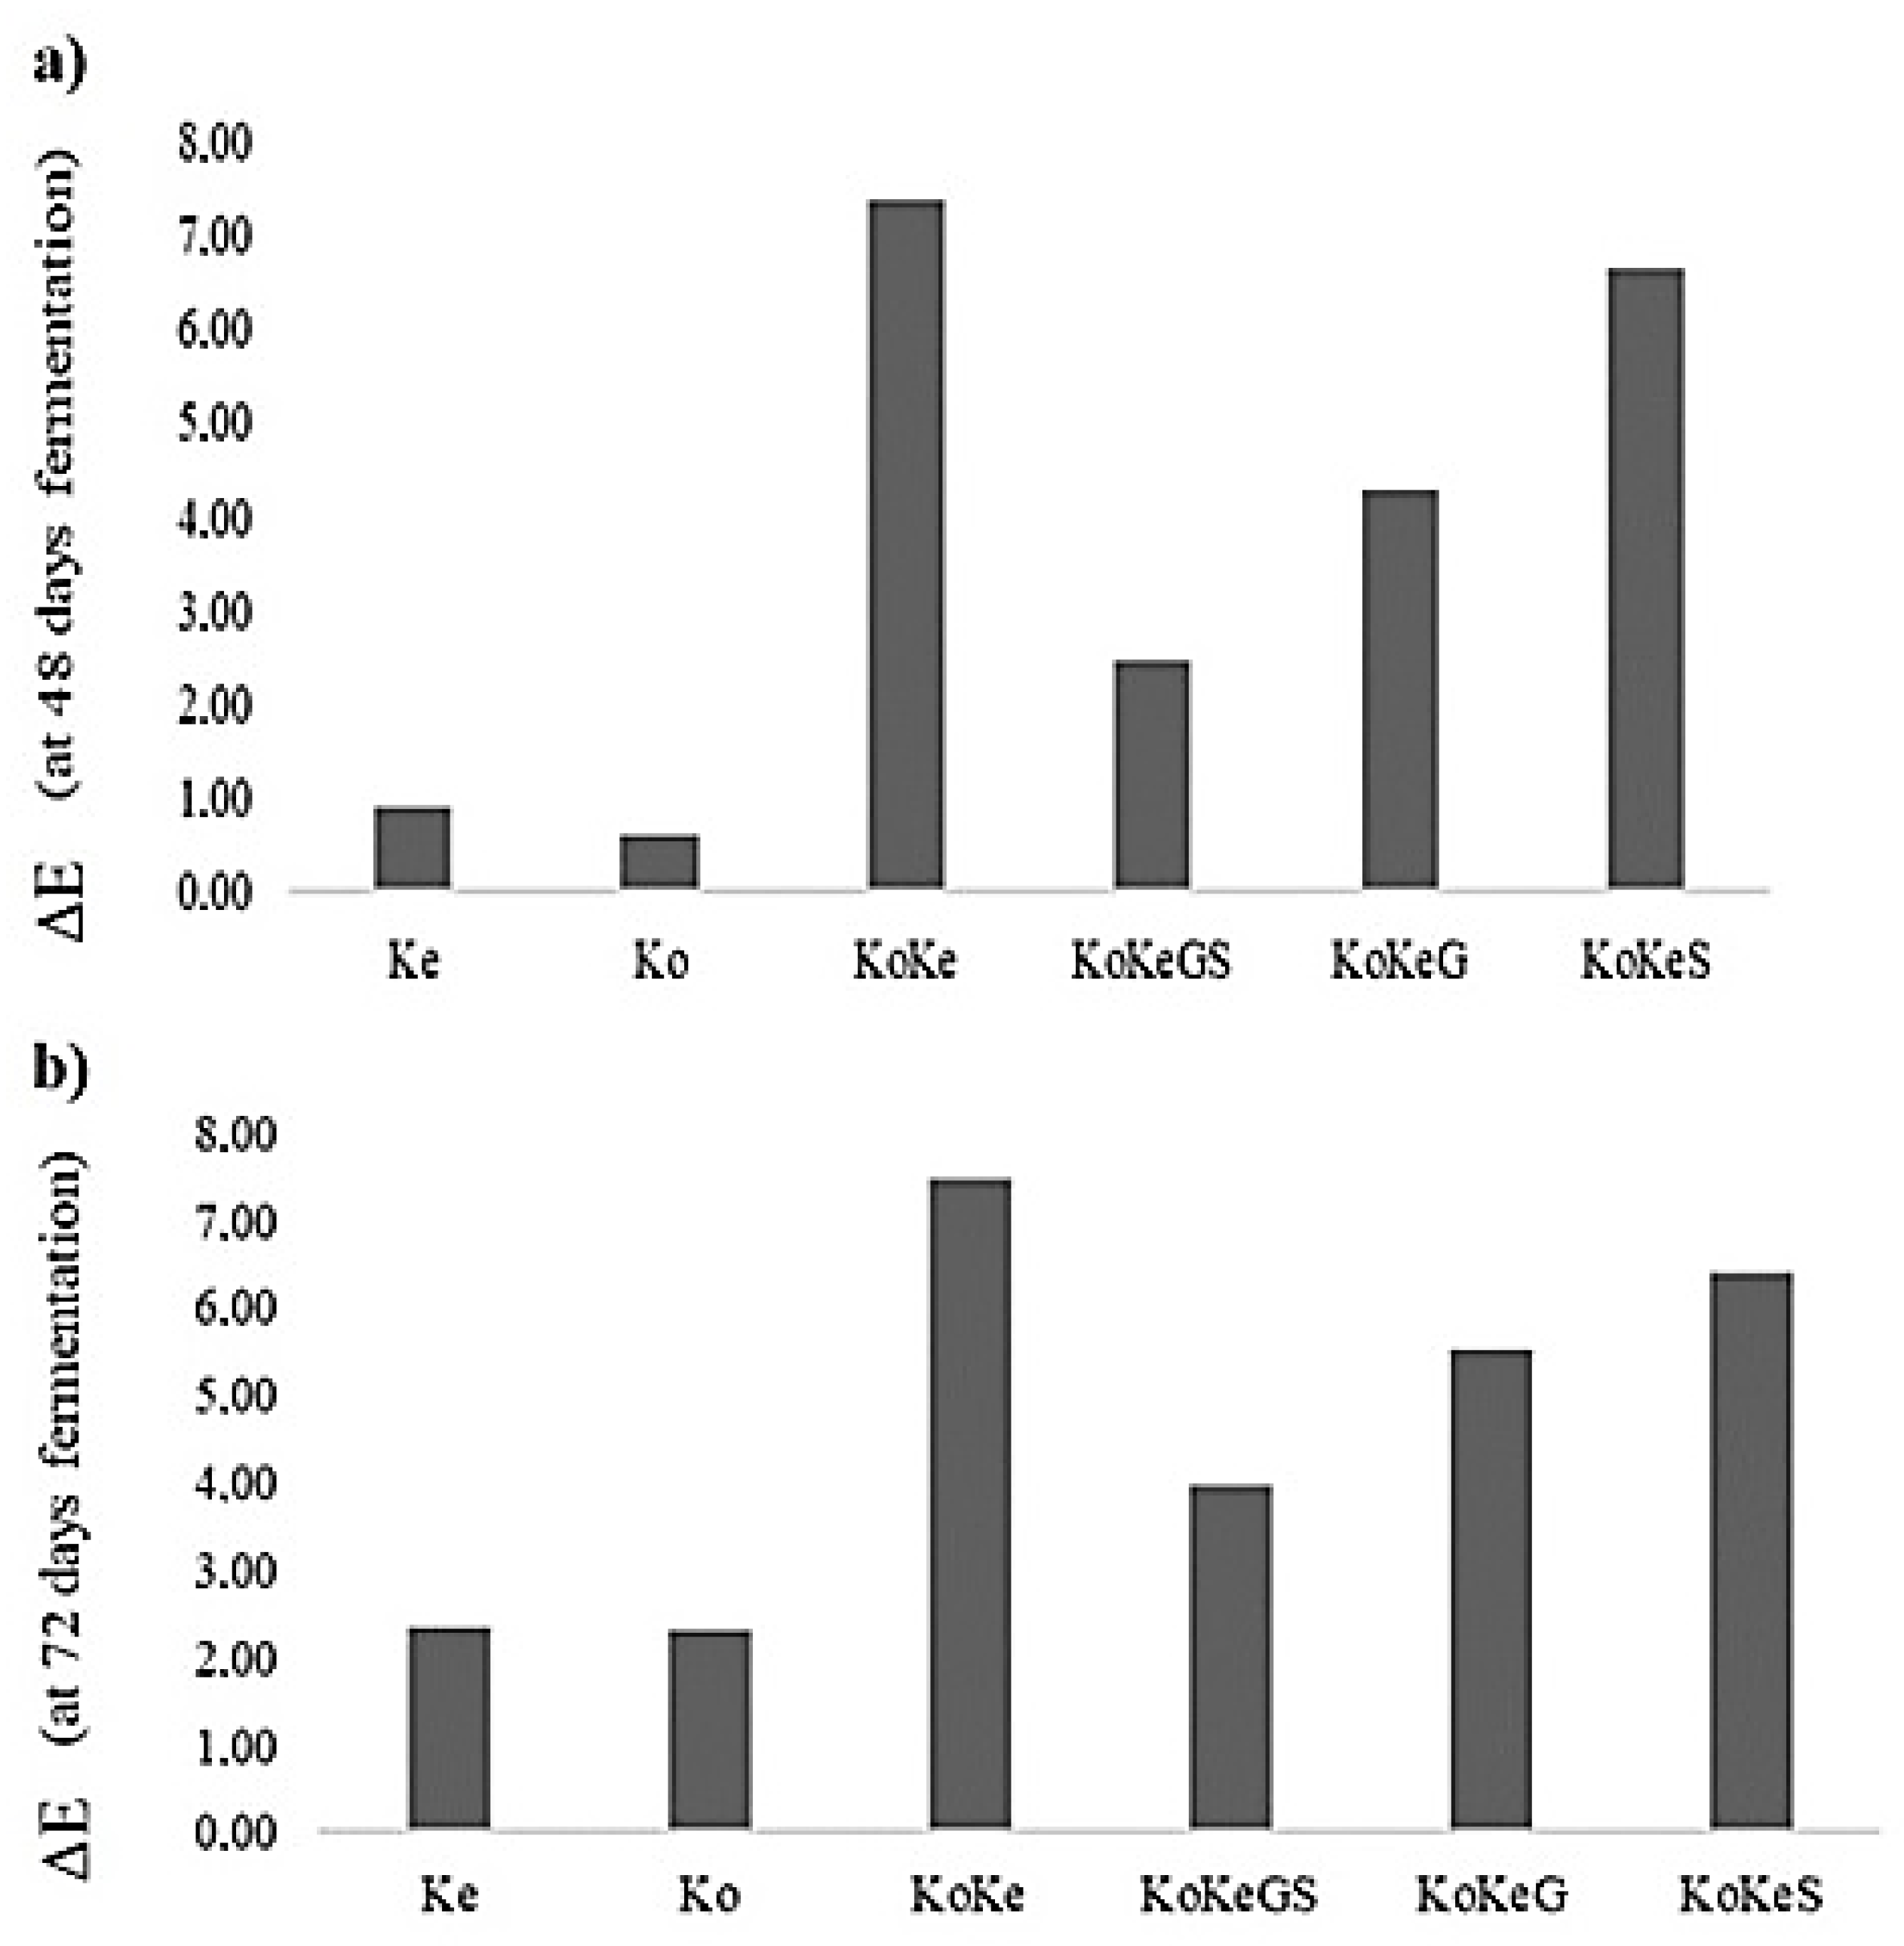
3.6. Effect of Fermentation on CIELab Parameters of Investigated Samples
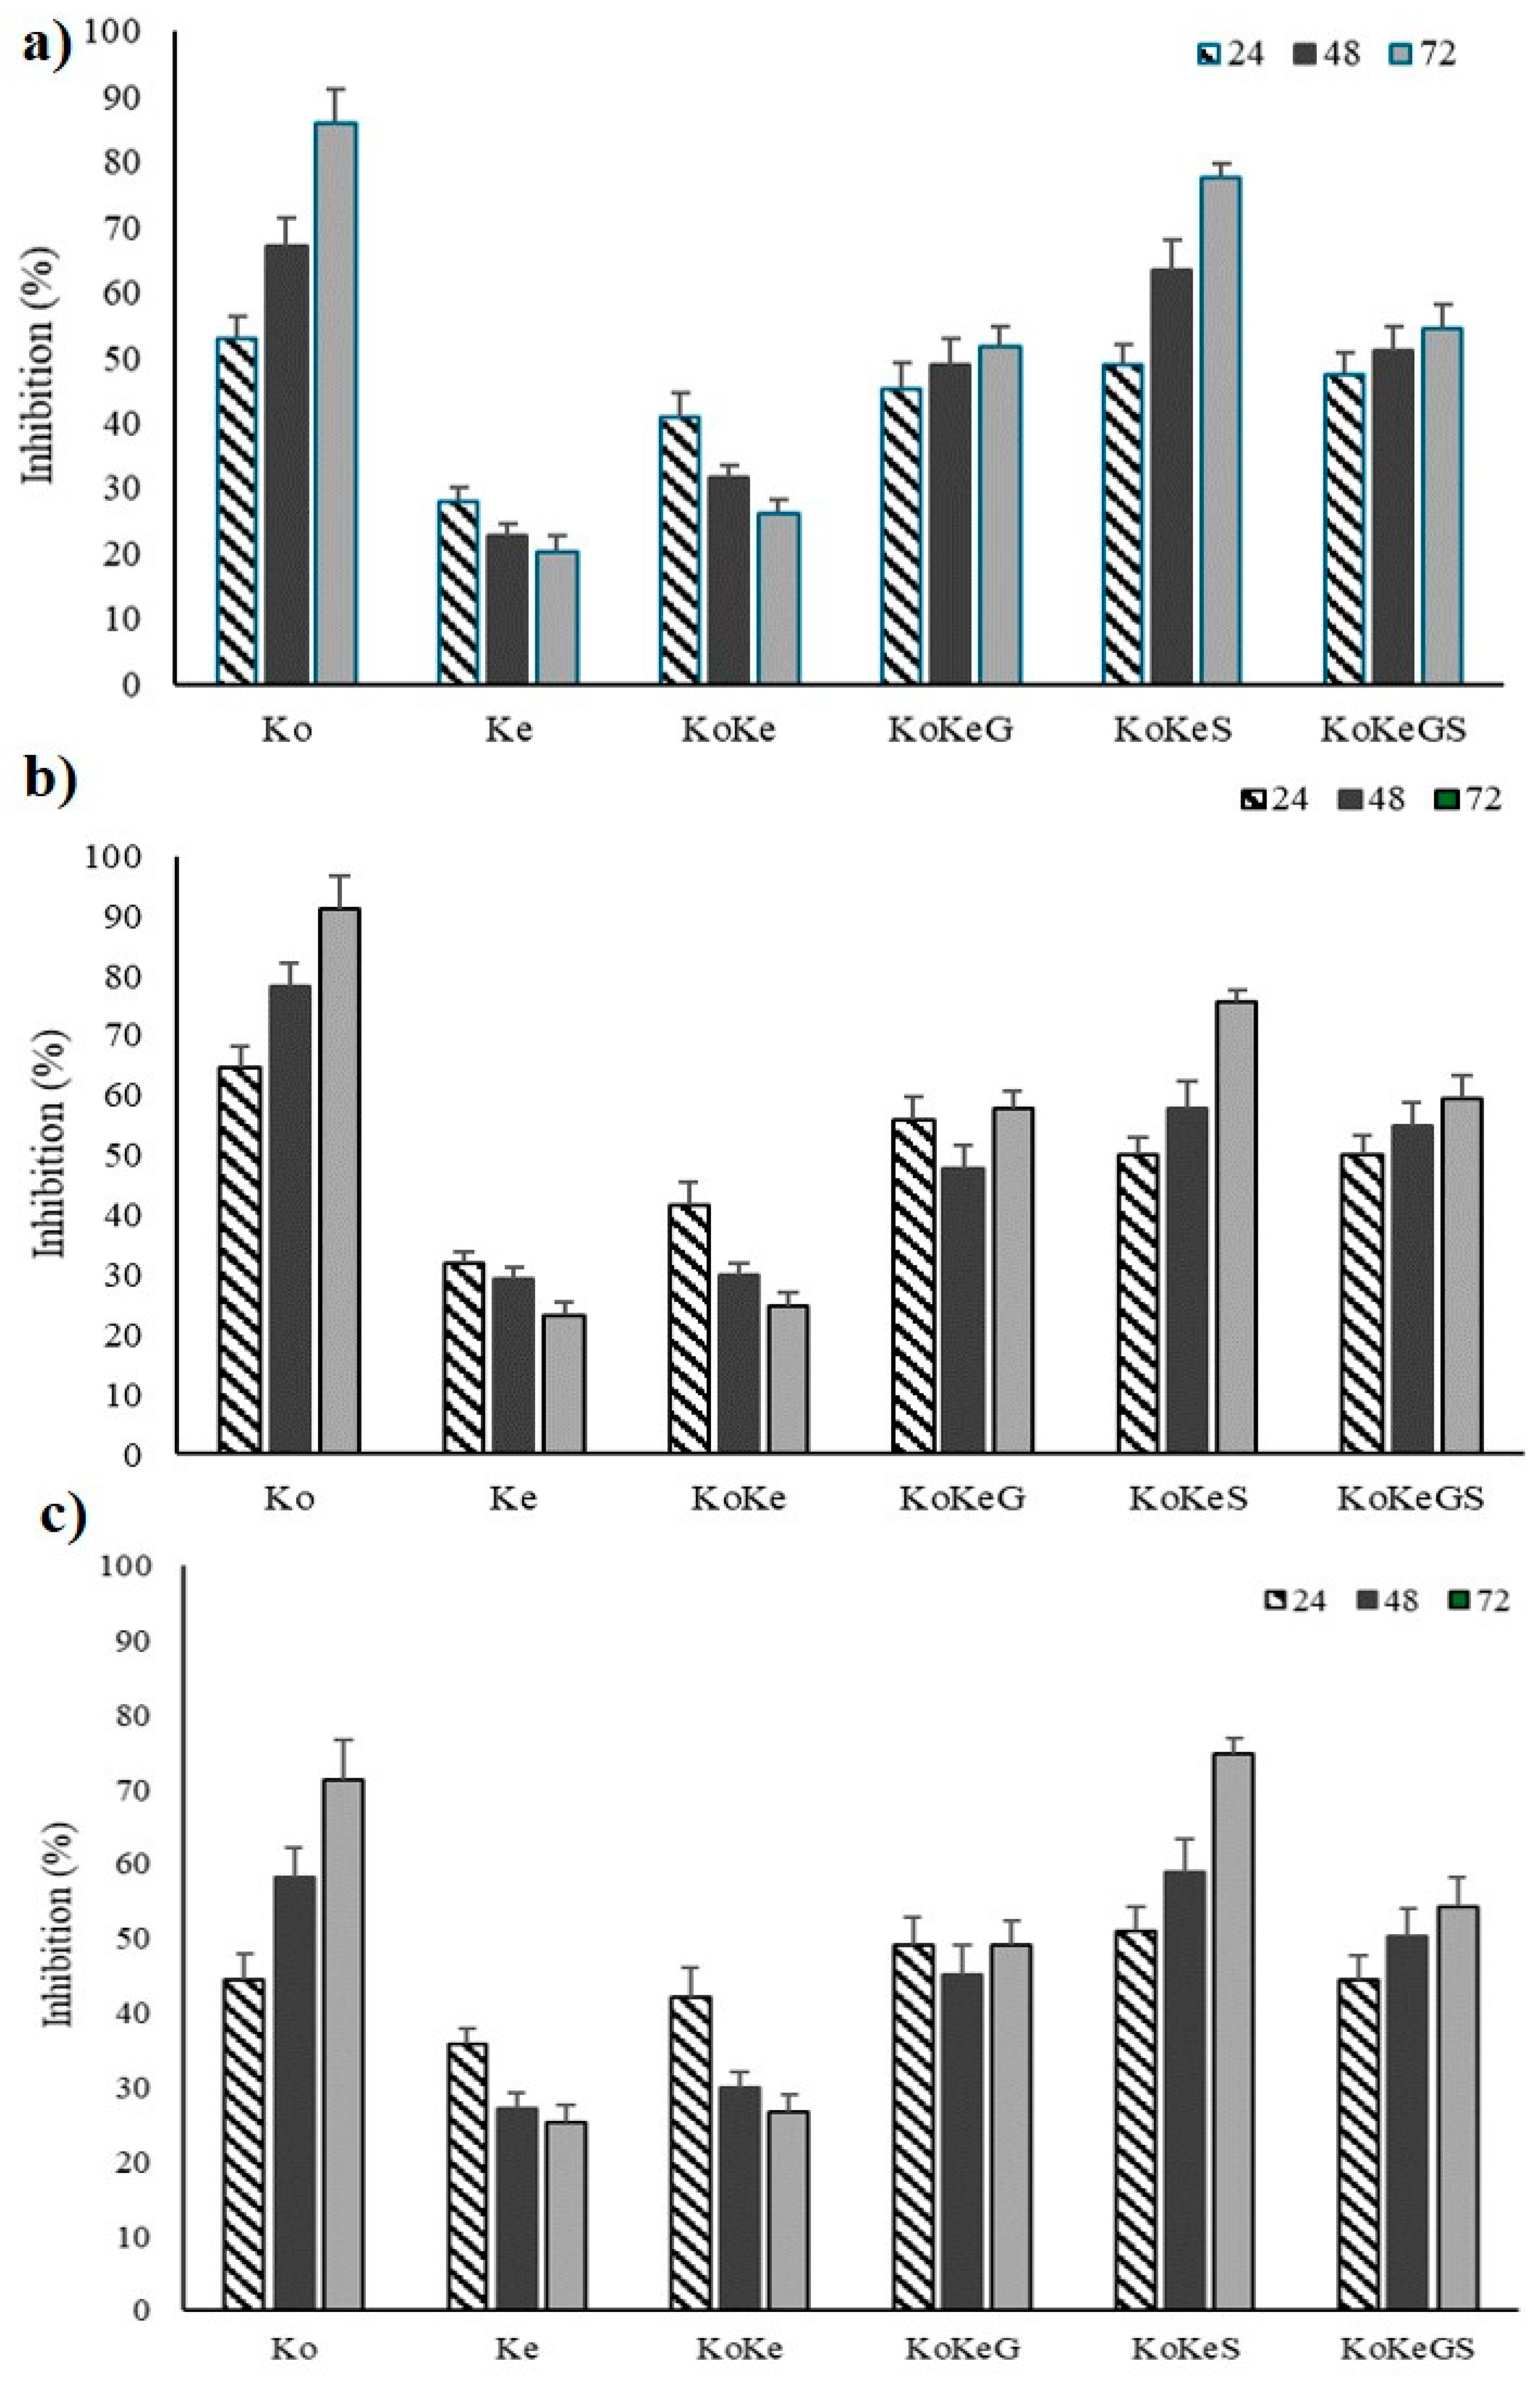
3.7. Enzyme Inhibition Capacity
4. Conclusions
Author Contributions
Funding
Data Availability Statement
Conflicts of Interest
Abbreviations
| Ko | Traditional Kombucha |
| Ke | Water Kefir |
| KoKe | kombucha and water kefir (1:1 v/v) |
| KoKeG | kombucha and water kefir (1:1 v/v) fermented by WKGs |
| KoKeS | kombucha and water kefir (1:1 v/v fermented by SCOBY |
| KoKeGS | kombucha and water kefir (1:1 v/v) co-fermented by WKGs and SCOBY |
| DPPH | 2,2-diphenyl-1-picrylhydrazyl |
| ABTS | 2,2′-azinobis-(3-ethylbenzthiazolin-6-sulfonic acid |
| TPC | Total phenolic content |
| TFC | Total flavonoid content |
| HPLC | High performance liquid chromatography |
| SCOBY | Symbiotic Culture of Bacteria and Yeast |
| WKGs | Water kefir grains |
References
- Lavefve, L.; Marasini, D.; Carbonero, F. Chapter Three—Microbial Ecology of Fermented Vegetables and Non-Alcoholic Drinks and Current Knowledge on Their Impact on Human Health. In Advances in Food and Nutrition Research; Toldrá, F., Ed.; Academic Press: Cambridge, MA, USA, 2019; Volume 87, pp. 147–185. [Google Scholar]
- Azcárate-Peril, M. Beneficial Modulation of the Gut Microbiome: Probiotics and Prebiotics. In How Fermented Foods Feed a Healthy Gut Microbiota; Azcarate-Peril, M., Arnold, R., Bruno-Bárcena, J., Eds.; Springer: Berlin/Heidelberg, Germany, 2019; pp. 309–324. [Google Scholar]
- Gille, D.; Schmid, A.; Walther, B.; Vergères, G. Fermented Food and Non-Communicable Chronic Diseases: A Review. Nutrients 2018, 10, 448. [Google Scholar] [CrossRef]
- Marco, M.; Heeney, D.; Binda, S.; Cifelli, C.; Cotter, P.; Foligné, B.; Kort, R.; Pasin, G.; Pihlanto, A.; Smid, E.; et al. Health benefits of fermented foods: Microbiota and beyond. Curr. Opin. Biotechnol. 2017, 44, 94–102. [Google Scholar] [CrossRef]
- Diez-Ozaeta, I.; Astiazaran, O.J. Recent advances in Kombucha tea: Microbial consortium, chemical parameters, health implications and biocellulose production. Int. J. Food Microbiol. 2022, 377, 109783. [Google Scholar] [CrossRef]
- Villarreal-Soto, S.A.; Beaufort, S.; Bouajila, J.; Souchard, J.-P.; Taillandier, P. Understanding Kombucha Tea Fermentation: A Review. J. Food Sci. 2018, 83, 580–588. [Google Scholar] [CrossRef]
- Gaggìa, F.; Baffoni, L.; Galiano, M.; Nielsen, D.; Jakobsen, R.; Castro-Mejia, J.; Bosi, S.; Truzzi, F.; Musumeci, F.; Dinelli, G.; et al. Kombucha Beverage from Green, Black and Rooibos Teas: A Comparative Study Looking at Microbiology, Chemistry and Antioxidant Activity. Nutrients 2018, 11, 1. [Google Scholar] [CrossRef]
- Dutta, H.; Paul, S.K. Kombucha Drink: Production, Quality, and Safety Aspects; Elsevier: Amsterdam, The Netherlands, 2019; pp. 259–288. [Google Scholar]
- Antolak, H.; Piechota, D.; Kucharska, A. Kombucha Tea—A Double Power of Bioactive Compounds from Tea and Symbiotic Culture of Bacteria and Yeasts (SCOBY). Antioxidants 2021, 10, 1541. [Google Scholar] [CrossRef]
- Miranda, J.; Ruiz, L.; Silva, C.; Uekane, T.; Silva, K.; Gonzalez, A.; Fernandes, F.; Lima, A. Kombucha: A review of substrates, regulations, composition, and biological properties. J. Food Sci. 2022, 87, 503–527. [Google Scholar] [CrossRef]
- Bortolomedi, B.M.; Paglarini, C.S.; Brod, F.C.A. Bioactive compounds in kombucha: A review of substrate effect and fermentation conditions. Food Chem. 2022, 385, 132719. [Google Scholar] [CrossRef]
- Randazzo, W.; Corona, O.; Guarcello, R.; Francesca, N.; Germanà, M.A.; Erten, H.; Moschetti, G.; Settanni, L. Development of new non-dairy beverages from Mediterranean fruit juices fermented with water kefir microorganisms. Food Microbiol. 2016, 54, 40–51. [Google Scholar] [CrossRef]
- Fiorda, F.A.; de Melo Pereira, G.V.; Thomaz-Soccol, V.; Rakshit, S.K.; Pagnoncelli, M.G.B.; Vandenberghe, L.P.d.S.; Soccol, C.R. Microbiological, biochemical, and functional aspects of sugary kefir fermentation—A review. Food Microbiol. 2017, 66, 86–95. [Google Scholar] [CrossRef]
- Papadopoulou, D.; Chrysikopoulou, V.; Rampaouni, A.; Plakidis, C.; Ofrydopoulou, A.; Shiels, K.; Saha, S.K.; Tsoupras, A. Antioxidant, Antithrombotic and Anti-Inflammatory Properties of Amphiphilic Bioactives from Water Kefir Grains and Its Apple Pomace-Based Fermented Beverage. Antioxidants 2025, 14, 164. [Google Scholar] [CrossRef]
- Açık, M.; Cakiroglu, F.; Altan, M.; Baybo, T. Alternative source of probiotics for lactose intolerance and vegan individuals: Sugary kefir. Food Sci. Technol. 2020, 40, 523–531. [Google Scholar] [CrossRef]
- Pihurov, M.; Păcularu-Burada, B.; Cotarlet, M.; Gurgu, L.; Borda, D.; Nicoleta, S.; Kluz, M.; Bahrim, G.E. Kombucha and Water Kefir Grains Microbiomes’ Symbiotic Contribution to Postbiotics Enhancement. Foods 2023, 12, 2581. [Google Scholar] [CrossRef]
- Araujo Filho, A.A.L.; Sousa, P.H.M.d.; Vieira, I.G.P.; Fernandes, V.B.; Cunha, F.E.T.; Magalhaes, F.E.A.; Silva, L.M.R.d. Kombucha and kefir fermentation dynamics on cashew nut beverage (Anacardium occidentale L.). Int. J. Gastron. Food Sci. 2023, 33, 100778. [Google Scholar] [CrossRef]
- La Torre, C.; Fazio, A.; Caputo, P.; Tursi, A.; Formoso, P.; Cione, E. Influence of Three Extraction Methods on the Physicochemical Properties of Kefirans Isolated from Three Types of Animal Milk. Foods 2022, 11, 1098. [Google Scholar] [CrossRef]
- La Torre, C.; Caputo, P.; Cione, E.; Fazio, A. Comparing Nutritional Values and Bioactivity of Kefir from Different Types of Animal Milk. Molecules 2024, 29, 2710. [Google Scholar] [CrossRef]
- La Torre, C.; Plastina, P.; Cione, E.; Bekatorou, A.; Petsi, T.; Fazio, A. Improved Antioxidant Properties and Vitamin C and B12 Content from Enrichment of Kombucha with Jujube (Ziziphus jujuba Mill.) Powder. Fermentation 2024, 10, 295. [Google Scholar] [CrossRef]
- Ceramella, J.; La Torre, C.; De Luca, M.; Iacopetta, D.; Fazio, A.; Catalano, A.; Ragno, G.; Longo, P.; Sinicropi, M.S.; Rosano, C.A.-O. Exploring the anticancer and antioxidant properties of Vicia faba L. pods extracts, a promising source of nutraceuticals. Peer J. 2022, 10, e13683. [Google Scholar] [CrossRef]
- Fazio, A.; La Torre, C.; Caroleo, M.C.; Caputo, P.; Cannataro, R.; Plastina, P.; Cione, E. Effect of Addition of Pectins from Jujubes (Ziziphus jujube Mill.) on Vitamin C Production during Heterolactic Fermentation. Molecules 2020, 25, 2706. [Google Scholar] [CrossRef]
- Iacopetta, D.; Fazio, A.; La Torre, C.; Barbarossa, A.; Ceramella, J.; Francomano, F.; Saturnino, C.; El-Kashef, H.; Alcaro, S.; Sinicropi, M.S. Annona cherimola Mill. Leaf Extracts Affect Melanoma Cells Growth and Progression. Foods 2022, 11, 2420. [Google Scholar] [CrossRef]
- Leporini, M.; Tundis, R.; Vincenzo, S.; Dugay, A.; Deguin, B.; Loizzo, M. Impact of extraction processes on phytochemicals content and biological activity of Citrus × clementina Hort. Ex Tan. leaves: New opportunity for under-utilized food by-products. Food Res. Int. 2020, 127, 108742. [Google Scholar] [CrossRef]
- Tireki, S. Influence of Water Properties on the Physicochemical and Sensorial Parameters of Water Kefir. J. Culin. Sci. Technol. 2024, 1–21. [Google Scholar] [CrossRef]
- Wang, B.; Rutherfurd-Markwick, K.; Naren, N.; Zhang, X.-X.; Mutukumira, A.N. Microbiological and Physico-Chemical Characteristics of Black Tea Kombucha Fermented with a New Zealand Starter Culture. Foods 2023, 12, 2314. [Google Scholar] [CrossRef]
- Laureys, D.; De Vuyst, L. The water kefir grain inoculum determines the characteristics of the resulting water kefir fermentation process. J. Appl. Microbiol. 2017, 122, 719–732. [Google Scholar] [CrossRef]
- Laureys, D.; Aerts, M.; Vandamme, P.; De Vuyst, L. The Buffer Capacity and Calcium Concentration of Water Influence the Microbial Species Diversity, Grain Growth, and Metabolite Production During Water Kefir Fermentation. Front. Microbiol. 2019, 10, 2876. [Google Scholar] [CrossRef]
- Pihurov, M.; Păcularu-Burada, B.; Cotârleț, M.; Bahrim, G.E. Tailoring the Optimized Fermentation Conditions of SCOBY-Based Membranes and Milk Kefir Grains to Promote Various Functional Properties. Foods 2022, 11, 3107. [Google Scholar] [CrossRef]
- Pihurov, M.; Bahrim, G.E.; Cotârleț, M. The Promotion of Biotication in Controlled Fermentation Using Kefir Grains and Kombucha Membranes as Starter Cultures. In Probiotics, Prebiotics, and Postbiotics in Human Health and Sustainable Food Systems; Vilela, A., Inês, A., Eds.; IntechOpen: Rijeka, Croatia, 2024. [Google Scholar]
- Stadie, J.; Gulitz, A.; Ehrmann, M.A.; Vogel, R.F. Metabolic activity and symbiotic interactions of lactic acid bacteria and yeasts isolated from water kefir. Food Microbiol. 2013, 35, 92–98. [Google Scholar] [CrossRef]
- Martínez-Torres, A.; Gutiérrez-Ambrocio, S.; Heredia-del-Orbe, P.; Villa-Tanaca, L.; Hernández-Rodríguez, C. Inferring the role of microorganisms in water kefir fermentations. Int. J. Food Sci. Technol. 2017, 52, 559–571. [Google Scholar] [CrossRef]
- Paredes, J.L.; Escudero-Gilete, M.L.; Vicario, I.M. A new functional kefir fermented beverage obtained from fruit and vegetable juice: Development and characterization. LWT 2022, 154, 112728. [Google Scholar] [CrossRef]
- Chong, A.Q.; Chin, N.L.; Talib, R.A.; Basha, R.K. Modelling pH Dynamics, SCOBY Biomass Formation, and Acetic Acid Production of Kombucha Fermentation Using Black, Green, and Oolong Teas. Processes 2024, 12, 1301. [Google Scholar] [CrossRef]
- Shori, A.B.; Aljohani, G.S.; Al-zahrani, A.J.; Al-sulbi, O.S.; Baba, A.S. Viability of probiotics and antioxidant activity of cashew milk-based yogurt fermented with selected strains of probiotic Lactobacillus spp. LWT 2022, 153, 112482. [Google Scholar] [CrossRef]
- Zhao, C.; Tang, G.; Cao, S.-Y.; Xu, X.-Y.; Gan, R.-Y.; Liu, Q.; Mao, Q.-Q.; Shang, A.; Li, H.-B. Phenolic Profiles and Antioxidant Activities of 30 Tea Infusions from Green, Black, Oolong, White, Yellow and Dark Teas. Antioxidants 2019, 8, 215. [Google Scholar] [CrossRef]
- Teixeira Oliveira, J.; Machado da Costa, F.; Gonçalvez da Silva, T.; Dotto Simões, G.; dos Santos Pereira, E.; Quevedo da Costa, P.; Andreazza, R.; Cavalheiro Schenkel, P.; Pieniz, S. Green tea and kombucha characterization: Phenolic composition, antioxidant capacity and enzymatic inhibition potential. Food Chem. 2023, 408, 135206. [Google Scholar] [CrossRef]
- La Torre, C.; Fazio, A.; Caputo, P.; Plastina, P.; Caroleo, M.C.; Cannataro, R.; Cione, E. Effects of Long-Term Storage on Radical Scavenging Properties and Phenolic Content of Kombucha from Black Tea. Molecules 2021, 26, 5474. [Google Scholar] [CrossRef]
- Hsieh, Y.; Chiu, M.-C.; Chou, J.-Y. Efficacy of the Kombucha Beverage Derived from Green, Black, and Pu’er Teas on Chemical Profile and Antioxidant Activity. J. Food Qual. 2021, 2021, 1735959. [Google Scholar] [CrossRef]
- Sarkar, P.; Abedin, M.M.; Singh, S.P.; Pandey, A.; Rai, A.K. 8—Microbial production and transformation of polyphenols. In Current Developments in Biotechnology and Bioengineering; Rai, A.K., Singh, S.P., Pandey, A., Larroche, C., Soccol, C.R., Eds.; Elsevier: Amsterdam, The Netherlands, 2022; pp. 189–208. [Google Scholar]
- Michlmayr, H.; Kneifel, W. β-Glucosidase activities of lactic acid bacteria: Mechanisms, impact on fermented food and human health. FEMS Microbiol. Lett. 2014, 352, 1–10. [Google Scholar] [CrossRef]
- De Montijo-Prieto, S.; Razola-Díaz, M.D.C.; Barbieri, F.; Tabanelli, G.; Gardini, F.; Jiménez-Valera, M.; Ruiz-Bravo, A.; Verardo, V.; Gómez-Caravaca, A.M. Impact of Lactic Acid Bacteria Fermentation on Phenolic Compounds and Antioxidant Activity of Avocado Leaf Extracts. Antioxidants 2023, 12, 298. [Google Scholar] [CrossRef]
- Coelho, R.M.D.; Almeida, A.L.d.; Amaral, R.Q.G.d.; Mota, R.N.d.; Sousa, P.H.M.d. Kombucha: Review. Int. J. Gastron. Food Sci. 2020, 22, 100272. [Google Scholar] [CrossRef]
- da Costa, M.R.; de Alencar, E.R.; dos Santos Leandro, E.; Mendonça, M.A.; de Souza Ferreira, W.F. Characterization of the kefir beverage produced from yam (Colocasia esculenta L.), sesame seed (Sesamum indicum L.) and bean (Phaseolus vulgaris L.) extracts. J. Food Sci. Technol. 2018, 55, 4851–4858. [Google Scholar] [CrossRef]
- Ziemlewska, A.; Nizioł-Łukaszewska, Z.; Bujak, T.; Zagórska-Dziok, M.; Wójciak, M.; Sowa, I. Effect of fermentation time on the content of bioactive compounds with cosmetic and dermatological properties in Kombucha Yerba Mate extracts. Sci. Rep. 2021, 11, 18792. [Google Scholar] [CrossRef]
- Guo, H.; Ji, J.; Wang, J.-s.; Sun, X. Deoxynivalenol: Masked forms, fate during food processing, and potential biological remedies. Compr. Rev. Food Sci. Food Saf. 2020, 19, 895–926. [Google Scholar] [CrossRef] [PubMed]
- Misra, N.N.; Koubaa, M.; Roohinejad, S.; Juliano, P.; Alpas, H.; Inácio, R.S.; Saraiva, J.A.; Barba, F.J. Landmarks in the historical development of twenty first century food processing technologies. Food Res. Int. 2017, 97, 318–339. [Google Scholar] [CrossRef] [PubMed]
- Huynh, N.T.; Van Camp, J.; Smagghe, G.; Raes, K. Improved Release and Metabolism of Flavonoids by Steered Fermentation Processes: A Review. Int. J. Mol. Sci. 2014, 15, 19369–19388. [Google Scholar] [CrossRef]
- Tu, C.; Yu, T.; Feng, S.; Xu, N.; Massawe, A.; Shui, S.; Zhang, B. Dynamics of microbial communities, flavor, and physicochemical properties of kombucha-fermented Sargassum fusiforme beverage during fermentation. LWT 2024, 192, 115729. [Google Scholar] [CrossRef]
- Zhu, K.; Ouyang, J.; Huang, J.; Liu, Z. Research progress of black tea thearubigins: A review. Crit. Rev. Food Sci. Nutr. 2020, 61, 1556–1566. [Google Scholar] [CrossRef]
- Jayabalan, R.; Subathradevi, P.; Marimuthu, S.; Sathishkumar, M.; Swaminathan, K. Changes in free-radical scavenging ability of kombucha tea during fermentation. Food Chem. 2008, 109, 227–234. [Google Scholar] [CrossRef]
- Zhang, B.; Zhang, Y.; Li, H.; Deng, Z.; Tsao, R. A review on insoluble-bound phenolics in plant-based food matrix and their contribution to human health with future perspectives. Trends Food Sci. Technol. 2020, 105, 347–362. [Google Scholar] [CrossRef]
- Kim, K.-S.; Park, K.-S.; Kim, M.-J.; Kim, S.-Y. Free Phenolic Contents and Their Antioxidant Activities of Fresh and Fermented Rice Spent Water. Food Sci. Biotechnol. 2010, 19, 1415–1420. [Google Scholar] [CrossRef]
- Papadopoulou, D.; Chrysikopoulou, V.; Rampaouni, A.; Tsoupras, A. Antioxidant and anti-inflammatory properties of water kefir microbiota and its bioactive metabolites for health promoting bio-functional products and applications. AIMS Microbiol. 2024, 10, 756–811. [Google Scholar] [CrossRef]
- Constantin, E.-A.; Popa-Tudor, I.; Matei, F.; Constantinescu-Aruxandei, D.; Oancea, F. Evaluation of Polyphenol Content and Antioxidant Activity of Standard Water Kefir. Chem. Proc. 2023, 13, 7. [Google Scholar] [CrossRef]
- Kim, H.; Hur, S.; Lim, J.; Jin, K.; Yang, T.-h.; Keehm, I.-s.; Kim, S.W.; Kim, T.; Kim, D. Enhancement of the phenolic compounds and antioxidant activities of Kombucha prepared using specific bacterial and yeast. Food Biosci. 2023, 56, 103431. [Google Scholar] [CrossRef]
- Chou, Y.-C.; Lin, H.-W.; Wang, C.-Y.; Hsieh, C.-C.; Santoso, S.P.; Lin, S.-P.; Cheng, K.-C. Enhancing Antioxidant Benefits of Kombucha Through Optimized Glucuronic Acid by Selected Symbiotic Fermentation Culture. Antioxidants 2024, 13, 1323. [Google Scholar] [CrossRef] [PubMed]
- Ziemlewska, A.; Zagórska-Dziok, M.; Nizioł-Łukaszewska, Z.; Kielar, P.; Mołoń, M.; Szczepanek, D.; Sowa, I.; Wójciak, M. In Vitro Evaluation of Antioxidant and Protective Potential of Kombucha-Fermented Black Berry Extracts against H2O2-Induced Oxidative Stress in Human Skin Cells and Yeast Model. Int. J. Mol. Sci. 2023, 24, 4388. [Google Scholar] [CrossRef] [PubMed]
- Jakubczyk, K.; Melkis, K.; Maciejewska-Markiewicz, D.; Muzykiewicz, A.; Nowak, A.; Skonieczna-Żydecka, K. Innovative approaches to enhancing kombucha through flavour additives: A phytochemical and antioxidant analysis. Food Funct. 2025, 16, 1442–1457. [Google Scholar] [CrossRef]
- Rumpf, J.; Burger, R.; Schulze, M. Statistical evaluation of DPPH, ABTS, FRAP, and Folin- Ciocalteu assays to assess the antioxidant capacity of lignins. Int. J. Biol. Macromol. 2023, 233, 123470. [Google Scholar] [CrossRef]
- Essiedu, J.A.; Areerate, P.; Withayagiat, U. Evaluation of physiochemical composition, phenolic compounds, and antioxidant activity of Kombucha produced from Thunbergia laurifolia as a potential functional food. Int. J. Food Sci. Technol. 2024, 59, 6999–7010. [Google Scholar] [CrossRef]
- Tran, T.; Grandvalet, C.; Verdier, F.; Martin, A.; Alexandre, H.; Tourdot-Maréchal, R. Microbial Dynamics between Yeasts and Acetic Acid Bacteria in Kombucha: Impacts on the Chemical Composition of the Beverage. Foods 2020, 9, 963. [Google Scholar] [CrossRef]
- Krishnan, J.; Gunavijayan, G.; Thangarasu, J. GCMS elucidation of bioactive metabolites from fermented Kombucha tea. Int. J. Adv. Biochem. Res. 2024, 8, 458–462. [Google Scholar]
- Chaluvadi, S.; Hotchkiss, A.T.; Smith, B.; McVaugh, B.; White, A.K.; Guron, G.K.P.; Renye, J.A.; Yam, K.L. Key Kombucha Process Parameters for Optimal Bioactive Compounds and Flavor Quality. Fermentation 2024, 10, 605. [Google Scholar] [CrossRef]
- Chong, A.Q.; Lau, S.W.; Chin, N.L.; Talib, R.A.; Basha, R.K. Fermented Beverage Benefits: A Comprehensive Review and Comparison of Kombucha and Kefir Microbiome. Microorganisms 2023, 11, 1344. [Google Scholar] [CrossRef]
- Laureys, D.; De Vuyst, L. Microbial Species Diversity, Community Dynamics, and Metabolite Kinetics of Water Kefir Fermentation. Appl. Env. Microbiol. 2014, 80, 2564–2572. [Google Scholar] [CrossRef] [PubMed]
- Neffe-Skocińska, K.; Karbowiak, M.; Kruk, M.; Kołożyn-Krajewska, D.; Zielińska, D. Polyphenol and antioxidant properties of food obtained by the activity of acetic acid bacteria (AAB)—A systematic review. J. Func. Foods 2023, 107, 105691. [Google Scholar] [CrossRef]
- Proença, C.; Freitas, M.; Ribeiro, D.; Oliveira, E.; Sousa, J.; Tomé, S.; Ramos, M.; Silva, A.; Fernandes, P.; Fernandes, E. α-Glucosidase inhibition by flavonoids: An in vitro and in silico structure–activity relationship study. J. Enzym. Inhib. Med. Chem. 2017, 32, 1216–1228. [Google Scholar] [CrossRef]
- Seehusen, K.; Dickmann, M.; Mann, F.; Strauss, M.; Hager, P.; Armando, S.; Schneider, R. Analysis of the role of acidity and tea substrate on the inhibition of α-amylase by Kombucha. J. Nutr. Food Res. Technol. 2017, 1, 1–5. [Google Scholar]
- Puspitasari, Y.; Tuenter, E.; Breynaert, A.; Foubert, K.; Herawati, H.; Hariati, A.; Aulanni’am, A.A.; De Bruyne, T.; Hermans, N. α-Glucosidase Inhibitory Activity of Tea and Kombucha from Rhizophora mucronata Leaves. Beverages 2024, 10, 22. [Google Scholar] [CrossRef]
- Kallel, L.; Desseaux, V.; Hamdi, M.; Stocker, P.; Ajandouz, E.H. Insights into the fermentation biochemistry of Kombucha teas and potential impacts of Kombucha drinking on starch digestion. Food Res. Int. 2012, 49, 226–232. [Google Scholar] [CrossRef]
- Xiudong, X.; Dai, Y.; Wu, H.; Liu, X.; Wang, Y.; Yin, L.; Wang, Z.; Li, X.; Zhou, J. Kombucha fermentation enhances the health-promoting properties of soymilk beverage. J. Funct. Foods 2019, 62, 103549. [Google Scholar]
- Aloulou, A.; Hamden, K.; Elloumi, D.; Ali, M.; Hargafi, K.; Jaouadi, B.; Ayadi, F.; Elfeki, A.; Ammar, E. Hypoglycemic and antilipidemic properties of Kombucha tea in alloxan-induced diabetic rats. BMC Complement. Altern. Med. 2012, 12, 63. [Google Scholar] [CrossRef]
- Pramono, A.; Gunawan, W.; Nurkolis, F.; Alisaputra, D.; Limen, G.; Alfaqih, M.; Ardiaria, M. Free radical scavenging, α-amylase, α-glucosidase, and lipase inhibitory activities of metabolites from strawberry kombucha: Molecular docking and in vitro studies. Pharmacia 2024, 71, 1–12. [Google Scholar] [CrossRef]
- Ru, L. Kombucha fermentation of mulberry leaves and its effect on the content and α-glucosidase inhibitory activity of flavonoid extracts. BIO Web Conf. 2023, 72, 01003. [Google Scholar] [CrossRef]
- Permatasari, H.; Nurkolis, F.; Augusta, P.; Mayulu, N.; Kuswari, M.; Taslim, N.; Wewengkang, D.; Batubara, S.; Gunawan, W. Kombucha Tea from Seagrapes (Caulerpa racemosa) Potential as A Functional Anti-Ageing Food: In Vitro and In Vivo Study. Heliyon 2021, 7, e07944. [Google Scholar] [CrossRef] [PubMed]
- Zubaidah, E.; Afgani, C.; Kalsum, U.; Srianta, I.; Blanc, P. Comparison of in vivo antidiabetes activity of snake fruit Kombucha, black tea Kombucha and metformin. Biocatal. Agric. Biotechnol. 2018, 17, 465–469. [Google Scholar] [CrossRef]
- Aji, O.R.; Putri, N.A.; Putri, D. Pancreatic lipase inhibitory activity of butterfly pea flower (Clitoria ternatea) Kombucha. Biog. J. Ilm. Biol. 2023, 11, 151–159. [Google Scholar]

| Bioactives | Treatment | Reaction Order | K-Value | Equation | R2 |
|---|---|---|---|---|---|
| TPC | |||||
| Ko | 1 | 0.0009 | y = 0.0009x + 3.9922 | 0.871 | |
| Ke * | - | - | - | - | |
| KoKe | 1 | 0.1065 | y = −0.1065x + 32.763 | 0.462 | |
| KoKeG | 1 | 0.004 | y = 0.004x + 3.2384 | 0.817 | |
| KoKeS | 1 | 0.007 | y = 0.0071x + 3.2989 | 0.756 | |
| KoKeGS | 1 | 0.0028 | y = 0.0028x + 3.3425 | 0.882 | |
| TFC | |||||
| Ko | 1 | 0.0057 | y = 0.0057x + 3.8928 | 0.917 | |
| Ke * | - | - | - | - | |
| KoKe | 1 | 0.0052 | y = 0.0052x + 3.5122 | 0.874 | |
| KoKeG | 1 | 0.0016 | y = 0.0016x + 3.271 | 0.992 | |
| KoKeS | 1 | 0.0123 | y = 0.0123x + 2.7128 | 0.910 | |
| KoKeGS | 1 | 0.0122 | y = 0.0122x + 2.4345 | 0.919 | |
| STD | Ellagic Acid | Rutin | Gallic Acid | Caffeine | Catechin | EGCG | Ferulic Acid | Chlorogenic Acid |
|---|---|---|---|---|---|---|---|---|
| λ (nm) | 254 | 254 | 270 | 273 | 280 | 280 | 325 | 327 |
| RT (min) | 47.7 | 46.5 | 11.7 | 30 | 31 | 12.2 | 42.2 | 32.2 |
| Samples | ||||||||
| Ko24h | 0.54 ± 0.01 a | 2.75 ± 0.01 a | 163.87 ± 1.03 a | 13.65 ± 0.35 c | n.d. b | 12.06 ± 0.02 c | 5.05 ± 0.01 a | n.d. b |
| Ko48h | 0.55 ± 0.01 a | 2.73 ± 0.01 a | 112.70 ± 0.08 b | 15.32 ± 0.06 b | n.d. b | 7.94 ± 0.15 d | 5.55 ± 0.01 a | 54.75 ± 0.22 a |
| Ko72h | 0.57 ± 0.01 a | 3.17 ± 0.01 a | 111.28 ± 0.46 b | 15.69 ± 0.28 b | n.d. b | 6.54 ± 0.40 d | 6.02 ± 0.01 a | 55.23 ± 0.02 a |
| Ke24h | 0.15 ± 0.01a | n.d. b | 12.17 ± 0.01 g | n.d. e | n.d. b | n.d. f | 1.52± 0.03 f | n.d. b |
| Ke48h | 0.35 ± 0.02 a | n.d. b | 20.65 ± 0.04 f | n.d. e | n.d. b | n.d. f | 2.08 ± 0.05 e | n.d. b |
| Ke72h | 0.45 ± 0.03 a | n.d. b | 33.23 ± 0.03 e | n.d. e | n.d. b | n.d. f | 3.12 ± 0.01 d | n.d. b |
| KoKe24h | 0.55 ± 0.01 a | 2.78 ± 0.09 a | 113.12 ± 0.74 b | 15.24 ± 0.56 b | n.d. b | 6.33 ± 0.08 d | 4.02 ± 0.01 c | 54.99 ± 0.13 a |
| KoKe48h | 0.55 ± 0.01 a | 2.84 ± 0.01 a | 110.32 ± 0.26 c | 13.17 ± 0.13 c | n.d. b | 5.94 ± 0.41 e | 4.44 ± 0.01 b | 54.50 ± 0.05 a |
| KoKe72h | 0.55 ± 0.01 a | 2.93 ± 0.01 a | 111.22 ± 0.36 b | 13.45 ± 0.17 c | 8.88 ± 0.03 a | 7.21 ± 0.22 d | 5.03 ± 0.01 b | 54.50 ± 0.11 a |
| KoKeG24h | 0.55 ± 0.01 a | 2.44 ± 0.01 a | 111.15 ± 0.16 b | 11.11 ± 0.01 d | 8.97 ± 0.01 a | 6.21 ± 0.05 e | 5.50 ± 0.01 a | 54.22 ± 1.71 a |
| KoKeG48h | 0.56 ± 0.01 a | 2.63 ± 0.02 a | 112.18 ± 0.32 b | 14.24 ± 0.50 c | 8.91 ± 0.02 a | 6.72 ± 0.09 e | 5.61 ± 0.01 a | 54.75 ± 0.01 a |
| KoKeG72h | 0.71 ± 0.01 a | 2.64 ± 0.03 a | 127.40 ± 0.01 d | 13.42 ± 0.05 c | 8.93 ± 0.01 a | 15.68 ± 0.01 a | 5.73 ± 0.01 a | 54.67 ± 0.06 a |
| KoKeS24h | 0.55 ± 0.01 a | 2.59 ± 0.05 a | 113.35 ± 2.08 b | 14.86 ± 1.42 b | 8.90 ± 0.01 a | 7.18 ± 1.21 d | 4.89 ± 0.01 b | 54.98 ± 0.34 a |
| KoKeS48h | 0.56 ± 0.01 a | 2.58 ± 0.01 a | 111.89 ± 0.43 b | 13.72 ± 0.24 c | 8.92 ± 0.02 a | 6.54 ± 0.31 d | 5.10 ± 0.01 a | 54.82 ± 0.01 a |
| KoKeS72h | 0.59 ± 0.01 a | 3.01 ± 0.15 a | 124.72 ± 0.83 d | 21.43 ± 0.40 a | 8.97 ± 0.02 a | 12.87 ± 0.55 b | 5.30 ± 0.01 a | 57.01 ± 0.13 a |
| KoKeGS24h | 0.55 ± 0.01 a | 2.58 ± 0.05 a | 111.42 ± 0.02 b | 14.15 ± 0.45 c | 8.91 ± 0.01 a | 6.49 ± 0.26 d | 5.04 ± 0.01 b | 54.69 ± 0.10 a |
| KoKeGS48h | 0.55 ± 0.01 a | 2.56 ± 0.01 a | 112.01 ± 0.05 b | 13.91 ± 0.02 c | 8.92 ± 0.02 a | 6.66 ± 0.03 d | 5.04 ± 0.01 b | 54.81 ± 0.04 a |
| KoKeGS72h | 0.56 ± 0.01 a | 2.57 ± 0.01 a | 112.15 ± 0.40 b | 13.42 ± 0.01 c | 8.92 ± 0.01 a | 6.42 ± 0.07 d | 5.02 ± 0.01 b | 54.68 ± 0.05 a |
| Samples | 100 µL | 50 µL | 25 µL | 10 µL | EC50 (µL ± SD) |
|---|---|---|---|---|---|
| Ko24h | 34.8 ± 0.2 | 33.9 ± 0.1 | 31.3 ± 0.1 | 28.0 ± 0.1 | 4.3 ± 0.5 a,A |
| Ko48h | 35.6 ± 0.1 | 33.9 ± 0.1 | 32.5 ± 0.2 | 29.0 ± 0.1 | 3.6 ± 0.6 a,A |
| Ko72h | 36.8 ± 0.1 | 34.7 ± 0.1 | 33.1 ± 0.1 | 29.5 ± 0.1 | 3.2 ± 0.5 a,A |
| Ke24h | 0 | 0 | 0 | 0 | - *c,E |
| Ke48h | 0.5 ± 0.3 | 0 | 0 | 0 | 26751 ± 4.4 b,E |
| Ke72h | 4.7 ± 0.2 | 0 | 0 | 0 | 2749 ± 3.4 a,E |
| KoKe24h | 34.7 ± 0.3 | 33.2 ± 0.4 | 28.0 ± 0.2 | 13.5 ± 0.7 | 11.1 ± 1.0 a,B |
| KoKe48h | 36.1 ± 0.1 | 34.4 ± 0.2 | 28.9 ± 0.1 | 13.9 ± 0.1 | 10.1 ± 1.0 a,B |
| KoKe72h | 36.3 ± 0.2 | 34.4 ± 0.2 | 28.9 ± 0.1 | 13.9 ± 0.1 | 10.1 ± 1.0 a,B |
| KoKeG24h | 35.5 ± 0.1 | 33.5 ± 0.3 | 16.1 ± 0.1 | 0.6 ± 0.2 | 23.3 ± 1.4 a,C |
| KoKeG48h | 35.9 ± 0.2 | 35.1 ± 0.4 | 17.6 ± 0.1 | 0 | 22.1 ± 1.3 a,C |
| KoKeG72h | 31.6 ± 1.2 | 27.1 ± 2.7 | 27.0 ± 2.7 | 5.4 ± 3.9 | 18.6 ± 1.3 a,C |
| KoKeS24h | 33.8 ± 0.2 | 32.6 ± 0.1 | 18.7 ± 0.1 | 9.1 ± 1.2 | 16.8 ± 1.3 b,D |
| KoKeS48h | 36.6 ± 0.1 | 34.8 ± 0.6 | 31.8 ± 0.1 | 11.2 ± 0.6 | 9.9 ± 1.2 a,D |
| KoKeS72h | 36.7 ± 0.1 | 34.9 ± 4.6 | 31.9 ± 1.1 | 12.2 ± 0.9 | 9.7 ± 1.2 a,D |
| KoKeGS24h | 36.6 ± 0.1 | 34.9 ± 0.6 | 27.8 ± 0.1 | 1.9 ± 0.1 | 15.4 ± 1.2 a,B |
| KoKeGS48h | 36.0 ± 1.1 | 33.1 ± 0.1 | 25.7 ± 1.2 | 8.3 ± 1.9 | 14.8 ± 1.2 a,B |
| KoKeGS72h | 37.1 ± 0.1 | 36.5 ± 0.3 | 30.2 ± 0.1 | 2.6 ± 0.6 | 13.6 ± 1.1 a,B |
| Samples | 100 µL | 50 µL | 25 µL | 10 µL | EC50 (µL ± SD) |
|---|---|---|---|---|---|
| Ko24h | 52.6 ± 0.1 | 52.1 ± 0.1 | 51.5 ± 0.1 | 41.1 ± 0.4 | 2.3 ± 0.4 c,A |
| Ko48h | 52.3 ± 0.1 | 51.5 ± 0.1 | 49.7 ± 0.2 | 48.4 ± 0.2 | 1.1 ± 0.1 b,A |
| Ko72h | 53.3 ± 0.2 | 53.3 ± 0.2 | 53.3 ± 0.2 | 50.7 ± 0.3 | 0.4 ± 0.1a,A |
| Ke24h | 46.4 ± 0.2 | 46.1 ± 0.1 | 0 | 0 | 39.8 ± 2.6 a,E |
| Ke48h | 48.1 ± 2.2 | 46.7 ± 0.4 | 3.1 ± 0.8 | 0 | 36.3 ± 1.5 a,E |
| Ke72h | 49.1 ± 0.4 | 48.5 ± 0.2 | 2.1 ± 0.2 | 1.2 ± 1.8 | 34.3 ± 1.4 a,C |
| KoKe24h | 51.9 ± 0.2 | 49.9 ± 0.3 | 22.1 ± 0.2 | 7.6 ± 0.1 | 20.8 ± 1.2 b,D |
| KoKe48h | 50.1 ± 0.3 | 46.9 ± 0.4 | 25.2 ± 0.1 | 13.6 ± 2.6 | 18.3 ± 1.3 b,D |
| KoKe72h | 53.1 ± 0.2 | 53.1 ± 0.2 | 53.1 ± 0.2 | 41.2 ± 0.1 | 2.1 ± 0.3 a,B |
| KoKeG24h | 50.7 ± 0.1 | 49.3 ± 0.3 | 36.4 ± 0.1 | 24.9 ± 0.1 | 9.4 ± 0.9 b,C |
| KoKeG48h | 51.2 ± 1.7 | 50.5 ± 1.8 | 37.5 ± 1.9 | 23.8 ± 1.1 | 9.2 ± 0.8 b,C |
| KoKeG72h | 53.1 ± 0.2 | 53.1 ± 0.2 | 53.1 ± 0.2 | 40.1 ± 0.3 | 2.2 ± 0.4 a,B |
| KoKeS24h | 51.7 ± 0.1 | 50.4 ± 3.4 | 48.1 ± 0.8 | 21.0 ± 0.3 | 7.8 ± 1.0 b,B |
| KoKeS48h | 51.8 ± 0.1 | 49.8 ± 0.4 | 48.1 ± 0.1 | 23.3 ± 0.2 | 7.1 ± 3.4 b,B |
| KoKeS72h | 53.1 ± 0.2 | 53.1 ± 0.2 | 53.1 ± 0.2 | 34.6 ± 1.1 | 3.4 ± 0.4 a,B |
| KoKeGS24h | 51.6 ± 0.1 | 50.3 ± 0.5 | 45.1 ± 0.1 | 25.7 ± 0.1 | 6.8 ± 0.7 a,B |
| KoKeGS48h | 51.9 ± 0.1 | 51.5 ± 0.2 | 46.8 ± 0.1 | 26.5 ± 0.4 | 6.2 ± 0.8 a,B |
| KoKeGS72h | 53.2 ± 1.1 | 53.2 ± 1.1 | 45.4 ± 0.2 | 30.5 ± 0.3 | 5.1 ± 0.6 a,B |
| 24 | 48 | 72 | 24 | 48 | 72 | 24 | 48 | 72 | |
|---|---|---|---|---|---|---|---|---|---|
| Samples | L * | C * | Hue | ||||||
| Ke | 43.15 ± 3.52 a | 43.95 ± 3.91 a | 45.49 ± 3.82 a | 4.70 ± 1.28 d | 4.93 ± 1.33 e | 5.11 ± 1.28 e | 1.56 ± 0.30 b | 1.57 ± 0.36 a | 1.55 ± 0.32 b |
| Ko | 36.91 ± 2.63 d | 36.54 ± 2.46 e | 38.21 ± 2.86 e | 24.80 ± 2.18 a | 23.05 ± 1.92 a | 24.35 ± 1.85 a | 1.35 ± 0.25 c | 1.35 ± 0.25 c | 1.38 ± 0.25 c |
| KoKe | 36.72 ± 2.76 d | 38.86 ± 2.85 c | 39.59 ± 2.94 c | 24.25 ± 2.17 b | 17.48 ± 1.64 c | 17.24 ± 1.69 c | 1.32 ± 0.23 d | 1.37 ± 0.28 b | 1.38 ± 0.28 c |
| KoKeGS | 37.25 ± 2.85 b | 39.03 ± 2.98 b | 40.15 ± 3.11 b | 7.18 ± 1.26 e | 8.85 ± 1.75 b | 8.64 ± 1.37 d | 0.71 ± 0.15 e | 1.37 ± 0.21 e | 1.06 ± 0.18 e |
| KoKeG | 35.53 ± 2.14 e | 38.62 ± 2.87 c | 40.05 ± 3.02 b | 24.86 ± 1.97 c | 15.35 ± 1.58 d | 22.82 ± 1.74 b | 1.33 ± 0.28 c | 1.38 ± 0.22 d | 1.44 ± 0.39 a |
| KoKeS | 38.27 ± 2.78 c | 38.14 ± 2.55 d | 38.87 ± 2.90 d | 23.86 ± 1.87 c | 18.78 ± 1.72 c | 17.62 ± 1.66 c | 1.40 ± 0.39 a | 1.36 ± 0.22 d | 1.34 ± 0.22 d |
Disclaimer/Publisher’s Note: The statements, opinions and data contained in all publications are solely those of the individual author(s) and contributor(s) and not of MDPI and/or the editor(s). MDPI and/or the editor(s) disclaim responsibility for any injury to people or property resulting from any ideas, methods, instructions or products referred to in the content. |
© 2025 by the authors. Licensee MDPI, Basel, Switzerland. This article is an open access article distributed under the terms and conditions of the Creative Commons Attribution (CC BY) license (https://creativecommons.org/licenses/by/4.0/).
Share and Cite
La Torre, C.; Pino, R.; Fazio, A.; Plastina, P.; Loizzo, M.R. Synergistic Bioactive Potential of Combined Fermented Kombucha and Water Kefir. Beverages 2025, 11, 65. https://doi.org/10.3390/beverages11030065
La Torre C, Pino R, Fazio A, Plastina P, Loizzo MR. Synergistic Bioactive Potential of Combined Fermented Kombucha and Water Kefir. Beverages. 2025; 11(3):65. https://doi.org/10.3390/beverages11030065
Chicago/Turabian StyleLa Torre, Chiara, Roberta Pino, Alessia Fazio, Pierluigi Plastina, and Monica Rosa Loizzo. 2025. "Synergistic Bioactive Potential of Combined Fermented Kombucha and Water Kefir" Beverages 11, no. 3: 65. https://doi.org/10.3390/beverages11030065
APA StyleLa Torre, C., Pino, R., Fazio, A., Plastina, P., & Loizzo, M. R. (2025). Synergistic Bioactive Potential of Combined Fermented Kombucha and Water Kefir. Beverages, 11(3), 65. https://doi.org/10.3390/beverages11030065