
Validation of N-Methylpyridinium as a Feasible Biomarker for Roasted Coffee Intake

 ,
,  ,
,  and
and
Abstract

1. Introduction
2. Materials and Methods
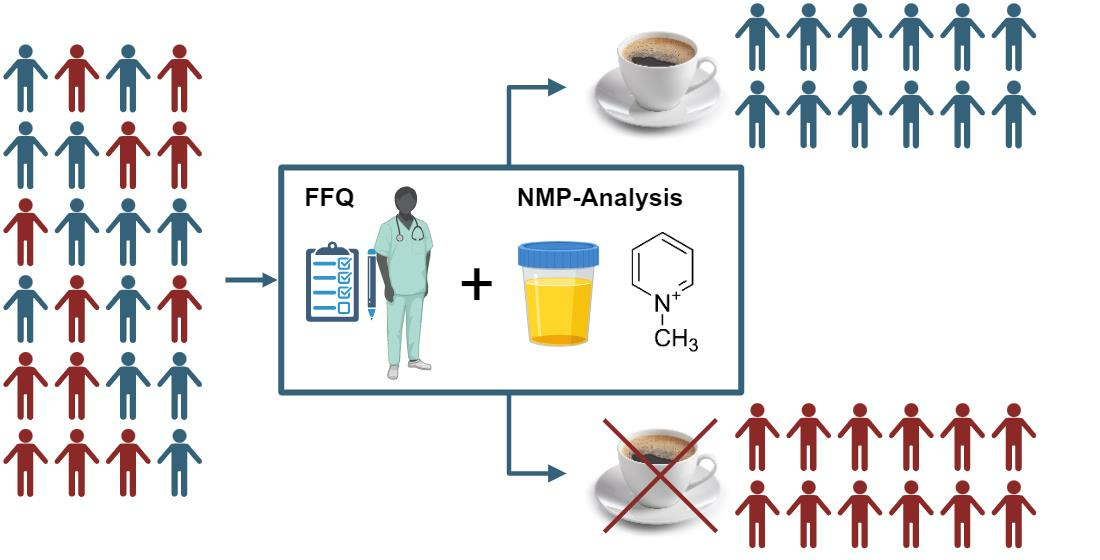
2.1. Criteria for the Validation of a Biomarker for Food Intake (BFI)
2.2. Quantification of NMP
2.3. Samples of Plasma, Blood, Dried Blood Spots, and Urine
2.4. Statistical Analysis
3. Results
3.1. Additional Data from a Cross Sectional Study
3.2. Plausibility
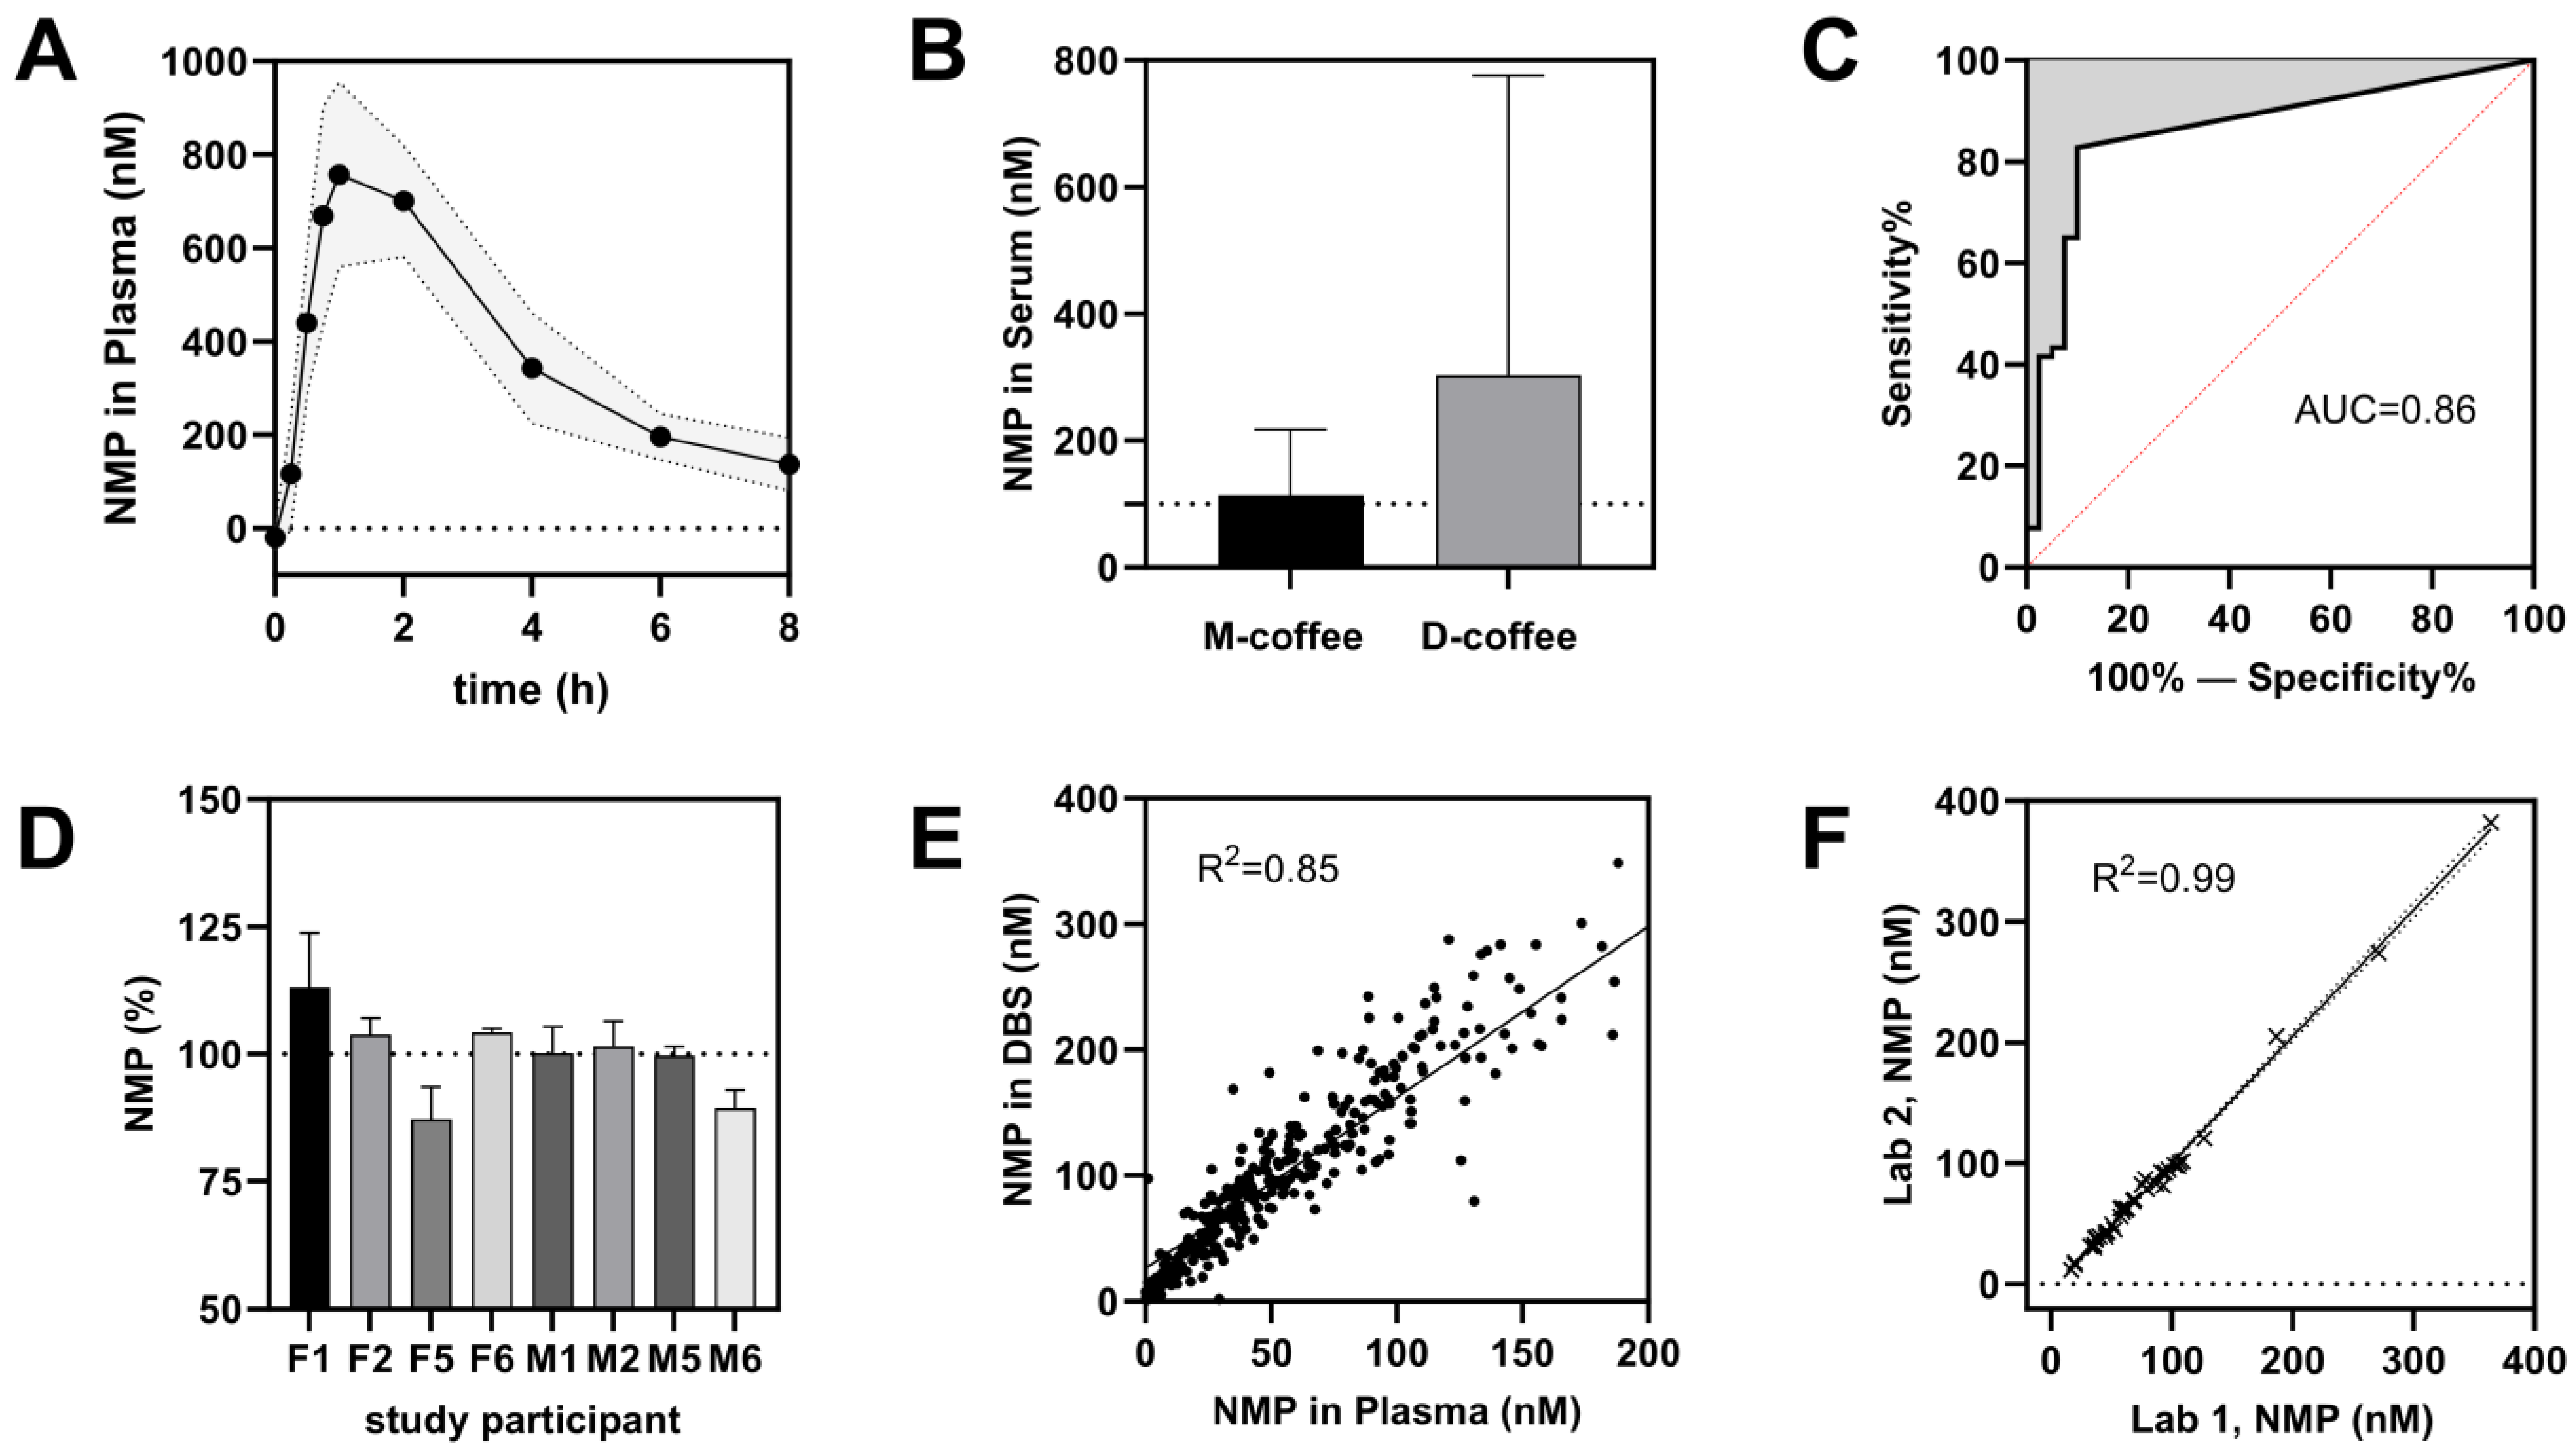
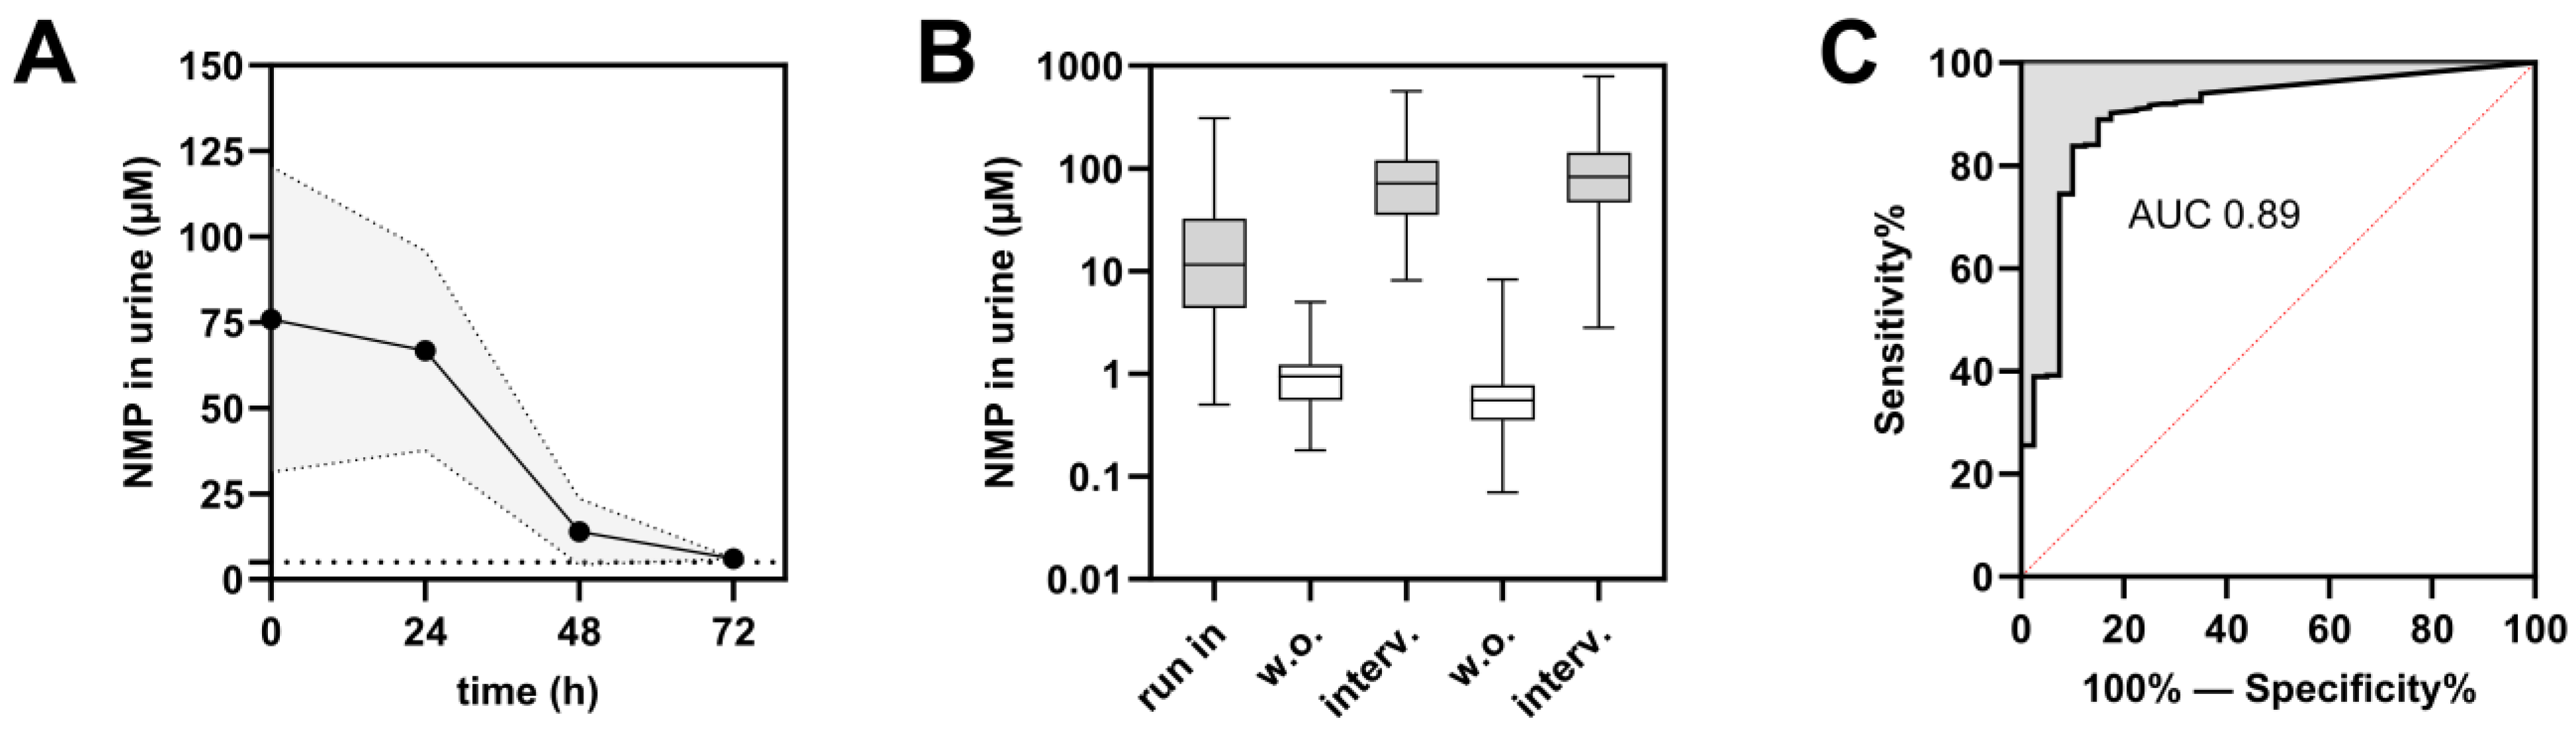
3.3. Time–Response
3.4. Dose Dependency
3.5. Robustness
3.6. Reliability
3.7. Stability
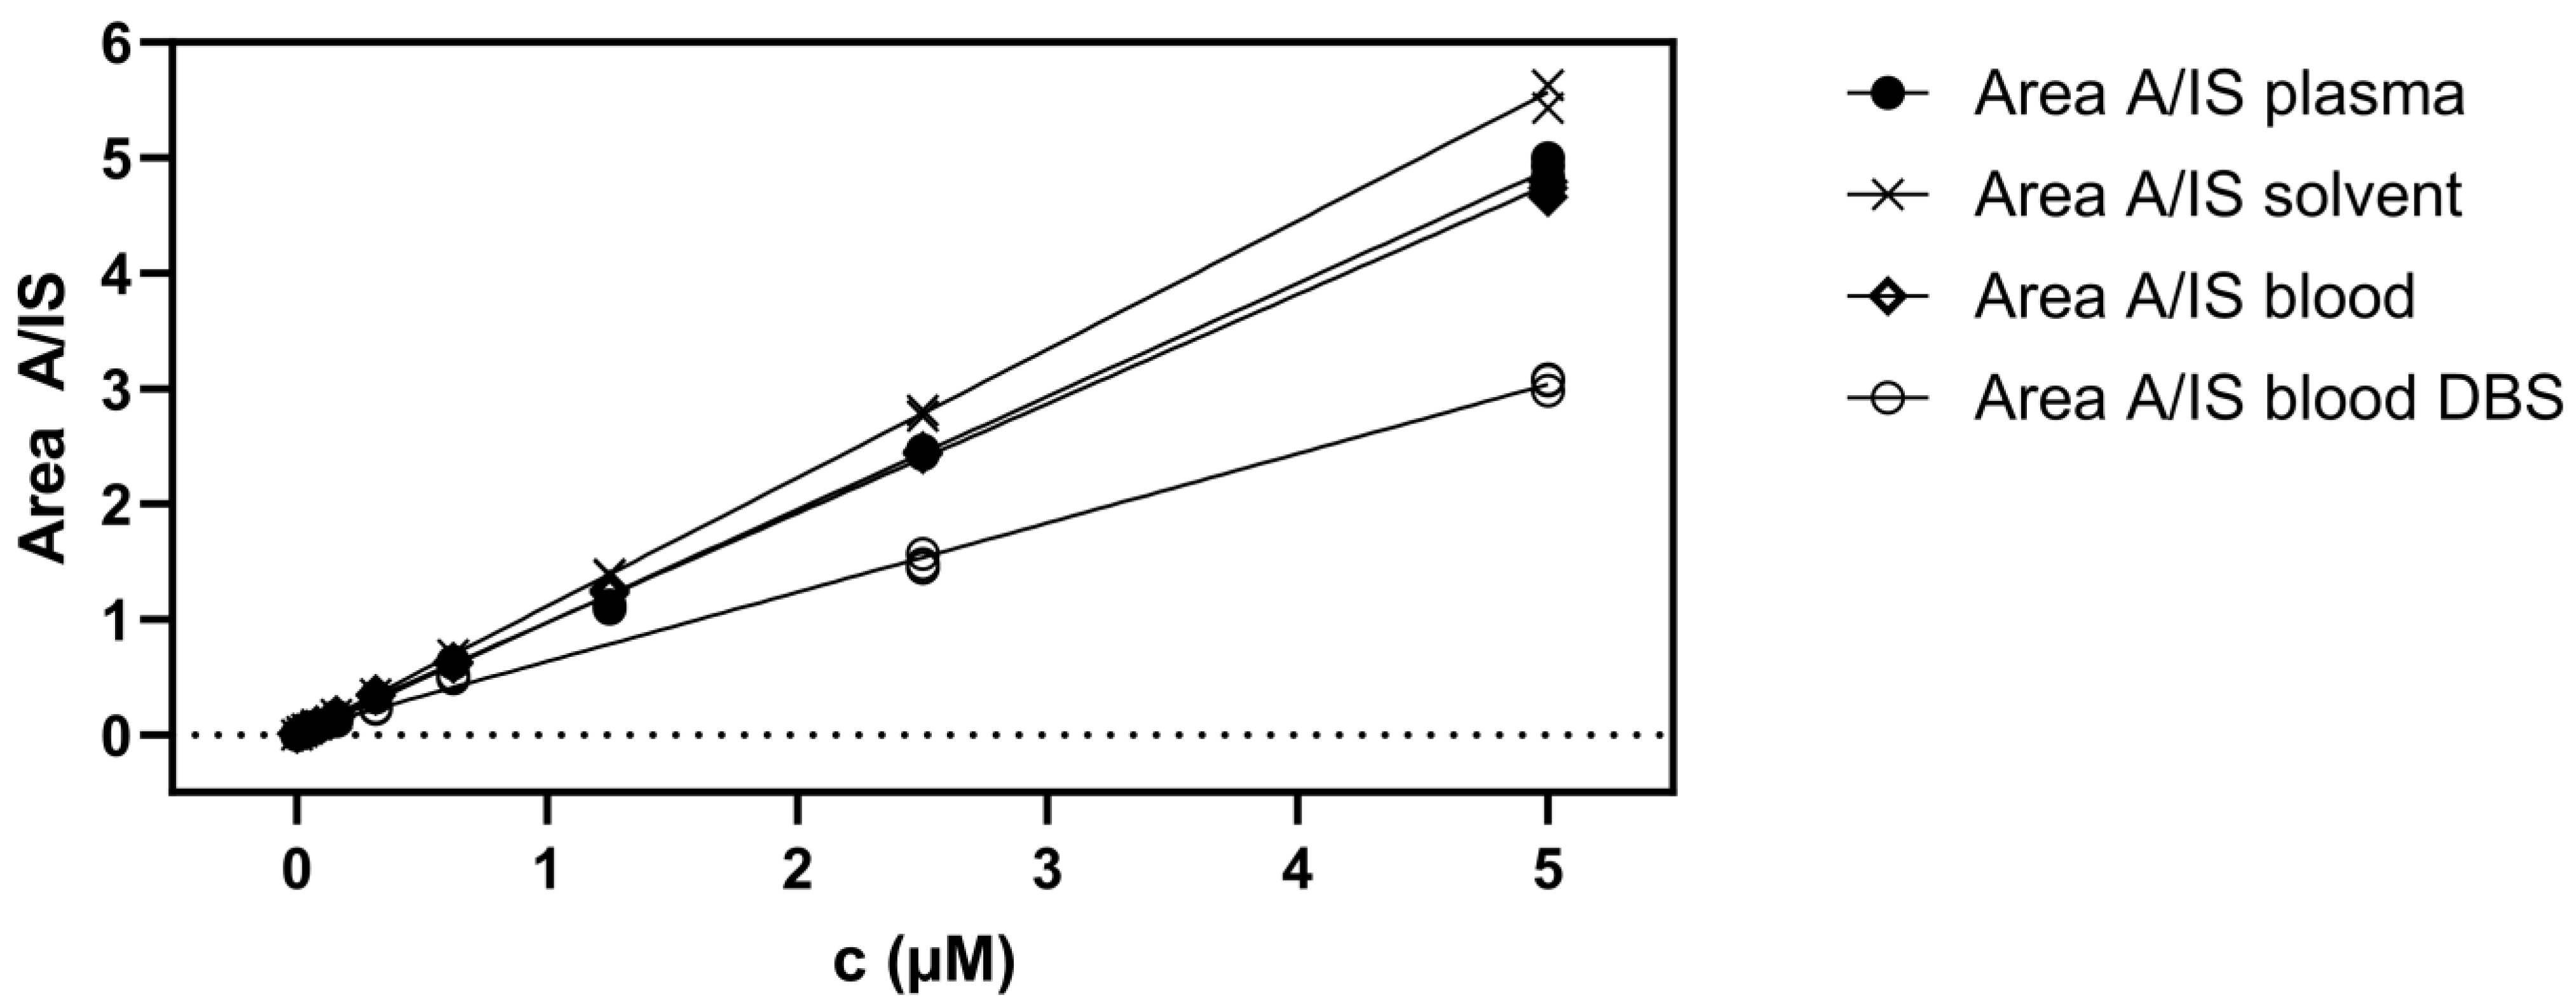
3.8. Analytical Performance
3.9. Reproducibility
4. Discussion
4.1. Plausibility
4.2. Time–Response and Dose–Response
4.3. Robustness
4.4. Reliability
4.5. Stability
4.6. Analytical Performance
4.7. Reproducibility
5. Conclusions
Supplementary Materials
Author Contributions
Funding
Data Availability Statement
Acknowledgments
Conflicts of Interest
Appendix A

| Coffee Drinkers | Non Coffee Drinkers | Non-Coffee Drinkers without Misreporters | |
|---|---|---|---|
| n | 388 | 40 | 37 |
| c (nM) | 52.0 ± 57.4 | 6.2 ± 23.4 | 0 |
| c min (nM) | 0.0 | 0.0 | 0 |
| c max (nM) | 364.0 | 135.9 (three outliers, possibly misreported: 43.6 nM, 135.9 nM, 47.1 nM) | 0 |
| Median | 37.2 | 0.01 | 0.01 |
| Area under ROC curve | 0.8617 | 0.9065 | |
| Std. Error | 0.0299 | 0.0157 | |
| 95% confidence interval | 0.8030–0.9203 | 0.8757–0.9373 | |
| p value | <0.0001 | <0.0001 |
| Sample | C NMP (Means ± SD) | Ratio | |
|---|---|---|---|
| 2010 a | 2019 (n = 3) b | ||
| 1 | 839.0 ± 134.4 | 949.0 ± 89.2 | 1.13 |
| 2 | 673.5 ± 33.3 | 698.9 ± 21.8 | 1.04 |
| 3 | 872.5 ± 37.5 | 760.5 ± 55.2 | 0.87 |
| 4 | 741.5 ± 31.8 | 772.8 ± 5.6 | 1.04 |
| 5 | 1287.0 ± 4.2 | 1288.8 ± 66.7 | 1.00 |
| 6 | 760.0 ± 101.9 | 771.3 ± 37.6 | 1.01 |
| 7 | 537.0 ± 55.2 | 535.0 ± 9.8 | 1.00 |
| 8 | 586.0 ± 53.7 | 523.3 ± 20.9 | 0.89 |
| Matrix | Calibration Standards a | |||
|---|---|---|---|---|
| Calibrated Range (nM) | Precision (RSD, %) | Accuracy (%) | R2 | |
| Solvent | 19–10,000 | ≤4.9 | 95–102 | 0.995 |
| Plasma (EDTA) | 19–10,000 | ≤5.1 | 85–109 | 0.999 |
| Blood (porcine, EDTA) | 19–5000 | ≤8.4 | 91–111 | 0.999 |
| Dried Bloodspot (porcine, EDTA) | 19–5000 | ≤10.2 | 64–97 | 0.998 |
| Matrix | Low QC (156 nM) | High QC (1250 nM) | ||||
|---|---|---|---|---|---|---|
| Found (nM) | Precision (RSD, %) | Accuracy (%) | Found (nM) | Precision (RSD, %) | Accuracy (%) | |
| Solvent (20% aq. MeOH) a | 154.0 ± 7.6 | 5.0 | 98.7 | 1215.0 ± 23.6 | 1.9 | 97.2 |
| Plasma (EDTA) a,b | 167.9 ± 4.6 | 2.7 | 107.6 | 1204.7 ± 15.5 | 1.3 | 96.4 |
| 157.9 ± 4.6 | 2.9 | 101.3 | 1378.7 ± 12.5 | 0.9 | 110.3 | |
| Blood (porcine, EDTA) a,b | 173.2 ± 3.4 | 1.9 | 111.0 | 1308.0 ± 14.9 | 1.1 | 104.6 |
| 175.8 ± 2.6 | 1.5 | 112.7 | 1350.4 ± 25.1 | 1.9 | 108.0 | |
| Coffee Drinkers | Non-Coffee Drinkers | |
|---|---|---|
| n | 388 | 40 |
| c (µM) | 19.5 ± 25.9 | 1.6 ± 5.1 |
| c min (µM) | 0.0 | 0.0 |
| c max (µM) | 179.3 | 23.1 |
| Median | 12.9 | 0.01 |
| Area under ROC curve | 0.8996 | |
| Std. Error | 0.0276 | |
| 95% confidence interval | 0.8455–0.9538 | |
| p value | <0.0001 | |

References
- Loftfield, E.; Freedman, N.D.; Dodd, K.W.; Vogtmann, E.; Xiao, Q.; Sinha, R.; Graubard, B.I. Coffee Drinking Is Widespread in the United States, but Usual Intake Varies by Key Demographic and Lifestyle Factors. J. Nutr. 2016, 146, 1762–1768. [Google Scholar] [CrossRef] [PubMed]
- National Coffee Association. Total Coffee per Capita Consumption in the United States in 2020 by Age Group (in Cups per Day). In Statista. Available online: https://www.statista.com/statistics/456366/total-us-coffee-per-capita-consumption-by-age-group/ (accessed on 18 September 2023).
- Statista Survey. How Many Cups of Coffee (7 oz), on Average, Do You Drink per Day? (Country Comparison). In Statista. Available online: https://www.statista.com/statistics/695772/average-daily-coffee-consumption-by-country/ (accessed on 18 September 2023).
- Kaffee im Welthandel, Statistik-Report zum Welthandel mit Kaffee. Available online: https://de.statista.com/statistik/studie/id/23635/dokument/kaffee-im-welthandel-statista-dossier/ (accessed on 18 September 2023).
- Micek, A.; Jurek, J.; Owczarek, M.; Guerrera, I.; Torrisi, S.A.; Castellano, S.; Grosso, G.; Alshatwi, A.A.; Godos, J. Polyphenol-rich beverages and mental health outcomes. Antioxidants 2023, 12, 272. [Google Scholar] [CrossRef] [PubMed]
- Lowery, L.M.; Anderson, D.E.; Scanlon, K.F.; Stack, A.; Escalante, G.; Campbell, S.C.; Kerksick, C.M.; Nelson, M.T.; Ziegenfuss, T.N.; VanDusseldorp, T.A.; et al. International society of Sports Nutrition position stand: Coffee and sports performance. J. Int. Soc. Sports Nutr. 2023, 20, 2237952. [Google Scholar] [CrossRef] [PubMed]
- Zhou, A.; Taylor, A.E.; Karhunen, V.; Zhan, Y.; Rovio, S.P.; Lahti, J.; Sjögren, P.; Byberg, L.; Lyall, D.M.; Auvinen, J.; et al. Habitual coffee consumption and cognitive function: A Mendelian randomization meta-analysis in up to 415,530 participants. Sci. Rep. 2018, 8, 7526. [Google Scholar] [CrossRef] [PubMed]
- Pinsuwan, A.; Suwonsichon, S.; Chompreeda, P.; Prinyawiwatkul, W. Sensory Drivers of Consumer Acceptance, Purchase Intent and Emotions toward Brewed Black Coffee. Foods 2022, 11, 180. [Google Scholar] [CrossRef] [PubMed]
- Preedy, V.R. (Ed.) Coffee in Health and Disease Prevention; Academic Press: San Diego, CA, USA, 2015; ISBN 978-0-12-409517-5. [Google Scholar] [CrossRef]
- Iriono-DeHond, A.; Rodríguez Casa, A.; del Castillo, M.D. Interest of Coffee Melanoidins as Sustainable Healthier Food Ingredients. Front. Nutr. 2021, 8, 730343. [Google Scholar] [CrossRef]
- Clifford, M.N.; Kerimi, A.; Williamson, G. Bioavailability and metabolism of chlorogenic acids (acyl-quinic acids) in humans. Comp. Rev. Food Sci. Food Saf. 2020, 19, 1–54. [Google Scholar] [CrossRef] [PubMed]
- Ren, Y.; Wang, C.; Xu, J.; Wang, S. Cafestol and Kahweol: A Review on Their Bioactivities and Pharmacological Properties. Int. J. Mol. Sci. 2019, 20, 4238. [Google Scholar] [CrossRef]
- Nehlig, A. Interindividual Differences in Caffeine Metabolism and Factors Driving Caffeine Consumption. Pharmacol. Rev. 2018, 70, 384–411. [Google Scholar] [CrossRef]
- Bohn, S.K.; Blomhoff, R.; Paur, I. Coffee and cancer risk, epidemiological evidence, and molecular mechanisms. Mol. Nutr. Food Res. 2014, 58, 915–930. [Google Scholar] [CrossRef]
- Osama, H.; Abdelrahman, M.A.; Madney, Y.M.; Harb, H.S.; Saeed, H.; Abdelrahim, M.E.A. Coffee and type 2 diabetes risk: Is the association mediated by adiponectin, leptin, c-reactive protein or Interleukin-6? A systematic review and meta-analysis. Int. J. Clin. Pract. 2021, 75, e13983. [Google Scholar] [CrossRef] [PubMed]
- Ranheim, T.; Halvorsen, B. Coffee consumption and human health—Beneficial or detrimental?—Mechanisms for effects of coffee consumption on different risk factors for cardiovascular disease and type 2 diabetes mellitus. Mol. Nutr. Food Res. 2005, 49, 274–284. [Google Scholar] [CrossRef] [PubMed]
- Naska, A.; Lagiou, A.; Lagiou, P. Dietary assessment methods in epidemiological research: Current state of the art and future prospects [version 1; referees: 3 approved]. F1000Research 2017, 6, 926. [Google Scholar] [CrossRef] [PubMed]
- Picó, C.; Serra, F.; Rodríguez, A.M.; Keijer, J.; Palou, A. Biomarkers of Nutrition and Health: New Tools for New Approaches. Nutrients 2019, 11, 1092. [Google Scholar] [CrossRef] [PubMed]
- Ulaszewska, M.M.; Weinert, C.H.; Trimigno, A.; Portmann, R.; Lacueva, C.A.; Badertscher, R.; Brennan, L.; Brunius, C.; Bub, A.; Capozzi, F.; et al. Nutrimetabolomics: An Integrative Action for Metabolomic Analyses in Human Nutritional Studies. Mol. Nutr. Food Res. 2019, 63, e1800384. [Google Scholar] [CrossRef]
- Dragsted, L.O.; Gao, Q.; Scalbert, A.; Vergères, G.; Kolehmainen, M.; Manach, C.; Brennan, L.; Afman, L.A.; Wishart, D.S.; Andres Lacueva, C.; et al. Validation of biomarkers of food intake—Critical assessment of candidate biomarkers. Genes Nutr. 2018, 13, 14. [Google Scholar] [CrossRef] [PubMed]
- Esquivel-Alvarado, D.; Zhang, S.; Hu, C.; Zhao, Y.; Sang, S. Using Metabolomics to Identify the Exposure and Functional Biomarkers of Ginger. J. Agric. Food Chem. 2022, 70, 12029–12040. [Google Scholar] [CrossRef] [PubMed]
- Schulz, M.; Hövelmann, Y.; Hübner, F.; Humpf, H.-U. Identification of Potential Urinary Biomarkers for Bell Pepper Intake by HPLC−HRMS-Based Metabolomics and Structure Elucidation by NMR. J. Agric. Food Chem. 2021, 69, 13644–13656. [Google Scholar] [CrossRef]
- Brouwer-Brolsma, E.M.; Brandl, B.; Buso, M.E.C.; Skurk, T.; Manach, C. Food intake biomarkers for green leafy vegetables, bulb vegetables, and stem vegetables: A review. Genes Nutr. 2020, 15, 7. [Google Scholar] [CrossRef]
- Giesbertz, P.; Brandl, B.; Lee, Y.-M.; Hauner, H.; Daniel, H.; Skurk, T. Specificity, Dose Dependency, and Kinetics of Markers of Chicken and Beef Intake Using Targeted Quantitative LC-MS/MS: A Human Intervention Trial. Mol. Nutr. Food Res. 2020, 64, 1900921. [Google Scholar] [CrossRef]
- Heinzmann, S.S.; Brown, I.J.; Chan, Q.; Bictash, M.; Dumas, M.E.; Kochhar, S.; Stamler, J.; Holmes, E.; Elliott, P.; Nicholson, J.K. Metabolic profiling strategy for discovery of nutritional biomarkers: Proline betaine as a marker of citrus consumption. Am. J. Clin. Nutr. 2010, 92, 436–443. [Google Scholar] [CrossRef] [PubMed]
- Rothwell, J.A.; Fillâtre, Y.; Martin, J.-F.; Lyan, B.; Pujos-Guillot, E.; Fezeu, L.; Hercberg, S.; Comte, B.; Galan, P.; Touvier, M.; et al. New Biomarkers of Coffee Consumption Identified by the Non-Targeted Metabolomic Profiling of Cohort Study Subjects. PLoS ONE 2014, 9, e93474. [Google Scholar] [CrossRef] [PubMed]
- Xi, M.; Berendsen, A.A.M.; Ernst, M.; Hu, T.; Vázquez-Manjarrez, N.; Feskens, E.J.M.; Dragsted, L.O.; La Barbera, G. Combined Urinary Biomarkers to Assess Coffee Intake Using Untargeted Metabolomics: Discovery in Three Pilot Human Intervention Studies and Validation in Cross-Sectional Studies. J. Agric. Food Chem. 2021, 69, 7230–7242. [Google Scholar] [CrossRef] [PubMed]
- Stalmach, A.; Mullen, W.; Barron, D.; Uchida, K.; Yokota, T.; Cavin, C.; Steiling, H.; Williamson, G.; Crozier, A. Metabolite profiling of hydroxycinnamate derivatives in plasma and urine after the ingestion of coffee by humans: Identification of biomarkers of coffee consumption. Drug Metab. Dispos. 2009, 37, 1749–1758. [Google Scholar] [CrossRef] [PubMed]
- Shi, L.; Brunius, C.; Johansson, I.; Bergdahl, I.A.; Rolandsson, O.; van Guelpen, B.; Winkvist, A.; Hanhineva, K.; Landberg, R. Plasma metabolite biomarkers of boiled and filtered coffee intake and their association with type 2 diabetes risk. J. Int. Med. 2019, 287, 405–421. [Google Scholar] [CrossRef] [PubMed]
- Lang, R.; Wahl, A.; Stark, T.; Hofmann, T. Urinary N-methylpyridinium and trigonelline as candidate dietary biomarkers of coffee consumption. Mol. Nutr. Food Chem. 2011, 55, 1613–1623. [Google Scholar] [CrossRef] [PubMed]
- Nagana Gowda, G.A.; Raftery, D. Recent advances in NMR-based metabolomics. Anal. Chem. 2017, 89, 490–510. [Google Scholar] [CrossRef] [PubMed]
- Lacalle-Bergeron, L.; Izquierdo-Sandoval, D.; Sacho, J.V.; López, F.J.; Hernández, F.; Portolés, T. Chromatography hyphenated to high resolution mass spectrometry in untargeted metabolomics for investigation of food (bio)markers. Trends Anal. Chem. 2021, 135, 116161. [Google Scholar] [CrossRef]
- Lang, R.; Wahl, A.; Skurk, T.; Yagar, E.F.; Schmiech, L.; Eggers, R.; Hauner, H.; Hofmann, T. Development of a hydrophilic liquid interaction chromatography-high-performance liquid chromatography-tandem mass spectrometry based stable isotope dilution analysis and pharmacokinetic studies on bioactive pyridines in human plasma and urine after coffee consumption. Anal. Chem. 2010, 82, 1486–1497. [Google Scholar] [CrossRef]
- Lang, R.; Wahl, A.; Stark, T.; Hofmann, T. Identification of Urinary and Salivary Biomarkers for Coffee Consumption. In Recent Advances in the Analysis of Food and Flavors; ACS Symposium Series; Toth, S., Ed.; American Chemical Society: Washington, DC, USA, 2012; Volume 1098, pp. 13–25. [Google Scholar]
- Lang, R.; Yagar, E.F.; Wahl, A.; Beusch, A.; Dunkel, A.; Dieminger, N.; Eggers, R.; Bytof, G.; Stiebitz, H.; Lantz, I.; et al. Quantitative studies on roast kinetics for bioactives in coffee. J. Agric. Food Chem. 2013, 61, 12123–12128. [Google Scholar] [CrossRef]
- Brandl, B.; Skurk, T.; Rennekamp, R.; Hannink, A.; Kiesswetter, E.; Freiherr, J.; Ihsen, S.; Roose, J.; Klingenspor, M.; Haller, D.; et al. A Phenotyping Platform to Characterize Healthy Individuals Across Four Stages of Life—The Enable Study. Front. Nutr. 2020, 7, 582367. [Google Scholar] [CrossRef] [PubMed]
- Nöthlings, U.; Hoffmann, K.; Bergmann, M.M.; Boeing, H. Fitting portion sizes in a self-administered food frequency questionnaire. J. Nutr. 2007, 137, 2781–2786. [Google Scholar] [CrossRef] [PubMed]
- Viani, R.; Horman, I. Thermal behavior of trigonelline. J. Food Sci. 1974, 39, 1216–1217. [Google Scholar] [CrossRef]
- Stadler, R.H.; Varga, N.; Hau, J.; Vera, F.A.; Welti, D. Alkylpyridiniums. 1. Formation in model systems via thermal degradation of trigonelline. J. Agric. Food Chem. 2002, 50, 1192–1199. [Google Scholar] [CrossRef] [PubMed]
- Stadler, R.H.; Varga, N.; Milo, C.; Schilter, B.; Vera, F.A.; Welt, D. Alkylpyridiniums. 2. Isolation and quantification in roasted and ground coffees. J. Agric. Food Chem. 2002, 50, 1200–1206. [Google Scholar] [CrossRef] [PubMed]
- Bresciani, L.; Tassotti, M.; Rosi, A.; Martini, D.; Antonini, M.; Dei Cas, A.; Bonadonna, R.; Brighenti, F.; Del Rio, D.; Mena, P. Absorption, Pharmacokinetics, and Urinary Excretion of Pyridines After Consumption of Coffee and Cocoa-Based Products Containing Coffee in a Repeated Dose, Crossover Human Intervention Study. Mol. Nutr. Food Res. 2020, 64, 2000489. [Google Scholar] [CrossRef] [PubMed]
- Bakuradze, T.; Parra, G.A.M.; Riedel, A.; Somoza, V.; Lang, R.; Dieminger, N.; Hofmann, T.; Winkler, S.; Hassmann, U.; Marko, D.; et al. Four-week coffee consumption affects energy intake, satiety regulation, body fat, and protects DNA integrity. Food Res. Internat. 2014, 63, 420–427. [Google Scholar] [CrossRef]
- Kempf, K.; Kolb, H.; Gärtner, B.; Bytof, G.; Stiebitz, H.; Lantz, I.; Lang, R.; Hofmann, T.; Martin, S. Cardiometabolic effects of two coffee blends differing in content for major constituents in overweight adults: A randomized controlled trial. Eur. J. Nutr. 2015, 54, 845–854. [Google Scholar] [CrossRef]
- Somoza, V.; Lindenmeier, M.; Wenzel, E.; Frank, O.; Erbersdobler, H.F.; Hofmann, T. Activity-guided identification of a chemopreventive compound in coffee beverage using in vitro and in vivo techniques. J. Agric Food Chem. 2003, 51, 6861–6869. [Google Scholar] [CrossRef]
- Weiss, C.; Rubach, M.; Lang, R.; Seebach, E.; Blumberg, S.; Frank, O.; Hofmann, T.; Somoza, V. Measurement of the intracellular ph in human stomach cells: A novel approach to evaluate the gastric acid secretory potential of coffee beverages. J. Agric. Food Chem. 2010, 58, 1976–1985. [Google Scholar] [CrossRef]
- Ashihara, H. Trigonelline (N-methylnicotinic acid) Biosynthesis and its Biological Role in Plants. Nat. Prod. Commun. 2008, 3, 9. [Google Scholar] [CrossRef]
- Stennert, A.; Maier, H.G. Trigonelline in coffee. II. Content of green, roasted and instant coffee. Z. Lebensm. Unters. Forsch. 1994, 199, 198–200. [Google Scholar] [CrossRef] [PubMed]
- Perrone, D.; Donangelo, C.M.; Farah, A. Fast simultaneous analysis of caffeine, trigonelline, nicotinic acid and sucrose in coffee by liquid chromatography-mass spectrometry. Food Chem. 2008, 110, 1030–1035. [Google Scholar] [CrossRef] [PubMed]
- Food Compound Exchange, Pyridine. Available online: https://foodcomex.org/foodcomex_compounds/PC000192 (accessed on 20 September 2023).
- Carlson, G.P. Comparison of the effects of pyridine and its metabolites on rat liver and kidney. Toxicol. Lett. 1996, 85, 173–178. [Google Scholar] [CrossRef]
- Heinzmann, S.S.; Holmes, E.; Kochhar, S.; Nicholson, J.K.; Schmitt-Kopplin, P. 2-Furoylglycine as a candidate biomarker of coffee consumption. J. Agric. Food Chem. 2015, 63, 8615–8621. [Google Scholar] [CrossRef]


| Coffee Drinkers (n = 388) | Non Coffee Drinkers (n = 40) | Children (n = 44) | |||||
|---|---|---|---|---|---|---|---|
| Plasma (nM) | DBS (nM) | Urine (µM) | Plasma (nM) | DBS (nM) | Urine (µM) | Urine (µM) | |
| Mean (±SD) | 52.1 (±56.8) | 90.9 (±86.5) | 19.5 (±25.9) | 6.2 (±23.5) | 11.6 (±48.4) | 1.6 (±5.1) | 0.2 (±1.0) |
| Range (min–max) | 0.0–364.0 | 0.0–533.7 | 0.0–179.3 | 0.0–136.0 | 0.0–279.1 | 0.0–23.1 | 0.0–6.5 |
| Median | 37.2 | 73.7 | 12.9 | 0.01 | 0.01 | 0.01 | 0.0 |
| Matrix | R2 a | Precision (RSD, %) | Accuracy (%) | Precision (RSD, %) | Accuracy (%) | Prec. of Authentic Samples (%) | Ref. |
|---|---|---|---|---|---|---|---|
| Calibration Standards | Quality Controls (Spiked Matrix) b | ||||||
| Solvent | >0.999 | <11 | 97–102 | <11.9 (hum. Plasma) | 97–103 (hum. Plasma) | 3–6.5 (coffee brew) | [33,35] |
| Urine c | >0.999 | <3 | 91–105 | <3 | 98–102 | [30] | |
| Saliva | >0.99 | <14 | 94–103 | <3 | 99–100 | [34] | |
| Plasma d | 0.999 | ≤5.1 | 85–109 | ≤2.7 | 96–107 | SI | |
| Blood e | 0.999 | ≤8.4 | 91–111 | ≤1.9 | 105–113 | SI | |
Disclaimer/Publisher’s Note: The statements, opinions and data contained in all publications are solely those of the individual author(s) and contributor(s) and not of MDPI and/or the editor(s). MDPI and/or the editor(s) disclaim responsibility for any injury to people or property resulting from any ideas, methods, instructions or products referred to in the content. |
© 2024 by the authors. Licensee MDPI, Basel, Switzerland. This article is an open access article distributed under the terms and conditions of the Creative Commons Attribution (CC BY) license (https://creativecommons.org/licenses/by/4.0/).
Share and Cite
Brandl, B.; Czech, C.; Wudy, S.I.; Beusch, A.; Hauner, H.; Skurk, T.; Lang, R. Validation of N-Methylpyridinium as a Feasible Biomarker for Roasted Coffee Intake. Beverages 2024, 10, 12. https://doi.org/10.3390/beverages10010012
Brandl B, Czech C, Wudy SI, Beusch A, Hauner H, Skurk T, Lang R. Validation of N-Methylpyridinium as a Feasible Biomarker for Roasted Coffee Intake. Beverages. 2024; 10(1):12. https://doi.org/10.3390/beverages10010012
Chicago/Turabian StyleBrandl, Beate, Coline Czech, Susanne I. Wudy, Anja Beusch, Hans Hauner, Thomas Skurk, and Roman Lang. 2024. "Validation of N-Methylpyridinium as a Feasible Biomarker for Roasted Coffee Intake" Beverages 10, no. 1: 12. https://doi.org/10.3390/beverages10010012
APA StyleBrandl, B., Czech, C., Wudy, S. I., Beusch, A., Hauner, H., Skurk, T., & Lang, R. (2024). Validation of N-Methylpyridinium as a Feasible Biomarker for Roasted Coffee Intake. Beverages, 10(1), 12. https://doi.org/10.3390/beverages10010012