Inference of Regulatory System for TAG Biosynthesis in Lipomyces starkeyi

 ,
,  ,
,
Abstract
1. Introduction
2. Materials and Methods
2.1. Gene Expression Data Processing
2.2. Gene Selection
2.3. Factor Analysis
2.4. Stepwise Network Modeling
- STEP 1:
- Initial model assumption of oil productivity group;
- STEP 2:
- Model optimization of oil productivity group;
- STEP 3:
- Definition of pseudo variables from subgroups;
- STEP 4:
- Initial model assumption among pseudo variables;
- STEP 5:
- Model optimization of pseudo variables.
2.4.1. Initial Model Assumption
2.4.2. Network Modeling
3. Results
3.1. Gene Classification by Factor Analysis
3.2. Oil Productivy Network: Figures, Tables and Schemes
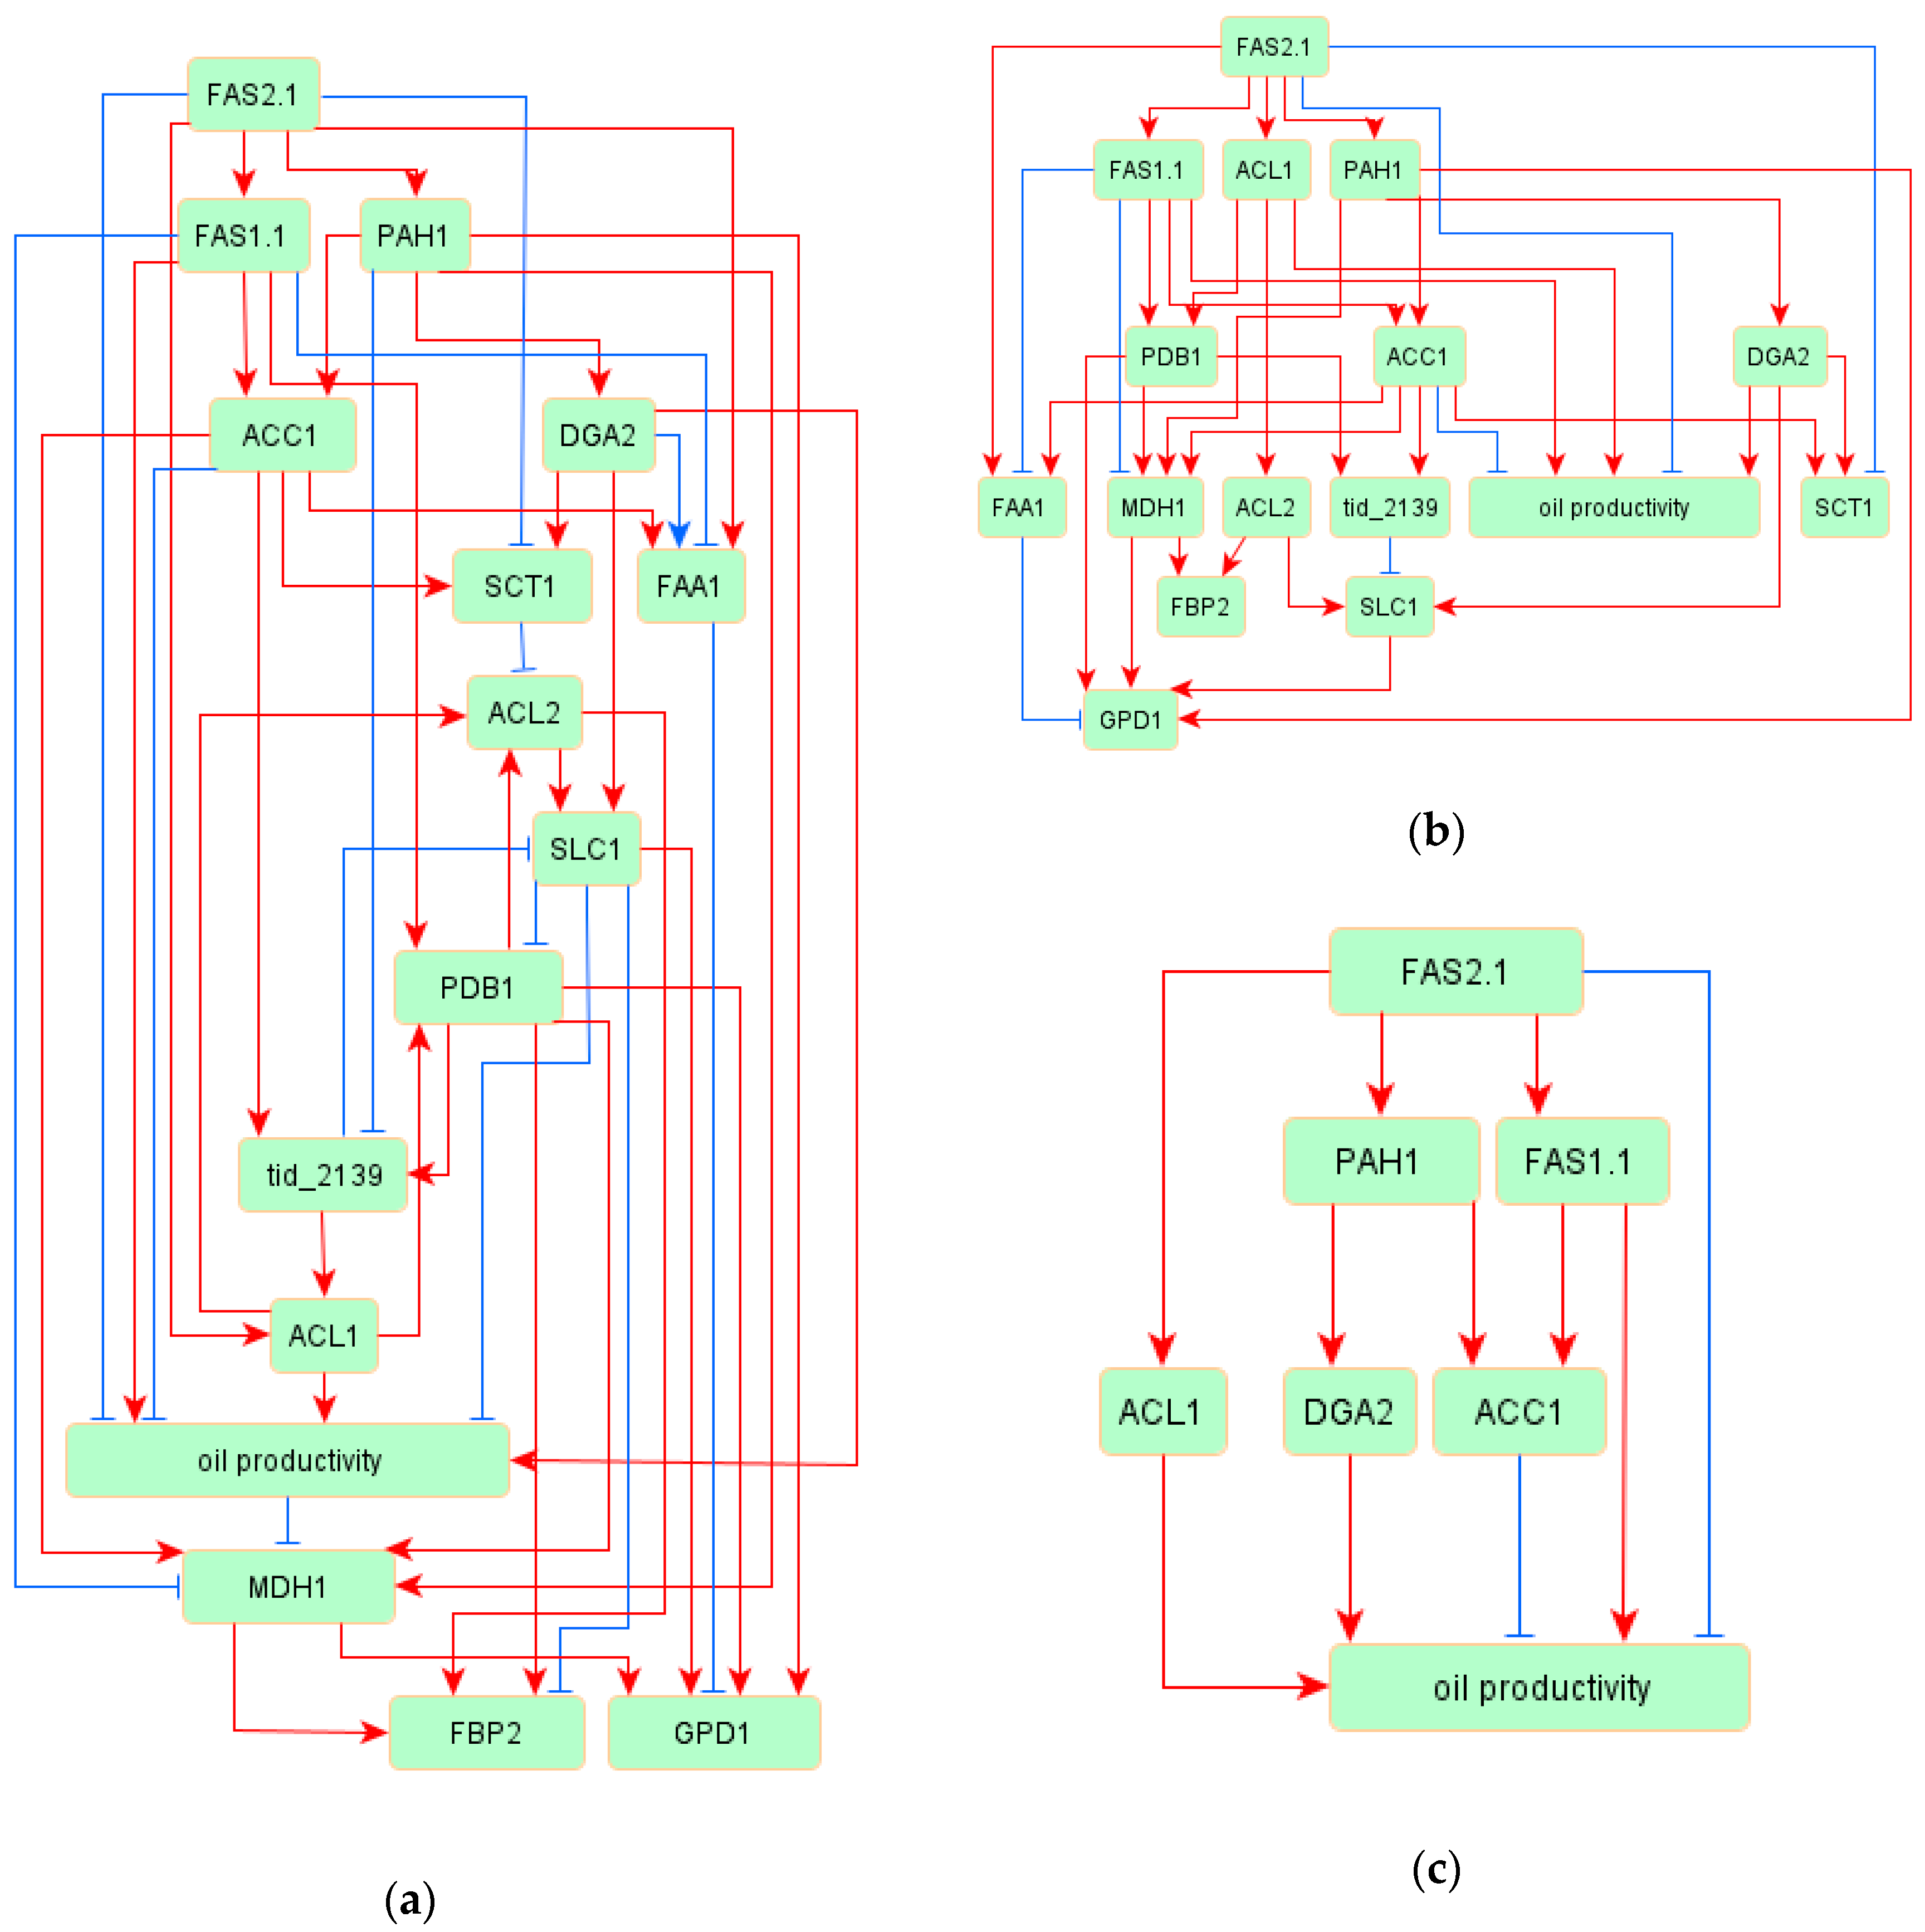
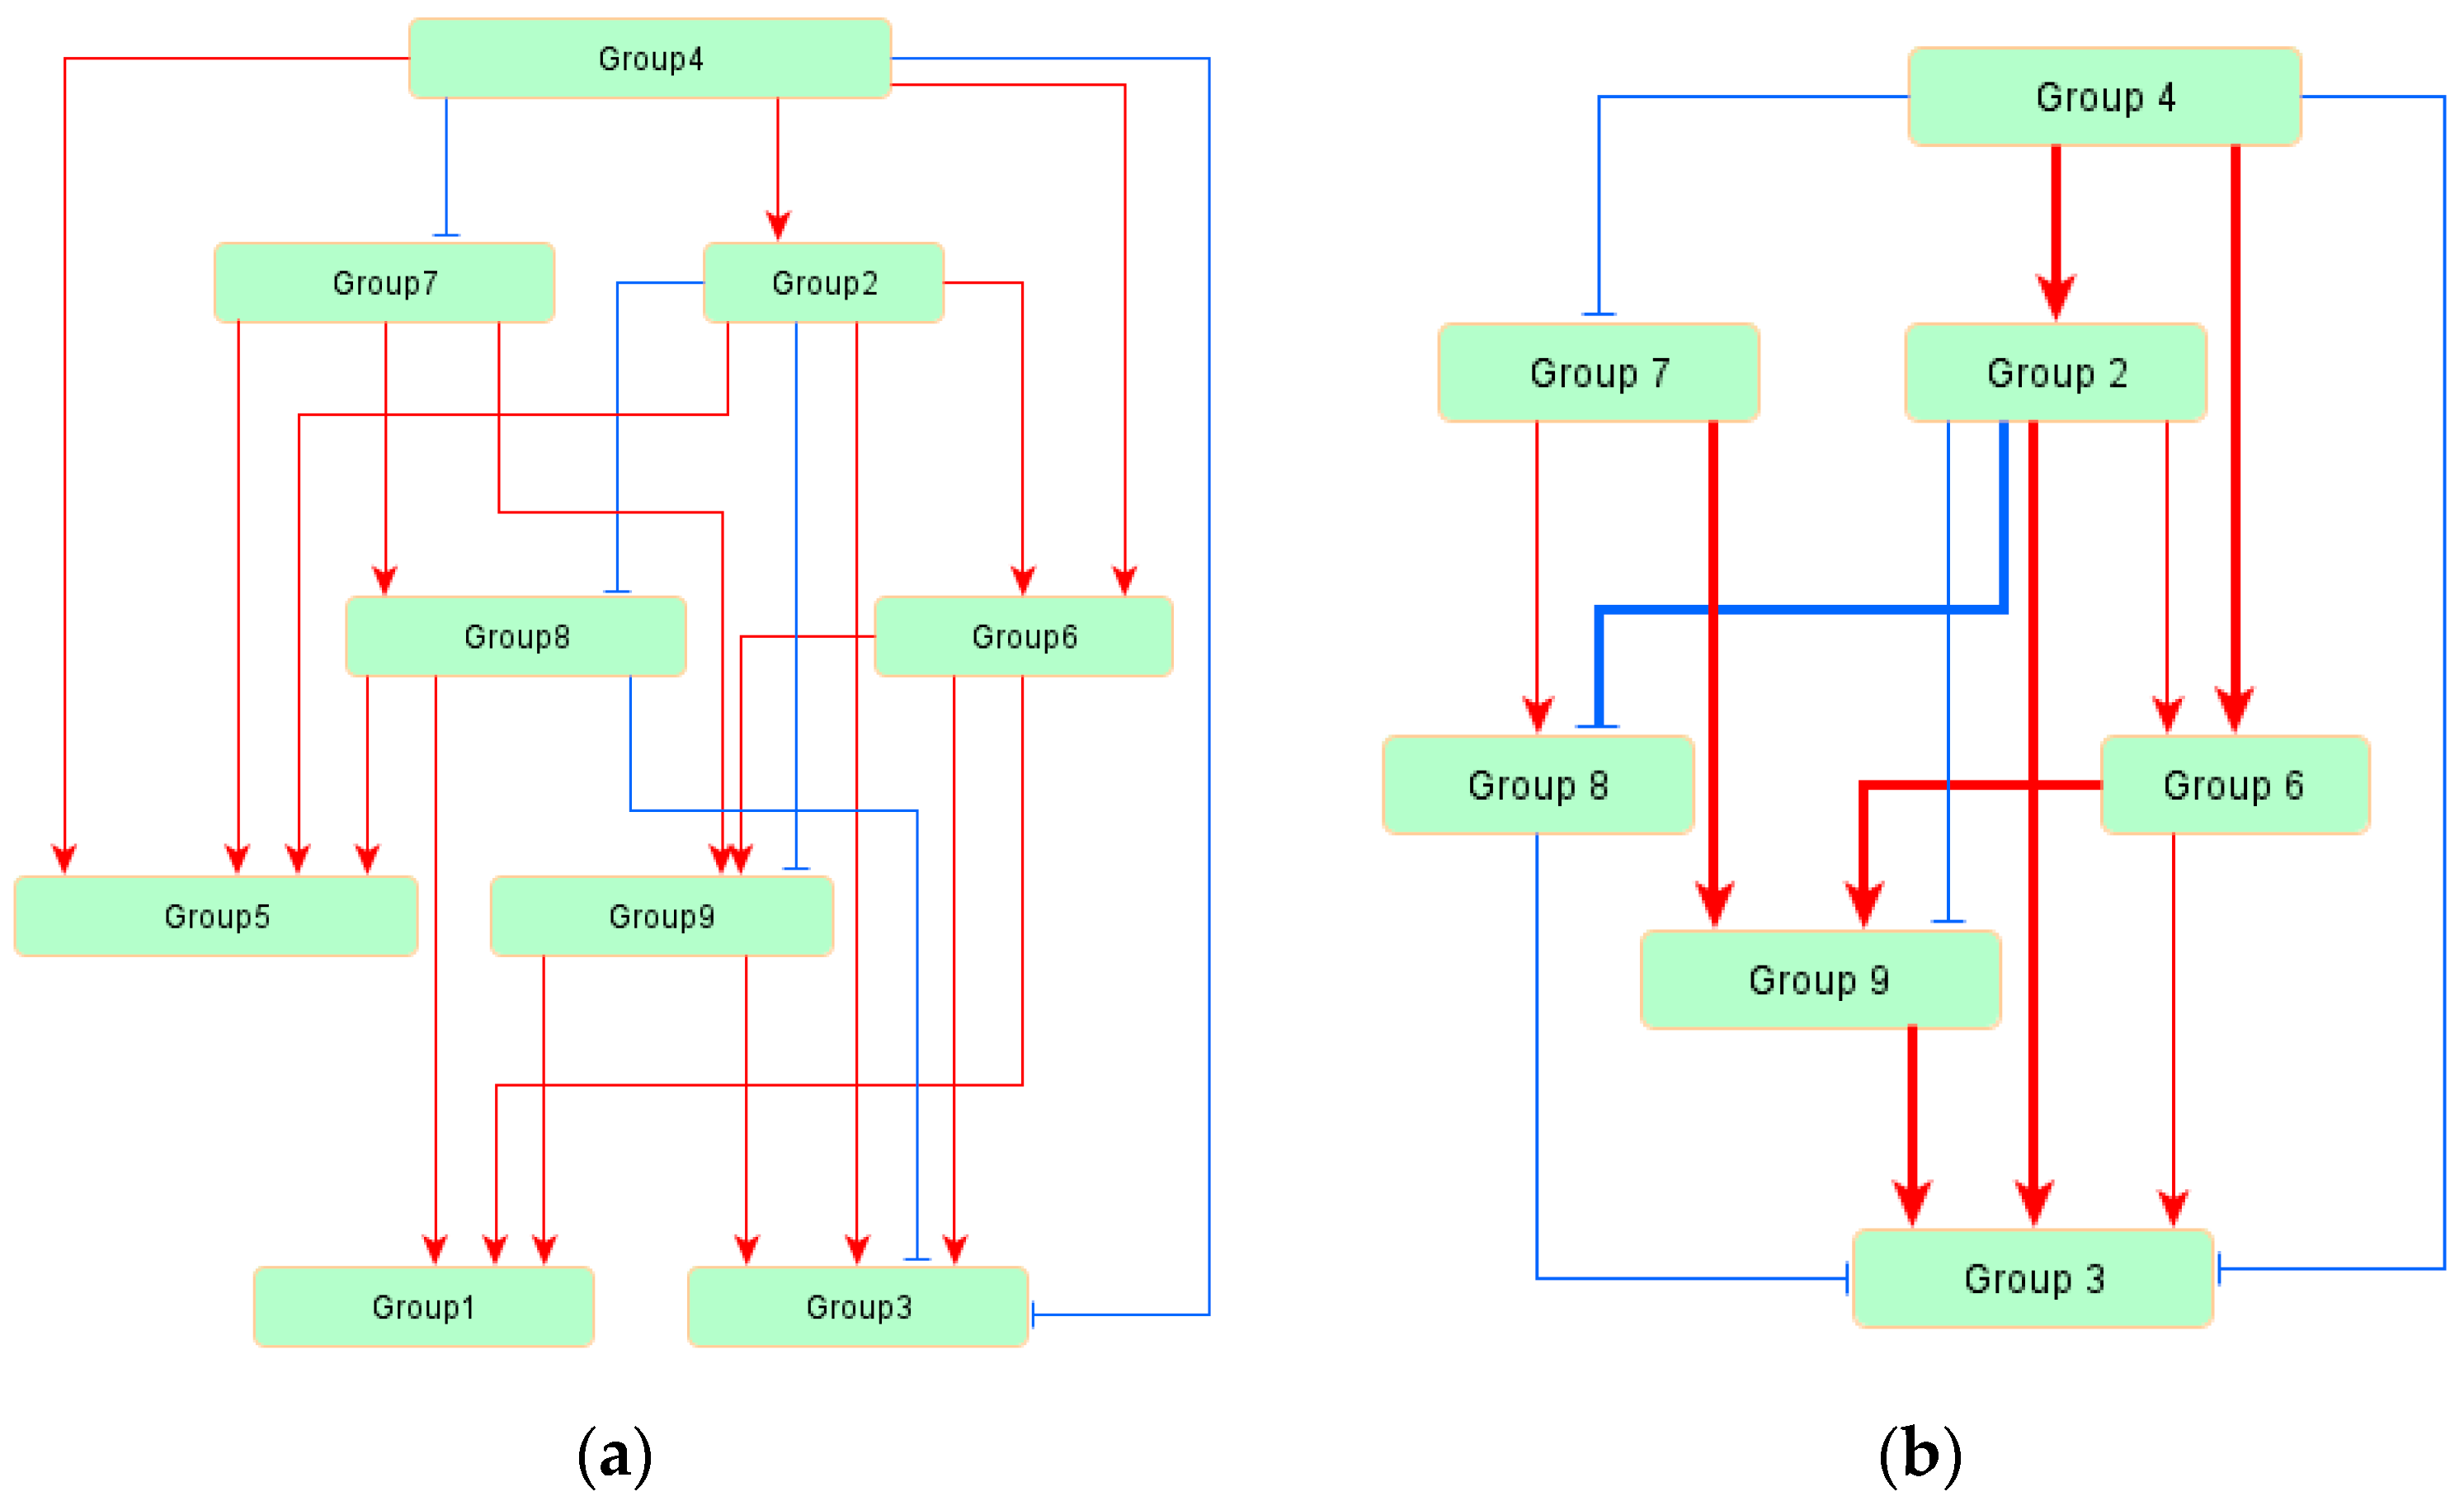
3.3. Regulatory Network of TAG Biosynthesis
4. Discussion
5. Conclusions
Author Contributions
Funding
Conflicts of Interest
References
- Sakaguchi, K.; Okanishi, M. Molecular Breeding and Genetics of Applied Microorganisms; Academic Press: Cambridge, MA, USA, 1980; pp. 139–153. [Google Scholar]
- Zhang, G.Q.; Lin, Y.P.; Qi, X.N.; Wang, L.X.; He, P.; Wang, Q.H.; Ma, Y.H. Genome shuffling of the nonconventional yeast Pichia anomala for improved sugar alcohol production. Microb. Cell Fact. 2015, 14, 112. [Google Scholar] [CrossRef]
- Zhang, X.; Zhang, X.F.; Li, H.P.; Wang, L.Y.; Zhang, C.; Xing, X.H.; Bao, C.Y. Atmospheric and room temperature plasma (ARTP) as a new powerful mutagenesis tool. Appl. Microbiol. Biotechnol. 2014, 98, 5387–5396. [Google Scholar] [CrossRef]
- Liu, Y.N.; Li, Q.G.; Zheng, P.; Zhang, Z.D.; Liu, Y.F.; Sun, C.M.; Cao, G.Q.; Zhou, W.J.; Wang, X.W.; Zhang, D.W.; et al. Developing a high-throughput screening method for threonine overproduction based on an artificial promoter. Microb. Cell Fact. 2015, 14, 121. [Google Scholar] [CrossRef]
- Zhong, W.; Jousset, A. Plant Breeding Goes Microbial. Trends Plant Sci. 2017, 22, 555–558. [Google Scholar]
- Angerbauer, C.; Siebenhofer, M.; Mittelbach, M.; Guebitz, G.M. Conversion of sewage sludge into lipids by Lipomyces starkeyi for biodiesel production. Bioresour. Technol. 2008, 99, 3051–3056. [Google Scholar] [CrossRef]
- Beligon, V.; Christophe, G.; Fontanille, P.; Larroche, C. Microbial lipids as potential source to food supplements. Curr. Opin. Food. Sci. 2016, 7, 35–42. [Google Scholar] [CrossRef]
- Kosa, M.; Ragauskas, A.J. Lipids from heterotrophic microbes: Advances in metabolism research. Trends Biotechnol. 2011, 29, 53–61. [Google Scholar] [CrossRef] [PubMed]
- Papanikolaou, S.; Aggelis, G. Lipids of oleaginous yeasts. Part I: Biochemistry of single cell oil production. Eur. J. Lipid Sci. Technol. 2011, 113, 1031–1051. [Google Scholar] [CrossRef]
- Juanssilfero, A.B.; Kahar, P.; Amza, R.L.; Miyamoto, N.; Otsuka, H.; Matsumoto, H.; Kihira, C.; Thontowi, A.; Ogino, C.; Prasetya, B. Effect of inoculum size on single-cell oil production from glucose and xylose using oleaginous yeast Lipomyces starkeyi. J. Biosci. Bioeng. 2018, 125, 695–702. [Google Scholar] [CrossRef] [PubMed]
- Riley, R.; Haridas, S.; Wolfe, K.H.; Lopes, M.R.; Hittinger, C.T.; Göker, M.; Salamov, A.A.; Wisecaver, J.H.; Long, T.M.; Calvey, C.H. Comparative genomics of biotechnologically important yeasts. Proc. Natl. Acad. Sci. USA 2016, 113, 9882–9887. [Google Scholar] [CrossRef] [PubMed]
- Maruyama, Y.; Toya, Y.; Kurokawa, H.; Fukano, Y.; Sato, A.; Umemura, H.; Yamada, K.; Iwasaki, H.; Tobori, N.; Shimizu, H. Characterization of oil-producing yeast Lipomyces starkeyi on glycerol carbon source based on metabolomics and 13C-labeling. Appl. Microbiol. Biotechnol. 2018, 102, 8909–8920. [Google Scholar] [CrossRef] [PubMed]
- Pomraning, K.R.; Collett, J.R.; Kim, J.; Panisko, E.A.; Culley, D.E.; Dai, Z.; Deng, S.; Hofstad, B.A.; Butcher, M.G.; Magnuson, J.K. Transcriptomic analysis of the oleaginous yeast Lipomyces starkeyi during lipid accumulation on enzymatically treated corn stover hydrolysate. Biotechnol. Biofuels 2019, 12, 162. [Google Scholar] [CrossRef] [PubMed]
- Sutanto, S.; Zullaikah, S.; Tran-Nguyen, P.L.; Ismadji, S.; Ju, Y.-H. Lipomyces starkeyi: Its current status as a potential oil producer. Fuel Process. Technol. 2018, 177, 39–55. [Google Scholar] [CrossRef]
- Chapman, K.D.; Dyer, J.M.; Mullen, R.T. Biogenesis and functions of lipid droplets in plants thematic review series: Lipid droplet synthesis and metabolism: From yeast to man. J. Lipid Res. 2012, 53, 215–226. [Google Scholar] [CrossRef] [PubMed]
- Takaku, H.; Matsuzawa, T.; Yaoi, K.; Yamazaki, H. Lipid metabolism of the oleaginous yeast Lipomyces starkeyi. Appl. Microbiol. Biotechnol. 2020, 104, 6141–6148. [Google Scholar] [CrossRef] [PubMed]
- Tang, W.; Zhang, S.; Wang, Q.; Tan, H.; Zhao, Z.K. The isocitrate dehydrogenase gene of oleaginous yeast Lipomyces starkeyi is linked to lipid accumulation. Can. J. Microbiol. 2009, 55, 1062–1069. [Google Scholar] [CrossRef] [PubMed]
- Muniraj, I.K.; Uthandi, S.K.; Hu, Z.; Xiao, L.; Zhan, X. Microbial lipid production from renewable and waste materials for second-generation biodiesel feedstock. Environ. Technol. Rev. 2015, 4, 1–16. [Google Scholar] [CrossRef]
- Akutsu, T.; Miyano, S.; Kuhara, S. Algorithms for identifying Boolean networks and related biological networks based on matrix multiplication and fingerprint function. J. Comput. Biol. 2000, 7, 331–343. [Google Scholar] [CrossRef]
- Friedman, N.; Linial, M.; Nachman, I.; Pe’er, D. Using Bayesian networks to analyze expression data. J. Comput. Biol. 2000, 7, 601–620. [Google Scholar] [CrossRef]
- Aburatani, S.; Kuhara, S.; Toh, H.; Horimoto, K. Deduction of a gene regulatory relationship framework from gene expression data by the application of graphical Gaussian modeling. Signal. Process. 2003, 83, 777–788. [Google Scholar] [CrossRef]
- Bollen, K.A. Structural Equations with Latent Variables; Wiley-Interscience: New York, NY, USA, 1989. [Google Scholar]
- Aburatani, S. Application of structure equation modeling for inferring a serial transcriptional regulation in yeast. Gene Regul. Syst. Biol. 2011, 5, 75–88. [Google Scholar] [CrossRef] [PubMed]
- Haavelmo, T. The statistical implications of a system of simultaneous equations. Econometrica 1943, 11, 1–12. [Google Scholar] [CrossRef]
- Duncan, O.D. Introduction to Structural Equation Models, 3rd ed.; Academic Press: New York, NY, USA, 1975. [Google Scholar]
- Pearl, J. Causality: Models, Reasoning, and Inference, 2nd ed.; Cambridge University Press: Cambridge, UK, 2001. [Google Scholar]
- Aburatani, S.; Toh, H. Estimation of Physical Transcriptional Control in Yeast Cell Cycle by Structure Equation Modeling. In Basic Methods in Protein Purification and Analysis; iConcept Press Ltd.: Hong Kong, China, 2012; Volume 14, Chapter 5. [Google Scholar]
- Aburatani, S.; Toh, H. Network inference of AP pattern formation system in D. melanogaster by structural equation modeling. J. Phys. Conf. Ser. 2014, 490, 012145. [Google Scholar] [CrossRef]
- Aburatani, S. Network inference of pal-1 lineage-specific regulation in the C. elegans embryo by structural equation modeling. Bioinformation 2012, 8, 652–656. [Google Scholar] [CrossRef] [PubMed]
- Aburatani, S.; Nagano, R.; Sone, H.; Fujibuchi, W.; Yamane, J.; Imanishi, S.; Ohsako, S. Inference of Gene Regulatory Networks to Detect Toxicity-Specific Effects in Human Embryonic Stem Cells. Int. J. Adv. Life Sci. 2013, 5, 103–114. [Google Scholar]
- Yamazaki, H.; Kobayashi, S.; Ebina, S.; Abe, S.; Ara, S.; Shida, Y.; Ogasawara, W.; Yaoi, K.; Araki, H.; Takaku, H. Highly selective isolation and characterization of Lipomyces starkeyi mutants with increased production of triacylglycerol. Appl. Microbiol. Biotechnol. 2019, 103, 6297–6308. [Google Scholar] [CrossRef]
- Ledesma-Amaro, R.; Nicaud, J.-M. Yarrowia lipolytica as a biotechnological chassis to produce usual and unusual fatty acids. Prog. Lipid Res. 2016, 61, 40–50. [Google Scholar] [CrossRef]
- Spirtes, P.; Glymour, C.; Scheines, R. Causation, Prediction, and Search, 2nd ed.; The MIT Press: Cambridge, UK, 2001. [Google Scholar]
- Aburatani, S.; Shida, Y.; Ogasawara, W.; Yamazaki, H.; Takaku, H. Application of Structural Equation Modelling for Oil Accumulation System Control in Oleaginous yeast. J. Phys. Conf. Ser. 2019, 1391, 012043. [Google Scholar] [CrossRef]
- Wheaton, B.; Muthen, B.; Alwin, D.F.; Summers, G.F. Assessing Reliability and Stability in Panel Models. Sociol. Methodol. 1977, 8, 84–136. [Google Scholar] [CrossRef]
- Joreskog, K.G.; Sorbom, D. LISREL-V1 User’s Guide, 3rd ed.; Scientific Software: Mooresville, NC, USA, 1984. [Google Scholar]
- Browne, M.W.; Cudeck, R. Alternative ways of assessing model fit. In Testing Structural Equation Models; Boolen, K.A., Long, J.S., Eds.; Sage: Beverly Hills, CA, USA, 1993; pp. 136–162. [Google Scholar]
- Bentler, P.M. Comparative fit indexes in structural models. Psychol. Bull. 1990, 107, 238–246. [Google Scholar] [CrossRef]
- Akaike, H. Factor analysis and AIC. Psychometrika 1987, 52, 317–332. [Google Scholar] [CrossRef]
- Silverman, A.M.; Qiao, K.; Xu, P.; Stephanopoulos, G. Functional overexpression and characterization of lipogenesis-related genes in the oleaginous yeast Yarrowia lipolytica. Appl. Microbiol. Biotechnol. 2016, 100, 3781–3798. [Google Scholar] [CrossRef] [PubMed]
- Liu, H.; Marsafari, M.; Deng, L.; Xu, P. Understanding lipogenesis by dynamically profiling transcriptional activity of lipogenic promoters in Yarrowia lipolytica. Appl. Microbiol. Biotechnol. 2019, 103, 3167–3179. [Google Scholar] [CrossRef] [PubMed]


| Estimated Factor Loadings | |||||||||||
|---|---|---|---|---|---|---|---|---|---|---|---|
| Group # | Gene | Communality | 1 | 2 | 3 | 4 | 5 | 6 | 7 | 8 | 9 |
| 1 | LACS1.1 | 0.951 | 1.028 | 0.174 | −0.081 | 0.062 | 0.085 | −0.034 | 0.001 | −0.056 | 0.003 |
| POT2 | 0.953 | 0.984 | 0.125 | −0.060 | 0.333 | 0.012 | −0.129 | 0.010 | 0.102 | 0.042 | |
| POX1 | 0.900 | 0.966 | 0.243 | 0.003 | 0.135 | 0.075 | −0.266 | 0.171 | 0.109 | 0.028 | |
| FOX2 | 0.960 | 0.965 | −0.021 | −0.061 | 0.097 | 0.037 | 0.044 | 0.119 | −0.074 | −0.036 | |
| FBP1 | 0.907 | 0.957 | 0.261 | −0.057 | −0.067 | 0.354 | −0.055 | −0.084 | −0.079 | −0.249 | |
| CIT3 | 0.899 | 0.942 | 0.107 | −0.088 | 0.015 | 0.180 | 0.044 | −0.054 | 0.181 | 0.082 | |
| CIT2 | 0.913 | 0.912 | 0.042 | 0.083 | −0.043 | −0.086 | 0.065 | 0.044 | 0.131 | 0.016 | |
| ALDH | 0.910 | 0.883 | −0.097 | 0.011 | −0.143 | 0.108 | 0.153 | −0.089 | −0.080 | 0.074 | |
| TGL4 | 0.914 | 0.871 | 0.082 | 0.046 | 0.109 | −0.096 | 0.282 | −0.131 | −0.006 | 0.002 | |
| TGL3 | 0.825 | 0.851 | 0.035 | 0.120 | 0.118 | 0.052 | −0.192 | −0.236 | −0.204 | 0.335 | |
| ARE2 | 0.932 | 0.793 | −0.395 | 0.099 | −0.072 | 0.027 | 0.008 | −0.005 | 0.016 | −0.135 | |
| ARE1 | 0.822 | 0.781 | −0.223 | 0.375 | −0.045 | 0.066 | −0.233 | 0.193 | 0.312 | −0.002 | |
| POT1 | 0.899 | 0.720 | −0.038 | −0.021 | −0.085 | −0.050 | 0.174 | −0.169 | 0.037 | 0.397 | |
| ERG13 | 0.905 | −0.688 | 0.129 | 0.441 | 0.029 | 0.002 | −0.048 | −0.063 | −0.030 | 0.060 | |
| PCK1 | 0.782 | 0.686 | −0.282 | −0.082 | −0.130 | 0.510 | 0.037 | −0.043 | 0.182 | 0.074 | |
| ERG10 | 0.915 | −0.649 | 0.127 | 0.372 | 0.132 | 0.042 | 0.044 | 0.150 | −0.012 | −0.013 | |
| ACO2 | 0.847 | −0.641 | 0.024 | −0.110 | 0.030 | 0.109 | 0.046 | 0.565 | 0.133 | −0.077 | |
| LAT1 | 0.929 | −0.605 | −0.001 | 0.342 | −0.043 | 0.324 | 0.089 | 0.252 | −0.102 | 0.135 | |
| PDX1 | 0.962 | −0.595 | 0.283 | 0.461 | −0.181 | 0.067 | −0.013 | 0.161 | −0.015 | 0.048 | |
| PYC2 | 0.787 | 0.584 | −0.047 | 0.255 | −0.199 | 0.033 | 0.279 | −0.306 | 0.323 | 0.094 | |
| DGK1 | 0.846 | −0.555 | 0.299 | −0.035 | 0.257 | −0.002 | −0.372 | −0.115 | 0.100 | −0.281 | |
| AYR1 | 0.843 | 0.551 | −0.313 | 0.175 | 0.261 | −0.301 | 0.207 | 0.200 | −0.330 | −0.044 | |
| PDA1 | 0.897 | −0.422 | 0.264 | 0.378 | −0.111 | 0.276 | −0.016 | 0.210 | −0.096 | −0.020 | |
| SDH2 | 0.874 | 0.340 | 0.303 | −0.082 | 0.335 | 0.310 | 0.119 | 0.315 | −0.196 | 0.153 | |
| 2 | PFK2 | 0.837 | −0.118 | 0.949 | 0.001 | 0.028 | −0.140 | 0.017 | −0.040 | 0.171 | 0.027 |
| HXK2 | 0.882 | 0.007 | 0.919 | 0.074 | 0.118 | −0.196 | −0.311 | −0.143 | −0.098 | 0.091 | |
| MDH2 | 0.908 | −0.129 | 0.903 | −0.045 | −0.060 | −0.037 | 0.078 | 0.141 | 0.028 | −0.001 | |
| ACS1 | 0.841 | 0.396 | 0.894 | 0.259 | −0.063 | −0.109 | 0.104 | −0.163 | 0.364 | 0.023 | |
| ZWF1 | 0.907 | 0.050 | 0.868 | 0.044 | 0.104 | −0.197 | 0.097 | −0.062 | −0.270 | −0.105 | |
| PGM1 | 0.891 | 0.474 | 0.854 | 0.075 | 0.230 | −0.330 | −0.092 | −0.031 | −0.212 | 0.218 | |
| LRO1 | 0.600 | −0.235 | 0.806 | −0.186 | −0.324 | −0.195 | 0.237 | −0.251 | 0.135 | 0.112 | |
| FUM1 | 0.882 | −0.109 | 0.794 | −0.244 | −0.104 | 0.071 | −0.196 | 0.362 | 0.044 | 0.135 | |
| PGI1 | 0.891 | 0.327 | 0.792 | 0.092 | 0.195 | 0.217 | 0.025 | −0.276 | −0.109 | −0.132 | |
| KGD2 | 0.947 | −0.299 | 0.779 | −0.199 | −0.203 | 0.321 | 0.025 | −0.207 | 0.018 | −0.031 | |
| LSC2 | 0.976 | −0.386 | 0.761 | −0.091 | 0.048 | 0.126 | −0.077 | −0.087 | −0.052 | 0.009 | |
| CIT1 | 0.885 | 0.326 | 0.743 | 0.292 | −0.178 | 0.277 | 0.003 | 0.041 | −0.022 | 0.083 | |
| IDH2 | 0.900 | −0.186 | 0.740 | −0.285 | −0.071 | 0.355 | −0.066 | 0.042 | 0.052 | −0.011 | |
| SDH1 | 0.957 | 0.415 | 0.716 | −0.383 | 0.156 | 0.041 | 0.003 | 0.334 | 0.060 | −0.225 | |
| GND1 | 0.911 | −0.024 | 0.714 | 0.256 | −0.047 | 0.062 | 0.042 | −0.073 | −0.258 | −0.073 | |
| ENO1 | 0.919 | −0.102 | 0.683 | 0.205 | 0.076 | 0.107 | −0.058 | 0.094 | −0.066 | 0.242 | |
| PGK1 | 0.922 | −0.293 | 0.620 | 0.264 | −0.063 | 0.050 | 0.147 | 0.065 | −0.151 | 0.016 | |
| GUT2 | 0.836 | 0.479 | 0.597 | −0.040 | −0.401 | −0.145 | −0.233 | 0.582 | −0.086 | 0.004 | |
| CDC19 | 0.932 | −0.147 | 0.585 | 0.393 | 0.163 | −0.020 | −0.020 | 0.055 | 0.056 | −0.171 | |
| HMG1 | 0.644 | −0.211 | 0.464 | 0.081 | 0.365 | −0.088 | 0.259 | −0.123 | 0.323 | −0.074 | |
| LSC1 | 0.927 | −0.415 | 0.417 | 0.008 | 0.199 | 0.298 | −0.280 | −0.124 | −0.102 | −0.010 | |
| 3 | PAH1 | 0.840 | 0.234 | 0.039 | 0.931 | −0.245 | −0.069 | −0.010 | 0.006 | 0.034 | 0.084 |
| SCT1 | 0.925 | 0.090 | −0.400 | 0.924 | 0.031 | 0.086 | 0.077 | −0.004 | −0.045 | 0.243 | |
| ACC1 | 0.861 | −0.049 | −0.105 | 0.923 | 0.130 | −0.125 | 0.060 | 0.006 | 0.067 | 0.045 | |
| SLC1 | 0.921 | 0.121 | −0.092 | 0.899 | −0.238 | −0.127 | −0.361 | 0.007 | −0.103 | −0.139 | |
| DGA2 | 0.851 | 0.104 | −0.113 | 0.882 | −0.158 | −0.085 | −0.209 | −0.023 | −0.077 | 0.239 | |
| FAS1.1 | 0.865 | −0.328 | 0.016 | 0.833 | 0.017 | −0.116 | −0.013 | −0.081 | 0.012 | 0.038 | |
| ACL1 | 0.974 | −0.182 | 0.313 | 0.793 | 0.089 | −0.228 | −0.013 | −0.014 | 0.042 | −0.021 | |
| GPD1 | 0.878 | 0.240 | 0.287 | 0.728 | −0.300 | 0.316 | −0.328 | 0.087 | 0.164 | −0.037 | |
| FAS2.1 | 0.865 | −0.165 | 0.409 | 0.721 | −0.073 | −0.298 | 0.017 | −0.024 | 0.050 | 0.047 | |
| ACL2 | 0.971 | −0.254 | 0.421 | 0.692 | 0.065 | −0.222 | 0.028 | −0.027 | 0.045 | −0.005 | |
| MDH1 | 0.882 | 0.458 | 0.270 | 0.673 | −0.090 | 0.309 | 0.123 | 0.042 | 0.017 | 0.065 | |
| FAA1 | 0.728 | 0.130 | 0.363 | 0.578 | 0.031 | −0.349 | 0.149 | 0.226 | 0.050 | −0.064 | |
| FBP2 | 0.913 | 0.008 | 0.204 | 0.568 | 0.196 | 0.325 | 0.321 | −0.134 | 0.055 | −0.009 | |
| oil productivity | 0.382 | −0.252 | −0.105 | 0.556 | −0.059 | 0.032 | −0.062 | −0.008 | 0.053 | 0.111 | |
| tid_2139 | 0.645 | −0.433 | −0.173 | 0.532 | 0.430 | 0.167 | −0.055 | 0.181 | 0.097 | −0.078 | |
| PDB1 | 0.891 | −0.300 | 0.296 | 0.421 | −0.013 | 0.324 | 0.086 | 0.103 | −0.038 | −0.039 | |
| 4 | YEH2 | 0.729 | −0.095 | 0.117 | 0.153 | −0.962 | 0.060 | −0.147 | 0.223 | 0.054 | 0.117 |
| K_6707 | 0.956 | 0.200 | 0.023 | 0.243 | −0.931 | −0.083 | 0.059 | 0.329 | 0.001 | −0.025 | |
| PYC1 | 0.786 | 0.040 | 0.124 | −0.071 | 0.820 | 0.004 | 0.169 | −0.023 | −0.014 | −0.057 | |
| LACS1.2 | 0.734 | −0.308 | −0.087 | −0.193 | −0.799 | 0.192 | 0.459 | 0.157 | −0.474 | −0.016 | |
| FAS2.2 | 0.821 | 0.138 | 0.115 | −0.186 | −0.722 | −0.304 | 0.151 | 0.100 | 0.188 | 0.025 | |
| ACO1 | 0.889 | 0.317 | 0.219 | −0.255 | 0.624 | 0.165 | −0.059 | 0.308 | −0.030 | −0.029 | |
| MAE1 | 0.702 | 0.155 | −0.558 | 0.098 | 0.564 | 0.115 | 0.072 | 0.006 | 0.057 | 0.262 | |
| SDH3 | 0.746 | 0.000 | 0.370 | −0.109 | 0.538 | −0.044 | 0.202 | 0.144 | −0.129 | −0.105 | |
| tid_69043 | 0.708 | −0.059 | 0.194 | 0.255 | 0.382 | 0.169 | 0.313 | −0.046 | −0.264 | 0.179 | |
| 5 | KGD1 | 0.656 | 0.206 | −0.199 | −0.016 | 0.070 | 0.824 | 0.170 | −0.040 | 0.085 | 0.025 |
| IDH1 | 0.900 | −0.140 | 0.277 | −0.367 | 0.129 | 0.664 | 0.179 | 0.078 | 0.053 | 0.099 | |
| TPI1 | 0.775 | −0.052 | 0.061 | 0.201 | 0.214 | 0.619 | 0.338 | −0.213 | 0.078 | −0.022 | |
| IDP1 | 0.693 | 0.199 | 0.403 | −0.346 | 0.184 | 0.605 | 0.092 | −0.106 | 0.045 | 0.054 | |
| LPD1 | 0.819 | −0.306 | 0.482 | −0.096 | −0.249 | 0.515 | 0.219 | −0.248 | 0.115 | −0.013 | |
| 6 | CDS1 | 0.760 | −0.034 | −0.049 | 0.125 | −0.034 | −0.243 | −0.815 | 0.256 | −0.028 | −0.013 |
| ALE1 | 0.796 | −0.056 | 0.244 | 0.219 | −0.196 | −0.384 | −0.648 | 0.105 | −0.132 | −0.072 | |
| K_291711 | 0.815 | 0.425 | 0.288 | −0.016 | −0.120 | −0.036 | 0.574 | 0.003 | −0.283 | −0.160 | |
| GAP1 | 0.712 | −0.184 | −0.212 | 0.297 | 0.243 | 0.133 | 0.544 | 0.067 | −0.041 | 0.197 | |
| EMI2 | 0.766 | 0.223 | 0.272 | 0.293 | 0.283 | 0.066 | 0.478 | −0.089 | −0.084 | 0.143 | |
| SHH4 | 0.882 | 0.431 | −0.099 | −0.111 | 0.417 | 0.347 | 0.439 | 0.071 | 0.147 | −0.339 | |
| 7 | TGL1 | 0.611 | 0.157 | 0.135 | −0.052 | 0.209 | 0.151 | 0.201 | −0.828 | 0.219 | 0.192 |
| 8 | TPI2.2 | 0.730 | 0.377 | −0.038 | 0.033 | −0.237 | 0.273 | 0.093 | −0.269 | 0.616 | −0.082 |
| TPI2.1 | 0.792 | 0.414 | −0.428 | 0.231 | −0.008 | 0.122 | −0.064 | −0.079 | 0.603 | 0.004 | |
| FAS1.2 | 0.560 | −0.460 | 0.009 | −0.305 | −0.059 | 0.066 | 0.059 | −0.114 | 0.478 | −0.008 | |
| 9 | PDC1 | 0.851 | 0.167 | 0.030 | 0.426 | −0.068 | 0.179 | 0.246 | −0.272 | 0.022 | 0.665 |
| DGA1 | 0.684 | 0.357 | 0.044 | 0.427 | −0.183 | −0.063 | −0.103 | 0.099 | −0.235 | 0.554 | |
| PDC2 | 0.846 | 0.043 | −0.404 | 0.160 | −0.179 | 0.022 | 0.021 | −0.318 | 0.209 | 0.518 | |
| SOL3 | 0.768 | −0.153 | 0.166 | 0.298 | 0.461 | 0.089 | −0.134 | −0.300 | 0.028 | 0.497 | |
| CMIN (P) | GFI | AGFI | CFI | RMSEA | AIC | |
|---|---|---|---|---|---|---|
| Estimated model | 0.032 | 0.958 | 0.892 | 0.996 | 0.043 | 239.68 |
| Saturated model | 1 | 1 | 272 | |||
| Independent model | 0 | 0.151 | 0.038 | 0 | 0.447 | 5166.72 |
| Source | Target | Standardized Regression Weight | p Values |
|---|---|---|---|
| FAS2.1 | FAS1.1 | 0.894 | *** |
| FAS2.1 | PAH1 | 0.695 | *** |
| FAS1.1 | ACC1 | 0.668 | *** |
| PAH1 | DGA2 | 0.827 | *** |
| PAH1 | ACC1 | 0.339 | *** |
| ACC1 | SCT1 | 1.148 | *** |
| DGA2 | SCT1 | 0.306 | *** |
| FAS2.1 | SCT1 | −0.555 | *** |
| FAS2.1 | ACL1 | 0.765 | *** |
| DGA2 | SLC1 | 0.572 | *** |
| ACC1 | tid_2139 | 0.443 | *** |
| SCT1 | ACL2 | −0.112 | *** |
| PAH1 | tid_2139 | −0.193 | 0.002 |
| FAS1.1 | PDB1 | 0.436 | *** |
| ACL1 | oil productivity | 0.487 | *** |
| ACC1 | oil productivity | −0.36 | 0.007 |
| FAS1.1 | oil productivity | 0.687 | *** |
| FAS2.1 | oil productivity | −0.479 | 0.002 |
| SLC1 | oil productivity | −0.254 | 0.007 |
| DGA2 | oil productivity | 0.488 | *** |
| FAS2.1 | FAA1 | 1.117 | *** |
| PAH1 | MDH1 | 0.619 | *** |
| PDB1 | MDH1 | 0.615 | *** |
| ACC1 | FAA1 | 0.786 | *** |
| oil productivity | MDH1 | −0.107 | 0.005 |
| FAS1.1 | MDH1 | −0.802 | *** |
| FAS1.1 | FAA1 | −0.98 | *** |
| DGA2 | FAA1 | −0.175 | *** |
| ACC1 | MDH1 | 0.608 | *** |
| MDH1 | FBP2 | 0.486 | *** |
| MDH1 | GPD1 | 0.327 | *** |
| SLC1 | GPD1 | 0.3 | *** |
| PDB1 | GPD1 | 0.422 | *** |
| PDB1 | FBP2 | 0.254 | *** |
| SLC1 | FBP2 | −0.182 | *** |
| ACL2 | FBP2 | 0.3 | *** |
| FAA1 | GPD1 | −0.398 | *** |
| PAH1 | GPD1 | 0.362 | *** |
| ACL1 | ACL2 | 0.991 | *** |
| PDB1 | tid_2139 | 0.504 | *** |
| ACL1 | PDB1 | 0.429 | *** |
| PDB1 | ACL2 | 0.081 | *** |
| tid_2139 | SLC1 | −0.342 | *** |
| tid_2139 | ACL1 | 0.26 | *** |
| SLC1 | PDB1 | −0.225 | *** |
| ACL2 | SLC1 | 0.545 | *** |
| CMIN (P) | GFI | AGFI | CFI | RMSEA | AIC | |
|---|---|---|---|---|---|---|
| Estimated model | 0.027 | 0.973 | 0.913 | 0.981 | 0.064 | 87.91 |
| Saturated model | 1 | 1 | 90 | |||
| Independent model | 0 | 0.592 | 0.49 | 0 | 0.289 | 683.446 |
| Source | Target | Standardized Regression Weight | p Values |
|---|---|---|---|
| Group4 | Group2 | 0.353 | *** |
| Group4 | Group7 | −0.285 | *** |
| Group4 | Group6 | 0.472 | *** |
| Group2 | Group6 | 0.249 | *** |
| Group2 | Group8 | −0.383 | *** |
| Group7 | Group8 | 0.178 | 0.004 |
| Group6 | Group9 | 0.364 | *** |
| Group2 | Group9 | −0.177 | 0.009 |
| Group7 | Group9 | 0.362 | *** |
| Group6 | Group1 | 0.549 | *** |
| Group2 | Group5 | 0.557 | *** |
| Group7 | Group5 | 0.304 | *** |
| Group4 | Group5 | 0.24 | *** |
| Group9 | Group1 | 0.157 | 0.006 |
| Group2 | Group3 | 0.462 | *** |
| Group8 | Group1 | 0.233 | *** |
| Group9 | Group3 | 0.476 | *** |
| Group8 | Group5 | 0.215 | *** |
| Group8 | Group3 | −0.152 | 0.001 |
| Group6 | Group3 | 0.241 | *** |
| Group4 | Group3 | −0.189 | *** |
Publisher’s Note: MDPI stays neutral with regard to jurisdictional claims in published maps and institutional affiliations. |
© 2020 by the authors. Licensee MDPI, Basel, Switzerland. This article is an open access article distributed under the terms and conditions of the Creative Commons Attribution (CC BY) license (http://creativecommons.org/licenses/by/4.0/).
Share and Cite
Aburatani, S.; Ishiya, K.; Itoh, T.; Hayashi, T.; Taniguchi, T.; Takaku, H. Inference of Regulatory System for TAG Biosynthesis in Lipomyces starkeyi. Bioengineering 2020, 7, 148. https://doi.org/10.3390/bioengineering7040148
Aburatani S, Ishiya K, Itoh T, Hayashi T, Taniguchi T, Takaku H. Inference of Regulatory System for TAG Biosynthesis in Lipomyces starkeyi. Bioengineering. 2020; 7(4):148. https://doi.org/10.3390/bioengineering7040148
Chicago/Turabian StyleAburatani, Sachiyo, Koji Ishiya, Toshikazu Itoh, Toshihiro Hayashi, Takeaki Taniguchi, and Hiroaki Takaku. 2020. "Inference of Regulatory System for TAG Biosynthesis in Lipomyces starkeyi" Bioengineering 7, no. 4: 148. https://doi.org/10.3390/bioengineering7040148
APA StyleAburatani, S., Ishiya, K., Itoh, T., Hayashi, T., Taniguchi, T., & Takaku, H. (2020). Inference of Regulatory System for TAG Biosynthesis in Lipomyces starkeyi. Bioengineering, 7(4), 148. https://doi.org/10.3390/bioengineering7040148