A Temperature-Controlled Patch Clamp Platform Demonstrated on Jurkat T Lymphocytes and Human Induced Pluripotent Stem Cell-Derived Neurons

 , ,
, ,  and
and 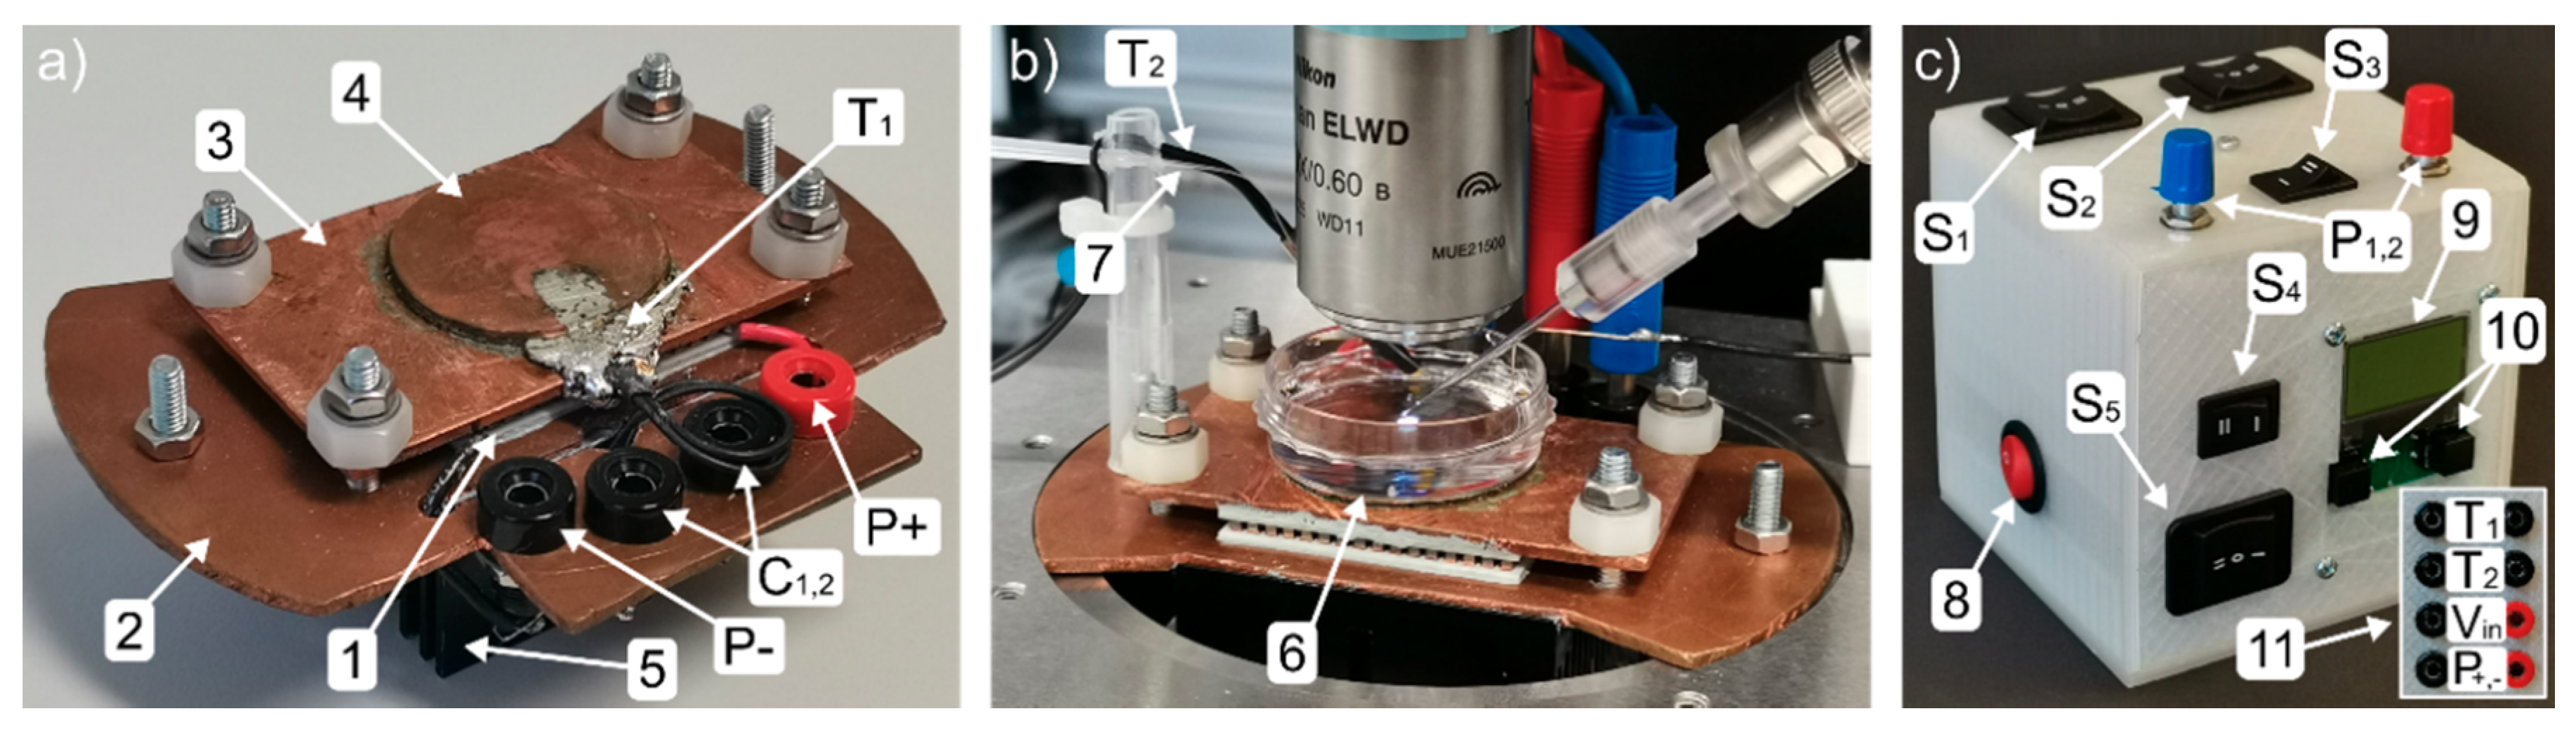
Abstract
1. Introduction
2. Materials and Methods
2.1. Cell Culture
2.2. Patch Clamp Setup
2.3. Electrophysiology
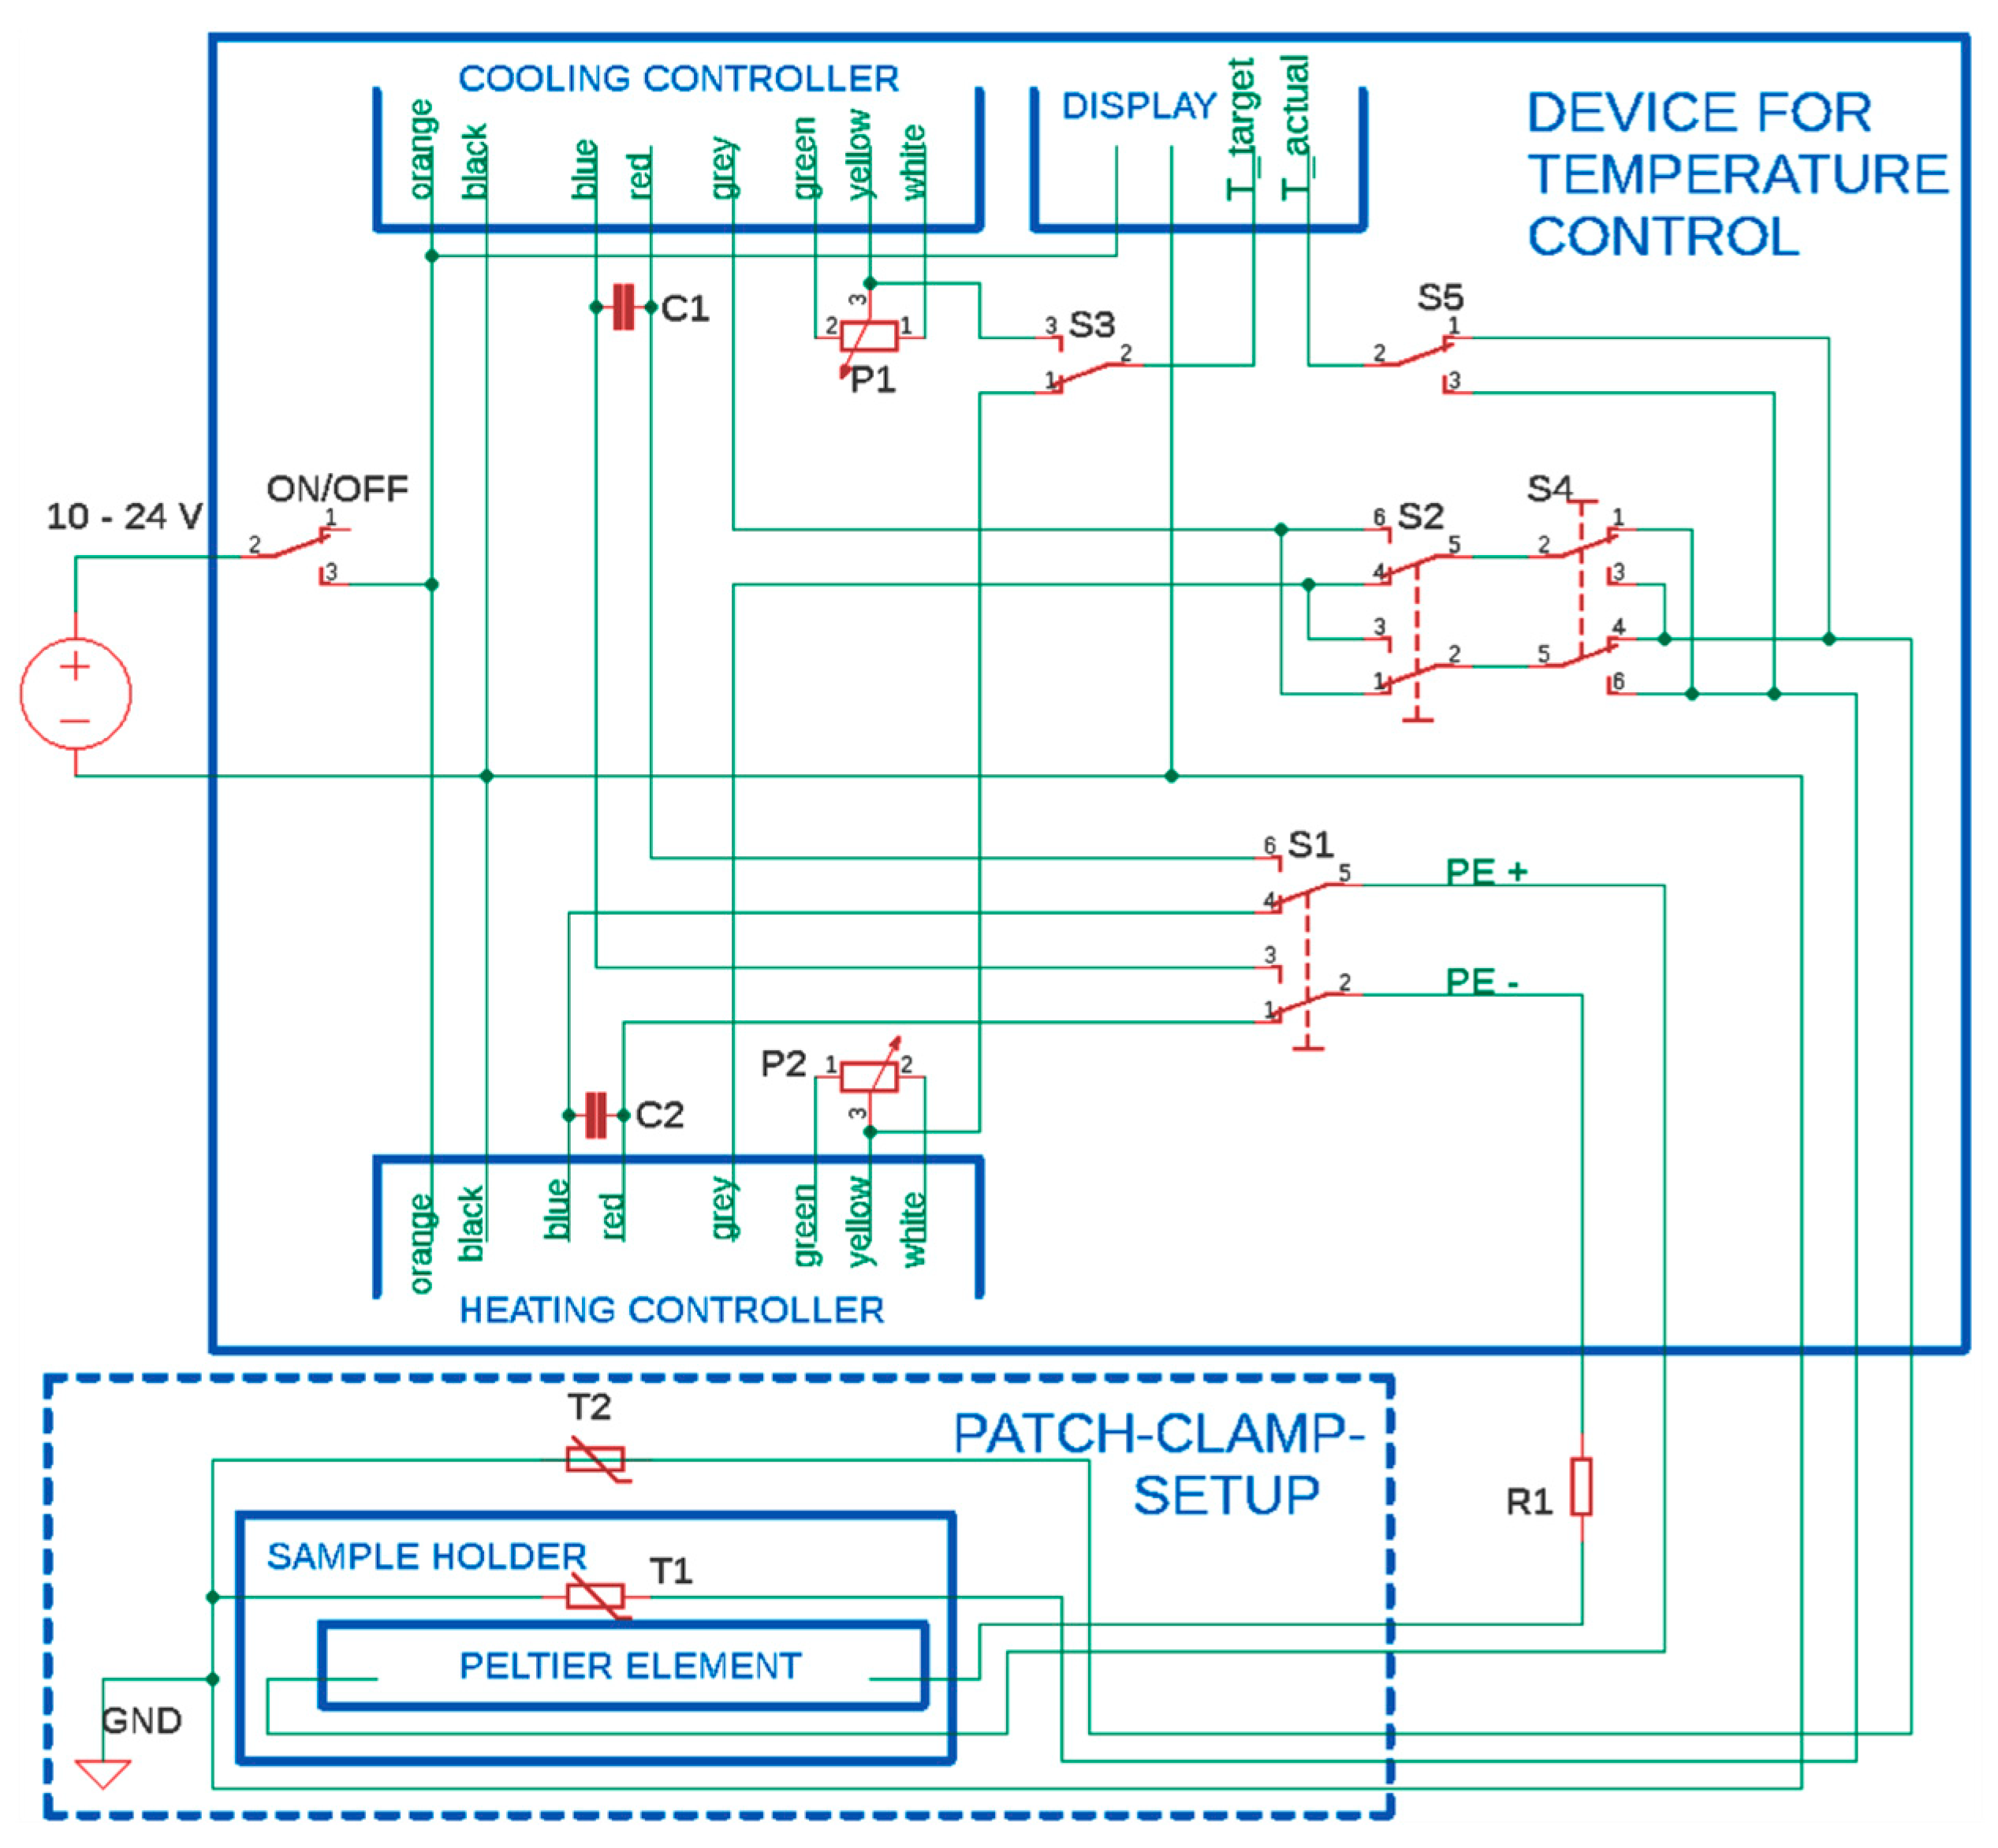
3. Construction of the Temperature-Controlled Patch Clamp Inset
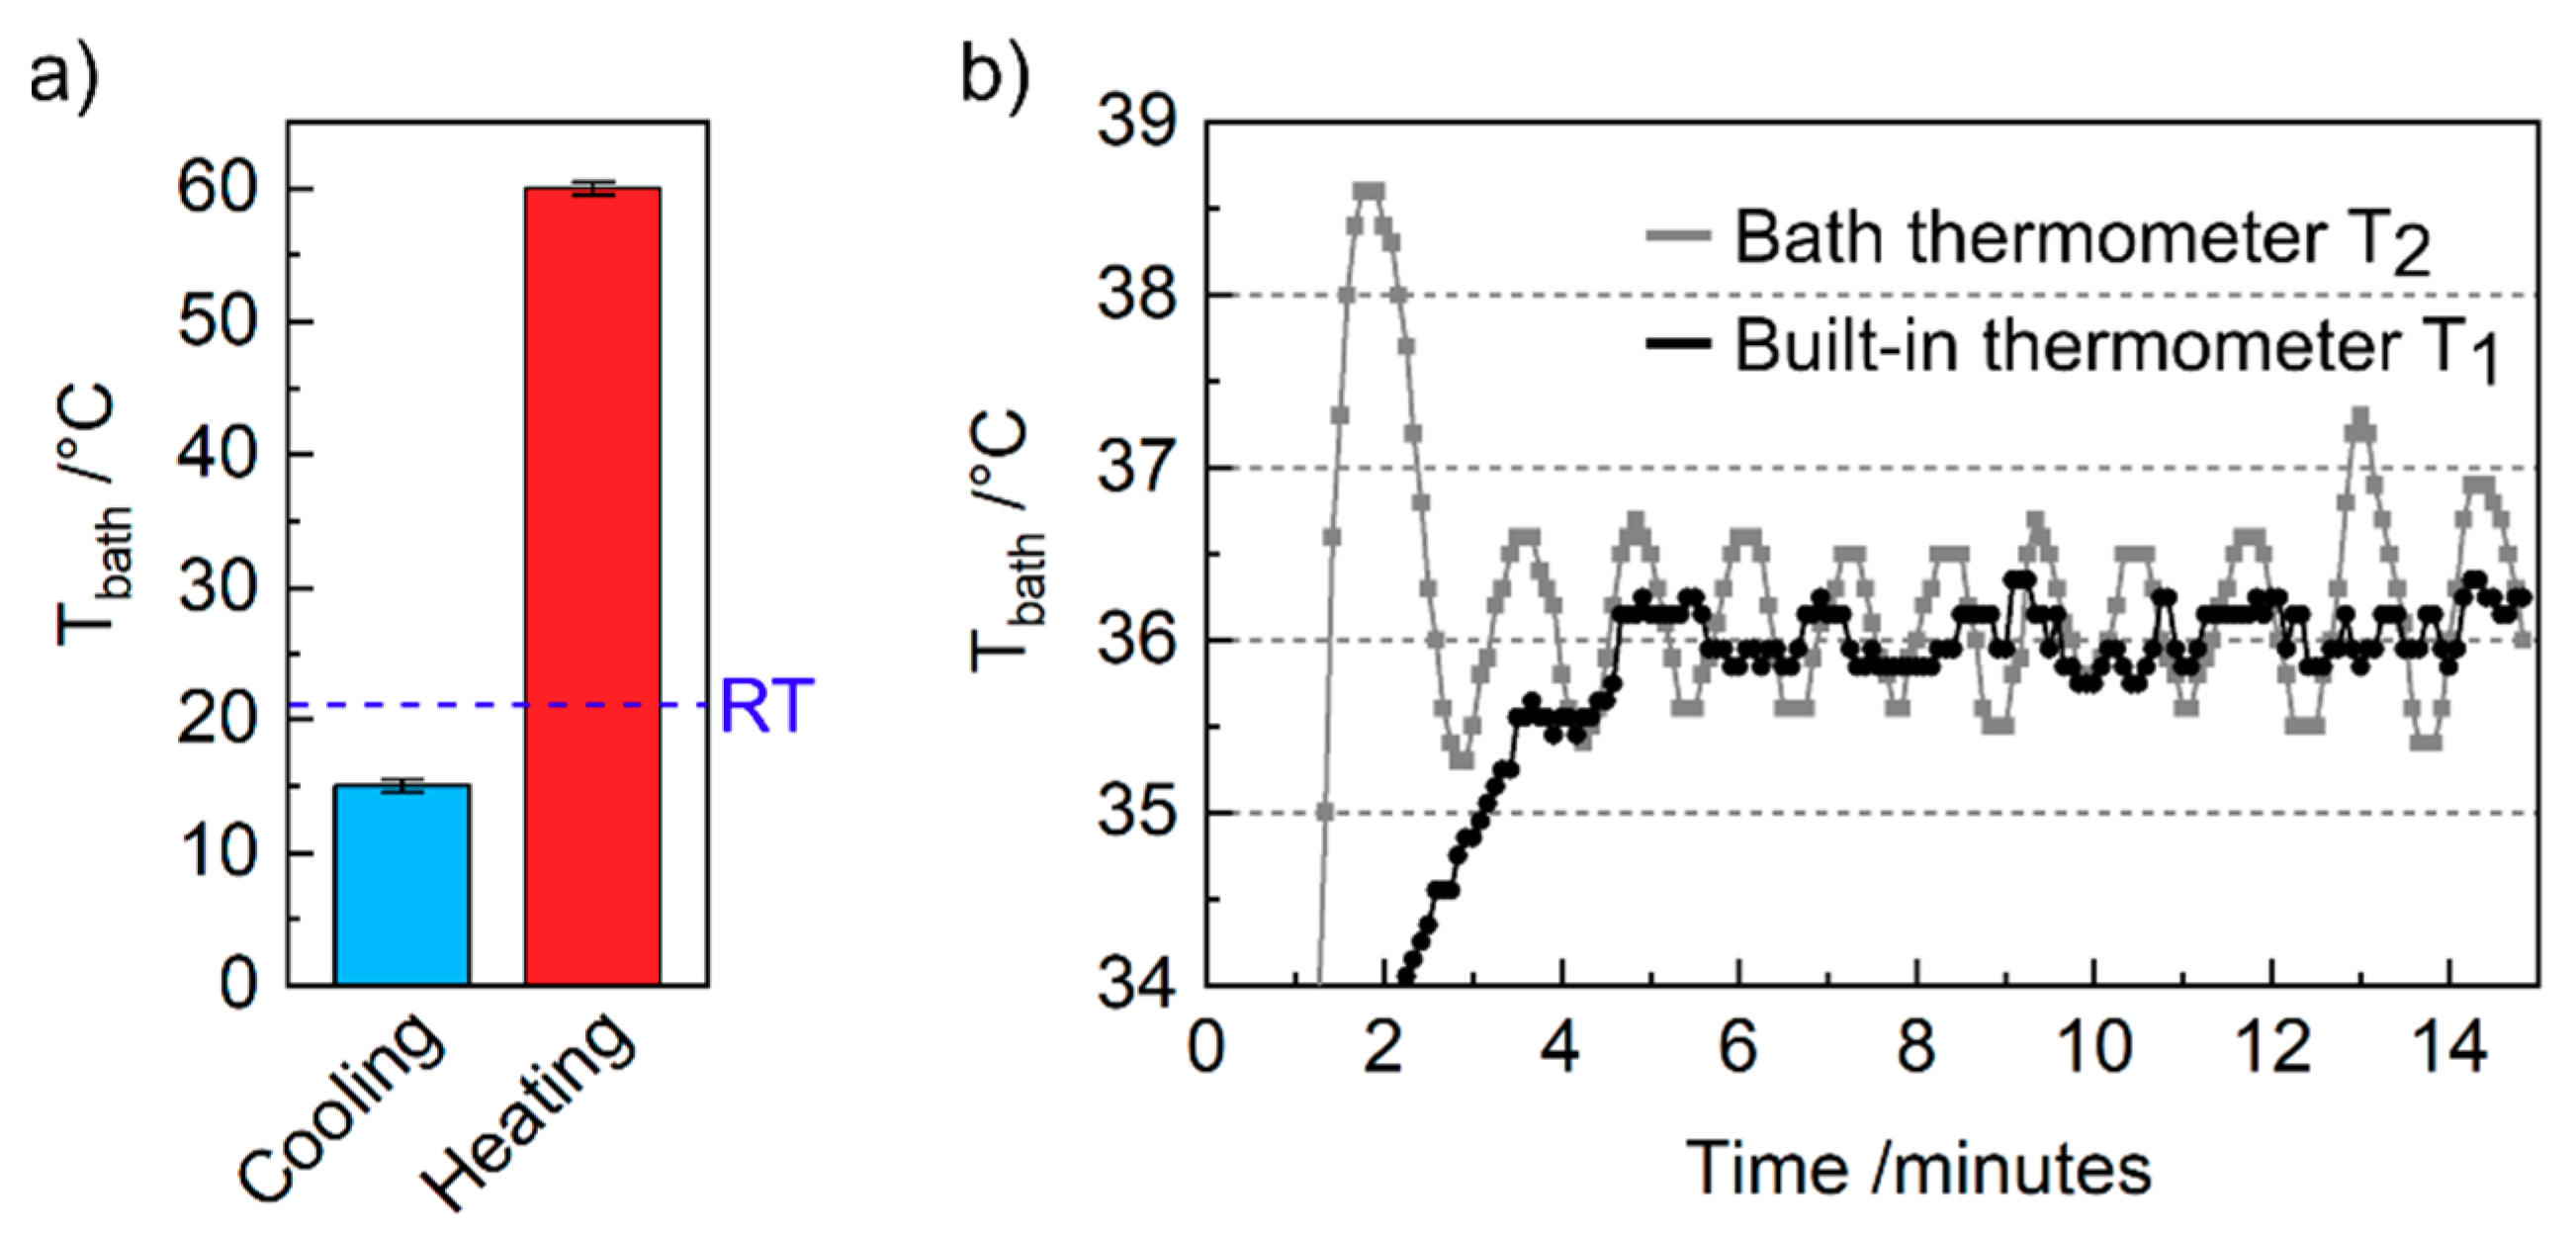
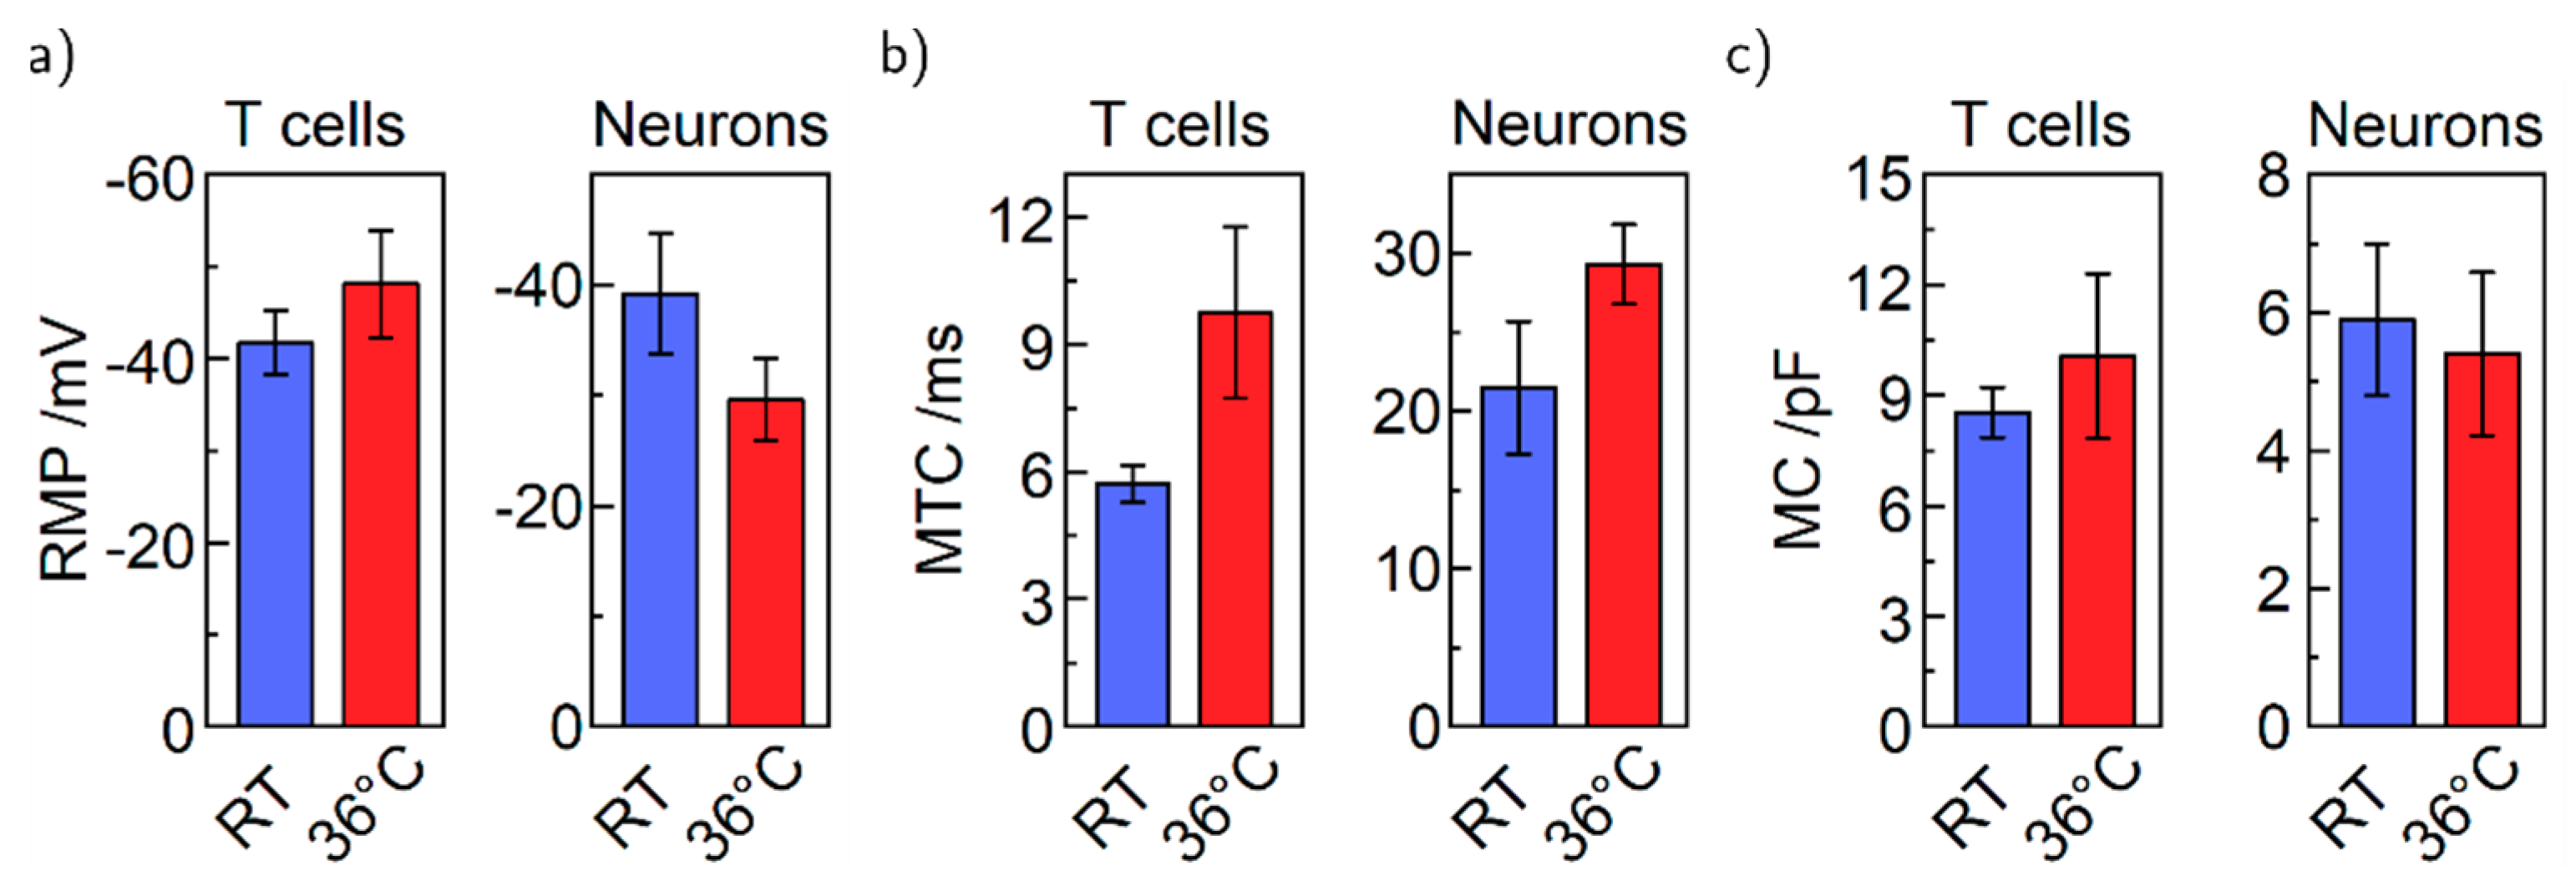
4. Results and Discussion
5. Conclusions
Supplementary Materials
Author Contributions
Funding
Acknowledgments
Conflicts of Interest
Appendix A
| Heating controller | Quick Ohm QC-PC-C01H-100 |
| Cooling controller | Quick Ohm QC-PC-C01C |
| Peltier Element | Quick-Cool QC-127-1.4-8.5MD |
| Display | Quick Ohm QC-PC-D-100 |
| Potentiometer P1, P2 | 0–10 kΩ, supplied with microcontroller |
| Thermometer T1, T2 | 10 kΩ NTC, supplied with microcontroller |
| Switches S1, S2, S4 | Arcolectric H1570 VB AAA 250V/AC |
| Switches S3, S5 | TRU COMPONENTS TC-R13-66C-02 250 V/AC |
| Resistor R1 | ATE Electronics RB50 5.6 Ω 50 W 5% |
| Capacitors C1,2 | Yageo SE025M4700B7F-1632 |
References
- Piccolino, M. Luigi Galvani and Animal Electricity: Two Centuries after the Foundation of Electrophysiology. Trends Neurosci. 1997, 20, 443–448. [Google Scholar] [CrossRef]
- Neher, E.; Sakmann, B. Single-Channel Currents Recorded from Membrane of Denervated Frog Muscle Fibres. Nature 1976, 260, 799–802. [Google Scholar] [CrossRef] [PubMed]
- Sakmann, B.; Neher, E. Patch Clamp Techniques for Studying Ionic Channels in Excitable Membranes. Annu. Rev. Physiol. 1984, 46, 455–472. [Google Scholar] [CrossRef] [PubMed]
- Zhao, Y.; Inayat, S.; Dikin, D.A.; Singer, J.H.; Ruoff, R.S.; Troy, J.B. Patch Clamp Technique: Review of the Current State of the Art and Potential Contributions from Nanoengineering. Proc. Inst. Mech. Eng. Part N. J. Nanoeng. Nanosyst. 2008, 222, 1–11. [Google Scholar] [CrossRef]
- Rubaiy, H.N. A Short Guide to Electrophysiology and Ion Channels. J. Pharm. Pharm. Sci. 2017, 20, 48. [Google Scholar] [CrossRef]
- Kornreich, B.G. The Patch Clamp Technique: Principles and Technical Considerations. J. Vet. Cardiol. 2007, 9, 25–37. [Google Scholar] [CrossRef]
- Chen, C.-C.; Cang, C.; Fenske, S.; Butz, E.; Chao, Y.-K.; Biel, M.; Ren, D.; Wahl-Schott, C.; Grimm, C. Patch-Clamp Technique to Characterize Ion Channels in Enlarged Individual Endolysosomes. Nat. Protoc. 2017, 12, 1639–1658. [Google Scholar] [CrossRef]
- Armstrong, C.M.; Hille, B. Voltage-Gated Ion Channels and Electrical Excitability. Neuron 1998, 20, 371–380. [Google Scholar] [CrossRef]
- Wolpaw, J.R.; Birbaumer, N.; McFarland, D.J.; Pfurtscheller, G.; Vaughan, T.M. Brain–Computer Interfaces for Communication and Control. Clin. Neurophysiol. 2002, 113, 767–791. [Google Scholar] [CrossRef]
- Fertig, N.; Blick, R.H.; Behrends, J.C. Whole Cell Patch Clamp Recording Performed on a Planar Glass Chip. Biophys. J. 2002, 82, 3056–3062. [Google Scholar] [CrossRef]
- Chen, P.; Zhang, W.; Zhou, J.; Wang, P.; Xiao, L.; Yang, M. Development of Planar Patch Clamp Technology and Its Application in the Analysis of Cellular Electrophysiology. Prog. Nat. Sci. 2009, 19, 153–160. [Google Scholar] [CrossRef]
- Annecchino, L.A.; Schultz, S.R. Progress in Automating Patch Clamp Cellular Physiology. Brain Neurosci. Adv. 2018, 2, 239821281877656. [Google Scholar] [CrossRef] [PubMed]
- Yajuan, X.; Xin, L.; Zhiyuan, L. A Comparison of the Performance and Application Differences Between Manual and Automated Patch-Clamp Techniques. Curr. Chem. Genom. 2012, 6, 87–92. [Google Scholar] [CrossRef] [PubMed]
- Tao, C.; Zhang, G.; Xiong, Y.; Zhou, Y. Functional Dissection of Synaptic Circuits: In Vivo Patch-Clamp Recording in Neuroscience. Front. Neural Circuits 2015, 9, 23. [Google Scholar] [CrossRef]
- Kodandaramaiah, S.B.; Franzesi, G.T.; Chow, B.Y.; Boyden, E.S.; Forest, C.R. Automated Whole-Cell Patch-Clamp Electrophysiology of Neurons in Vivo. Nat. Methods 2012, 9, 585–587. [Google Scholar] [CrossRef]
- Dupuis, G.; Héroux, J.; Payet, M.D. Characterization of Ca2+ and K+ Currents in the Human Jurkat T Cell Line: Effects of Phytohaemagglutinin. J. Physiol. 1989, 412, 135–154. [Google Scholar] [CrossRef]
- Franco-Obregón, A.; Wang, H.; Clapham, D.E. Distinct Ion Channel Classes Are Expressed on the Outer Nuclear Envelope of T- and B-Lymphocyte Cell Lines. Biophys. J. 2000, 79, 202–214. [Google Scholar] [CrossRef][Green Version]
- Chokshi, R.; Matsushita, M.; Kozak, J.A. Sensitivity of TRPM7 Channels to Mg2+ Characterized in Cell-Free Patches of Jurkat T Lymphocytes. Am. J. Physiol. Physiol. 2012, 302, C1642–C1651. [Google Scholar] [CrossRef]
- Needham, K.; Hyakumura, T.; Gunewardene, N.; Dottori, M.; Nayagam, B.A. Electrophysiological Properties of Neurosensory Progenitors Derived from Human Embryonic Stem Cells. Stem Cell Res. 2014, 12, 241–249. [Google Scholar] [CrossRef]
- Khattak, S.; Brimble, E.; Zhang, W.; Zaslavsky, K.; Strong, E.; Ross, P.J.; Hendry, J.; Mital, S.; Salter, M.W.; Osborne, L.R.; et al. Human Induced Pluripotent Stem Cell Derived Neurons as a Model for Williams-Beuren Syndrome. Mol. Brain 2015, 8, 77. [Google Scholar] [CrossRef]
- Kikuchi, T.; Morizane, A.; Doi, D.; Magotani, H.; Onoe, H.; Hayashi, T.; Mizuma, H.; Takara, S.; Takahashi, R.; Inoue, H.; et al. Human IPS Cell-Derived Dopaminergic Neurons Function in a Primate Parkinson’s Disease Model. Nature 2017, 548, 592–596. [Google Scholar] [CrossRef] [PubMed]
- Gunhanlar, N.; Shpak, G.; van der Kroeg, M.; Gouty-Colomer, L.A.; Munshi, S.T.; Lendemeijer, B.; Ghazvini, M.; Dupont, C.; Hoogendijk, W.J.G.; Gribnau, J.; et al. A Simplified Protocol for Differentiation of Electrophysiologically Mature Neuronal Networks from Human Induced Pluripotent Stem Cells. Mol. Psychiatry 2018, 23, 1336–1344. [Google Scholar] [CrossRef] [PubMed]
- Wang, H.; Wang, B.; Normoyle, K.P.; Jackson, K.; Spitler, K.; Sharrock, M.F.; Miller, C.M.; Best, C.; Llano, D.; Du, R. Brain Temperature and Its Fundamental Properties: A Review for Clinical Neuroscientists. Front. Neurosci. 2014, 8, 1–17. [Google Scholar] [CrossRef] [PubMed]
- Klinke, R.; Pape, H.-C.; Silbernagl, S. Physiologie, 5th ed.; Klinke, R., Pape, H.-C., Silbernagl, S., Eds.; Georg Thieme Verlag: Stuttgart, Germany, 2005. [Google Scholar] [CrossRef]
- Pape, H.-C.; Klinke, R.; Brenner, B.; Silbernagl, S. Physiologie, 7 vollst.; Pape, H.-C., Kurtz, A., Silbernagl, S., Eds.; Georg Thieme Verlag: Stuttgart, Germany, 2014. [Google Scholar] [CrossRef]
- Bausch, C.S.; Heyn, C.; Hansen, W.; Wolf, I.M.A.; Diercks, B.-P.; Guse, A.H.; Blick, R.H. Ultra-Fast Cell Counters Based on Microtubular Waveguides. Sci. Rep. 2017, 7, 41584. [Google Scholar] [CrossRef] [PubMed]
- Reinhardt, P.; Glatza, M.; Hemmer, K.; Tsytsyura, Y.; Thiel, C.S.; Höing, S.; Moritz, S.; Parga, J.A.; Wagner, L.; Bruder, J.M.; et al. Derivation and Expansion Using Only Small Molecules of Human Neural Progenitors for Neurodegenerative Disease Modeling. PLoS ONE 2013, 8, e59252. [Google Scholar] [CrossRef]
- Partida-Sanchez, S.; Gasser, A.; Fliegert, R.; Siebrands, C.C.; Dammermann, W.; Shi, G.; Mousseau, B.J.; Sumoza-Toledo, A.; Bhagat, H.; Walseth, T.F.; et al. Chemotaxis of Mouse Bone Marrow Neutrophils and Dendritic Cells Is Controlled by ADP-Ribose, the Major Product Generated by the CD38 Enzyme Reaction. J. Immunol. 2007, 179, 7827–7839. [Google Scholar] [CrossRef]
- Neher, E.; Sakmann, B.; Steinbach, J.H. The Extracellular Patch Clamp: A Method for Resolving Currents through Individual Open Channels in Biological Membranes. Pfluegers Arch. Eur. J. Physiol. 1978, 375, 219–228. [Google Scholar] [CrossRef]
- Cramer, G.D.; Darby, S.A. Clinical Anatomy of the Spine, Spinal Cord, and ANS, 3rd ed.; Elsevier Health Sciences: London, UK, 2013. [Google Scholar]
- Siegel, G.J. Basic Neurochemistry, 6th ed.; Siegel, G.J., Ed.; Lippincott Williams & Wilkins: Philadelphia, PA, USA, 1999. [Google Scholar]
- Cesare, P.; Moriondo, A.; Vellani, V.; Mcnaughton, P.A. Ion Channels Gated by Heat. Proc. Natl. Acad. Sci. USA 1999, 96, 7658–7663. [Google Scholar] [CrossRef]
- Cahalan, M.D.; Chandy, K.G. The Functional Network of Ion Channels in T Lymphocytes. Immunol. Rev. 2009, 231, 59–87. [Google Scholar] [CrossRef]
- Toma, J.S.; Shettar, B.C.; Chipman, P.H.; Pinto, D.M.; Borowska, J.P.; Ichida, J.K.; Fawcett, J.P.; Zhang, Y.; Eggan, K.; Rafuse, V.F. Motoneurons Derived from Induced Pluripotent Stem Cells Develop Mature Phenotypes Typical of Endogenous Spinal Motoneurons. J. Neurosci. 2015, 35, 1291–1306. [Google Scholar] [CrossRef]
- Moe, M.C.; Varghese, M.; Danilov, A.I.; Westerlund, U.; Ramm-Pettersen, J.; Brundin, L.; Svensson, M.; Berg-Johnsen, J.; Langmoen, I.A. Multipotent Progenitor Cells from the Adult Human Brain: Neurophysiological Differentiation to Mature Neurons. Brain 2005, 128, 2189–2199. [Google Scholar] [CrossRef] [PubMed]
- DeCoursey, T.E.; Chandy, K.G.; Gupta, S.; Cahalan, M.D. Voltage-Dependent Ion Channels in T-Lymphocytes. J. Neuroimmunol. 1985, 10, 71–95. [Google Scholar] [CrossRef]
- Pottosin, I.I.; Valencia-Cruz, G.; Bonales-Alatorre, E.; Shabala, S.N.; Dobrovinskaya, O.R. Methyl-β-Cyclodextrin Reversibly Alters the Gating of Lipid Rafts-Associated Kv1.3 Channels in Jurkat T Lymphocytes. Pflügers Arch. Eur. J. Physiol. 2007, 454, 235–244. [Google Scholar] [CrossRef] [PubMed]
- Harberts, J.; Zierold, R.; Fendler, C.; Koitmäe, A.; Bayat, P.; Fernandez-Cuesta, I.; Loers, G.; Diercks, B.-P.; Fliegert, R.; Guse, A.H.; et al. Culturing and Patch Clamping of Jurkat T Cells and Neurons on Al2O3 Coated Nanowire Arrays of Altered Morphology. RSC Adv. 2019, 9, 11194–11201. [Google Scholar] [CrossRef]
- Lee, S.C.; Deutsch, C. Temperature Dependence of K(+)-Channel Properties in Human T Lymphocytes. Biophys. J. 1990, 57, 49–62. [Google Scholar] [CrossRef]
- Kimitsuki, T.; Komune, S. Temperature Enhances Activation and Inactivation Kinetics of Potassium Currents in Inner Hair Cells Isolated from Guinea-Pig Cochlea. Clin. Exp. Otorhinolaryngol. 2013, 6, 140. [Google Scholar] [CrossRef]
- Lodish, H.F.; Berk, A.; Kaiser, C.; Krieger, M.; Bretscher, A.; Ploegh, H.L.; Amon, A.; Scott, M.P. Molecular Cell Biology, 7th ed.; Freeman: New York, NY, USA, 2012. [Google Scholar]
- Koitmäe, A.; Müller, M.; Bausch, C.S.; Harberts, J.; Hansen, W.; Loers, G.; Blick, R.H. Designer Neural Networks with Embedded Semiconductor Microtube Arrays. Langmuir 2018, 34, 1528–1534. [Google Scholar] [CrossRef]
- Djuric, U.; Cheung, A.Y.L.; Zhang, W.; Mok, R.S.; Lai, W.; Piekna, A.; Hendry, J.A.; Ross, P.J.; Pasceri, P.; Kim, D.-S.; et al. MECP2e1 Isoform Mutation Affects the Form and Function of Neurons Derived from Rett Syndrome Patient IPS Cells. Neurobiol. Dis. 2015, 76, 37–45. [Google Scholar] [CrossRef]
- Xie, Y.; Schutte, R.J.; Ng, N.N.; Ess, K.C.; Schwartz, P.H.; O’Dowd, D.K. Reproducible and Efficient Generation of Functionally Active Neurons from Human HiPSCs for Preclinical Disease Modeling. Stem. Cell Res. 2018, 26, 84–94. [Google Scholar] [CrossRef]
- Harberts, J.; Haferkamp, U.; Haugg, S.; Fendler, C.; Lam, D.; Zierold, R.; Pless, O.; Blick, R.H. Interfacing Human Induced Pluripotent Stem Cell-Derived Neurons with Designed Nanowire Arrays as a Future Platform for Medical Applications. Biomater. Sci. 2020, 8, 2434–2446. [Google Scholar] [CrossRef]
- Huang, S.; Uusisaari, M.Y. Physiological Temperature during Brain Slicing Enhances the Quality of Acute Slice Preparations. Front. Cell. Neurosci. 2013, 7. [Google Scholar] [CrossRef] [PubMed]
- Griffin, J.D.; Boulant, J.A. Temperature Effects on Membrane Potential and Input Resistance in Rat Hypothalamic Neurones. J. Physiol. 1995, 488, 407–418. [Google Scholar] [CrossRef] [PubMed]
- Picot, A.; Dominguez, S.; Liu, C.; Chen, I.-W.; Tanese, D.; Ronzitti, E.; Berto, P.; Papagiakoumou, E.; Oron, D.; Tessier, G.; et al. Temperature Rise under Two-Photon Optogenetic Brain Stimulation. Cell Rep. 2018, 24, 1243–1253.e5. [Google Scholar] [CrossRef] [PubMed]
- Owen, S.F.; Liu, M.H.; Kreitzer, A.C. Thermal Constraints on in Vivo Optogenetic Manipulations. Nat. Neurosci. 2019, 22, 1061–1065. [Google Scholar] [CrossRef] [PubMed]


© 2020 by the authors. Licensee MDPI, Basel, Switzerland. This article is an open access article distributed under the terms and conditions of the Creative Commons Attribution (CC BY) license (http://creativecommons.org/licenses/by/4.0/).
Share and Cite
Harberts, J.; Kusch, M.; O’Sullivan, J.; Zierold, R.; Blick, R.H. A Temperature-Controlled Patch Clamp Platform Demonstrated on Jurkat T Lymphocytes and Human Induced Pluripotent Stem Cell-Derived Neurons. Bioengineering 2020, 7, 46. https://doi.org/10.3390/bioengineering7020046
Harberts J, Kusch M, O’Sullivan J, Zierold R, Blick RH. A Temperature-Controlled Patch Clamp Platform Demonstrated on Jurkat T Lymphocytes and Human Induced Pluripotent Stem Cell-Derived Neurons. Bioengineering. 2020; 7(2):46. https://doi.org/10.3390/bioengineering7020046
Chicago/Turabian StyleHarberts, Jann, Max Kusch, John O’Sullivan, Robert Zierold, and Robert H. Blick. 2020. "A Temperature-Controlled Patch Clamp Platform Demonstrated on Jurkat T Lymphocytes and Human Induced Pluripotent Stem Cell-Derived Neurons" Bioengineering 7, no. 2: 46. https://doi.org/10.3390/bioengineering7020046
APA StyleHarberts, J., Kusch, M., O’Sullivan, J., Zierold, R., & Blick, R. H. (2020). A Temperature-Controlled Patch Clamp Platform Demonstrated on Jurkat T Lymphocytes and Human Induced Pluripotent Stem Cell-Derived Neurons. Bioengineering, 7(2), 46. https://doi.org/10.3390/bioengineering7020046