Article

The Statistical Optimisation of Recombinant β-glucosidase Production through a Two-Stage, Multi-Model, Design of Experiments Approach

School of Food Science and Environmental Health, College of Sciences and Health, Technological University Dublin, Dublin D07 ADY7, Ireland
*
Author to whom correspondence should be addressed.
Bioengineering 2019, 6(3), 61; https://doi.org/10.3390/bioengineering6030061
Submission received: 18 June 2019 / Revised: 6 July 2019 / Accepted: 16 July 2019 / Published: 18 July 2019

Abstract

:
β-glucosidases are a class of enzyme that are widely distributed in the living world, with examples noted in plants, fungi, animals and bacteria. They offer both hydrolysis and synthesis capacity for a wide range of biotechnological processes. However, the availability of native, or the production of recombinant β-glucosidases, is currently a bottleneck in the widespread industrial application of this enzyme. In this present work, the production of recombinant β-glucosidase from Streptomyces griseus was optimised using a Design of Experiments strategy, comprising a two-stage, multi-model design. Three screening models were comparatively employed: Fractional Factorial, Plackett-Burman and Definitive Screening Design. Four variables (temperature, incubation time, tryptone, and OD600 nm) were experimentally identified as having statistically significant effects on the production of S.griseus recombinant β-glucosidase in E. coli BL21 (DE3). The four most influential variables were subsequently used to optimise recombinant β-glucosidase production, employing Central Composite Design under Response Surface Methodology. Optimal levels were identified as: OD600 nm, 0.55; temperature, 26 °C; incubation time, 12 h; and tryptone, 15 g/L. This yielded a 2.62-fold increase in recombinant β-glucosidase production, in comparison to the pre-optimised process. Affinity chromatography resulted in homogeneous, purified β-glucosidase that was characterised in terms of pH stability, metal ion compatibility and kinetic rates for p-nitrophenyl-β-D-glucopyranoside (pNPG) and cellobiose catalysis.

Graphical Abstract

1. Introduction

Recombinant protein expression has traditionally been an empirical process that required running a large number of experiments to explore many influencing variables (e.g., expression vectors, hosts, expression conditions and media compositions) [1]. The expression of recombinant β-glucosidase, similar to other recombinant proteins, is influenced not only by the expression host strain, but also by expression conditions and media composition [2,3]. β-glucosidase catalyses the hydrolysis of β-1,4-glycosidic bonds, and its industrial applications are well documented [4,5]. However, low yields of this enzyme have been a bottleneck for industrial applications, such as saccharification for biofuels production, and enzymatic synthesis of alkyl-glycosides and oligosaccharides, where large enzyme concentrations are needed [6,7]. In an attempt to address this issue of poor production yields, this study applied a statistical approach, Design of Experiments (DoE), to enhance the production of a recombinant β-glucosidase. The application of DoE to optimise protein production has been recently reviewed [8,9]. Enhanced production of recombinant β-glucosidase, following DoE, has been detailed for recombinant β-glucosidases from a variety of sources, such as Pichia pastoris [3], A. niger HN-2 [10] and A. niger [11]. However, to date, no attempt has been made to enhance the production of β-glucosidase form Streptomyces sp.; a species known to be an effective source of β-glucosidase genes [12,13], with limited sequence conservation compared to P. pastoris (18% conservation) and A. niger (26% conservation). The aim of this study was to optimise the production of S. griseus recombinant β-glucosidase in E.coli BL21 (DE3) by using multiple screening designs to validate the variable selected for optimisation via a response surface methodology. The findings of this study are explored in light of the existing literature and recommendations are offered for future applications of Design of Experiments to enhance recombinant protein production.

2. Materials and Methods

2.1. Chemical and Materials

The recombinant pGEX-4T-1 vector containing S. griseus β-glucosidase gene (GST-tagged) in E. coli BL21 (DE3) was developed in a previous study [14]. Ampicillin, glycerol, Isopropyl-β-D-thiogalactopyranoside (IPTG), LB broth, p-nitrophenyl-β-D-glucopyranoside (pNPG), p-nitrophenol (pNP), cellobiose, fructose sucrose, tryptone, yeast extract, beef extract, CaCl2, DTT, KOH, MgCl2, (NH4)2S4, ZnSO4, Triton X-100, M PMSF, Lysozyme, Bradford reagent, and Glutathione Sepharose 4B resin were purchased from Sigma Aldrich (Ireland).

2.2. Production of S. griseus Recombinant β-glucosidase

2.2.1. Preparation of Microbiological Media

The recombinant pGEX-4T-1 vector containing S. griseus β-glucosidase gene (GST-tagged) in E. coli BL21 (DE3) was inoculated into 5 mL of Luria-Bertani (LB) medium containing ampicillin at a final concentration of 50 µg·mL−1, and incubated at 37 °C for overnight at 220 rpm. The overnight culture was used to inoculate 10% v/v of fresh medium for small-scale (10 mL) expression studies used during the screening and optimisation processes.

2.2.2. Carbon and Nitrogen Sources for S. griseus Recombinant β-glucosidase Expression

Identification of good carbon and nitrogen sources for S. griseus recombinant β-glucosidase expression was initially performed. Four carbon sources (glucose, fructose, galactose, and glycerol) and six nitrogen sources (yeast extract, tryptone, beef extract, KNO3, NH4Cl, and (NH4)2SO4) were selected based on their noted effect on recombinant expression in E-coli in general [15,16], and on β-glucosidase in particular [17,18]. The effect of carbon and nitrogen sources was investigated in basal medium supplemented with 0.5% (w/v) of the different carbon sources and 1% (w/v) of the different nitrogen sources [19]. In each case, cells were grown until OD600 nm reached 0.5, and then induced with 1mM IPTG for 6 h with subsequent culturing at 37 °C, 220 rpm.

2.2.3. Effect of Culture Aeration on S. griseus Recombinant β-glucosidase Expression

Subsequently, the influence of culture aeration, via baffled culture flasks, on the protein expression was also investigated by cultivating cells with medium supplemented with the selected carbon and nitrogen sources, 0.5% w/v fructose, 1% w/v yeast extract and tryptone (see Section 2.2.2), in baffled and non-baffled flasks, at 37 °C, 220 rpm for 6 h post 1 mM IPTG induction.

2.2.4. Screening of Most Significant Medium Components and Induction Condition Using Multiple Screening Designs

Fractional Factorial Design (FFD), Plackett-Burman Design (BBD), and Definitive Screening Design (DSD) were employed to comparatively screen for the most significant medium components and induction conditions affecting S. griseus recombinant β-glucosidase production in E. coli BL21 (DE3). A total of seven factors, including four induction related conditions (OD, IPTG, temperature, incubation time) and three medium components (yeast extract, tryptone, fructose) were considered for the screening experiments. All factors were studied at two levels; high and low, denoted by (+) and (−) signs, respectively (see Table 1). The FFD was created using the main effects only and confounding all interactive effects by using Resolution 4 within JMP. For the DSD, two centre-point replicates were used to verify the variation in the screening process and to validate that the two level design linear assumption was true. The multiple screening designs used in this study, along with their responses, are summarised in Table 2, Table 3 and Table 4. A statistical analysis of the experimental data was performed and a densitometry analysis of sodium dodecyl sulfate polyacrylamide gel electrophoresis (SDS-PAGE) of the expressed β-glucosidase was carried out using ImageJ densitometry software, http://rsb.info.nih.gov/ij/ [20].

2.2.5. Optimisation of S. griseus Recombinant β-glucosidase Production by Response Surface Methodology

A Central Composite Design (CCD) was applied to identify the optimum levels of the most effective variables (temperature, induction time, tryptone, and OD600 nm) previously identified in the screening process. Each variable in the design was examined at three levels, low (−), central (0), and high (+; see Table 5).
Central Composite Design was the preferred Response Surface Methodology, due to the fact that this design permitted full, or fractional, factorial modes, with the potential to add central points to evaluate the experimental error [21]. In this experiment, the total number of runs was calculated using Equation (1).
N = k 2 + 2 k + C p
where k is the number of factors and Cp the number of centre points [22]. An experimental design by CCD was developed with a total number of 28 runs, including four replicates at the central point. The full experimental plan comprising maximum, central and minimum ranges of the screened variables is provided in Table 6.

2.2.6. Statistical Analysis

JMP 13 (SAS Institute, Wittington House, UK) was utilised to design experiments and to analyse, through regression analysis, the experimental data. The response obtained (BGL activity: U/mL) was also subjected to ANOVA. A second-order polynomial equation was then fitted to the data using a multiple regression procedure (Equation (2)).
Y =   β 0   +   β i X i +   β i i X i 2 + β i j X i X j
where Y is the predicted response, β0, βi, βii, and βij are coefficients for the intercept, linear, square or quadratic, and interactive terms, respectively. Xi and Xj are the independent variables [23]. The fit of the model was also evaluated through ANOVA (see Table 7). The coefficient value (R2) was used to define how well the data fit the model used; whilst the p-value and “lack of fit” were used to estimate the appropriateness of the model [24]. The significance of regression coefficients were also examined (see Table 8). Finally, the experimental and predicted values were compared to determine the validity of the developed model.

2.2.7. Optimum Determination and Validation

To determine the optimum factor levels for maximal yields of recombinant β-glucosidase, surface contour plots were utilised. In these 3-D plots, two test factors were utilized, whilst the other factors were maintained at their respective zero levels [25]. The optimum conditions were verified by conducting validation experiments comprising three independent experiments examining the responses generated in comparison to the model-predicted results.

2.2.8. Purification of S. griseus Recombinant β-glucosidase by Affinity Chromatography

Following six hours of induced S. griseus recombinant β-glucosidase, the cell mass was pelleted by centrifugation at 7000 ×g for 10 min at 4 °C. The pellet was lysed by resuspension in lysis buffer (10 mM Na2HPO4, 1.8 mM KH2PO4, 140 mM NaCl, 1% (v/v)) Triton X-100, 1mM DTT, 1mM PMSF, 10 mg·mL−1 Lysozyme) and sonication at an amplitude of 40 for 30 s using an Ultrasonic processor Sonicator (QSONICA, Newtown, CT, USA). The resultant slurry was centrifuged at 14,000 ×g for 30 min at 4 °C and the cleared lysate was further filtered through an Amicon® Ultra centrifugal filter to concentrate the lysed protein mixture. The concentrated lysed protein mixture was loaded onto a Glutathione Sepharose 4B resin column and incubated for 30 min at 4 °C with gentle shaking. Subsequently, the S. griseus recombinant β-glucosidase was fractionally collected at a flow rate of 0.5 mL/min, using a gravity flow column. The GST-tag was on-column cleaved from the purified S. griseus recombinant β-glucosidase by PreScission protease using a washing (50 mM Tris, 150 mM NaCl, pH 8) and elution buffer (50 mM Tris, 150 mM NaCl, 12 mM reduced glutathione, pH 8) combination [26]. The eluted enzyme was dialysed against 1.0 L of 50 mM potassium phosphate buffer, pH 7 at 4 °C for 24 h with constant, gentle stirring. The protein purity was verified by 10% (v/v) SDS-PAGE [27].

2.2.9. Determination of Protein Concentration

The protein concentration was determined according to the Bradford Method [28], using an adapted 96-well plate approach. Bovine serum albumin was used as standard, with a working protein concentration linear range of 0 to 1 mg·mL−1, in 50 mM Potassium phosphate buffer (pH 7). The protocol entailed, in triplicate, 5 µL of the protein standard/diluted sample was added to an individual well. The negative control was 5 µL of the buffer (50 mM Potassium phosphate, pH 7) in place of the protein standard/diluted sample. Subsequently, 250 µL of the Bradford reagent (Sigma) was added to each well sequentially, using a multichannel pipette, and the mixtures were thoroughly mixed by using the mixing cycle on the microplate spectrophotometer (Bio-Tek PowerWave) for 10 s and incubated at room temperature for 20 min. The resulting absorbance was measured at 595 nm against the blank and the absorbance of the unknown protein concentration was determined in comparison to the standards.

2.2.10. Determination of S. griseus Recombinant β-glucosidase Activity

The recombinant β-glucosidase activity was measured using a standard enzyme activity assay by determining the hydrolysis of the substrate p-nitrophenyl-β-D-glucopyranoside (pNPG) using a 96-well-plate-based protocol. In brief, 20 µL the purified recombinant β-glucosidase (0.5 mg·mL−1) was mixed with 120 µL potassium phosphate buffer (50 mM, pH 7) and 30µL pNPG (7 mM) substrate, and incubated at 37 °C for 20 min. A negative control comprised the same components with the enzyme volume replaced with buffer. The reaction was terminated by adding 30 µL of 1 M Na2CO3 and the total reaction volume was 200 µL. The release of p-nitrophenol (pNP) was measured at 405 nm using a microplate spectrophotometer (Bio-Tek PowerWave). All experiments were performed as three independent experimental runs, themselves as triplicates. The colour developed was translated to µmol pNP using a standard curve in the range of 0 to 0.5 mM, prepared as outlined [29]. One unit (IU) of β-glucosidase activity was defined as the amount of enzyme required to release 1 µmol of product (pNP) per minute under the standard assay conditions.

2.2.11. Stability Studies and Characterisation

Characterisation studies, unless otherwise stated, utilised the standard enzyme assay (see Section 2.2.10). To examine the effect of pH on the β-glucosidase activity, the pH stability was performed by incubating the enzyme in the reaction buffers: citrate buffer (pH 5.0), phosphate buffer (pH 6.0–8.0) at 37 °C for 0 to 180 min [30]. The effect of metal ions on the enzyme was determined using 1 mM of several metal ions (Ca2+, Mg2+, N+, K+, ZnSO4, and (NH4)2SO4) at 37 °C, for 60 min and 240 min. The kinetic parameters were determined from Michaelis–Menten plots of reaction rate of three independent experiments at 37 °C, using varying pNPG substrate concentrations between 4 mM to 32 mM, and cellobiose from 5 mM to 50 mM, under standard assay conditions. For cellobiose, the determination of glucose released was measured using a Colourimetric Assay Kit (Invitrogen, Thermo Scientific, Cork, Ireland), according to manufacturer’s instructions. The values of Vmax and Km were determined by non-linear regression analysis, using GraphPad Prism (Version 7, GraphPad Software, San Diego, CA, USA).

3. Results and Discussion

Recombinant β-glucosidases from different sources, heterologously expressed in prokaryotic and eukaryotic systems have typically utilised the traditional One Factor At a Time (OFAT) method to optimise yield [18]. However, this classical approach requires a significant number of experiments and fails to account for interactions between variables, which can result in low yields [8,31]. In this study, the production of S. griseus recombinant β-glucosidase has been optimised, instead, by Design of Experiments with the emphasis on optimising parameters that affected expression. Prior to Design of Experiments, preliminary investigations on carbon and nitrogen sources, along with the effect of aeration, were performed to reduce the number of factors to be explored through DoE. This permitted the comparative screening process to cover a more targeted experimental space, facilitating the selection of the most influential factors, whilst simultaneously ensuring a validated screen and effective subsequent optimisation [32].

3.1. Effect of Carbon and Nitrogen Sources

Carbon is important to all living organisms and the breakdown of the carbon source liberates energy, which is utilised by the organism for growth and development [33]. The most commonly used carbon sources in heterologous protein expression are glucose, starch, glycerol, fructose, maltose, arabinose, sucrose, lactose, and xylose [33,34,35,36]. In this study, the effect of six different carbon sources (glucose, lactose sucrose, galactose, fructose and glycerol) on the expression of S. griseus recombinant β-glucosidase was investigated (see Figure 1a). As expected, glucose was found to significantly repress expression, by 23% (p-value ≤ 0.01); the repressive effect of glucose on β-glucosidase could be the catabolic repression of glucosidase synthesis, which was reported in literature [37,38]. In contrast, fructose significantly enhanced the expression of S. griseus recombinant β-glucosidase, by 17% (p-value ≤ 0.01), and echoes previous studies [39].
Nitrogen sources have been previously reported to influence the production of protein in general [40] and β-glucosidase in particular [17]. In this study, the effect of six nitrogen sources (yeast extract, tryptone, beef extract, ammonium sulfate, ammonium chloride, and potassium nitrate) on S. griseus recombinant β-glucosidase were explored (see Figure 1b). Tryptone and yeast extract exhibited a significant effect (p-value ≤ 0.01) on the expression of S. griseus recombinant β-glucosidase; 23% and 17% increase in production, respectively, mirroring previous reports [18,41]. In contrast, potassium nitrate exhibited a significant repressive effect by 15% (p-value ≤ 0.05) of production, while beef extract, ammonium sulphate, and ammonium chloride did not show any significant effect on the production of this recombinant enzyme.

3.2. Effect of Aeration on S. griseus Recombinant β-glucosidase Expression

Aeration is an important parameter known to effect recombinant protein expression and baffled flasks are a common approach to enhance protein synthesis through enhanced oxygenation efficiency [42]. To understand the effect of aeration on expression of S. griseus recombinant β-glucosidase, the expression was carried in baffled and non-baffled flasks with basal medial supplemented with optimum carbon and nitrogen sources (Section 3.1). No statistically significant difference was noted between a baffled and non-baffled flaks culture (see Figure 2) and chimes with results previously reported on the production on β-glucosidase in Pichia pastoris [3]. Baffled culture phenomena, such as foaming [43] or reduced metabolite production [44,45], may result in similar yields to a non-baffled culture.

3.3. Screening of most Significant Media Components and Induction Conditions

Multiple screening designs (PBD, FFD, DSD) were simultaneously used to identify the most influential variables and validate the reliability of the screening matrix through inter-screen correlation. The average response ranged from 39.21 U/mL to 41.24 U/mL (see Table 2, Table 3 and Table 4), providing a rationale to optimise the medium constituents and induction conditions for maximal S. griseus β-glucosidase production. Experimental data were statistically interrogated to identify and categorise the most influential variables (see Figure 3). In all cases, the multiple screening processes identified the same important factors as most influential; temperature (X3) and incubation time (X4) were highly statistically significant (p-value < 0.001), whereas tryptone (X6) and OD600nm (X1) were statistically significant (p-value < 0.05). These results align with previous studies that employed factorial design to enhance β-glucosidases expression [46,47]. Other factors, namely IPTG (X2), yeast extract (X5) and fructose (X7), were not statistically significant (p-value > 0.05). The interaction effect of X3*X4, and the quadratic effects of X3*X3, X4*X4, were found to be highly significant (p-value < 0.001; see Figure 3b,c), indicating that these factors interact, and any change in one would affect the other, as well as the response. These affects were also visualized via SDSPAGE (see Figure 4).

3.4. Optimisation of Screened Variables for Maximal Production

A three level Central Composite Design was used to optimise the production of S. griseus recombinant β-glucosidase. Table 4 details the experimental design and corresponding response (actual, predicted, and residuals) of the production β-glucosidase.
The model adequacy was verified by multiple regression analyses, utilising a second-order polynomial fitted to Equation (3).
Y = 41.7891 0.0566   X 1 0.2557   X 3 0.1524   X 4   + 0.0754   X 6   0.5328   X 1 X 1 0.9758   X 3 X 3 0.4068   X 4 X 4   0.1308   X 6 X 6   + 0.0133   X 1 X 3 + 0.0014   X 1 X 4   + 0.0008   X 1 X 6 0.285   X 3 X 4 0.0557   X 3 X 6 + 0.0239   X 4 X 6
where Y is response, X1 is OD600 nm, X3 is Temperature, X4 is Incubation time, X6 is Tryptone. The data were analysed by analysis of variance (ANOVA, see Table 7), with the model F-value noted as being highly significant (p-value < 0.001). The model “goodness of fit” (R2adjusted = 0.9885) confirmed the appropriateness of the model to predict the response [48]. The “model lack of fit” F-value was not significant (6.87; p-value > 0.05), confirming the accuracy of the model [49]. The predicted R2 (0.9945) indicates a good agreement between the value predicted by the model and the experimental data (see Figure 5a). A plot of residual values versus predicted values also revealed no trends (see Figure 5b), implying homogeneity of variance in the data and absence of outliers in the experimental runs [25].
The regression coefficient significance under a student t-test (see Table 8) indicated that temperature and incubation time were constantly found to be the most influential factors and highly significant (p-value < 0.001). All of the square terms, except X6*X6, were also found to be highly significant (p-value < 0.001). Interaction coefficients were significant with the order of X3*X4 > X3*X6, indicating the importance of the interacting variables.
Three dimensional response surface and contour plots [50,51] were used to predict optimum factor levels for maximal production of S.griseus recombinant β-glucosidase (see Figure 6). The response surface and contour plots between OD600 nm and temperature (Figure 6a,a’), and OD600 nm and incubation time (Figure 6b,b’), displayed curved relationships, indicating these variables significantly influenced the production of S. griseus recombinant β-glucosidase, with maximum enzyme activity observed at central variable levels. The response surface and contour plots between temperature and incubation time (Figure 6c,c’) indicate a direct correlation between the production of S. griseus recombinant β-glucosidase and both variables. The maximum enzyme activity was determined at central levels and decreased at the extreme levels. The relationship between temperature and tryptone presented an elliptical shape and was significant (see Figure 6d,d’ and Table 6). Increasing the tryptone concentration (to 15 g/L) resulted in increased enzyme production, with the optimum noted at temperature central point. A relationship between the 3D response surface and the statistically significant factors (at p-value < 0.05) optimised in this study indicates that the statistical model developed was appropriate to cover all independent variable ranges investigated in this study.

3.5. Validation of Central Composite Design for Optimisation

Experiments were carried out independently at the identified optimal levels of the statistically significant variables (OD600 nm, 0.55; temperature, 26 °C; incubation time, 12 h; and tryptone, 15 g/L) and at the middle levels of the other variables to verify the validity of the optimisation model. Subsequently, the experimental results were compared with the predicted results and a control experiment utilising the pre-optimised process parameters in basal medium. The observed value of enzyme activity (41.900 U/mL) was in good agreement with the predicted value (41.789 U/mL; see Table 6). The CCD optimisation of S. griseus recombinant β-glucosidase production reached 42 U/mL enzyme activity, representing a 2.62-fold increase in β-glucosidase production when compared to pre-optimised conditions (see Table 9). This fold increase in production is similar to production increases for recombinant β-glucosidases from different sources following DoE –based optimization, 2.21-fold [30] and 2.2-fold [10]; however, larger fold increases, up to 5.7-fold, have also been reported [46].

3.6. Affinity Purification of S. griseus Recombinant β-glucosidase

An overall yield of 47%, with a specific activity of 9.13 U/mg against pNPG as the substrate, was noted following Glutathione S-Transferase (GST) tag purification and on-column tag cleavage. Successful purification was verified through SDS-PAGE analysis (Figure 7a) and activity assay (see Table 10). The final purified enzyme showed a single band with a molecular mass of approximately 42kDa (Figure 7b).

3.7. Fundamental Characterisation

The purified S. griseus recombinant β-glucosidase and commercial almond β-glucosidase (Sigma) were previously used to evaluate the effect of pH, effector molecules, and natural substrate, and have been documented [14]. Here, following detailed pH stability profiling, purified S. griseus recombinant β-glucosidase was noted to retain >95% activity at pH 7, decreasing to 78% at pH 8 over a period of 180 min, and 50% at pH 6 after 75 min at 37 °C (see Figure 8). An optimal range of pH 6 to 8 is a common feature of β-glucosidase enzymes isolated from diverse bacterial strains [52,53,54,55,56].

3.8. Effect of Metal Ions and Chemical Reagent on Purified S. griseus β-glucosidase

Metal ions can elicit inhibitory effects β-glucosidase [57,58]. Several metal ions were examined (see Table 11), with modest activation noted in Ca2+, Mg2+, N+, and K+ after 6 h incubation. These results echo reports of β-glucosidase enhancement, through conformational change, by Ca2+ and Mg2+ ions [59,60].

3.9. Kinetic Parameters

Two substrates (synthetic pNPG, and natural cellobiose) were used to determine the kinetic parameters for the purified recombinant S.griseus β-glucosidase (see Table 12). A higher affinity for a synthetic substrate in comparison to a natural β-glucosidase substrate has been previously reported for β-glucosidases from Thermoanaerobacterium [56] and Phoma sp KCTC11825BP [61]. The high Km and Vmax indicated that this enzyme has less affinity for pNPG and cellobiose compared to other reports for cellobiose, with Km 1.0 mM, Vmax 144 μmol·min−1·mg−1 [62], and for pNPG, with Km 3.3 mM, Vmax 43.68 μmol·min−1·mg−1 [63]. Further kinetic parameters on β-glucosidases from various sources are given in Table 13.

4. Conclusions

The production of functional recombinant enzymes in sufficient concentration for industrial applications is often a bottle-neck. Production optimisation can, however, result in significant increases in yield. Here, the statistical Design of Experiments approach was used as an efficient technique to identify the key factors and levels required for optimised production of S.griseus recombinant β-glucosidase in E. coli BL21 (DE3). The use of multiple screening designs in this study internally validated the selection of the most influential factors as temperature and incubation time, followed by tryptone and OD600 nm for induction. These variables were optimised, through a Central Composite Design, resulting in a 2.62-fold increased yield. Previous characterisation data were supplemented in this study and concluded that the S. griseus recombinant β-glucosidase purified enzyme exhibited optimum activity at pH 7, had a temperature optimum of 69 °C and displayed increased activity in the presence of Mg2+, N+, Ca2+, and K+, whilst it had a higher affinity for the artificial substrate pNPG in comparison to the natural cellobiose substrate.
With this increased production capacity, a more detailed understanding of stability and substrate specificity, this S. griseus recombinant β-glucosidase could be useful for a variety of applications, including hydrolysis of biomass into fermentable sugars, hydrolysis of lactose during processing lactose containing products, and enzymatic synthesis of alkyl glycosides, where β-glucosidases of similar characteristics have been reported to be useful [7,18,71,72].

Author Contributions

All authors contributed substantially to this body of work, in the form of; Conceptualization, A.U., G.K.K., G.T.H. and B.J.R.; Data Curation, A.U.; Writing-Original Draft Preparation, A.U., G.K.K., G.T.H., J.M.F. and B.J.R.; Writing-Review & Editing, A.U., G.K.K., G.T.H., J.M.F. and B.J.R.; Supervision, G.K.K., G.T.H. and B.J.R.; Project Administration, B.J.R.; Funding Acquisition, B.J.R., G.T.H. and A.U.
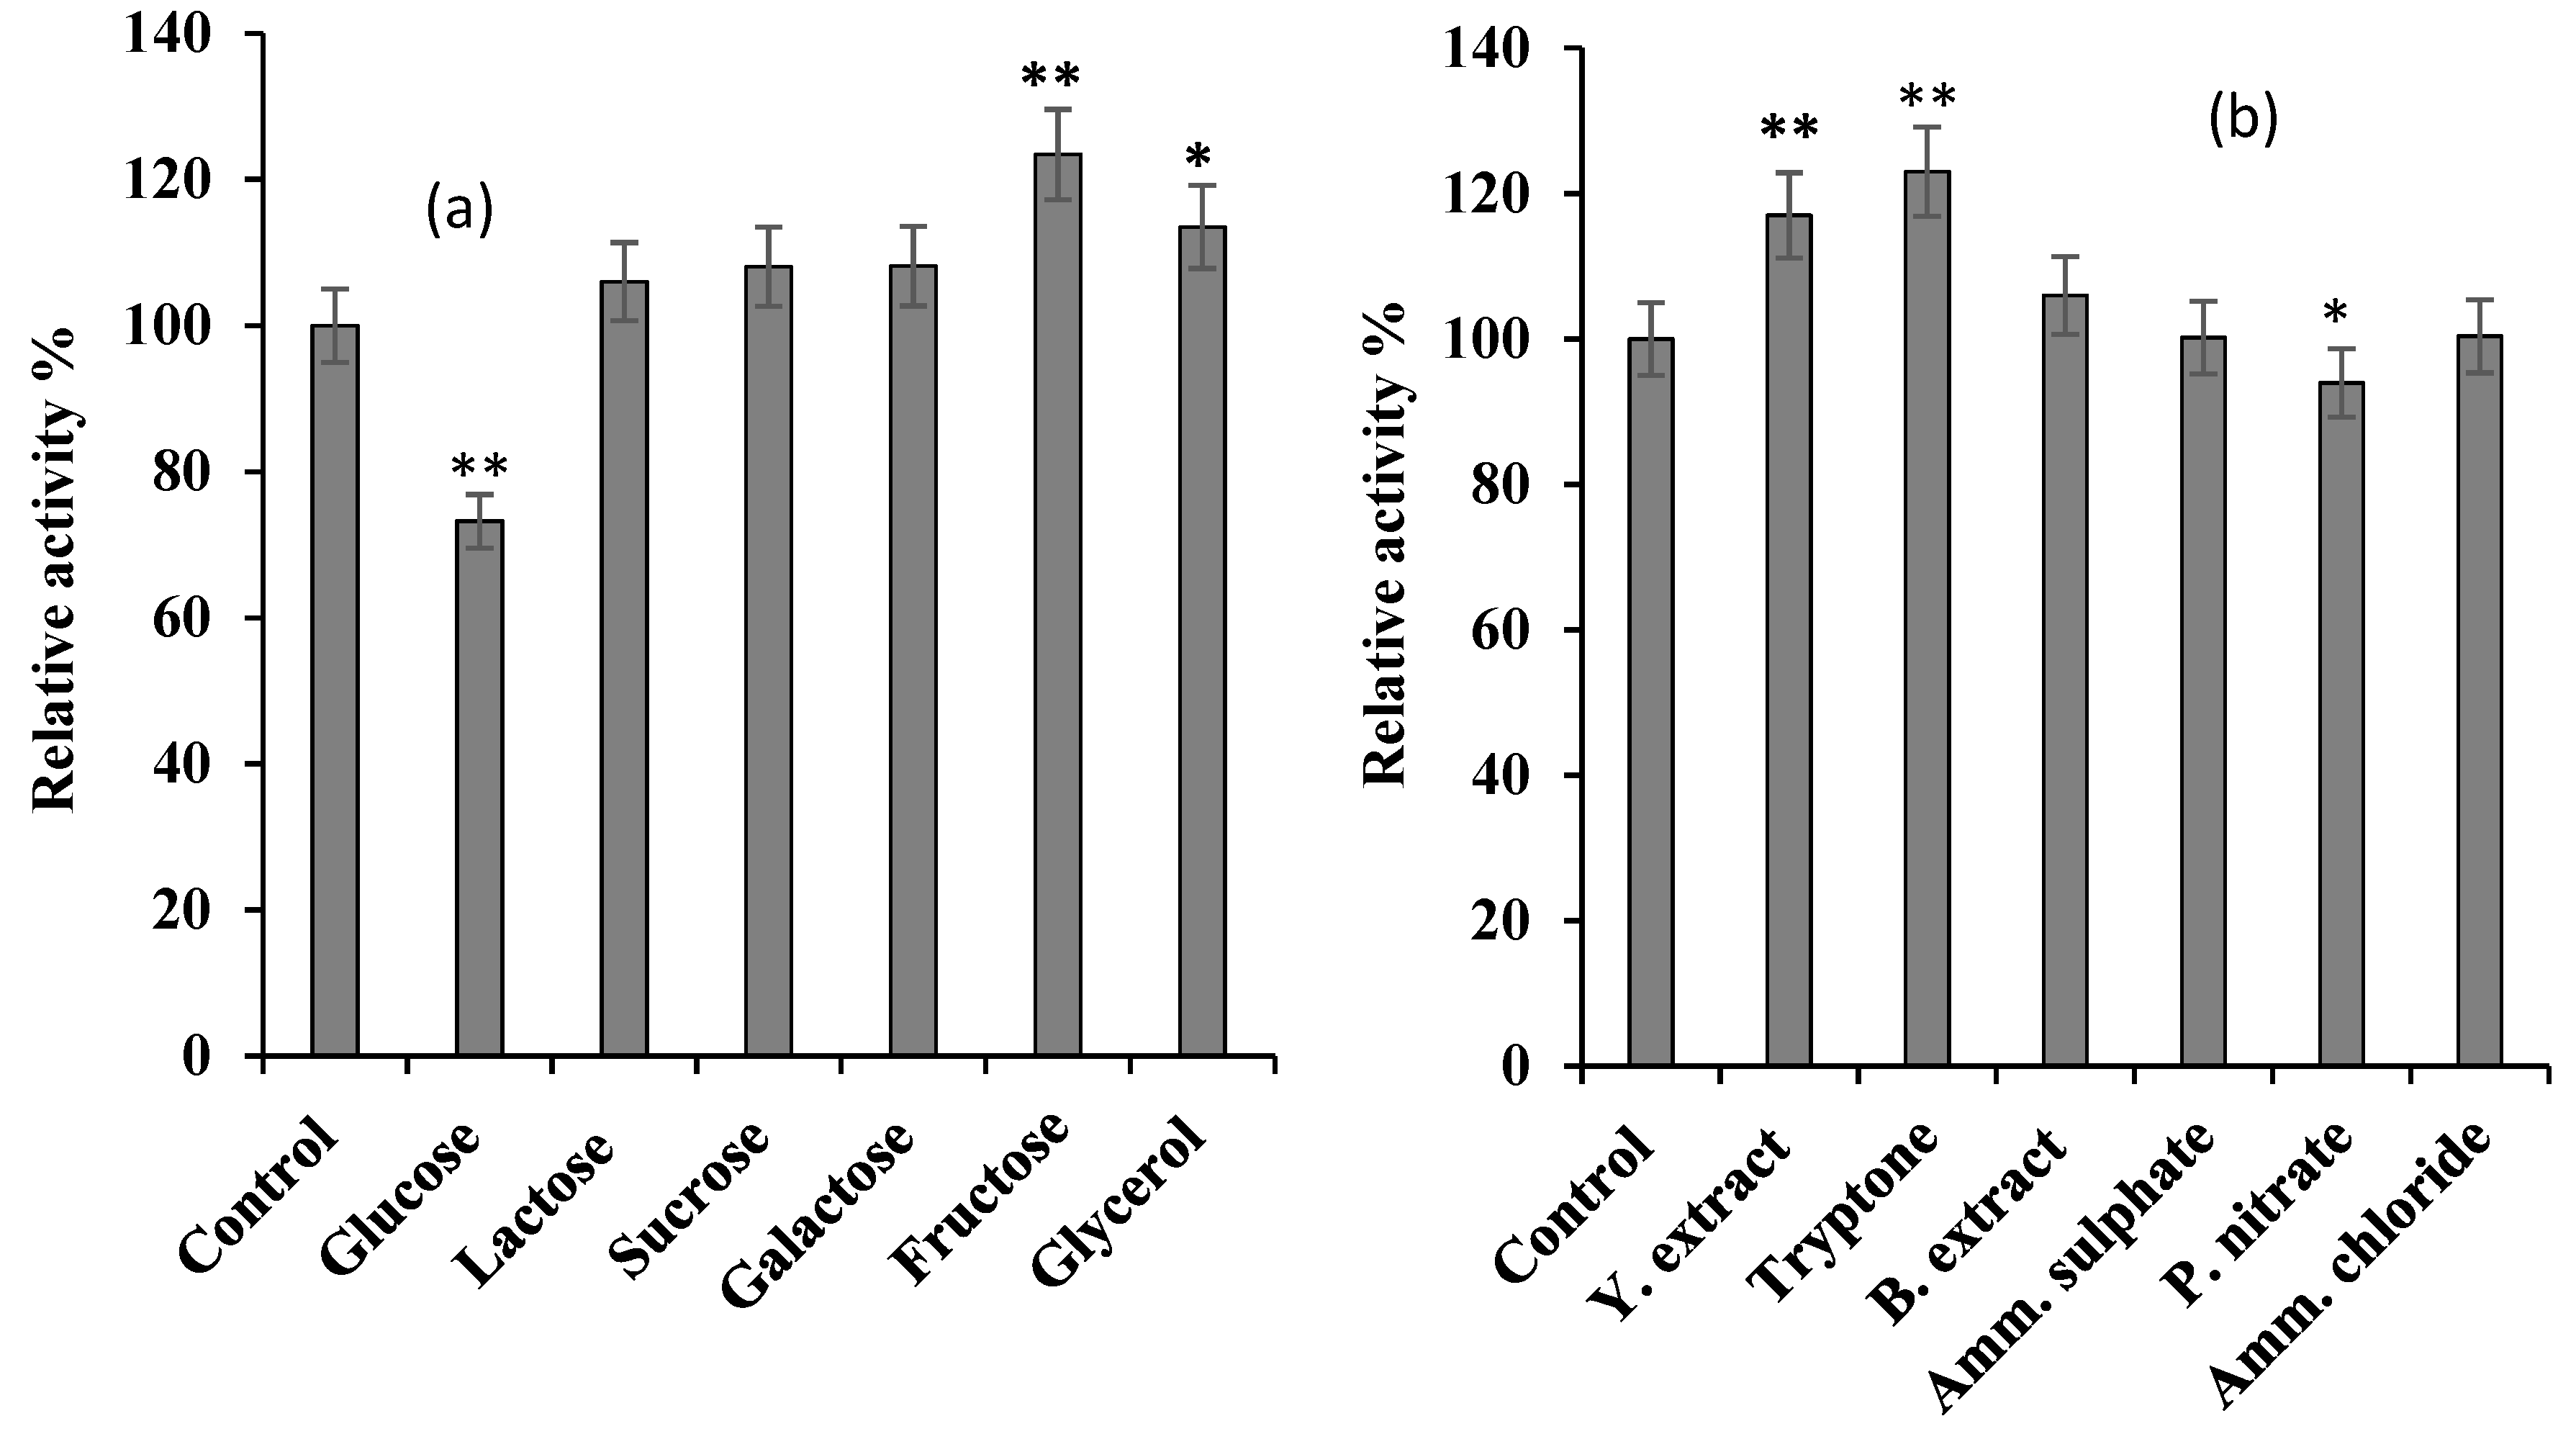
Funding

This research was funded by Technological University Dublin, grant number [PB04118] and the APC was waived by the Publisher.

Conflicts of Interest

The authors declare no conflict of interest.

References

  1. Makino, T.; Skretas, G.; Georgiou, G. Strain engineering for improved expression of recombinant proteins in bacteria. Microb. Cell Factories 2011, 10, 32. [Google Scholar] [CrossRef] [PubMed]
  2. Xia, W.; Xu, X.; Qian, L.; Shi, P.; Bai, Y.; Luo, H.; Ma, R.; Yao, B. Engineering a highly active thermophilic β-glucosidase to enhance its pH stability and saccharification performance. Biotechnol. Biofuels 2016, 9, 147. [Google Scholar] [CrossRef] [PubMed]
  3. Batra, J.; Beri, D.; Mishra, S. Response surface methodology based optimization of β-glucosidase production from Pichia pastoris. Appl. Biochem. Biotechnol. 2014, 172, 380–393. [Google Scholar] [CrossRef] [PubMed]
  4. Liu, Z.L.; Weber, S.A.; Cotta, M.A.; Li, S.Z. A new β-glucosidase producing yeast for lower-cost cellulosic ethanol production from xylose-extracted corncob residues by simultaneous saccharification and fermentation. Bioresour. Technol. 2012, 104, 410–416. [Google Scholar] [PubMed]
  5. Arévalo Villena, M.; Úbeda Iranzo, J.F.; Gundllapalli, S.B.; Cordero Otero, R.R.; Briones Pérez, A.I. Characterization of an exocellular β-glucosidase from Debaryomyces Pseudopolymorphus. Enzym. Microb. Technol. 2006, 39, 229–234. [Google Scholar] [CrossRef]
  6. Lee, S.M.; Jin, L.H.; Kim, J.H.; Han, S.O.; Na, H.B.; Hyeon, T.; Koo, Y.M.; Kim, J.; Lee, J.H. β-Glucosidase coating on polymer nanofibers for improved cellulosic ethanol production. Bioprocess Biosyst. Eng. 2010, 33, 141–147. [Google Scholar] [CrossRef]
  7. Mladenoska, I. Synthesis of octyl-β-glucoside catalyzed by almond β-glucosidase in unconventional reaction media. Food Technol. Biotechnol. 2016, 54, 211–216. [Google Scholar] [CrossRef]
  8. Uhoraningoga, A.; Kinsella, G.; Henehan, G.; Ryan, B. The Goldilocks Approach: A Review of Employing Design of Experiments in Prokaryotic Recombinant Protein Production. Bioengineering 2018, 5, 89. [Google Scholar] [CrossRef]
  9. Thakkar, A.; Saraf, M. Application of Statistically Based Experimental Designs to Optimize Cellulase Production and Identification of Gene. Nat. Prod. Bioprospect. 2014, 4, 341–351. [Google Scholar] [CrossRef]
  10. Oberoi, H.S.; Rawat, R.; Chadha, B.S. Response surface optimization for enhanced production of cellulases with improved functional characteristics by newly isolated Aspergillus niger HN-2. Antonie van Leeuwenhoek J. Microbiol. 2014, 105, 119–134. [Google Scholar] [CrossRef]
  11. Zhang, H.; Sang, Q.; Zhang, W. Statistical optimization of cellulases production by Aspergillus niger HQ-1 in solid-state fermentation and partial enzymatic characterization of cellulases on hydrolyzing chitosan. Ann. Microbiol. 2012, 62, 629–645. [Google Scholar] [CrossRef]
  12. Perez-Pons, J.A.; Cayetano, A.; Rebordosa, X.; Lloberas, J.; Guasch, A.; Querol, E. A β-glucosidase gene (bgl3) from Streptomyces sp. strain QM-B814: Molecular cloning, nucleotide sequence, purification and characterization of the encoded enzyme, a new member of family 1 glycosyl hydrolases. Eur. J. Biochem. 1994, 223, 557–565. [Google Scholar] [CrossRef]
  13. Vallmitjana, M.; Ferrer-Navarro, M.; Planell, R.; Abel, M.; Ausín, C.; Querol, E.; Planas, A.; Pérez-Pons, J.A. Mechanism of the family 1 β-glucosidase from Streptomyces sp: Catalytic residues and kinetic studies. Biochemistry 2001, 40, 5975–5982. [Google Scholar] [CrossRef]
  14. Kumar, P.; Ryan, B.; Henehan, G. β-Glucosidase from Streptomyces griseus: Nanoparticle immobilisation and application to alkyl glucoside synthesis. Protein Expr. Purif. 2017, 132, 164–170. [Google Scholar] [CrossRef]
  15. Marini, G.; Luchese, M.D.; Argondizzo, A.P.C.; de Góes, A.C.M.A.; Galler, R.; Alves, T.L.M.; Medeiros, M.A.; Larentis, A.L. Experimental design approach in recombinant protein expression: Determining medium composition and induction conditions for expression of pneumolysin from Streptococcus pneumoniae in Escherichia coli and preliminary purification process. BMC Biotechnol. 2014, 14, 1. [Google Scholar] [CrossRef]
  16. Rosano, G.L.; Ceccarelli, E.A. Recombinant protein expression in Escherichia coli: Advances and challenges. Front. Microbiol. 2014, 5, 1–17. [Google Scholar] [CrossRef]
  17. De Giuseppe, P.O.; Souza, T.D.A.; Souza, F.H.M.; Zanphorlin, L.M.; Machado, C.B.; Ward, R.J.; Jorge, J.A.; Furriel, R.D.P.M.; Murakami, M.T. Structural basis for glucose tolerance in GH1 β-glucosidases. Acta Crystallogr. Sect. D Biol. Crystallogr. 2014, 70, 1631–1639. [Google Scholar] [CrossRef]
  18. Souza, F.H.M.; Meleiro, L.P.; Machado, C.B.; Zimbardi, A.L.R.L.; Maldonado, R.F.; Souza, T.A.C.B.; Masui, D.C.; Murakami, M.T.; Jorge, J.A.; Ward, R.J.; et al. Gene cloning, expression and biochemical characterization of a glucose- and xylose-stimulated β-glucosidase from Humicola insolens RP86. J. Mol. Catal. B Enzym. 2014, 106, 1–10. [Google Scholar] [CrossRef]
  19. Mallerman, J.; Papinutti, L.; Levin, L. Characterization of β-Glucosidase produced by the white rot fungus Flammulina velutipes. J. Microbiol. Biotechnol. 2015, 25, 57–65. [Google Scholar] [CrossRef]
  20. Damasceno, L.M.; Pla, I.; Chang, H.J.; Cohen, L.; Ritter, G.; Old, L.J.; Batt, C.A. An optimized fermentation process for high-level production of a single-chain Fv antibody fragment in Pichia pastoris. Protein Expr Purif. 2004, 37, 18–26. [Google Scholar] [CrossRef]
  21. Behera, S.K.; Meena, H.; Chakraborty, S.; Meikap, B.C. Application of response surface methodology (RSM) for optimization of leaching parameters for ash reduction from low-grade coal. Int. J. Min. Sci. Technol. 2018, 28, 621–629. [Google Scholar] [CrossRef]
  22. Prabhu, A.A.; Mandal, B.; Dasu, V.V. Medium optimization for high yield production of extracellular human interferon-γ from Pichia pastoris: A statistical optimization and neural network-based approach. Korean J. Chem. Eng. 2017, 34, 1109–1121. [Google Scholar] [CrossRef]
  23. Thadathil, N.; Kuttappan, A.K.P.; Vallabaipatel, E.; Kandasamy, M.; Velappan, S.P. Statistical optimization of solid state fermentation conditions for the enhanced production of thermoactive chitinases by mesophilic soil fungi using response surface methodology and their application in the reclamation of shrimp processing by-products. Ann. Microbiol. 2014, 64, 671–681. [Google Scholar] [CrossRef]
  24. Tavakkoli, M.; Hamidi-Esfahani, Z.; Azizi, M.H. Optimization of Corynebacterium glutamicum Glutamic Acid Production by Response Surface Methodology. Food Bioprocess Technol. 2012, 5, 92–99. [Google Scholar] [CrossRef]
  25. Khoshayand, F.; Goodarzi, S.; Shahverdi, A.R.; Khoshayand, M.R. Optimization of Culture Conditions for Fermentation of Soymilk Using Lactobacillus casei by Response Surface Methodology. Probiotics AntiMicrob. Proteins 2011, 3, 159–167. [Google Scholar] [CrossRef]
  26. Ullah, R.; Shah, M.A.; Tufail, S.; Ismat, F.; Imran, M.; Iqbal, M.; Mirza, O.; Rhaman, M. Correction: Activity of the human rhinovirus 3C protease studied in various buffers, additives and detergents solutions for recombinant protein production. PLoS ONE 2016, 11, 1–13. [Google Scholar] [CrossRef]
  27. Lämmli, U.K. Cleavage of Structural Proteins during the Assembly of the Head of Bacteriophage T4. Nature 1970, 227, 680–685. [Google Scholar] [CrossRef]
  28. Bradford, M.M. A rapid and sensitive method for the quantitation of microgram quantities of protein utilizing the principle of protein-dye binding. Anal. Biochem. 1976, 72, 248–254. [Google Scholar] [CrossRef]
  29. Dar, A.H.; Wani, M.G. Determination of enzyme activity of acid phosphatase through standard curve of Para-nitrophenol. Int. J. Sci. Eng. Technol. Res. 2016, 5, 196–202. [Google Scholar]
  30. Bhoite, R.N.; Navya, P.N.; Murthy, S.T. Statistical optimization, partial purification, and characterization of coffee pulp β-glucosidase and its application in ethanol production. Food Sci. Biotechnol. 2013, 681, 151–175. [Google Scholar] [CrossRef]
  31. Wahid, Z.; Nadir, N. Improvement of one factor at a time through design of experiments. World Appl. Sci. J. 2013, 21, 56–61. [Google Scholar]
  32. Wass, J. First Steps in Experimental Design–The Screening Experiment. J. Valid. Technol. 2010, 16, 49–57. [Google Scholar]
  33. Dhake, A.B.; Patil, M.B. Production of β-glucosidase by Penicillium purpurogenum. Braz. J. Microbiol. 2005, 36, 170–176. [Google Scholar] [CrossRef]
  34. El-Batal, A.I.; El-Sayyad, G.S.; El-Ghamery, A.; Gobara, M. Response Surface Methodology Optimization of Melanin Production by Streptomyces cyaneus and Synthesis of Copper Oxide Nanoparticles Using Gamma Radiation. J. Clust Sci. 2016, 28, 1083–1112. [Google Scholar] [CrossRef]
  35. Kiruthika, P. Angayarkanni, J. Production and optimization of melanin pigment from Streptomyces sp. BI 244. Int. J. Adv. Interdiscip. Res. 2015, 2, 1–5. [Google Scholar]
  36. Mahajan, P.M.; Gokhale, S.V.; Lele, S.S. Production of Nattokinase Using Bacillus natto NRRL 3666: Media optimization, scale Up, and kinetic modeling. Food Sci. Biotechnol. 2010, 19, 1593–1603. [Google Scholar] [CrossRef]
  37. Riccio, P.; Rossano, R.; Vinella, M.; Domizio, P.; Zito, F.; Sansevrino, F. Extraction and immobilization in one step of two β-glucosidases released from a yeast strain of Debaryomyces hansenii. Enzym. Microb. Technol. 1999, 24, 123–129. [Google Scholar] [CrossRef]
  38. Riou, C.; Salmon, J.M.; Vallier, M.J.; Günata, Z.; Barre, P. Purification, characterization, and substrate specificity of a novel highly glucose-tolerant beta-glucosidase from Aspergillus oryzae. Appl. Environ. Microbiol. 1998, 64, 3607–3614. [Google Scholar]
  39. De Eugenio, L.I.; Méndez-Líter, J.A.; Nieto-Domínguez, M.; Alonso, L.; Gil-Muñoz, J.; Barriuso, J.; Prieto, A.; Martínez, M.J. Differential β-glucosidase expression as a function of carbon source availability in Talaromyces amestolkiae: A genomic and proteomic approach. Biotechnol. Biofuels 2017, 10, 1–14. [Google Scholar] [CrossRef]
  40. El-Naggar, N.E.A.; Moawad, H.; Abdelwahed, N.A.M. Optimization of fermentation conditions for enhancing extracellular production of L-asparaginase, an anti-leukemic agent, by newly isolated Streptomyces brollosae NEAE-115 using solid state fermentation. Ann. Microbiol. 2017, 67, 1–15. [Google Scholar] [CrossRef]
  41. Rajasree, K.P.; Mathew, G.M.; Pandey, A.; Sukumaran, R.K. Highly glucose tolerant β-glucosidase from Aspergillus unguis: NII 08123 for enhanced hydrolysis of biomass. J. Ind. Microbiol. Biotechnol. 2013, 40, 967–975. [Google Scholar] [CrossRef]
  42. Klöckner, W.; Büchs, J. Advances in shaking technologies. Trends Biotechnol. 2012, 30, 307–314. [Google Scholar]
  43. Routledge, S.J.; Hewitt, C.J.; Bora, N.; Bill, R.M. Antifoam addition to shake flask cultures of recombinant Pichia pastoris increases yield. Microb. Cell Factories 2011, 10, 17. [Google Scholar] [CrossRef]
  44. Bhataya, A.; Schmidt-Dannert, C.; Lee, P.C. Metabolic engineering of Pichia pastoris X-33 for lycopene production. Process Biochem. 2009, 44, 1095–1102. [Google Scholar] [CrossRef]
  45. Villatte, F.; Hussein, A.S.; Bachmann, T.T.; Schmid, R.D. Expression level of heterologous proteins in Pichia pastoris is influenced by flask design. Appl. Microbiol. Biotechnol. 2001, 55, 463–465. [Google Scholar] [CrossRef]
  46. Almeida, J.M.; Lima, V.A.; Giloni-Lima, P.C.; Knob, A. Passion fruit peel as novel substrate for enhanced β-glucosidases production by Penicillium verruculosum: Potential of the crude extract for biomass hydrolysis. Biomass Bioenergy 2015, 72, 216–226. [Google Scholar] [CrossRef]
  47. Daroit, D.J.; Simonetti, A.; Hertz, P.F.; Brandelli, A. Purification and characterization of an extracellular beta-glucosidase from Monascus purpureus. J. Microbiol. Biotechnol. 2008, 18, 933–941. [Google Scholar]
  48. Joshi, S.; Satyanarayana, T. Optimization of heterologous expression of the phytase (PPHY) of Pichia anomala in P. pastoris and its applicability in fractionating allergenic glycinin from soy protein. J. Ind. Microbiol. Biotechnol. 2014, 41, 977–987. [Google Scholar] [CrossRef]
  49. Mohammadi, H.S.; Mostafavi, S.S.; Soleimanib, S.; Bozorgian, S.; Pooraskari, M.; Kianmehr, A. Response surface methodology to optimize partition and purification of two recombinant oxidoreductase enzymes, glucose dehydrogenase and D-galactose dehydrogenase in aqueous two-phase systems. Protein Expr Purif. 2015, 108, 41–47. [Google Scholar] [CrossRef]
  50. Halmi, M.I.E.; Abdullah, S.R.S.; Wasoh, H.; Johari, W.L.W.; Ali, M.S.; Shaharuddin, N.A.; Shukor, M.Y. Optimization and maximization of hexavalent molybdenum reduction to Mo-blue by Serratia sp. strain MIE2 using response surface methodology. Rend. Lincei 2016, 27, 697–709. [Google Scholar] [CrossRef]
  51. Li, D.; Fu, X.; Kim, S.M. Production of chum salmon cystatin from the recombinant Saccharomyces cerevisiae optimized using response surface methodology. Biotechnol. Bioprocess Eng. 2010, 15, 314–323. [Google Scholar] [CrossRef]
  52. Ariffin, H.; Abdullah, N.; Kalsom, M.S.U.; Shirai, Y.; Hassan, M.A. Production and characterisation of cellulase by bacillus pumilus EB3. Int. J. Eng. Technol. 2006, 3, 47–53. [Google Scholar]
  53. Okamoto, K.; Nakano, H.; Yatake, T.; Kiso, T. Purification and Some Properties of a β-Glucosidase from Flavobacterium johnsonae. Biosci. Biotechnol. Biochem. 2014, 64, 333–340. [Google Scholar] [CrossRef]
  54. Michlmayr, H.; Schümann, C.; Barreira Braz Da Silva, N.M.; Kulbe, K.D.; Del Hierro, A.M. Isolation and basic characterization of a β-glucosidase from a strain of Lactobacillus brevis isolated from a malolactic starter culture. J. Appl. Microbiol. 2010, 108, 550–559. [Google Scholar] [CrossRef]
  55. Kim, Y.; Lee, J.; Hong, M.; Kim, Y.; Park, C.; Lee, J.; Oh, D. Characterization of a recombinant β-glucosidase from the thermophilic bacterium Caldicellulosiruptor saccharolyticus Characterization of a recombinant β-glucosidase from the thermophilic bacterium Caldicellulosiruptor saccharolyticus. J. Biosci. Bioeng. 2009, 108, 36–40. [Google Scholar]
  56. Pei, J.; Pang, Q.; Zhao, L.; Fan, S.; Shi, H. Thermoanaerobacterium thermosaccharolyticum β-glucosidase: A glucose-tolerant enzyme with high specific activity for cellobiose. Biotechnol. Biofuels 2012, 5, 1–10. [Google Scholar] [CrossRef]
  57. Chen, T.; Yang, W.; Guo, Y.; Yuan, R.; Xu, L.; Yan, Y. Enhancing catalytic performance of β-glucosidase via immobilization on metal ions chelated magnetic nanoparticles. Enzym. Microb. Technol. 2014, 63, 50–57. [Google Scholar] [CrossRef]
  58. Shipkowski, S.; Brenchley, J.E. Characterization of an unusual cold-active β-glucosidase belonging to family 3 of the glycoside hydrolases from the psychrophilic isolate Paenibacillus sp. strain C7. Appl. Environ. Microbiol. 2005, 71, 4225–4232. [Google Scholar] [CrossRef]
  59. Chen, W.; Yang, Y.; Guo, G.; Chen, C.; Huang, Y. β-Glucosidase in a Yarrowia lipolytica Transformant to Degrade Soybean Isoflavones. Catalysts 2018, 8, 25. [Google Scholar] [CrossRef]
  60. Olajuyigbe, F.M.; Nlekerem, C.M.; Ogunyewo, O.A. Production and Characterization of Highly Thermostable β-Glucosidase during the Biodegradation of Methyl Cellulose by Fusarium oxysporum. Biochem. Res. Int. 2016, 2016, 1–8. [Google Scholar] [CrossRef]
  61. Choi, J.Y.; Park, A.R.; Kim, Y.J.; Kim, J.J.; Cha, C.J.; Yoon, J.J. Purification and characterization of an extracellular β-glucosidase produced by phoma sp. KCTC11825BP isolated from rotten mandarin peel. J. Microbiol. Biotechnol. 2011, 21, 503–508. [Google Scholar] [CrossRef]
  62. Abdel-Naby, M.A.; Osman, M.Y.; Abdel-Fattah, A.F. Purification and properties of three cellobiases from Aspergillus niger A20. Appl. Biochem. Biotechnol. 1999, 76, 33–44. [Google Scholar] [CrossRef]
  63. Kaur, J.; Chadha, B.S.; Kumar, B.A.; Kaur, G.S.; Saini, H.S. Purification and characterization of β-glucosidase from Melanocarpus sp. MTCC 3922. Electron. J. Biotechnol. 2007, 10, 260–270. [Google Scholar] [CrossRef]
  64. Kengen, S.W.M.; Luesink, E.J.; Stams, A.J.M.; Zehnder, A.J.B. Purification and characterization of an extremely thermostable β-glucosidase from the hyperthermophilic archaeon Pyrococcus furiosus. Eur. J. Biochem. 1993, 213, 305–312. [Google Scholar] [CrossRef]
  65. Parry, N.J.; Beever, D.E.; Owen, E.; Vandenberghe, I.; Van Beeumen, J.; Bhat, M.K. Biochemical characterization and mechanism of action of a thermostable β-glucosidase purified from Thermoascus aurantiacus. Biochem. J. 2001, 353, 117–127. [Google Scholar] [CrossRef]
  66. Saha, B.C.; Freer, S.N.; Bothast, R.J. Production, Purification, and Properties of a Thermostable β-glucosidase from a Color Variant Strain of Aureobasidium pullulans. Appl. Environ. Microbiol. 1994, 60, 3774–3780. [Google Scholar]
  67. Liu, D.; Zhang, R.; Yang, X.; Zhang, Z.; Song, S.; Miao, Y. Characterization of a thermostable β-glucosidase from Aspergillus fumigatus Z5, and its functional expression in Pichia pastoris X33. Microb. Cell Factories 2012, 11, 25. [Google Scholar] [CrossRef]
  68. Amouri, B.; Gargouri, A. Characterization of a novel β-glucosidase from a Stachybotrys strain. Biochem. Eng. J. 2006, 32, 191–197. [Google Scholar] [CrossRef]
  69. Kalyani, D.; Lee, K.M.; Tiwari, M.K.; Ramachandran, P.; Kim, H.; Kim, I.W. Characterization of a recombinant aryl β-glucosidase from Neosartorya fischeri NRRL181. Appl. Microbiol. Biotechnol. 2012, 94, 413–423. [Google Scholar] [CrossRef]
  70. Narasimha, G.; Sridevi, A.; Ramanjaneyulu, G.; Rajasekhar Reddy, B. Purification and Characterization of β-Glucosidase from Aspergillus Niger. Int. J. Food Prop. 2016, 19, 652–661. [Google Scholar] [CrossRef]
  71. Okamoto, K.; Sugita, Y.; Nishikori, N.; Nitta, Y.; Yanase, H. Characterization of two acidic β-glucosidases and ethanol fermentation in the brown rot fungus Fomitopsis palustris. Enzym. Microb. Technol. 2011, 48, 359–364. [Google Scholar] [CrossRef]
  72. Wołosowska, S.; Synowiecki, J. Thermostable β-glucosidase with a broad substrate specifity suitable for processing of lactose-containing products. Food Chem. 2004, 85, 181–187. [Google Scholar] [CrossRef]
Figure 1. The effect of various carbon (a) and nitrogen (b) sources on S. griseus recombinant β-glucosidase expression. Recombinant β-glucosidase was expressed by supplementing basal medium with 0.5% (w/v) and 1% (w/v) of different carbon and nitrogen sources, respectively. The control was performed using only basal medium. In each case, cells were grown until OD600 nm reached 0.5, and then induced with 1 mM IPTG for 6 h at 37 °C, 220 rpm. Enzyme activity of crude lysate was performed using 7 mM pNPG as the substrate in 50 mM potassium phosphate buffer, pH 7 (see Section 2.2.2). The data plotted represent the mean of three independent experiments, with standard deviation shown as error bars: * p-value ≤ 0.05, ** p-value ≤ 0.01 represent a significant and a very significant difference, respectively, based on two-tailed t-test and in comparison to the control.
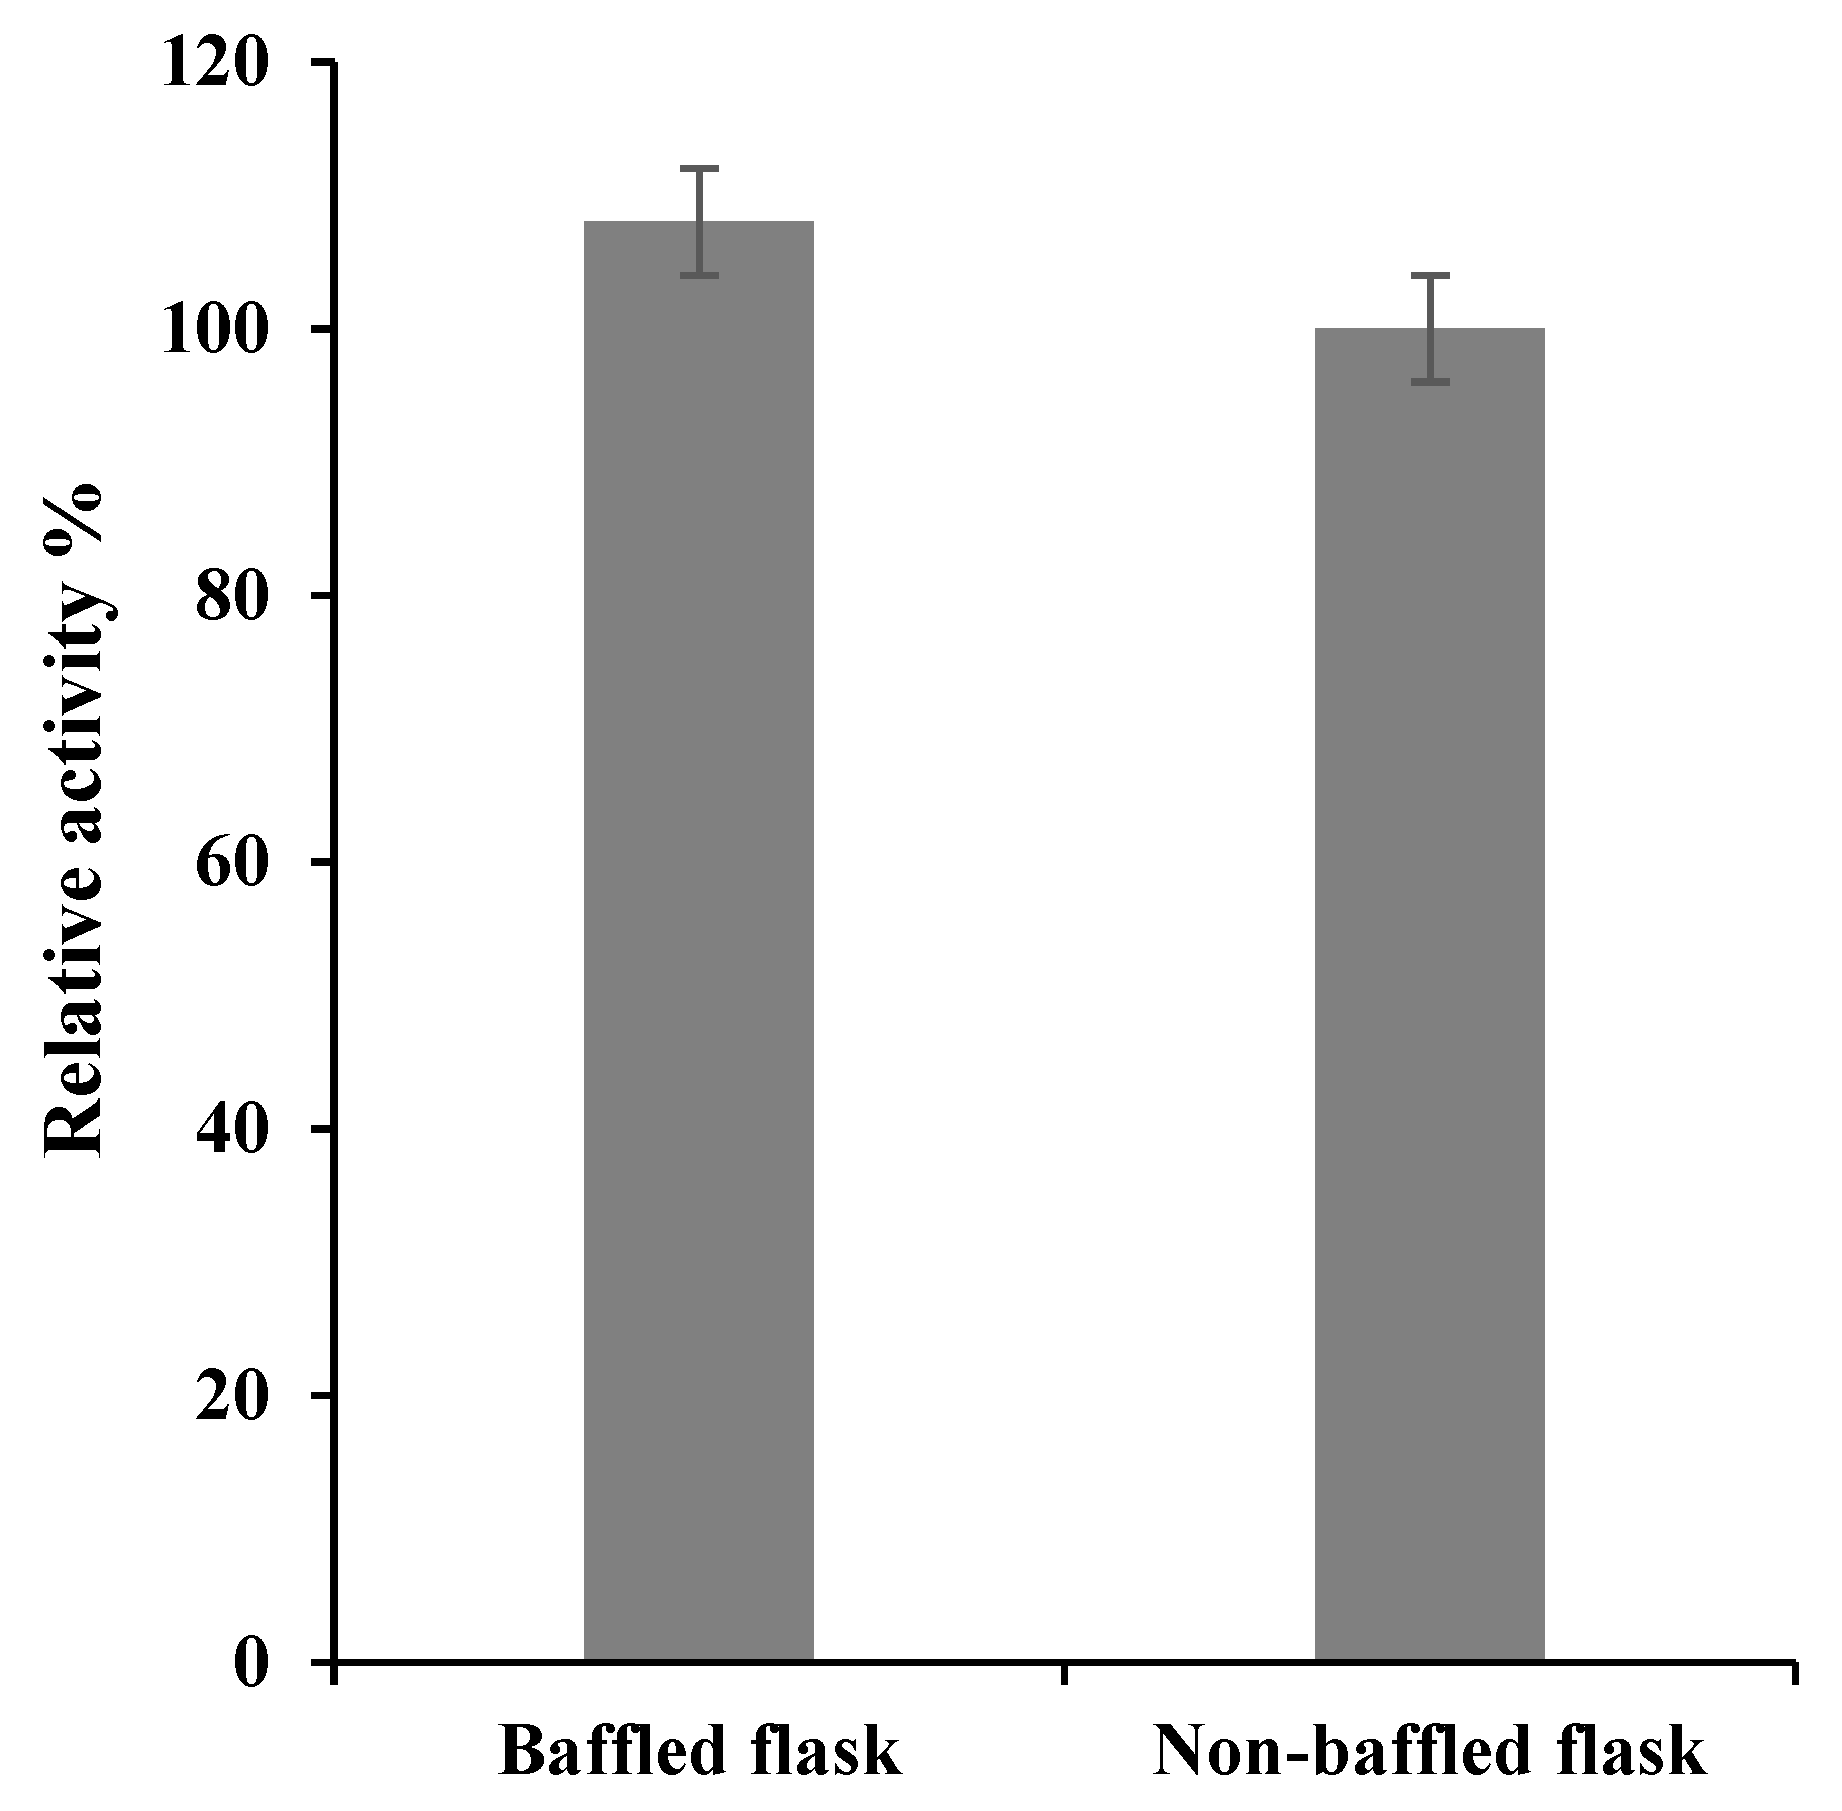
Bioengineering 06 00061 g001
Figure 2. The effect of baffled versus non-baffled flask on the production of S. griseus recombinant β-glucosidase. Recombinant β-glucosidase was expressed in basal medium supplemented with 0.5% (w/v) fructose, 1% (w/v) yeast extract and tryptone at 37 °C for 6 h, following 1 mM IPTG induction. Enzyme activity was used as a proxy to enzyme production. The data represented are the mean of three independent experiments, with the standard deviations noted as error bars. Both baffled and non-baffled flasks show no significant difference between them (p-value ≥ 0.235) based on two-tailed t-test.
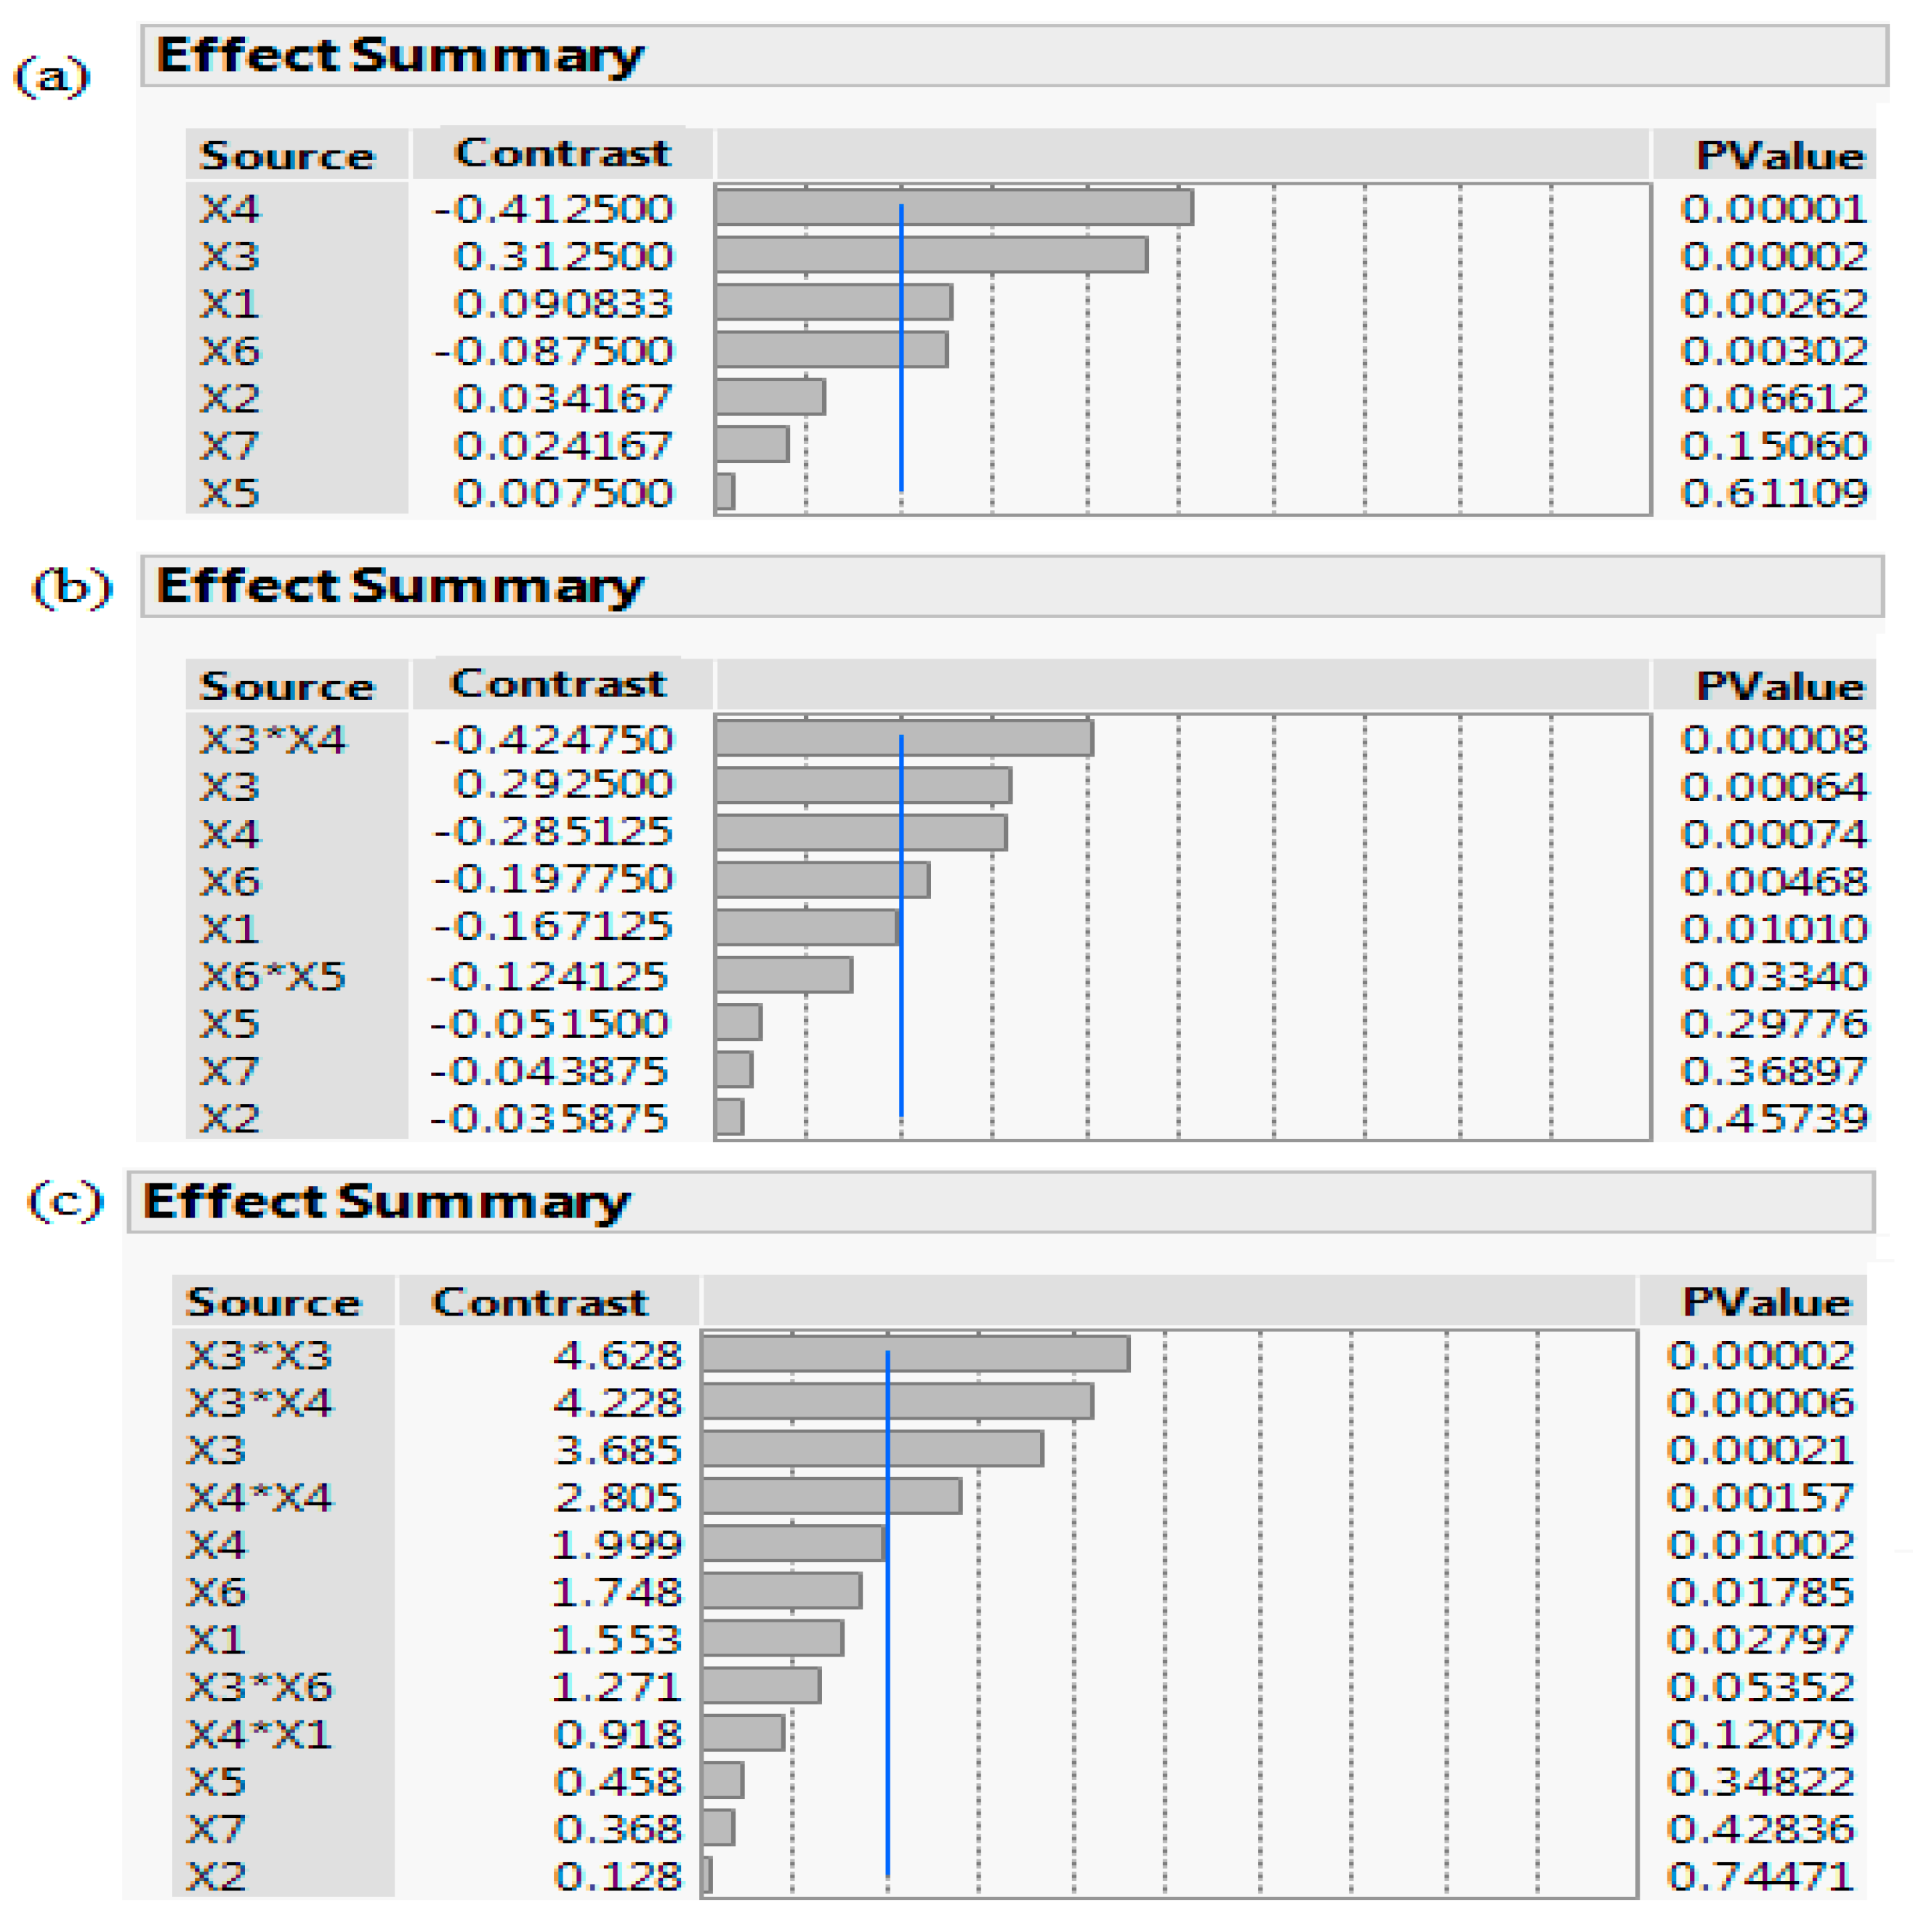
Bioengineering 06 00061 g002
Figure 3. A pareto chart of the screening processes: (a) PBD, (b) FFD, and (c) DSD. The schematic depicts a scaled summary and corresponding p-value of the seven factors: OD (Abs600 nm) at induction time (X1), IPTG (X2), temperature (X3), incubation time (X4), yeast extract (X5), tryptone (X6), fructose (X7), along with their interactions. Factors with p-value < 0.05 are statistically significant and variables crossing the reference blue line with p-value < 0.001 are considered as highly statistically significant.
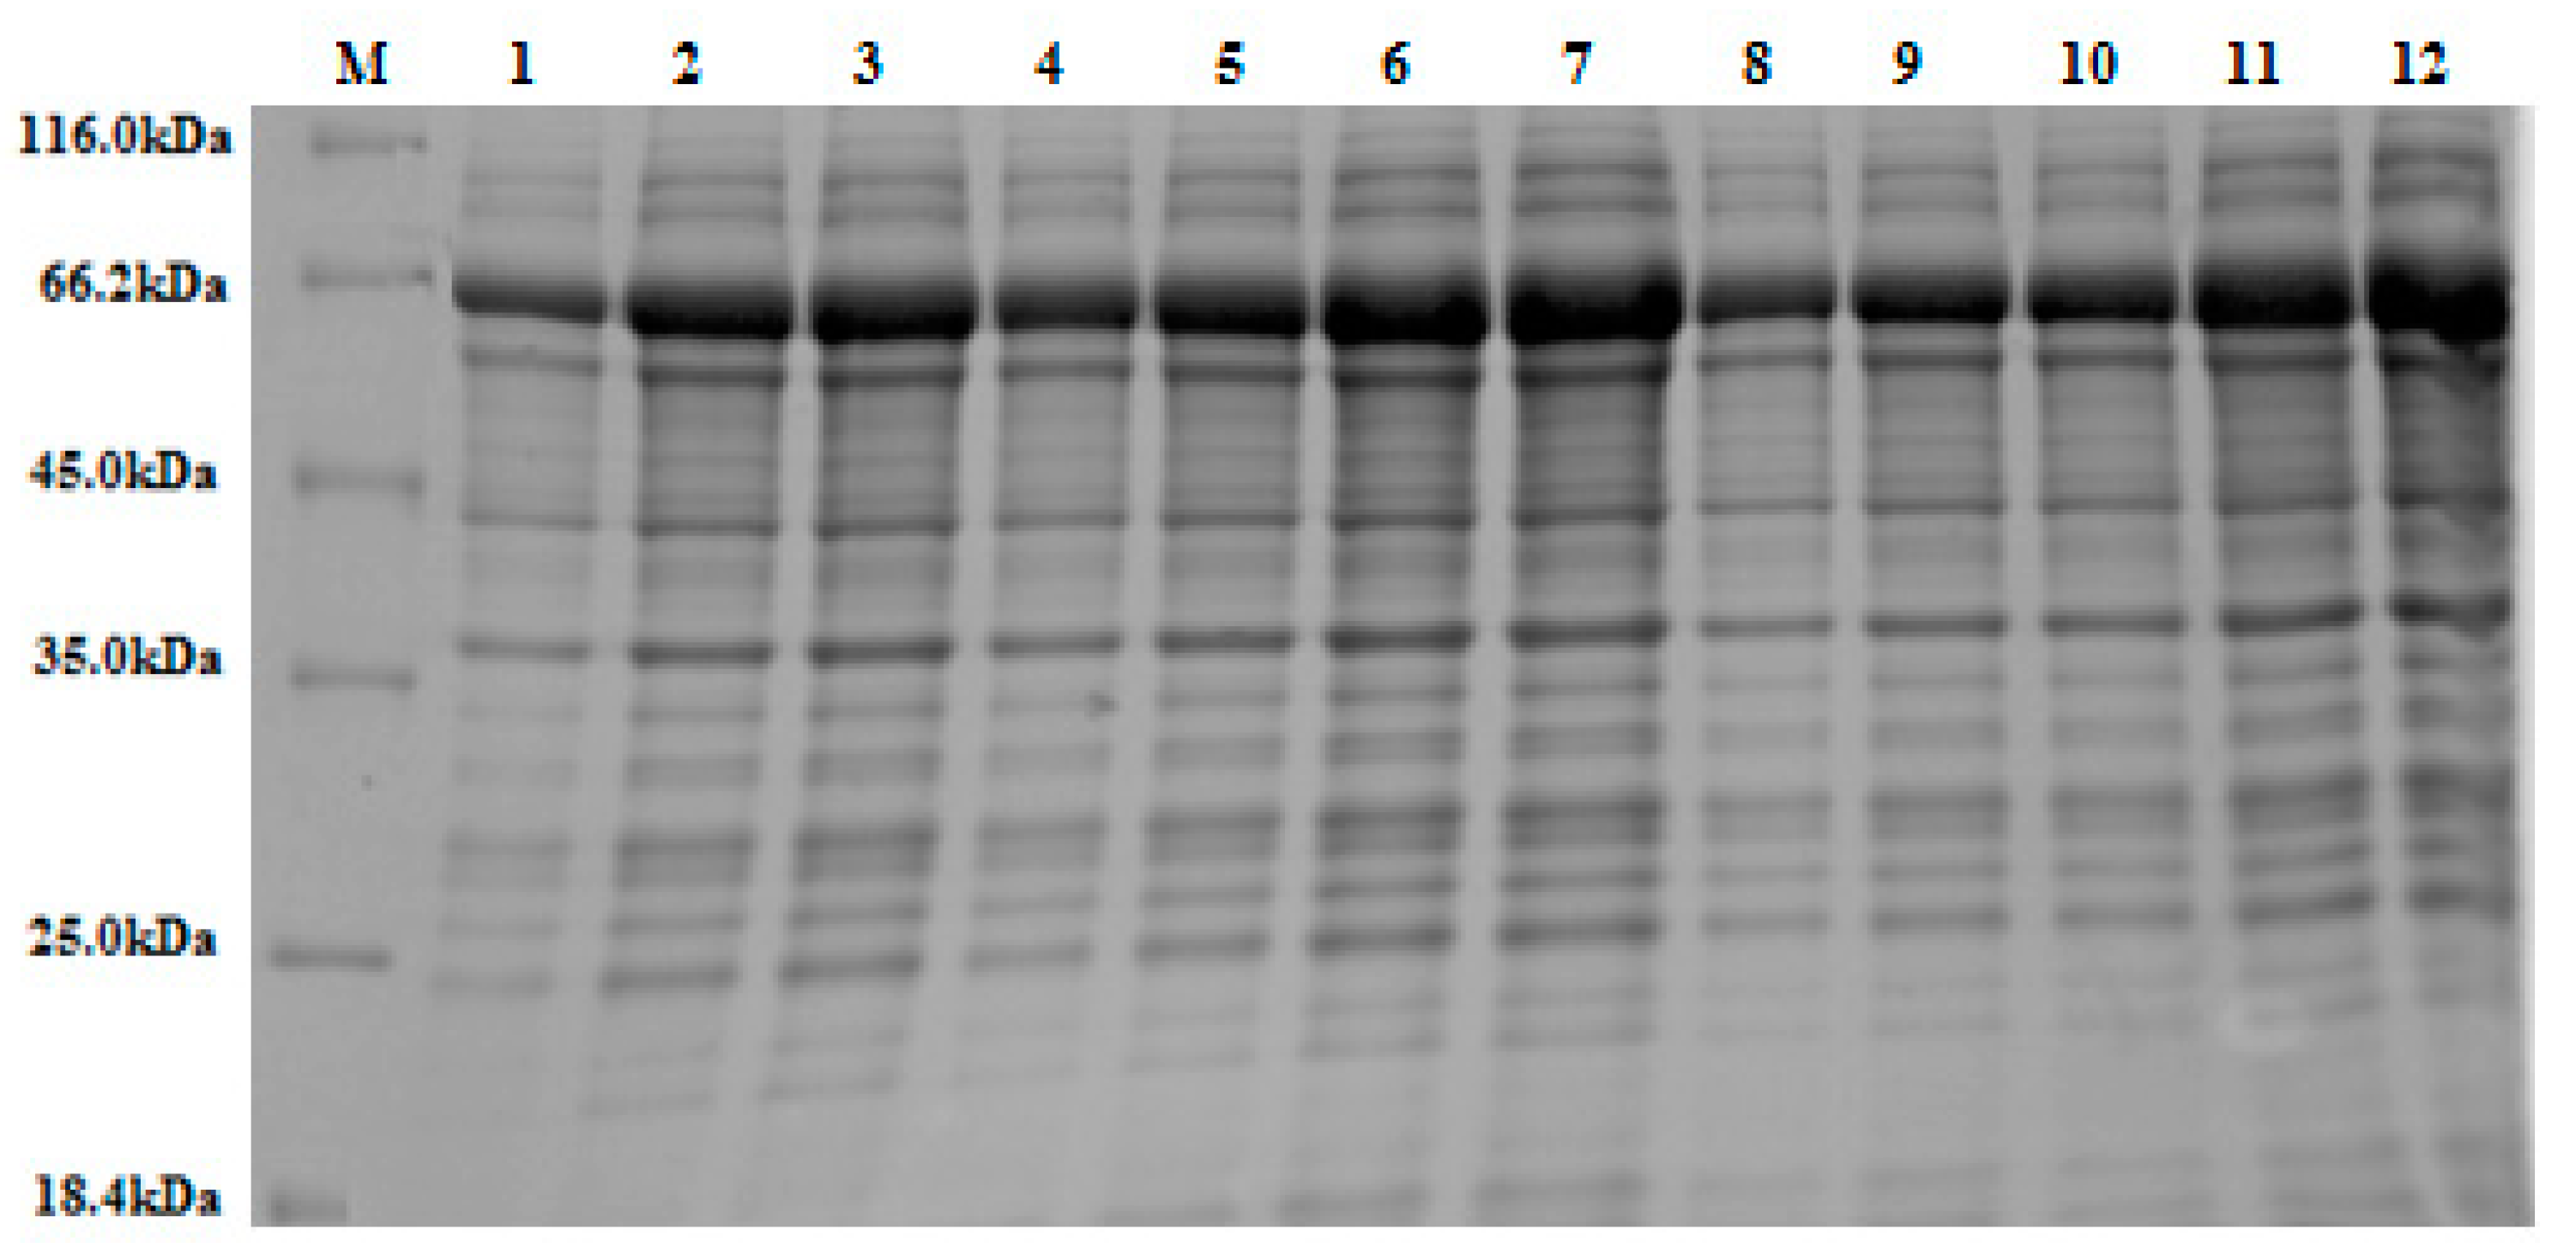
Bioengineering 06 00061 g003
Figure 4. A 10% (w/v) SDS-PAGE stained with Coomassie Brilliant Blue. The figure depicts various band sizes of crude β-glucosidase expressed in accordance with the 12 experimental runs, according to Plackett-Burman Design (see Section 2.2.4). An equal volume of crude extract (15 μL) was loaded into each lane. Lanes 2, 3, 6, 10, 11, and 12 display larger over-expressed protein bands at the expected molecular weight for the recombinant β-glucosidase/GST fusion protein (~65 kDa), as based on ImageJ densitometric analysis. This result mirrors the increased enzyme activity (U/mL) observed in these experimental runs (see Table 2). Note: M = protein marker (14.4–116 kDa).
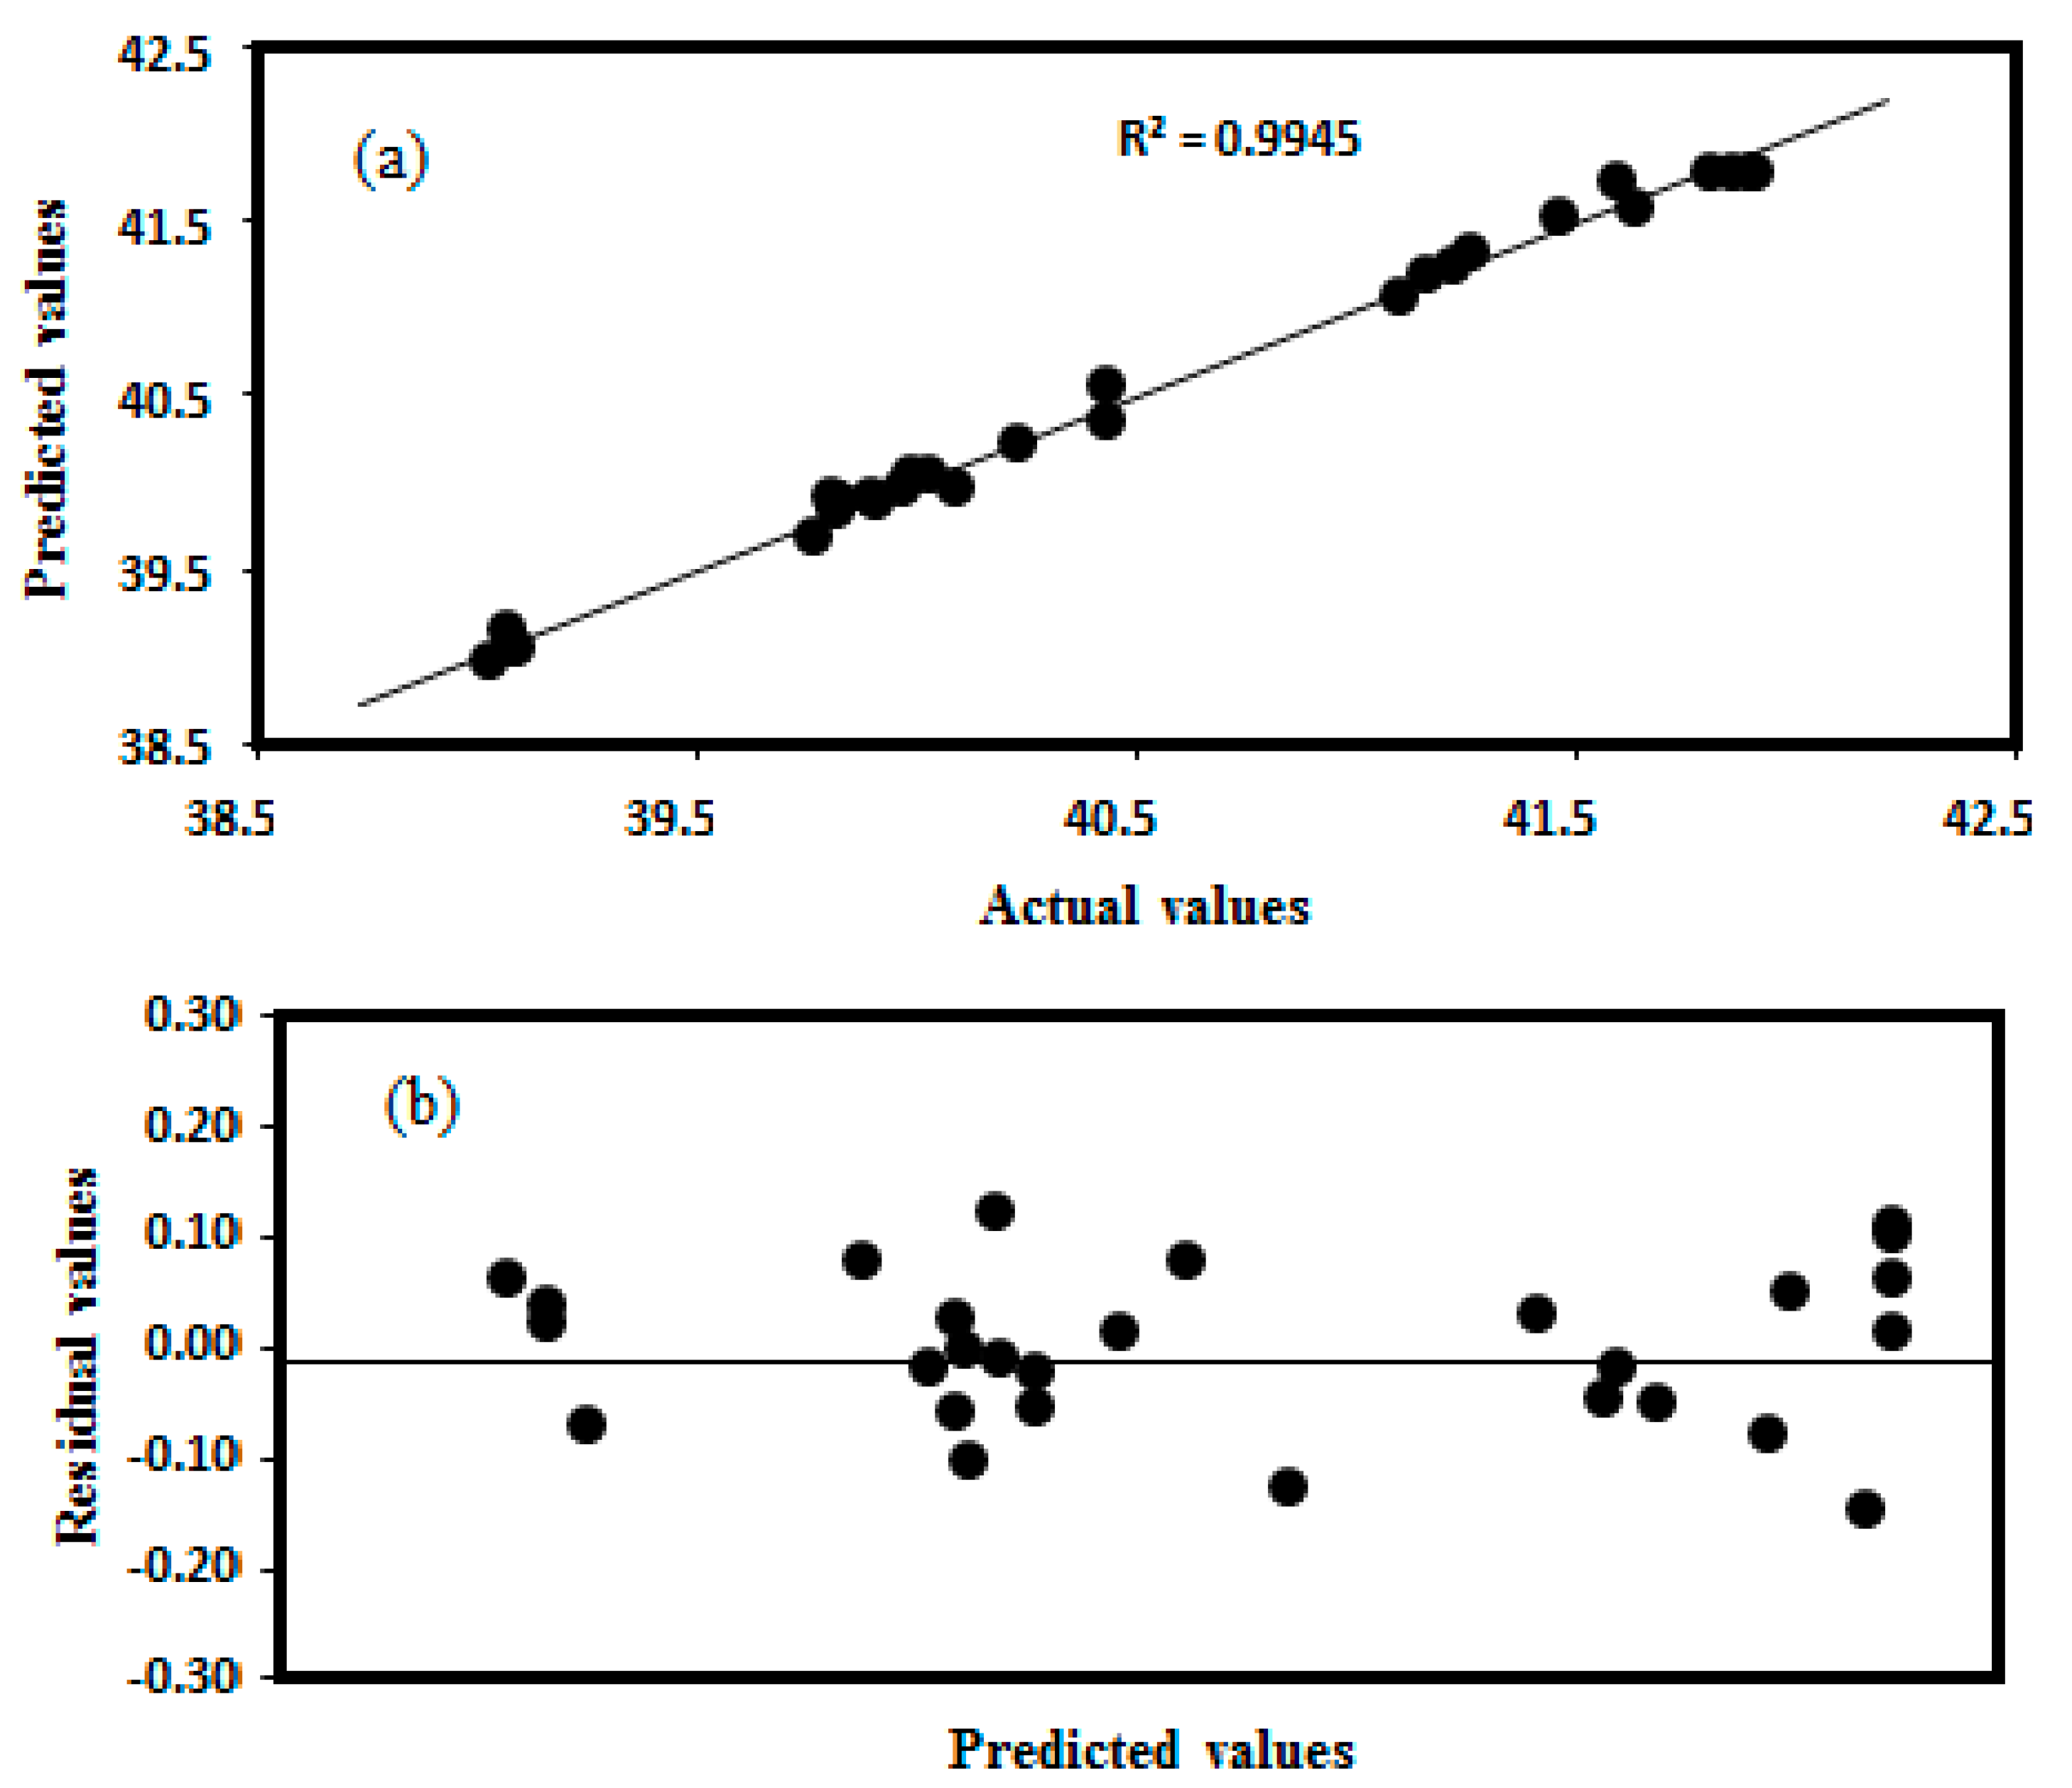
Bioengineering 06 00061 g004
Figure 5. A plot of (a) actual versus predicted, and (b) predicted versus residual values to estimate the accuracy of the regression model.
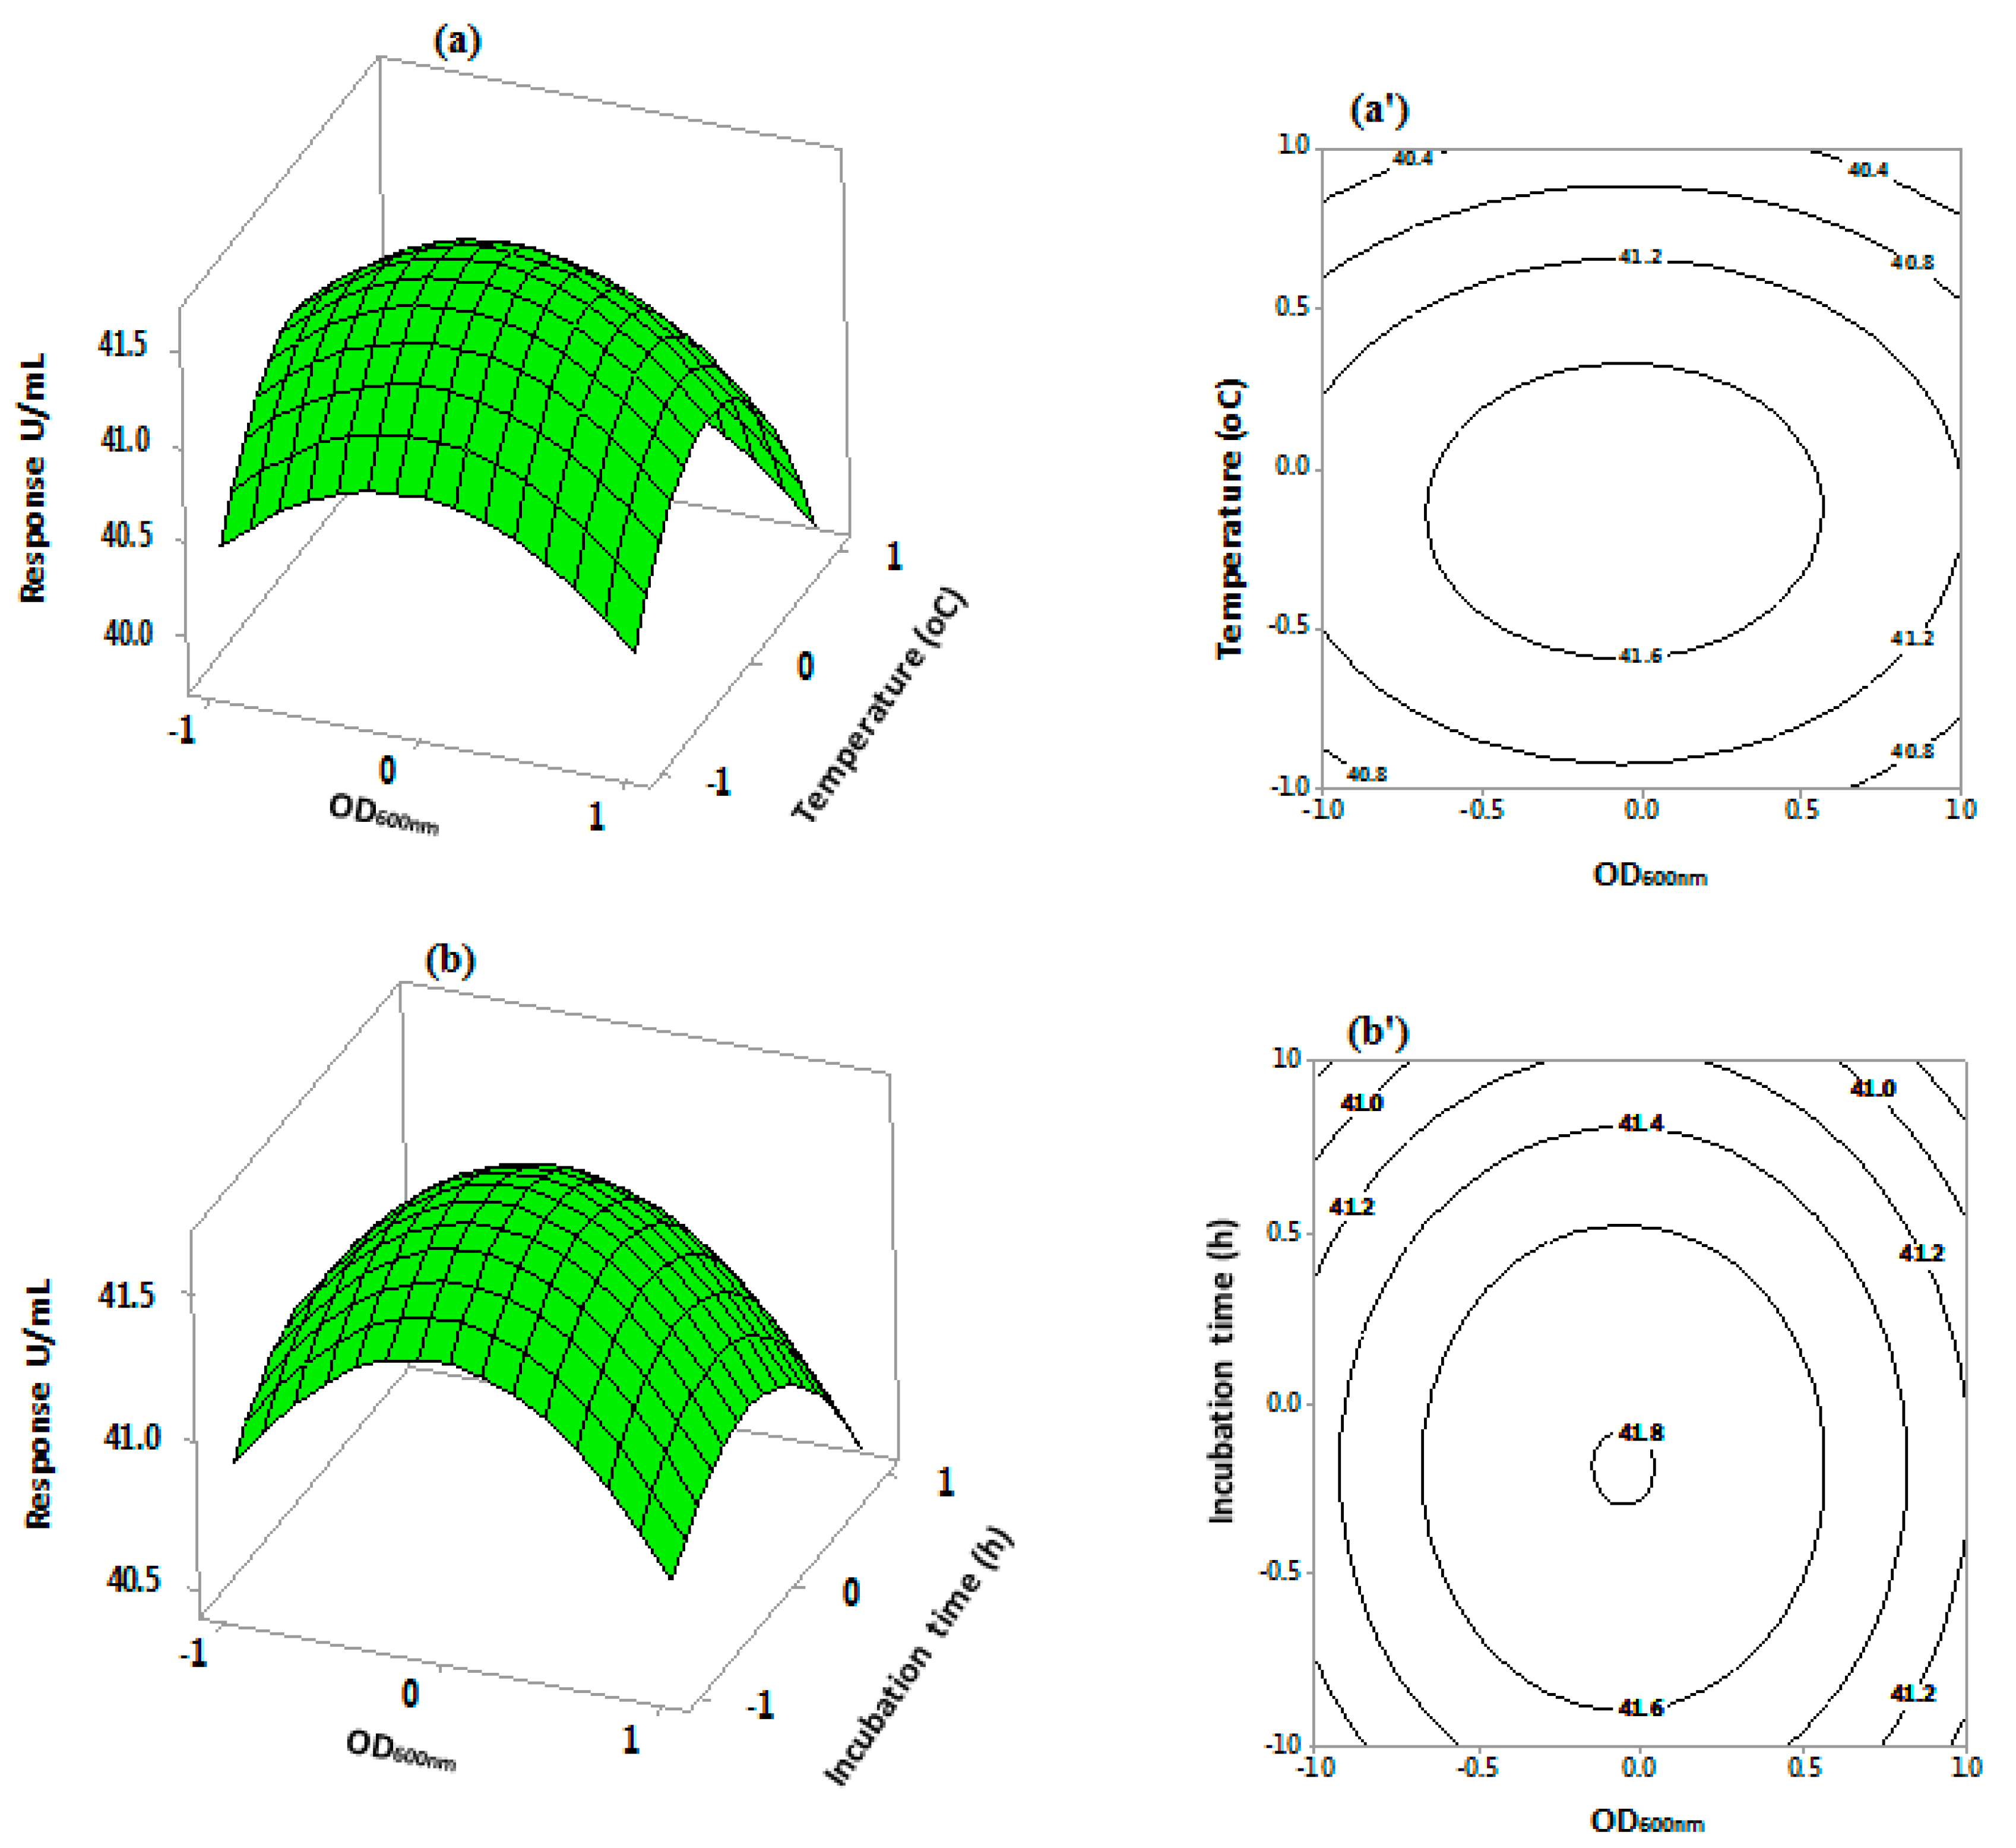
Bioengineering 06 00061 g005
Figure 6. Three-dimensional response surface and contour plots for S.griseus recombinant β-glucosidase production using a three level Central Composite Design. The plots depict the interactive effects of: OD600 nm and temperature (a,a’); OD600 nm and incubation time (b,b’); temperature and incubation time (c,c’); and temperature and tryptone (d,d’). The remaining variables remained at constant zero levels.
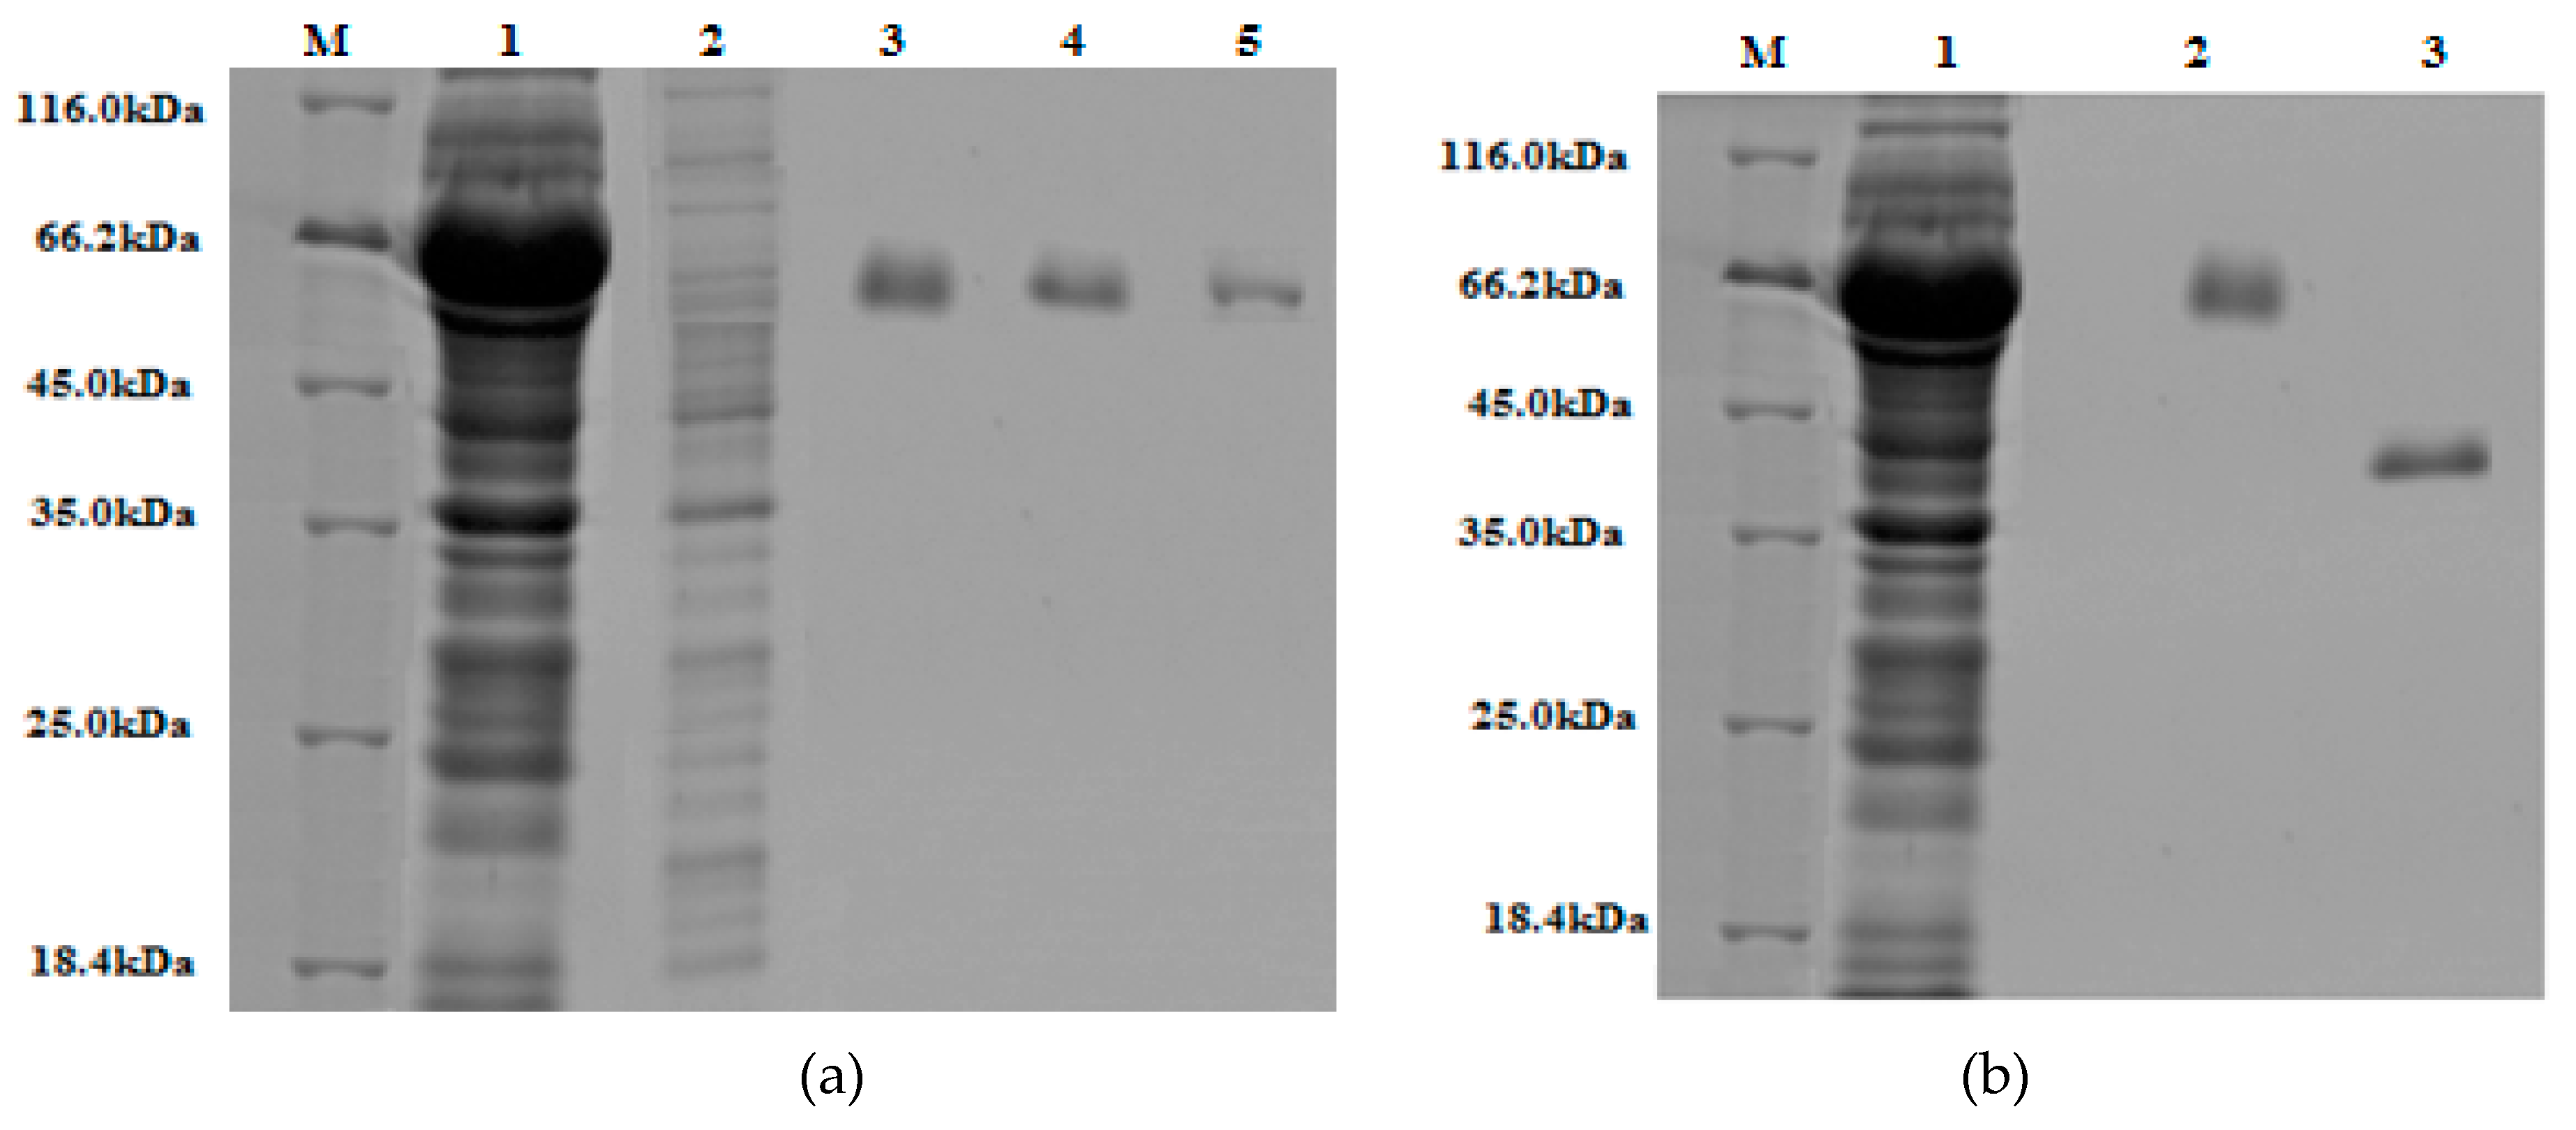
Bioengineering 06 00061 g006aBioengineering 06 00061 g006b
Figure 7. The 10% (w/v) SDS-PAGE gels stained with Coomassie Brilliant Blue: (a) Lane M, protein marker (18.4–116 kDa); lane 1, crude extract; lane 2, run-through; lane 3, 4, 5, are elute one, two, and three of purified GST-tagged β-glucosidase, respectively. (b) Lane M, protein marker (18.4–116 kDa); lane 1, crude extract; lane 2, purified GST-tagged β-glucosidase; lane 3, purified β-glucosidase (post GST-tag cleavage).
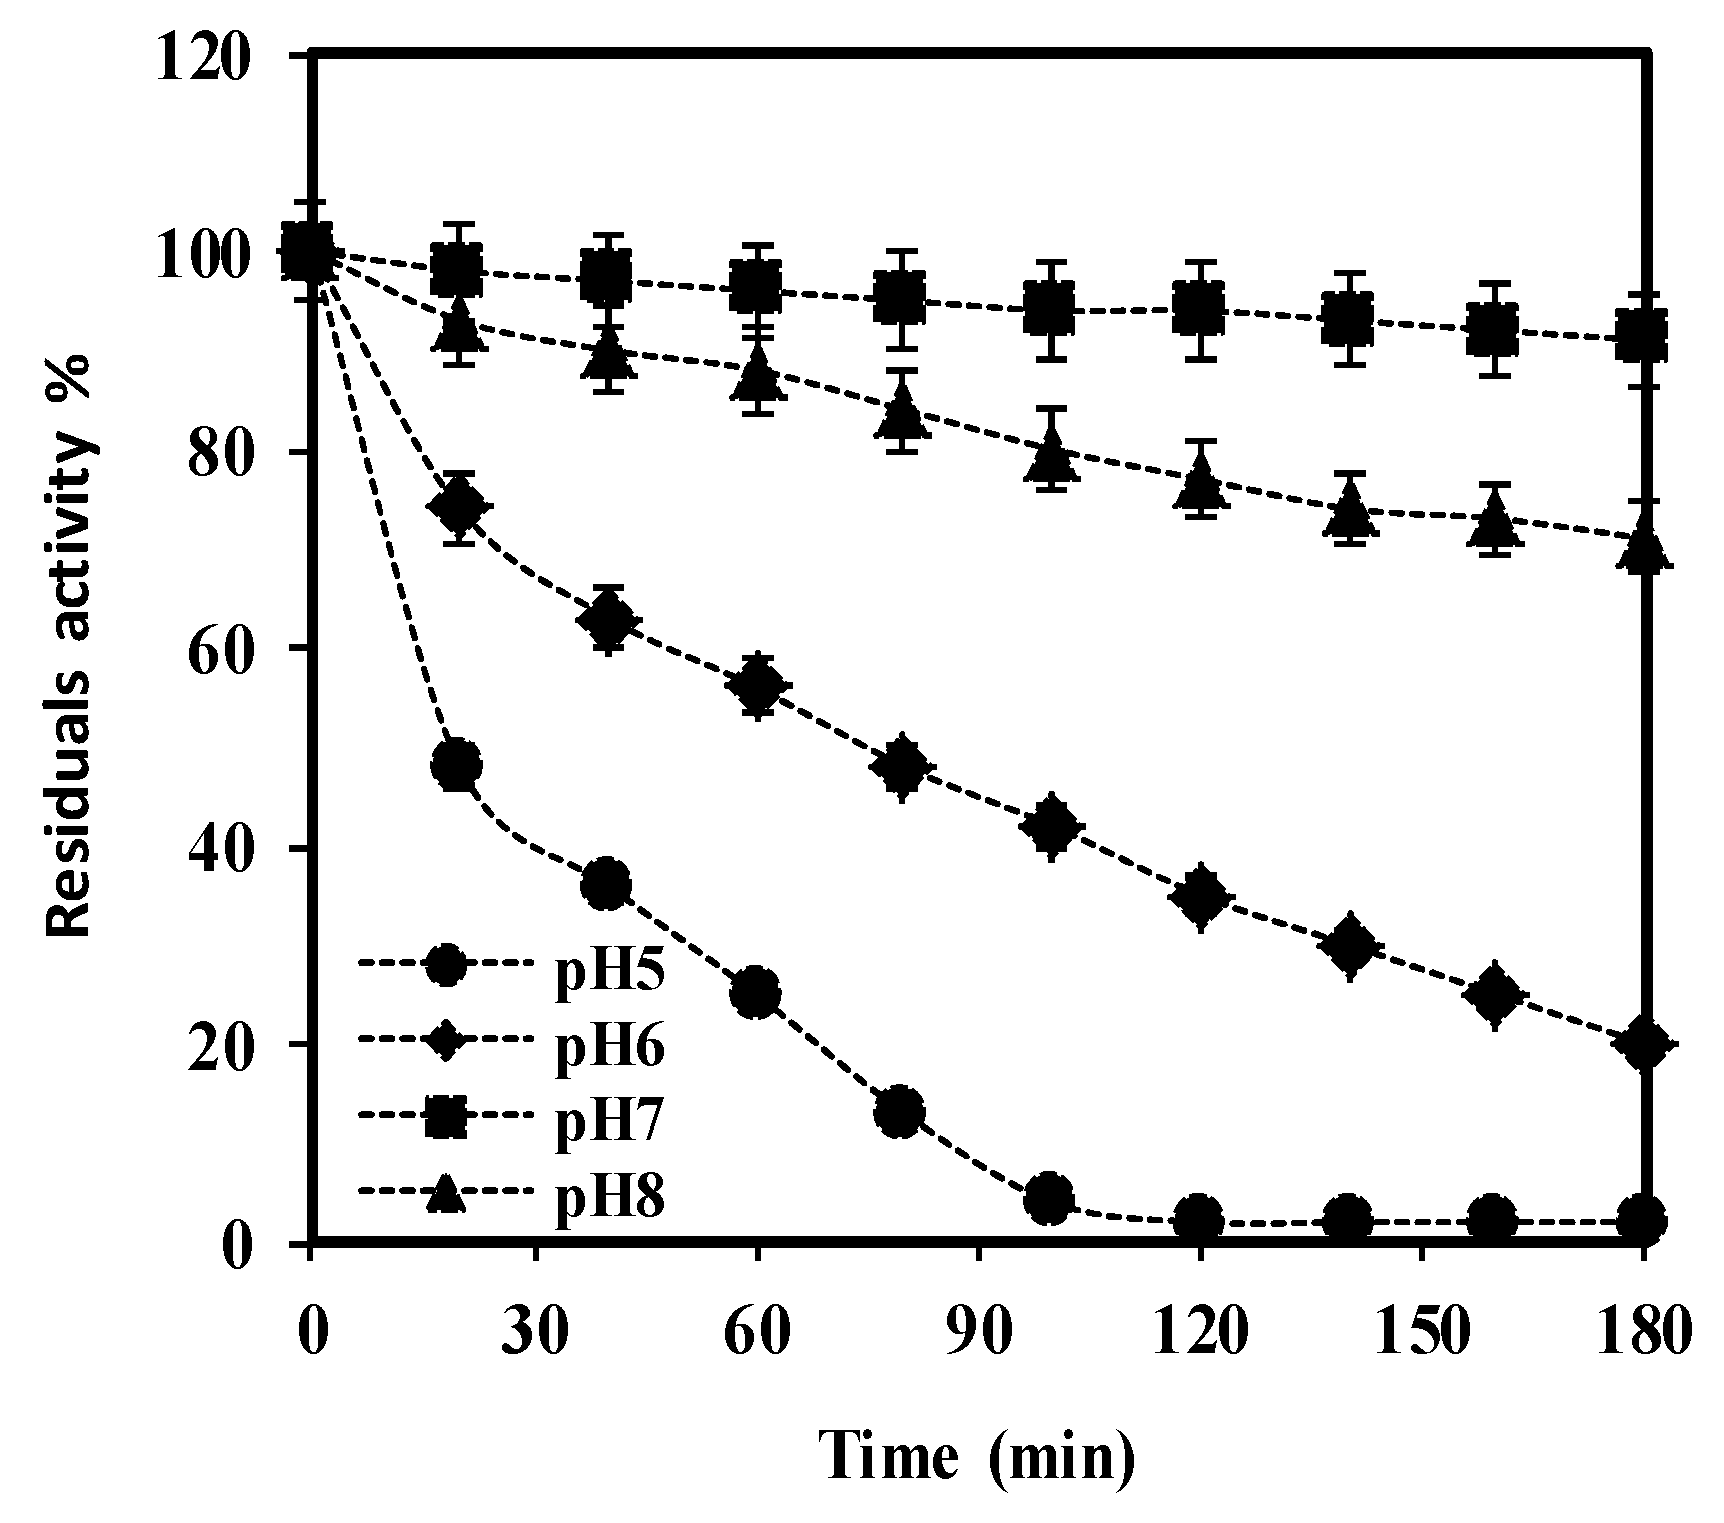
Bioengineering 06 00061 g007
Figure 8. The pH stability of purified S. griseus recombinant β-glucosidase was determined by incubating enzyme solutions containing 7 mM pNPG in buffers of various pH, ranging between 5 ( Bioengineering 06 00061 i001), 6 ( Bioengineering 06 00061 i002), 7 ( Bioengineering 06 00061 i003), and 8 ( Bioengineering 06 00061 i004), over a period of 180 min at 37 °C. Residual activity (%) at each time point was calculated considering the initial activity, at zero time as 100%. Data represent the mean of three independent experiments, with standard deviations noted as error bars.
Bioengineering 06 00061 g008
Table 1. The minimum and maximum ranges for different factors studied during screening process.
Factors TypesFactors CodesFactors Levels
−1 (Low)+1 (High)
Induction conditionX1OD (Abs600 nm)0.30.9
X2IPTG (mM)0.11.0
X3Temperature (°C)1836
X4Incubation time (h)4.020
Media CompositionX5Yeast Extract (g/L)5.010
X6Tryptone (g/L)1020
X7Fructose (g/L)1.05.0
Table 2. Plackett-Burman Design. Multiple screening designs for identification of most influential factors on the production of S.griseus recombinant β-glucosidase. It depicts coded values of the designs, along with the observed experimental response (β-glucosidase activity (BGL); U/mL).
Coded ValuesResponse
RunsX1X2X3X4X5X6X7BGL (U/mL)
1111111139.301
2−1−11−1−11−139.781
3−11−1−11−1140.681
41−1−11−11139.761
5−1−11−111139.801
611−1−1−11−140.631
71−1111−1−139.271
8−11−1111−139.621
9−1111−1−1−139.181
10111−1−1−1140.211
11−1−1−11−1−1139.811
121−1−1−11−1−140.791
Table 3. Fractional Factorial Design. Multiple screening designs for identification of the most influential factors on the production of S.griseus recombinant β-glucosidase. It depicts coded values of the designs, along with the observed experimental response (β-glucosidase activity (BGL); U/mL).
Coded ValuesResponse
RunsX1X2X3X4X5X6X7BGL (U/mL)
1111−1−1−1−141.641
2−1−1−1−1−1−1−140.471
31−1−111−1−140.571
41−1−1−1−11139.821
51−11−11−1141.601
6−11111−1−140.561
7111111139.411
8−1−1−1111140.388
91−111−11−140.281
1011−1−111−139.631
11−11−11−11−140.421
1211−11−1−1140.311
13−1−11−111−141.379
14−11−1−11−1140.651
15−111−1−11141.691
16−1−111−1−1140.380
Table 4. Definitive Screening Design. Multiple screening designs for identification of most influential factors on the production of S.griseus recombinant β-glucosidase. It depicts coded values of the designs, along with the observed experimental response (β-glucosidase activity (BGL); U/mL).
Coded Values Response
RunsX1X2X3X4X5X6X7BGL (U/mL)
1−1110−1−1−140.111
2000000041.221
3−101111−139.033
4−1101−1−1140.621
51−1110−1−139.121
6−1−11−1−11139.961
71−1−1011140.511
811−111−1−140.611
9111−11−1140.261
1011−11−11040.011
1110−1−1−1−1140.561
12−11−1−101139.451
13−1−1−111−1140.651
14011111139.106
15−1−1−11−11−139.981
16−11−1−110−139.791
17111−1−11−140.021
181−111−10139.190
19−1−11−11−1039.841
201−10−111−141.211
210−1−1−1−1−1−139.781
22000000041.231
Table 5. The most influential factors (X1, X3, X4, X6), as identified through the screening process, were examined at three levels; low (−1), central (0), and high (+1), for the optimisation of S. griseus recombinant β-glucosidase expression in E. coli BL21 (DE3).
Factor code Factors (unit)Levels
−10+1
X1OD (Abs600 nm)0.36.00.9
X3Temperature (°C)182736
X4Incubation time (h) 41220
X6Tryptone (g/L)101520
Table 6. CCD for production optimisation of S. griseus recombinant β-glucosidase. The table depicts coded values, along with the experimental response: BGL (U/mL), actual, predicted, and residuals (the difference between the actual and predicted values).
Coded values Response: BGL (U/mL)
RunsX1X3X4X6ActualPredictedResiduals
1000−141.63341.5830.050
2−111−139.07239.0490.023
31−1−1139.89939.903−0.004
4−100041.26341.313−0.050
5111139.08939.0520.037
6001041.21341.230−0.017
7−1−11140.43340.3540.079
8−1−1−1139.98840.043−0.055
91−11−139.80439.907−0.103
101−11140.23240.2180.014
1111−1−139.82439.883−0.059
12010040.43040.558−0.128
13000041.80441.7890.015
14111−139.02338.9630.060
15000141.58741.734−0.147
16000041.90041.7890.111
17−11−1−139.96539.974−0.009
180−10041.10041.0690.031
19100041.15341.200−0.047
20−1−11−140.02440.045−0.021
21−11−1140.08739.9640.123
22000041.89041.7890.101
23−1−1−1−139.81339.830−0.017
2411−1139.90239.8770.025
251−1−1−139.76339.6860.077
2600−1041.45541.535−0.080
27000041.85241.7890.063
28-111139.06239.134-0.072
Table 7. Analysis of Variance was used to confirm the adequacy of the model used in this study.
SourceDFAdj SSAdj MSF-Valuep-Value
Model1424.50071.75005167.32<0.001
Residuals (error)130.13600.01046
Lack-of-Fit100.13030.013036.870.070
Pure Error30.00570.00190
Total2724.6366
Note: R2 = 99.45%; Adj-R2 = 98.85%; Pred-R2 = 97.04%. Abbreviations: DF = Degree of Freedom; SS = Sum of Square; MS = Mean Square.
Table 8. Regression coefficients significance: Coef, SE Coef, t-value, and p-value of the model terms (X1, X2, X3, X4) and their interactions are noted. The t- and p-values were determined by using JMP 13 (SAS Institute, Wittington House, UK).
Model TermCoefSE Coeft-Valuep-Value
Constant 41.78910.03541181.70<0.001
X1−0.05660.0241−2.350.035
X3−0.25570.0241−10.61<0.001
X4−0.15240.0241−6.32<0.001
X60.07540.02413.130.008
X1*X1−0.53280.0637−8.37<0.001
X3*X3−0.97580.0637−15.32<0.001
X4*X4−0.40680.0637−6.39<0.001
X6*X6−0.13080.0637−2.050.061
X1*X30.01330.02560.520.613
X1*X40.00140.02560.050.958
X1*X60.00080.02560.030.977
X3*X4−0.28510.0256−11.15<0.001
X3*X6−0.05570.0256−2.180.048
X4*X60.02390.02560.930.367
Abbreviations: Coef = coefficient; SE Coef = standard error of the coefficient.
Table 9. Comparison of S. griseus recombinant β-glucosidase production under optimised and pre-optimised conditions. The non-optimised expression was carried out using basal medium (LB broth) overnight at 37 °C, 220 rpm and cells were induced with 1 mM IPTG when OD600 nm reached 0.6.
Production MethodFractionFraction Volume (mL)Fraction Volume (mL)Total Protein (mg)Enzyme Activity U/mLTotal Activity (IU)
OptimisedCrude extract109.9499.4042.00420
Non-optimised Crude extract103.8038.0016.06160
Table 10. S. griseus recombinant β-glucosidase purification table.
Purification StepTotal Protein (mg)Total Activity (IU)Specific Activity (IU/mg)Yield (%)Purification (Fold)
Crude extract99.404204.231001.00
Ultrafiltration 71.823925.46931.29
Affinity chromatography31.702598.17621.93
GST-tag cleavage21.471969.13472.16
Table 11. The effect of metal ions or additive on purified S.griseus recombinant β-glucosidase was determined spectrometrically after 1-h and 6-h of incubation in the presence of 1 mM of each ion in potassium phosphate buffer, pH 7. The residual activity (%) was calculated in comparison to the activity obtained from enzyme in the same condition, but in the absence of any metal ion or additive. The results are the average of three independent experiments with standard derivation (±SD) noted (* p-value ≤ 0.05 and ** p-value ≤ 0.01 represent significant and very significant difference, respectively, based on two-tailed t-test).
CompoundsResidual Activity % ± SD (1 h)Residual Activity % ± SD (6 h)
Control100 ± 0.044100 ± 0.074
Ca2+105.57 ± 2.91116.28 ± 3.90 **
Mg2+106.55 ± 2.57118.45 ± 4.11**
N+101.98 ± 2.91116.57 ± 1.54 **
K+101.01 ± 1.65113.53 ± 3.38 *
ZnSO4 86.99 ± 2.01 *11.56 ± 0.58 **
(NH4)2S486.27 ± 1.36 *99.74 ± 2.69
Table 12. Kinetic constants determined for purified β-glucosidase activity towards pNPG and cellobiose, as determined by non-linear regression analysis, using GraphPad Prism 7 (GraphPad Software, San Diego, CA, USA).
SubstrateKm (mM)Vmax (μmol·min−1·mg−1)
pNPG8.7 ± 0.42 243 ± 6.22
Cellobiose15.8 ± 0.62275 ± 7.12
Table 13. Kinetic parameters for β-glucosidases from various sources towards pNPG and cellobiose; n/d is not defined.
MicroorganismSubstrateVmaxKmOptimum Temp. and pHReferences
Thermoanaerobacterium thermosaccharolyticumpNPG64 U/mg0.62 mM70 °C, pH 6.4[56]
cellobiose120 U/mg7.9 mM
Phoma sp. KCTC11825BPpNPGn/d0.3 mM60 °C, pH 4.5[61]
cellobiosen/d3.2 mM,
Pyrococcus furiosuspNPG700 U/mg0.15 mM105 °C, pH 5[64]
Celobiose470 U/mg20 mM
Thermoascus aurantiacuspNPGn/d0.1137 mM80 °C, pH 4.5[65]
cellobiosen/d0.6370 mM
Aureobasidium pullulans (NRRL Y-1297)pNPG897 μmol·min−1·mg−11.17 mM75 °C, pH 4.5[66]
cellobiose800 μmol·min−1·mg−11.00 mM
Monascus purpureus NRRL1992pNPG6.51 U/mg0.39 mM50 °C, pH 5.5[47]
cellobiose4.71 U/mg2.86 mM
Aspergillus fumigatus Z5pNPG141.60 μmol·min−1·mg−11.73 mM60 °C, pH 6[67]
cellobiose52.37 μmol·min−1·mg−11.75 mM
Stachybotrys strainpNPG78 U/mg0.27 mM50 °C, pH 5[68]
cellobiose59.4 U/mg2.22 mM
Neosartorya fischeri NRRL181pNPG886 μmol·min−1·mg−168 mM40 °C, pH 6[69]
Aspergillus nigerpNPG166 μmol·min−1·mg−18.0 mM50 °C, pH 8[70]

