Review

Quantitative Dynamic Contrast-Enhanced Magnetic Resonance Imaging (DCE-MRI) in Hepatocellular Carcinoma: A Review of Emerging Applications for Locoregional Therapy

by
Xinyi M. Li
,
Tu Nguyen
,
Hiro D. Sparks
,
Kyunghyun Sung
and
Jason Chiang
*
Department of Radiological Sciences, University of California, Los Angeles, CA 92521, USA
*
Author to whom correspondence should be addressed.
Bioengineering 2025, 12(8), 870; https://doi.org/10.3390/bioengineering12080870
Submission received: 20 June 2025 / Revised: 7 August 2025 / Accepted: 9 August 2025 / Published: 12 August 2025

Abstract

Quantitative dynamic contrast-enhanced magnetic resonance imaging (DCE-MRI) is emerging as a valuable tool for assessing tumor and parenchymal perfusion in the liver, playing a developing role in locoregional therapies (LRTs) for hepatocellular carcinoma (HCC). This review explores the conceptual underpinnings and early investigational stages of DCE-MRI for LRTs, including thermal ablation, transarterial chemoembolization (TACE), and transarterial radioembolization (TARE). Preclinical and early-phase studies suggest that DCE-MRI may offer valuable insights into HCC tumor microvasculature, treatment response, and therapy planning. In thermal ablation therapies, DCE-MRI provides a quantitative measurement of tumor microvasculature and perfusion, which can guide more effective energy delivery and estimation of ablation margins. For TACE, DCE-MRI parameters are proving their potential to describe treatment efficacy and predict recurrence, especially when combined with adjuvant therapies. In 90Y TARE, DCE-MRI shows promise for refining dosimetry planning by mapping tumor blood flow to improve microsphere distribution. However, despite these promising applications, there remains a profound gap between early investigational studies and clinical translation. Current quantitative DCE-MRI research is largely confined to phantom models and initial feasibility assessments, with robust retrospective data notably lacking and prospective clinical trials yet to be initiated. With continued development, DCE-MRI has the potential to personalize LRT treatment approaches and serve as an important tool to enhance patient outcomes for HCC.

Graphical Abstract

1. Introduction

Hepatocellular carcinoma (HCC) is the most prevalent form of primary liver malignancy, ranking as the third leading cause of cancer deaths globally, with a rapidly growing rate of incidence [1]. The treatment of HCC is broadly guided by the Barcelona Clinic Liver Cancer (BCLC) criteria [2], which stratify patients to either a combination of surgical, locoregional, or systemic therapies, depending on the stage of the disease, underlying liver function, and the functional status of the patient. For patients with early-stage HCC, liver transplantation represents the ideal curative approach, with surgical resection serving as another option. However, a shortage of donor allografts restricts transplantation, and many patients are ineligible for surgical resection due to factors such as tumor burden, location, or compromised underlying liver function [3]. In this context, locoregional treatments such as radiofrequency ablation (RFA), microwave ablation (MWA), transarterial chemoembolization (TACE), and transarterial radioembolization (TARE) have become increasingly recognized as alternatives for patients ineligible for surgery or as bridges to prevent further tumor growth for patients listed for liver transplant [2]. However, the efficacy of these interventions is highly dependent on the precise targeting and adequate assessment of the tumor’s vascular characteristics [4]. Consequently, imaging can play a vital role in this context, helping not only with diagnosing HCC but also with staging and optimizing treatment strategies [5]. While conventional imaging modalities like multiphasic contrast-enhanced MRI (CE-MRI) are fundamental for HCC diagnosis, they often provide limited insight into the functional heterogeneity of tumor perfusion and the tumor microenvironment. This limitation can impede optimal locoregional therapy (LRT) planning and the early prediction of treatment response.
Perfusion magnetic resonance imaging (MRI) is emerging as an increasingly investigated technique for evaluating and managing HCC, allowing physicians to assess underlying liver blood flow and microcirculation. Historically, these parameters were not adopted due to both the resolution limitations of MRI and the uncertain clinical value of quantitative perfusion metrics [5,6]. Computed tomography perfusion (CTP) provides high spatial and temporal resolution as well as straightforward quantification of contrast concentration, as attenuation is directly proportional to concentration. However, CTP also exposes patients to ionizing radiation, which can be undesirable with repeated imaging. In contrast, MRI avoids the risks of ionizing radiation altogether, allowing for a higher number of protocols to be run without risking excess radiation exposure [5]. Within MRI, perfusion can be assessed using methods such as arterial spin labeling (ASL), dynamic susceptibility contrast (DSC) MR perfusion, or dynamic contrast-enhanced MRI (DCE-MRI). The scope of this review will focus on DCE-MRI, given its widespread investigation for quantitative tissue characterization in liver imaging [5].
For the liver, traditional methods for characterizing focal lesions primarily rely on visual assessment of contrast enhancement patterns on three-phased CE-MRI scans. These patterns arise from the distribution of contrast agent within the liver over time, a process influenced by underlying microcirculatory characteristics [7]. By rapidly measuring tissue enhancement, DCE-MRI provides a quantitative extension to traditional visual interpretations of enhancement parameters. It enables the measurement of tissue perfusion parameters such as blood flow, blood volume, and capillary permeability, which can help to predict the behavior of the tumor and guide therapeutic decision-making of different treatment modalities [8].
This review aims to explore the integration of DCE-MRI with locoregional therapies for HCC. It is important to note that while the BCLC framework guides overall treatment strategy, advanced imaging techniques like quantitative DCE-MRI remain primarily investigational in this context and are not currently incorporated for specific decision-making within locoregional therapy pathways in these or other major clinical guidelines [2]. We will investigate the principles of MR perfusion using DCE-MRI and examine its applications across various locoregional therapies. Specifically, we will discuss how insights into underlying tumor vascularity gained from DCE-MRI may help to optimize thermal ablation therapies such as RFA and MWA. We will also cover its application in TACE, where DCE-MRI can aid in assessing tumor perfusion and response after treatment. Finally, we will explore how DCE-MRI has the potential to improve dosimetry for 90Y TARE. By reviewing the latest research, we highlight the growing utility of DCE-MRI for optimizing locoregional therapies in HCC. With its ability to provide quantitative data beyond standard visual assessment of tumor perfusion, DCE-MRI shows promise in guiding therapeutic decisions and improving patient outcomes in HCC patients.

2. Principles of Dynamic Contrast-Enhanced MRI (DCE-MRI)

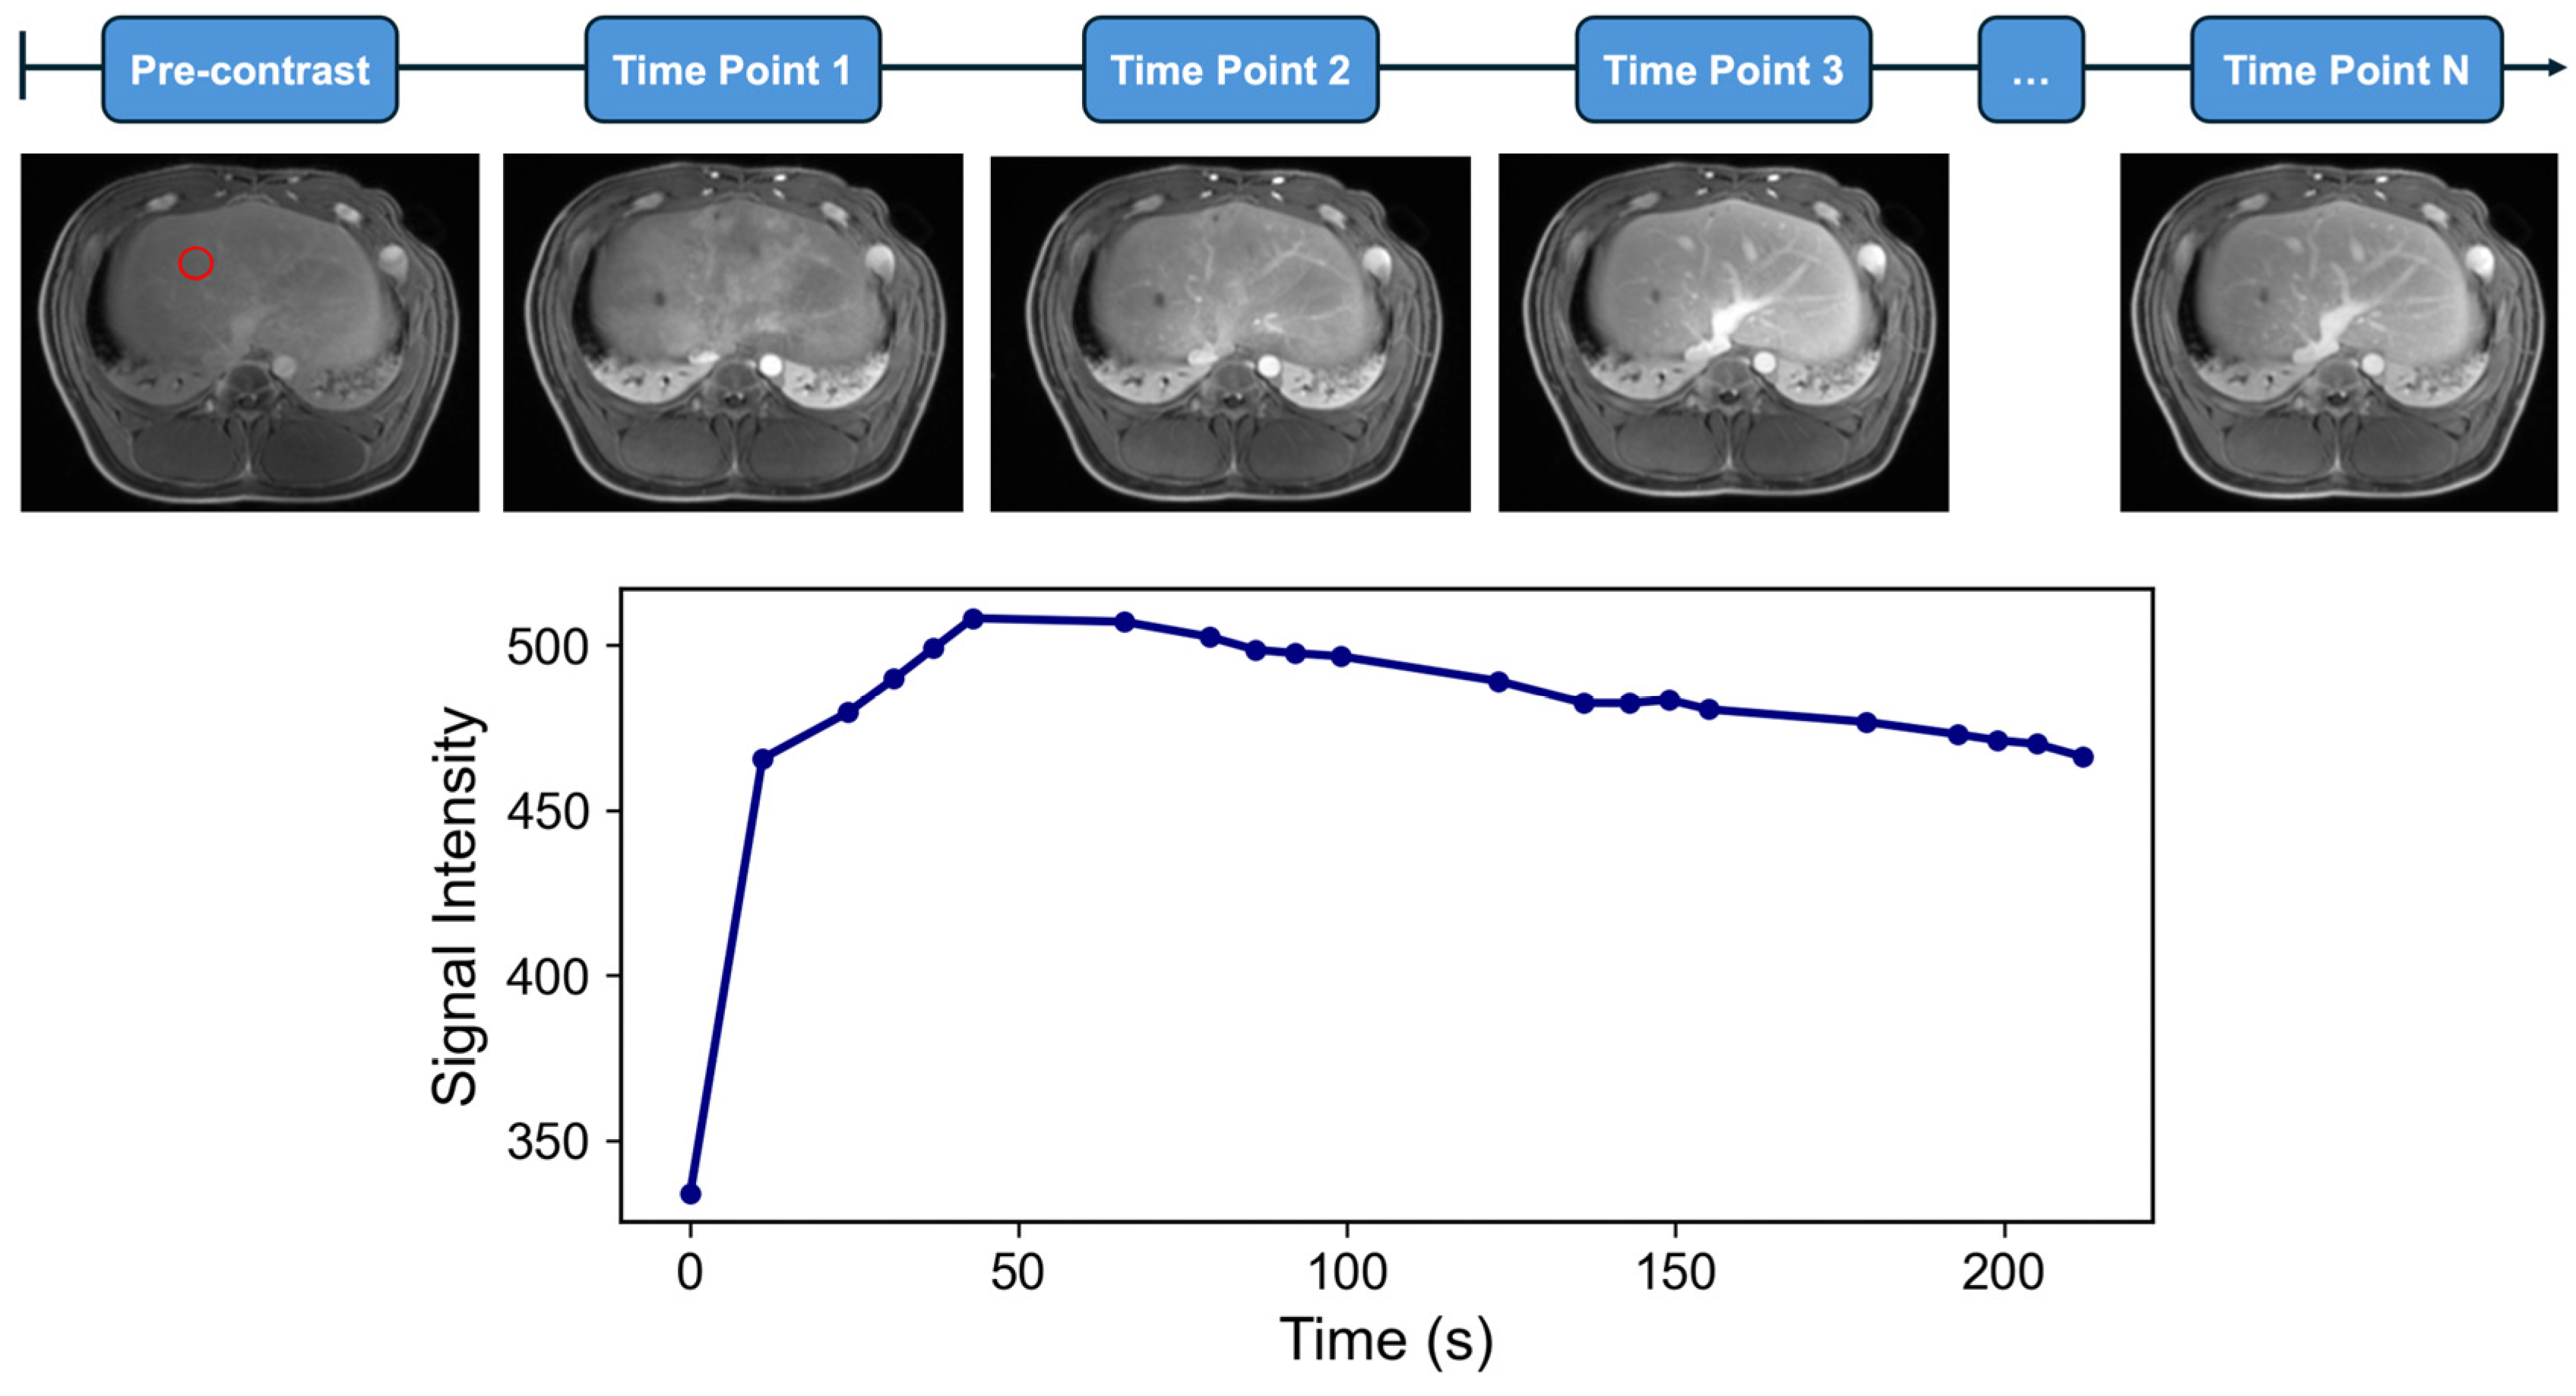
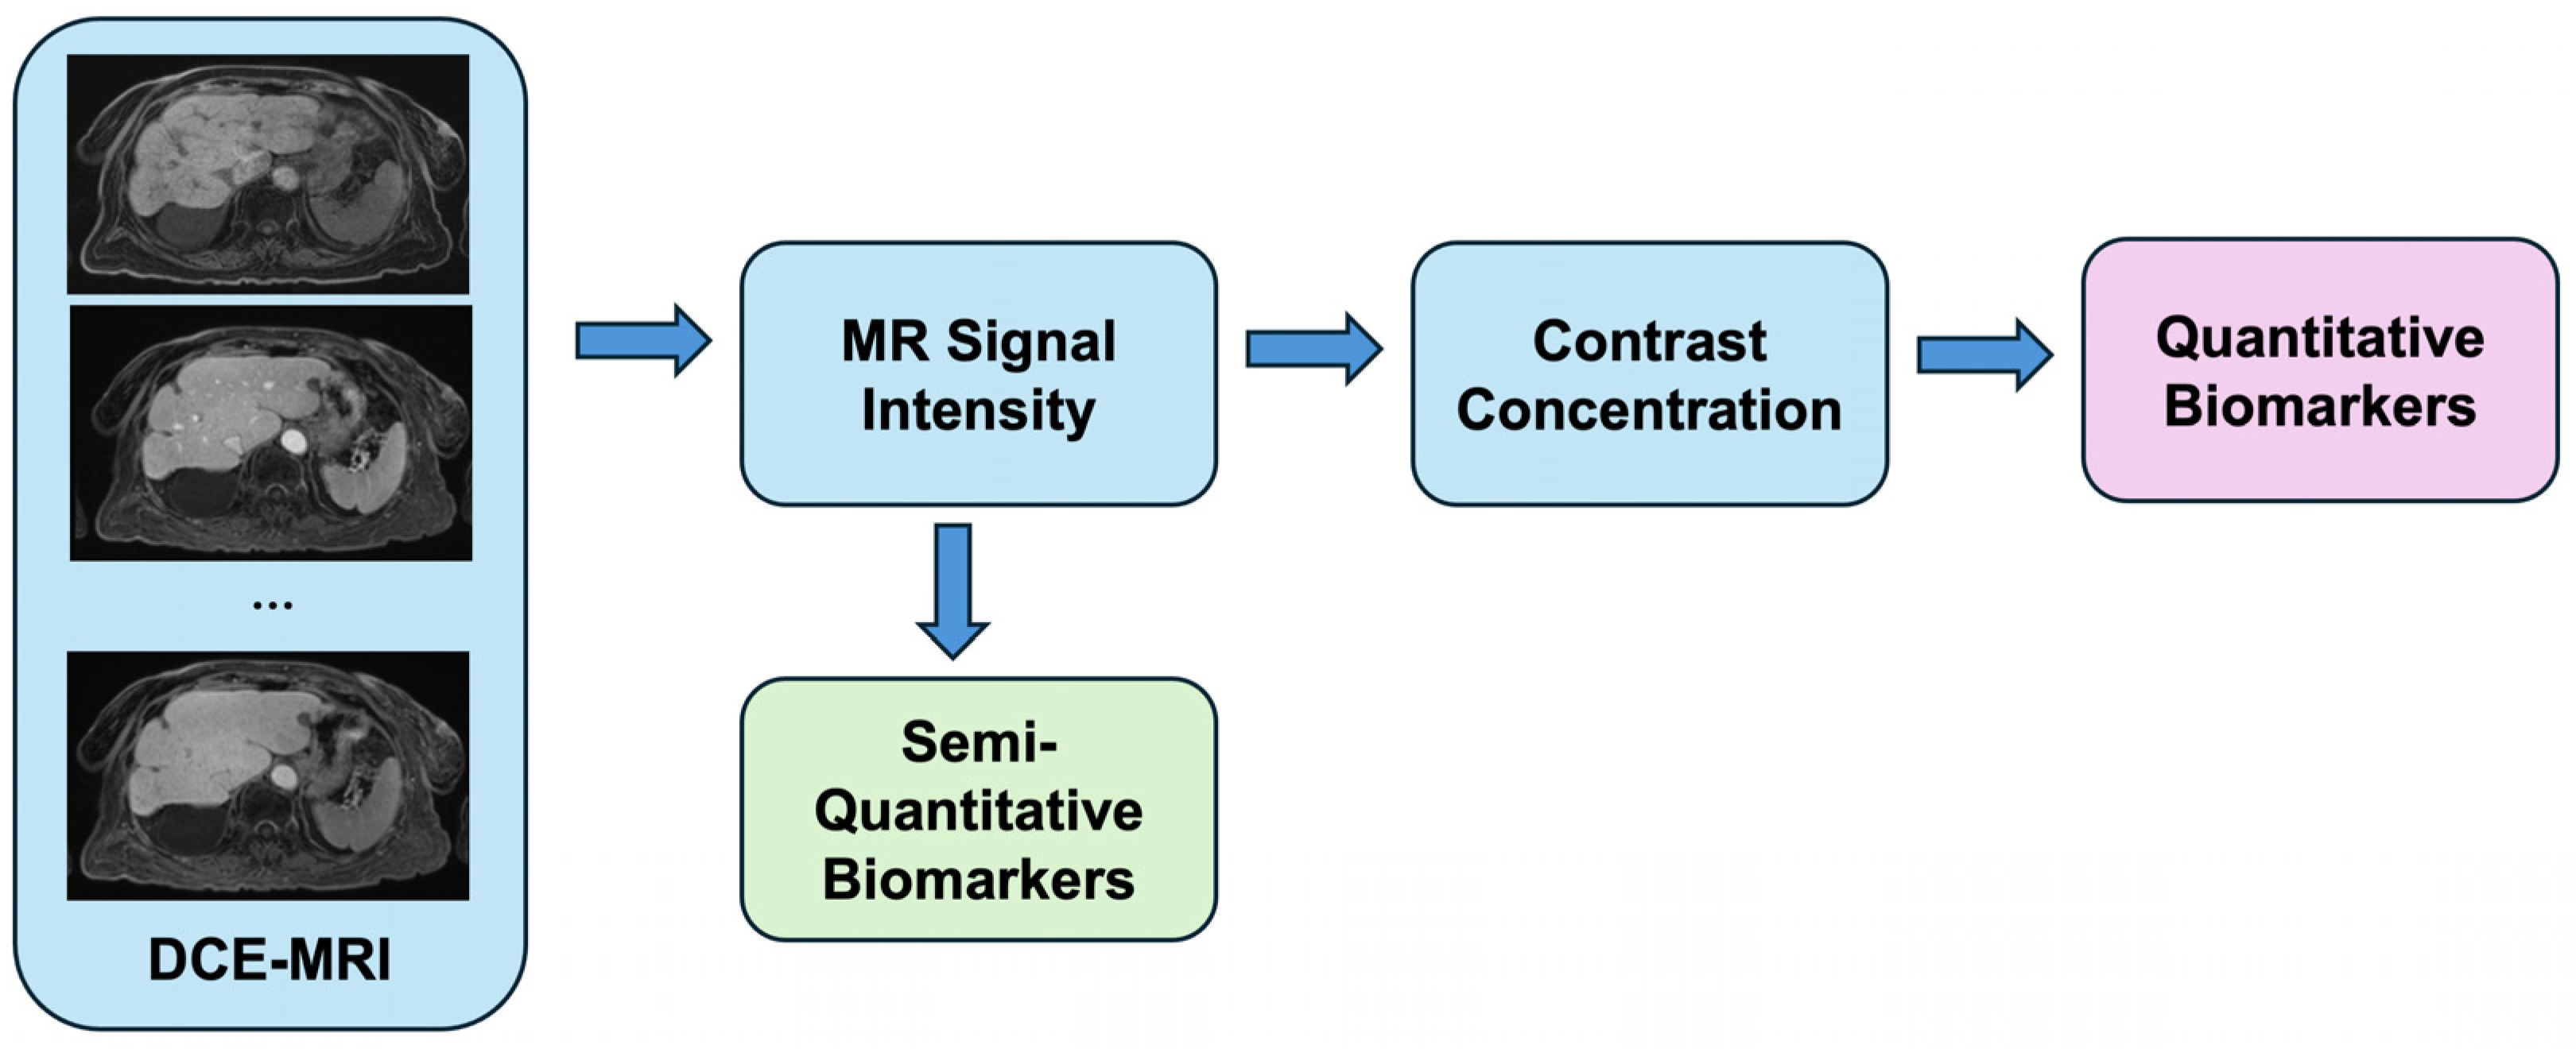
MR contrast studies begin with the intravenous injection of a gadolinium-based contrast agent, which shortens the T1 relaxation time of tissues and enhances their signal intensity on T1-weighted images [9]. During this time, high-temporal-resolution imaging captures MR signal intensity (SI) as the contrast agent is perfused through tissue over time (Figure 1 and Figure 2). A 3D gradient echo sequence is widely used for liver DCE-MRI, with typical image acquisition parameters outlined in the Quantitative Imaging Biomarkers Alliance (QIBA) recommendations for DCE-MRI-derived biomarkers [10]. Hepatic contrast perfusion appears as an increasing enhancement on T1-weighted images. The reliable measurement of the pharmacokinetic (PK) perfusion parameters depends on accurately determining the gadolinium concentration ([Gd]) from the acquired SI for both the liver parenchyma and the vascular input [11]. Dynamic MRI data can be analyzed using either a model-free semiquantitative or a model-based quantitative approach (Table 1). The pipeline from acquiring dynamic signal data to deriving contrast concentration curves and ultimately applying these analytical approaches for semiquantitative and quantitative features is shown in Figure 3.
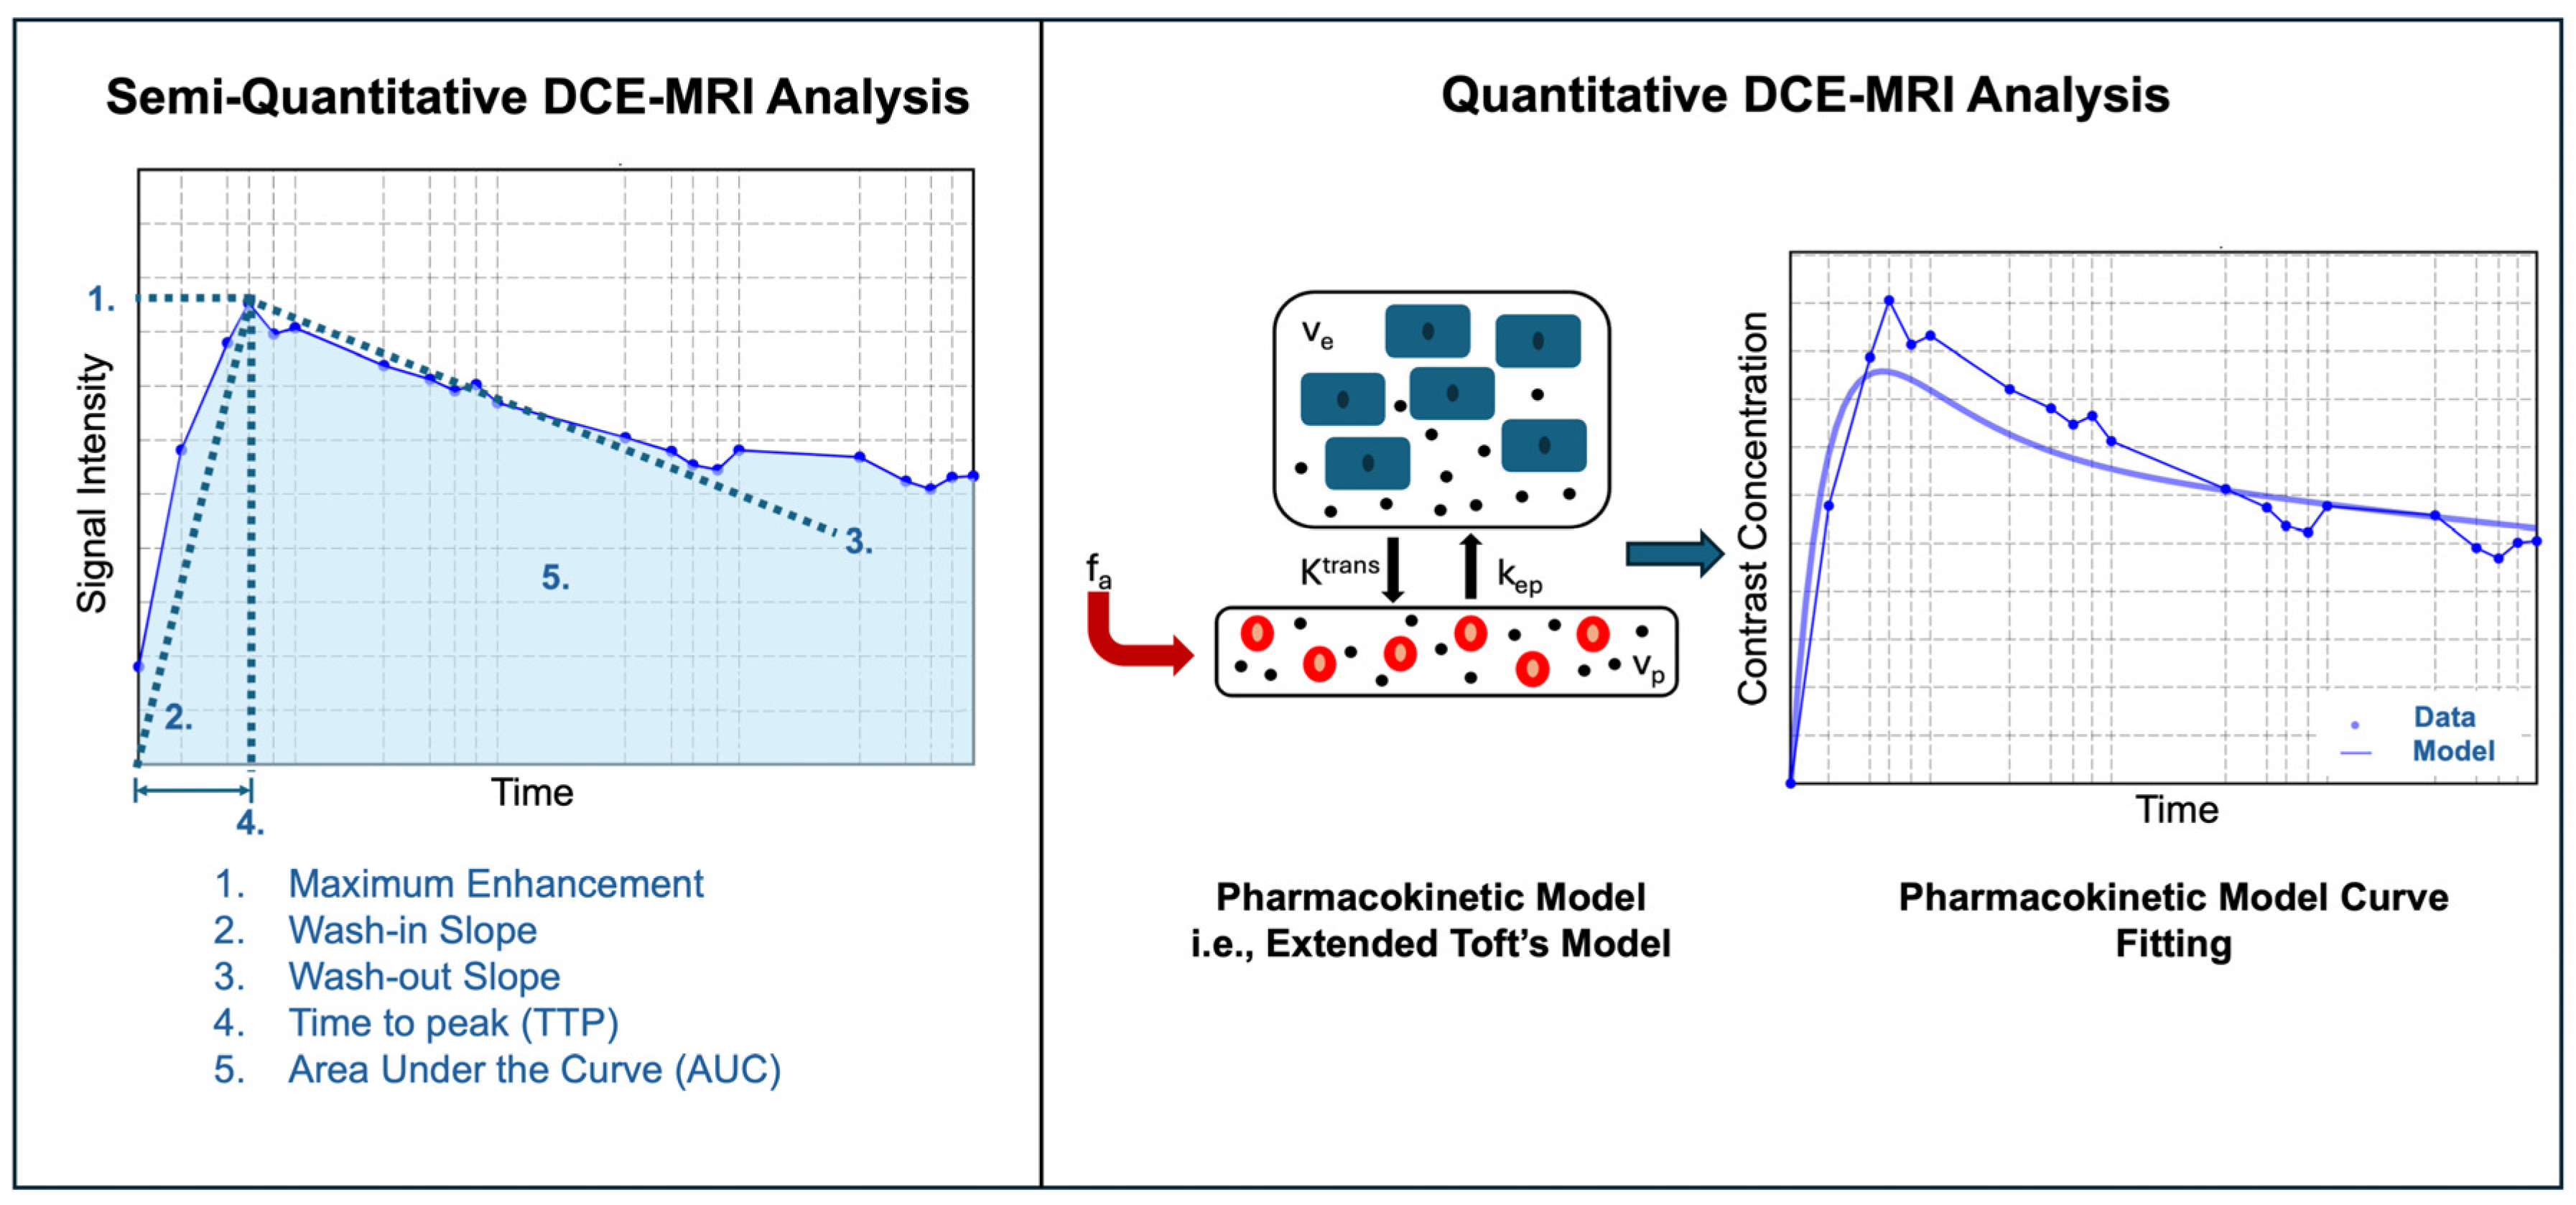
Model-free semiquantitative analysis involves examining the shape and features of the SI curves to gain insights into tumor pathophysiology (see Figure 4). Some key parameters derived from these curves include the area under the curve (AUC), which reflects the total volume flow over a specified time period; the peak signal intensity or peak enhancement ratio, which indicates the highest level of enhancement; the wash-in slope and wash-out slope, which measure the rate of flow; and the mean transit time (MTT), which represents the average time required for blood to traverse a tissue region. Although semiquantitative methods are widely investigated in the scientific literature due to their simplicity and lack of modeling requirements, they do not provide a direct assessment of physiological characteristics as quantitative models do [13].
Model-based quantitative analysis of DCE-MRI data involves deriving parameters that reflect the pharmacokinetics of the contrast agent. Following acquisition, signal intensities are converted into contrast agent concentrations over time, typically through a signal-to-concentration transformation that accounts for baseline T1 values and imaging parameters [14]. Next, the arterial input function (AIF) is selected either through direct measurement from a vascular structure such as the aorta or hepatic artery [15] or by estimation using a population-based model, which relies on averaged blood sample measurements from a cohort of subjects [16]. The AIF represents the time-varying concentration of contrast agent in the blood plasma and serves as the input for kinetic modeling. Tracer kinetic modeling then uses mathematical curve fitting to describe the tissue contrast concentration–time curves (see Figure 4), the details of which are beyond the scope of this review [17]. Most DCE-MRI quantitative analysis studies currently use in-house software. However, open-source packages for DCE-MRI model fitting are also available [18].
There are many physiologically relevant tracer compartment models that describe the contrast concentration–time curves. Each model has its own physiological justification, but there is no consensus on the most suitable model for DCE-MRI for the liver. The selection of each model relies on the specific context in which it is being used [9]. Tracer compartment models can be categorized into single-compartment models or multi-compartment models. Single-compartment models, such as the widely utilized standard Tofts model, assume the contrast agent is limited to a single space [19]. The standard Tofts model conceptualizes tissue as comprising blood plasma and one additional tissue compartment: the extravascular extracellular space (EES). It assumes that the contrast agent can move from the blood plasma into the EES and back again. This model is frequently employed due to its relative simplicity and its ability to estimate key microvascular parameters that describe this exchange. In this model, the tissue contrast concentration curve Ct(t) is described as follows:
C t t   =   K t r a n s 0 t C p τ e k e p ( t τ ) d τ
where Ktrans is the volume transfer constant between plasma and EES, kep is the rate constant describing the reflux from EES to plasma, and Cp(t) is the AIF. From these parameters, additional measures such as the extracellular volume fraction Ve (where Ve = Ktrans/kep) can also be derived [19].
Alternatively, multi-compartment models such as the extended Tofts model [20] or the two-compartment exchange model [21] take into account the transit of contrast agent through both the vascular space and the extravascular extracellular space [13].
Since the liver is dual-supplied by the hepatic artery and portal vein, compartmental models can be further categorized into those that use a single arterial input function and those that incorporate both arterial and venous inputs [13].
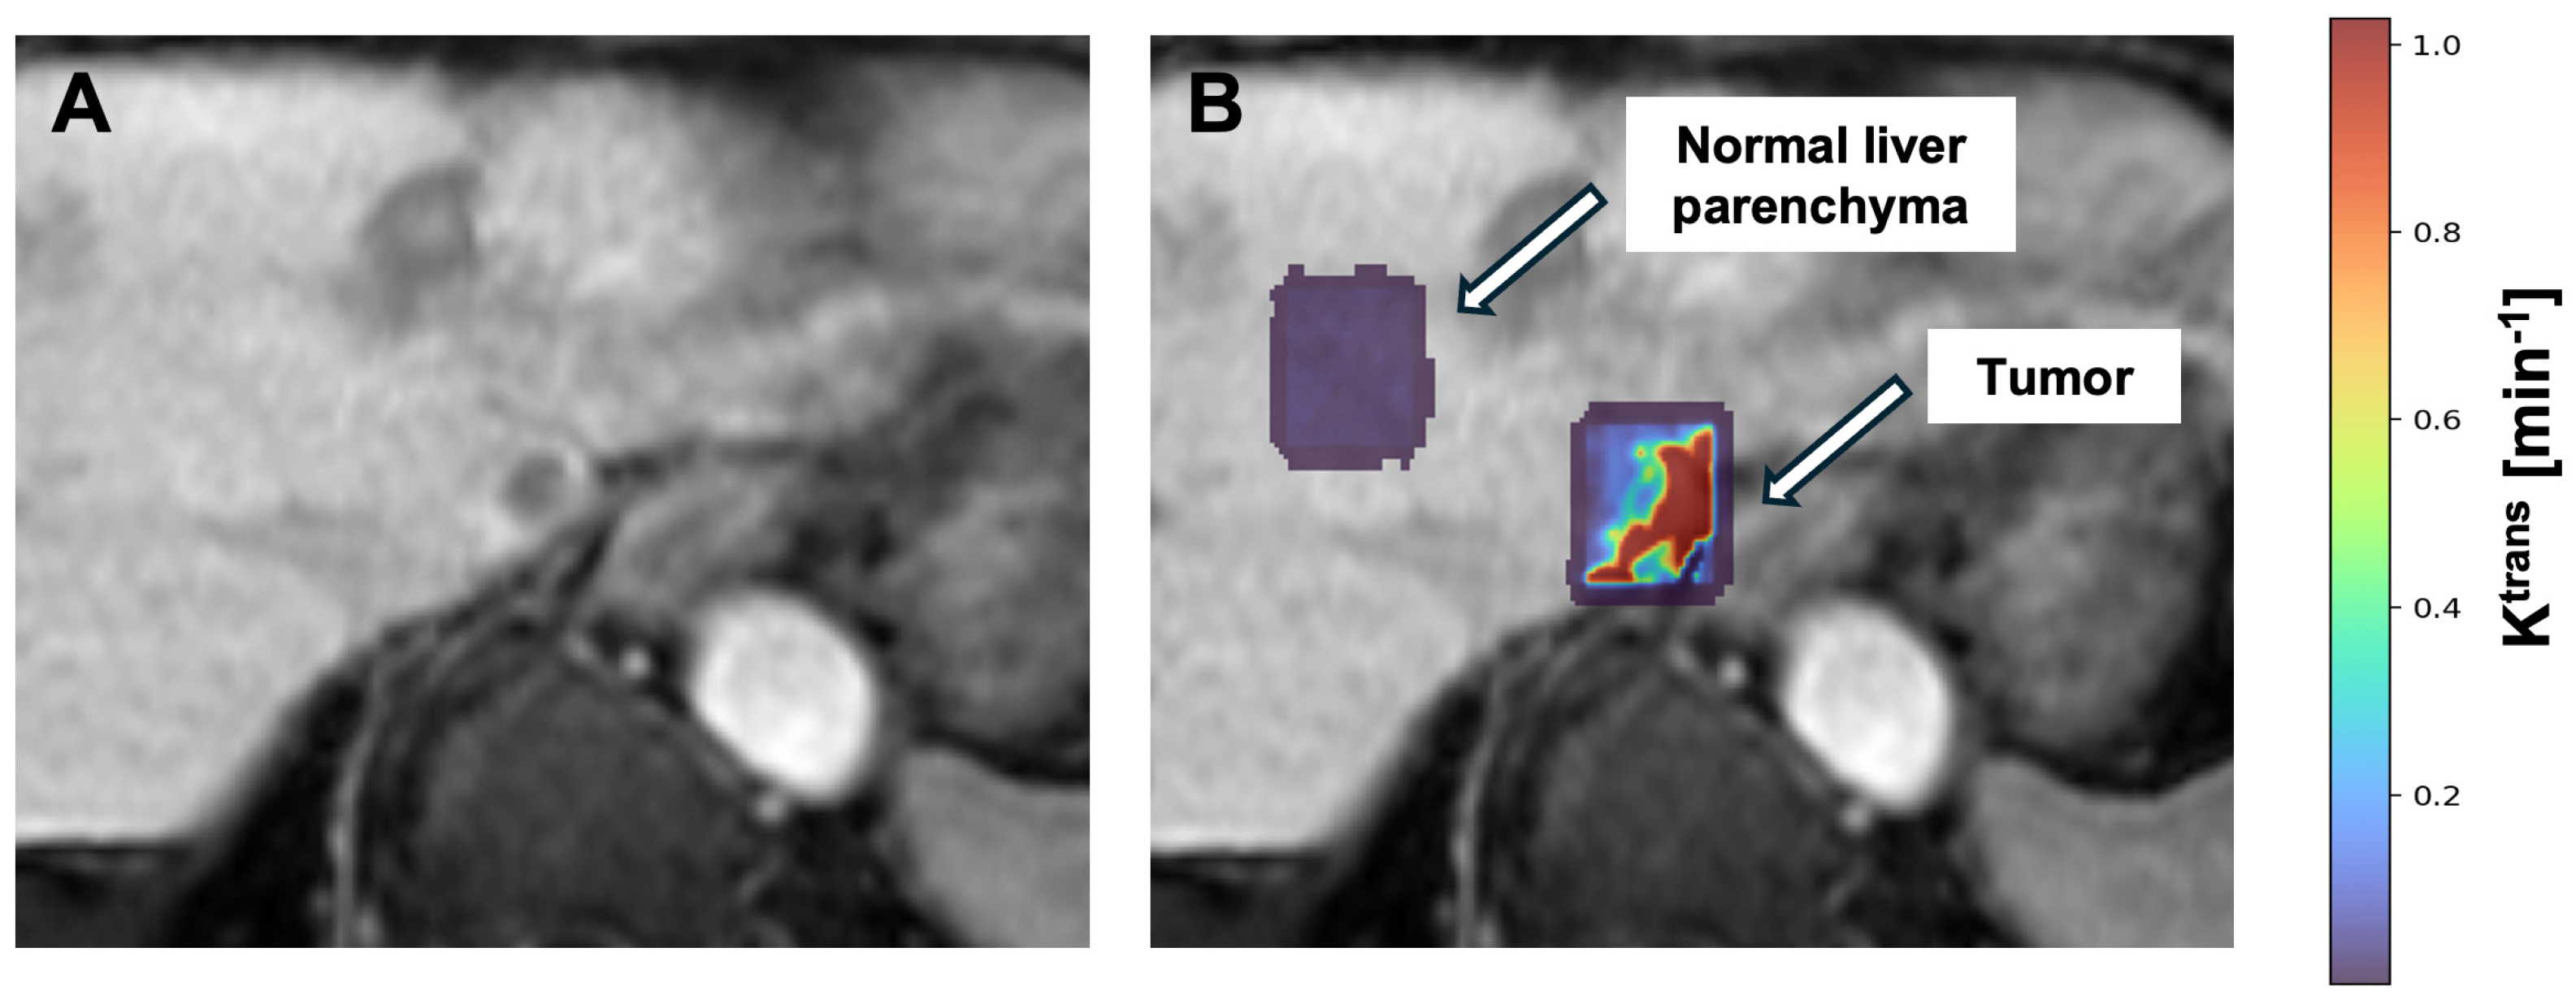
Given these multiple degrees of freedom with the input, there are consequently many parameters that can be derived from mathematical models. Some of the key outputs of DCE-MRI are the forward and backward volume transfer constants, Ktrans and kep, respectively. These parameters reflect the movement of contrast agent between the bloodstream and the EES, offering valuable insights into microvascular blood flow, vessel permeability, and vascular density (Figure 5). Another important parameter is the volume fraction of EES (Ve), which serves as an indirect measure of the tissue cellular density, further enhancing the understanding of the tissue microenvironment [13].
The aim in outlining these quantitative and semiquantitative post-processing methods is to provide the reader with a foundational understanding of the parameters relating to DCE-MRI referenced in key studies summarized in Table 2. A comprehensive literature review was performed to identify such studies using the electronic database PubMed. Search terms included combinations of “HCC”, “TACE”, “Ablation”, “Y90”, “DCE-MRI”, “Semi-quantitative”, “Quantitative”, “Ktrans”, “Kep”, and their variations. Studies were excluded if they involved conventional contrast-enhanced MRI, which is not to be confused with DCE-MRI (Figure 1 and Figure 2). A total of 12 unique studies were included in this review to represent the current scope of research applying quantitative DCE-MRI to locoregional therapies for HCC. Studies were selected based on the use of qualitative or quantitative DCE-MRI in the context of TACE, ablation, or Y90 therapy.

3. DCE-MRI in Ablation Therapy

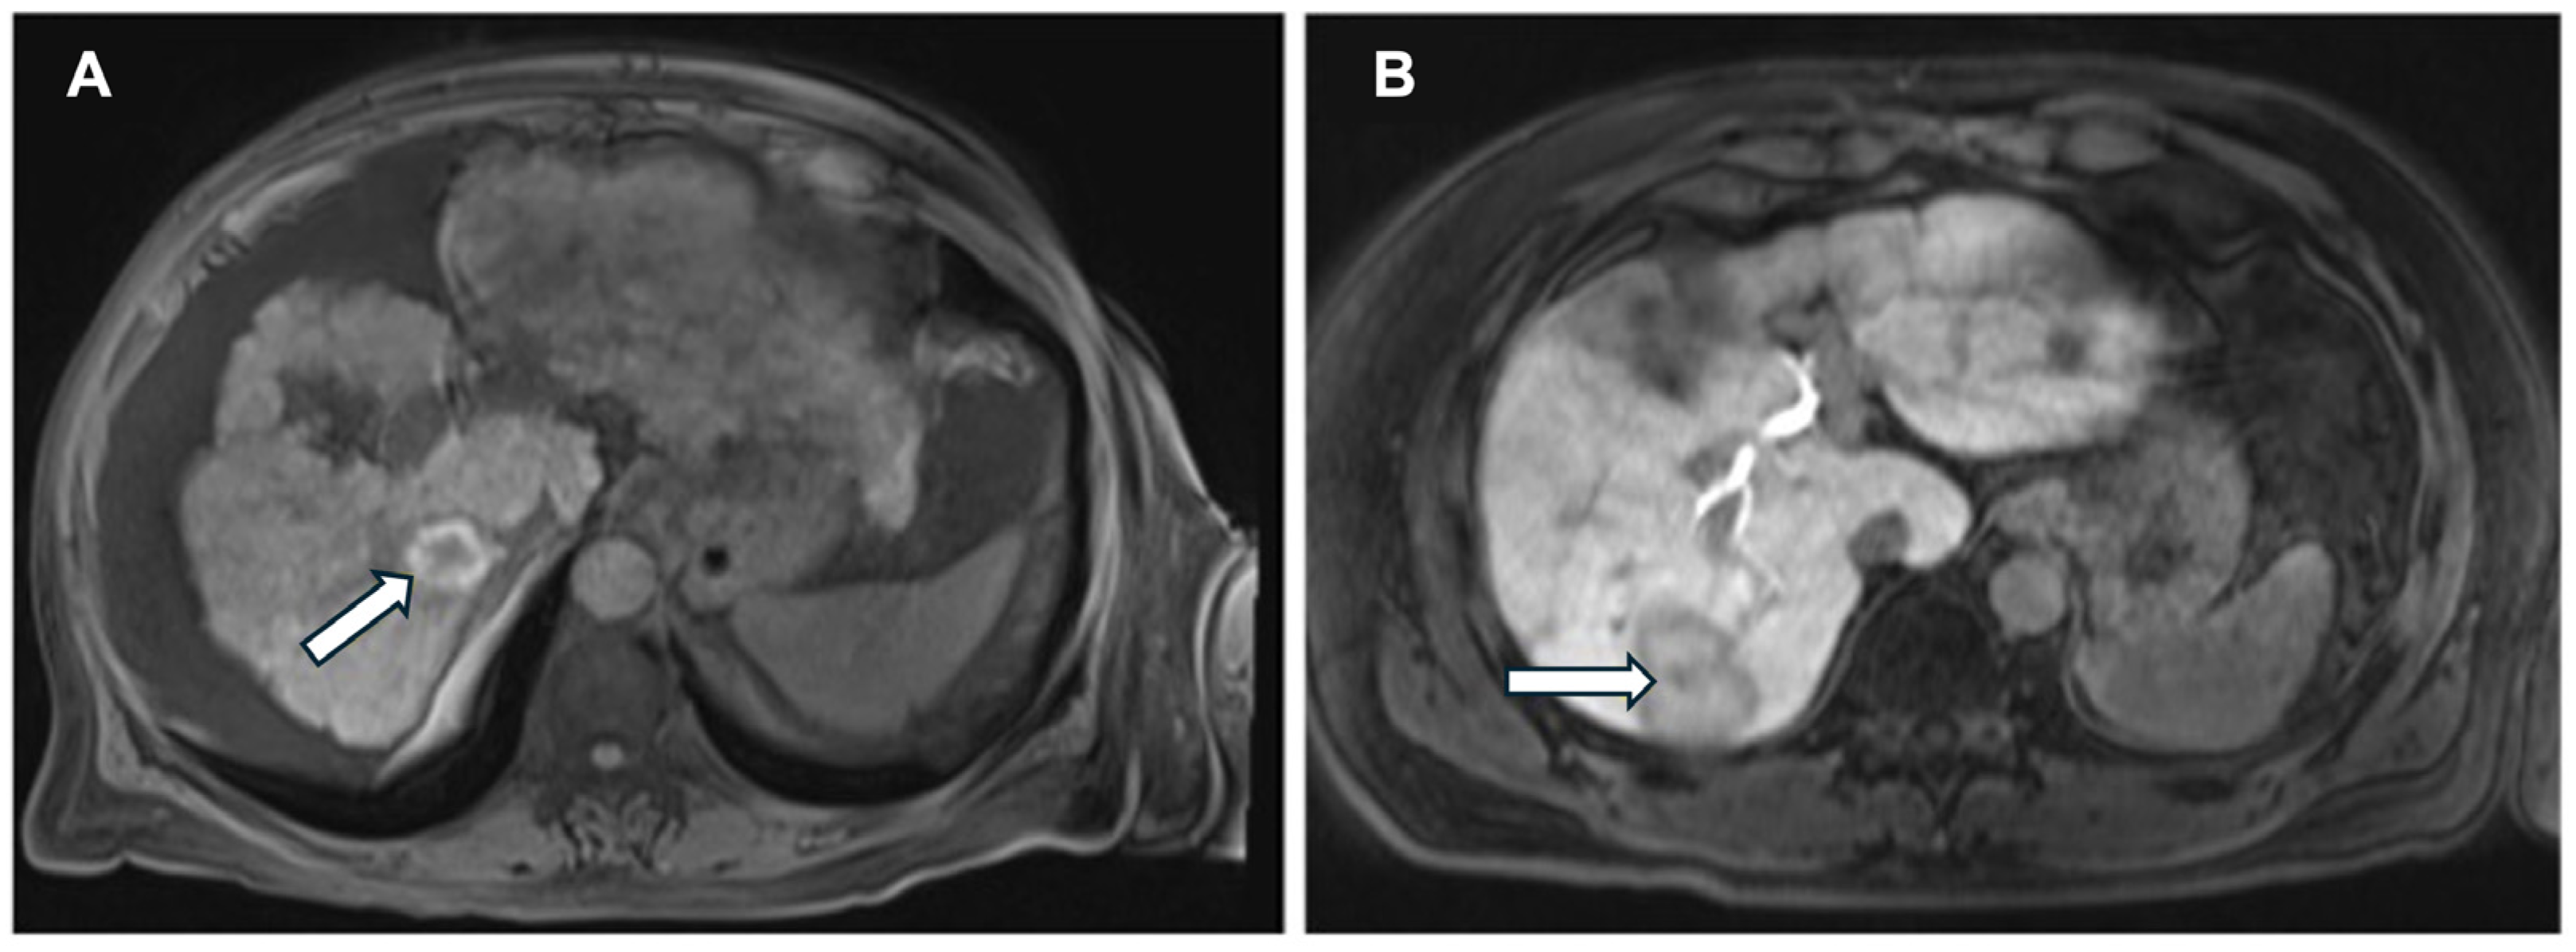
Image-guided percutaneous ablation is recognized as the therapy of choice for patients with early-stage HCC who are not candidates for surgery [2]. The goal of thermal ablation is to treat tumor tissue through the application of heat while minimizing thermal injury to nontarget organs [34]. The success of ablation therapy depends on accurately predicting the appropriate final ablation zone and margin, which is largely influenced by the power delivery and time. However, a key determinant of the final ablation zone is liver perfusion, which is influenced by underlying liver disease as well as the tumor’s vascular features (Figure 6) [23].
DCE-MRI has been explored for its potential to provide noninvasive, quantitative assessments of perfusion, which may help guide and evaluate ablation therapy. HCC tumor tissue can be heterogeneous with varying levels of internal perfusion [35]. Each focus of perfusion uniquely interacts with the thermal energy delivered by the ablation probe within the target zone. Areas with high vascularity may require higher amounts of energy to attain cytotoxic temperatures, and thus carry the risk of undertreatment and viable residual disease [36]. Conversely, areas with low vascularity may require less energy to adequately treat, with overtreatment potentially leading to inadvertent damage to nearby anatomy. Thus, it is critical to quantify the amount of perfusion that exists within the tumor and surrounding liver parenchyma. As such, mapping perfusion within and around the tumor could help inform and personalize ablation parameters. However, the clinical utility of quantitative DCE-MRI in this context remains largely investigational, lacking validation in large prospective trials, as demonstrated by the following studies.
Prior research has suggested that DCE-MRI may serve as a biomarker for assessing treatment response following thermal ablation [22,37]. In an early clinical study involving 50 patients, DCE was used to evaluate recurrent and residual HCC tumors following radiofrequency ablation, showing a decline in peri-ablated signal intensity over time [22]. Specifically, the proportion of patients with low T1 signal intensity in the peri-ablated zones on DCE-MRI decreased from 99% measured at 1 month to 11% at 4–6 months and only 7% after 9–12 months, respectively. This evolving signal pattern highlights DCE-MRI’s potential to detect subtle post-ablation tissue changes and to support long-term monitoring of tumor viability.
Supporting evidence from preclinical studies has further explored DCE-MRI’s potential to guide ablation therapy. In a porcine liver model, pharmacokinetic parameters Ktrans and kep were used to quantify perfusion changes after embolization and showed a significant inverse correlation with ablation zone size, suggesting that regions with lower baseline perfusion might require less energy to achieve complete necrosis [38]. Furthermore, the relationship between quantitative DCE-MRI PK parameters and microvessel density was investigated in a rabbit liver tumor model following RFA. The study found significant positive correlations between the Ktrans parameter and microvessel density in both the partially necrotic and viable tumor regions after radiofrequency ablation, indicating that Ktrans values reflect microvascular characteristics of liver tumors [24]. These results support the potential of DCE-MRI in generating imaging biomarkers for predicting response to ablation therapy. Additionally, Ktrans values have been found to be positively correlated with serum vascular endothelial growth factor (VEGF)—a protein regulating the growth of new blood vessels and vascular permeability [39]—levels in a rabbit liver cancer model under insufficient microwave ablation [25]. This observed correlation between VEGF and Ktrans further implicates the biological relevance of Ktrans measured by DCE-MRI in the context of thermal-ablation efficacy.
Overall, these findings reinforce the biological relevance of DCE-MRI biomarkers such as Ktrans as physiologically meaningful indicators of tumor vascularity and predictors of thermal ablation efficacy. In addition, these studies point to the potential of DCE-MRI in enhancing the precision of ablation by tailoring energy delivery to tumor perfusion characteristics. Taken together, these insights highlight the growing potential of DCE-MRI to guide and refine clinical ablation strategies for HCC.

4. DCE-MRI in Transarterial Chemoembolization (TACE)

TACE is an established standard of care treatment option for patients with intermediate-stage HCC [40]. The procedure involves the infusion of chemo-embolic agents through selective catheterization directly into the hepatic artery branches supplying the tumor [40]. Established reasons to perform TACE include reducing tumor burden to meet transplant criteria, controlling tumor progression in patients awaiting transplantation, and prolonging survival in those who are not candidates for transplant [40]. The success of the procedure depends on accurate targeting of the tumor and effective embolization. Despite known survival advantages, the local recurrence rate following TACE remains high, resulting in many patients requiring multiple treatment sessions to achieve an adequate response [41]. This underscores the need for better predictive biomarkers and response assessment tools, a role for which quantitative DCE-MRI is being actively investigated.
This frequent need for retreatment highlights the importance of accurately assessing tumor response following TACE to avoid unnecessary procedures while detecting early residual or recurrent disease. The lipiodol used in TACE can be difficult to distinguish from true residual disease when using contrast-enhanced CT. Although direct comparisons between PK parameters and conventional imaging assessments remain lacking, early preclinical findings suggest these parameters may reflect underlying tumor biology more objectively by providing quantitative metrics that differentiate HCC from normal liver parenchyma [42]. As such, DCE-MRI with pharmacokinetic modeling remains a promising yet investigational tool for improving post-TACE response evaluation and guiding future treatment strategies.
Recent studies have demonstrated the clinical value of both qualitative and quantitative DCE-MRI features in this context. One strategy involves using DCE-MRI to identify imaging biomarkers predictive of TACE response in HCC patients. This study measured the ability of DCE-MRI to evaluate post-TACE treatment response in 30 patients. Markers such as the absence of arterial-phase hyperenhancement correctly identified non-viable tumors, and the presence of arterial-phase hyperenhancement reliably indicated viable tumors [26]. Beyond visual assessment, emerging artificial intelligence (AI) technologies, including radiomics and deep learning models, have also been increasingly explored for their potential to enhance response prediction and treatment monitoring in TACE. A recent study investigated this approach in a cohort of 175 patients, incorporating a novel spatial–temporal graph neural network model utilizing pre-TACE DCE-MRI data to predict treatment response [27]. This predictive model accurately classified tumors into viable, non-viable, or equivocal categories while also predicting growth patterns and perfusion changes on follow-up imaging. Radiomics-based models have further expanded the predictive utility of DCE-MRI. A multicenter study combined radiomic features from DCE-MRI with clinical variables to develop a logistic regression model that showed strong predictive ability for tumor response. This multicenter study identified 11 DCE-MRI radiomics features associated with tumor heterogeneity. In the training set, their radiomics model achieved an AUC of 0.83 for predicting tumor response, while a model based on clinical variables alone yielded an AUC of 0.77. These findings suggest that an MRI-based nomogram can effectively predict short-term response to TACE in HCC patients with tumors smaller than 5 cm [28]. Collectively, these findings highlight the feasibility of qualitative DCE-MRI to measure TACE outcomes.
In addition to imaging features, quantitative DCE-MRI parameters like distribution volume (DV) and Ktrans have shown promise in evaluating treatment efficacy. A recent clinical study investigated the correlation between DV and Ktrans of Gd-EOB-DTPA and sorafenib-combined TACE response in stage B or C HCC patients [30]. This study found that patients who responded to TACE exhibited a significant decrease in Ktrans between pre-TACE and 3–10 days post-TACE. There was also a significant difference in DV between responders and non-responders at 3 and 10 days post-TACE. This study provides valuable insights into post-TACE angiogenesis, particularly changes in arterial and portal venous flows, which play a crucial role in disease progression and recurrence [42]. Moreover, DCE-MRI-derived semiquantitative metrics such as the time to peak parameter in subjects after TACE treatment have been shown to help differentiate post-TACE inflammation and necrosis from viable residual tumor, despite overlapping imaging features on conventional MRI [29]. These results validate the utility of DCE-MRI in quantifying the embolic effects of TACE and underscore the need for larger-scale studies to evaluate how such biomarkers predict tumor response and impact clinical decision-making.
Another study showed that the combination of TACE and the anti-angiogenic drug Sunitinib significantly reduced Ktrans [31]. This reduction in Ktrans implicated a positive tumor response to the treatment. The sensitivity of DCE-MRI to early anti-angiogenic effects has also been noted in studies of other liver tumors, such as colorectal cancer metastases. For instance, following treatment with agents like Bevacizumab, DCE-MRI can detect decreased Ktrans and kep as early as one week post-anti-angiogenic treatment [43]. Furthermore, a decrease in these perfusion parameters compared to baseline was found to be correlated with longer survival outcomes and better response to Sunitinib treatment [31]. Overall, these findings highlight the potential of semiquantitative and quantitative biomarkers for predicting TACE response and guiding treatment decisions, including the combination of TACE with anti-angiogenic agents.
Collectively, these findings highlight the emerging potential of various DCE-MRI approaches, from qualitative visual assessment to quantitative AI-driven radiomics to quantitative biomarkers of embolic effects, in evaluating and predicting TACE outcomes. Advancements in artificial intelligence, including radiomics and deep learning models, particularly in the space of TACE response, may further enhance the predictive capabilities of DCE-MRI, allowing for more precise identification of patients who may benefit from TACE.

5. DCE-MRI in 90Y Mapping and Dosimetry

90Y TARE is a locoregional treatment modality historically performed primarily with palliative intent for patients with advanced disease or for those who failed to respond to other therapies [44]. Recent findings from the LEGACY (Local radioEmbolization using Glass Microspheres for the Assessment of Tumor Control with Y-90) study have demonstrated the efficacy of 90Y TARE using radiation segmentectomy in early-stage HCC [45]. 90Y TARE involves the injection of radioactive microspheres into the hepatic artery, which then lodge in the tumor’s microvasculature and deliver a localized radiation dose to the tumor tissue over time [44]. The success of this therapy is dependent on accurate dosimetry, which ensures that the tumor receives an adequate radiation dose while minimizing exposure to nontarget structures. Optimizing the tumor microsphere density has been proposed as a key factor in achieving favorable 90Y treatment outcomes [46]. In the DOSISPHERE-01 trial, study analysis demonstrated that personalized dosimetry significantly improved overall survival compared to standard dosimetry [47]. While the data are promising, heterogeneity in bead distribution within the tumor has not been well evaluated and is hypothesized to contribute to suboptimal rates of complete pathological necrosis [48]. This highlights the critical need for optimizing dose delivery based on individual tumor characteristics to enhance therapeutic efficacy.
When ordering a 90Y TARE dose, the operator is able to control two aspects of the therapy: the prescribed activity and the quantity of microspheres [49]. Achieving the optimal microsphere particle density in 90Y TARE is a delicate balance where, on one hand, a low particle density may lead to gaps between particles, diminishing the effective dose [50], while on the other hand, a high particle density could induce tumor hypoxia, rendering the tumors resistant to radiation [51]. Additionally, particles initially flow preferentially to the most vascularized regions of the tumor. Once these vessels are embolized, the particles then move to less vascular areas of the tumor and eventually to normal liver tissue, resulting in a dynamic distribution of microspheres as more are delivered [49]. Dosimetry for 90Y TARE relies on pre-treatment imaging, typically using Tc-99m macroaggregated albumin (MAA) SPECT scans, to simulate the distribution of 90Y microspheres. However, the MAA distribution often does not perfectly match the actual microsphere distribution, leading to discrepancies in the predicted versus actual radiation dose delivered to the tumor and surrounding tissues. Factors such as catheter positioning, tumor vascularity, and variations in blood flow can all affect the distribution of both MAA and 90Y microspheres [33]. These challenges underscore the importance of more precise imaging approaches that can improve dosimetry accuracy and better predict microsphere distribution, an area where DCE-MRI shows early, albeit investigational, promise.
DCE-MRI presents a promising tool for refining personalized dosimetry by providing quantitative insights into tumor perfusion and vascular heterogeneity. DCE-MRI could be used to refine dosimetry by mapping areas of high and low vascularity, thus guiding delivery to determine the optimal microsphere density and dose distribution [52]. Limited research has focused on optimizing microsphere distribution, a critical factor in the success of 90Y TARE therapy. While the clinical literature in this space remains nascent, several pilot studies have explored the potential role of DCE-MRI to improve patient stratification and therapy planning. A recent study conducted on 25 patients who underwent TARE utilizing 90Y resin or glass microspheres compared the use of DCE-MRI with Tc-99m MAA SPECT scans to estimate lung shunt fraction (LSF), a key parameter in treatment planning. Elevated intrahepatic arteriovenous shunting can divert microspheres away from the tumor and into the lungs, increasing the risk of radiation pneumonitis [53]. In addition, lung shunting may reduce the delivered dose to the tumor, compromising treatment efficacy [54]. The study found a significant correlation between the velocity |u| of blood flow obtained through quantitative transport mapping (QTM) and the LSF derived from SPECT post Tc-99m administration [33]. This approach capitalizes on DCE-MRI’s ability to capture changes in tumor blood flow and vasculature, correlating significantly with LSF and potentially eliminating the need for additional mapping procedures. Beyond perfusion assessment to predict bead distribution, pre-treatment DCE-MRI parameters have shown potential for the stratification of patients who are most likely to respond to radioembolization. A study evaluating histogram-based DCE-MRI tissue perfusion parameters in 25 patients at 6 weeks and 6–12 months post-TARE assessed arterial flow (Fa), portal venous flow (Fp), total flow (Ft), arterial fraction, mean transit time, interstitial volume (ve), intracellular uptake rate (Ki), and uptake fraction (fi) [32]. The analysis found that tumors with low heterogeneity prior to treatment, as measured by standard deviation and skewness, were more likely to achieve complete response to low-dose TARE within 6 weeks. These findings suggest that baseline histogram analysis of DCE-MRI data could be useful for stratifying patients more likely to respond to radioembolization.
By capturing spatial differences in vascularity, DCE-MRI has the potential to inform predictions of microsphere distribution and improve dose targeting. Preliminary studies have also indicated that baseline perfusion metrics may correlate with treatment response, raising the possibility that DCE-MRI could one day contribute to patient stratification, personalized dosimetry, and response monitoring. However, these findings remain exploratory, and larger, prospective studies are needed to validate the technique’s feasibility and clinical utility. Future work should focus on expanding patient cohorts and directly comparing DCE-MRI with existing dosimetry approaches to validate its potential in guiding personalized TARE strategies.

6. Limitations in DCE-MRI

Leveraging DCE-MRI for the purposes of guiding locoregional therapies presents several challenges and limitations. One major hurdle is the technical complexity of acquiring and interpreting DCE-MRI data. Achieving high temporal resolution is critical for capturing the dynamics of contrast agent distribution for quantitative analysis, as insufficient temporal resolution can lead to the underestimation of Ktrans and kep and the overestimation of vp [55]. However, achieving high temporal resolution often requires a trade-off with spatial resolution [55]. In addition, breathing motion during dynamic, time-series data acquisition can introduce motion artifacts that limit the precision of calculated parameters during DCE-MRI. Image registration to correct for the liver motion is challenging, as pixel intensity variations can occur during both spatial displacement and contrast agent uptake, complicating voxel-based analysis [56]. Coordinating image acquisition with the timing of breath holds during this narrow temporal window can be difficult, potentially compromising image quality and the consistency of perfusion measurements [57].
Beyond data acquisition, deriving clinically relevant quantitative perfusion parameters adds another layer of complexity, as the PK models used to interpret DCE-MRI data may not perfectly fit the observed patterns. This is because the models make assumptions that may not be completely physiologically valid, such as the assumption of uniform dispersion of the arterial input throughout an organ [58]. Additionally, due to the discrete nature of data acquisition, gaps in the time–intensity curves may lead to the loss of critical details in the arterial input function, potentially affecting the accuracy of perfusion measurements [59].
Further complicating the clinical translation of DCE-MRI is the variability in the quantitative imaging biomarkers derived from DCE-MRI. The process of obtaining PK parameters involves multiple steps in data acquisition and analysis, introducing inconsistencies due to differences in imaging protocols, scanner platforms, computational algorithms, and software tools. These inconsistencies can compromise the accuracy and reproducibility of derived PK parameters, ultimately reducing their predictive value and increasing the sample sizes required for clinical trials to achieve statistical significance.
For the clinical adoption of DCE-MRI, these challenges must be addressed by improving image acquisition approaches to increase temporal resolution without compromising spatial resolution, image registration approaches to align the images acquired at different time points, and consistent modeling approaches to compare the effectiveness of various PK models.

7. Limitations in Clinical Translation

The implementation of DCE-MRI into routine clinical workflows for guiding locoregional therapy faces several logistical and practical hurdles. Currently, pre-procedural DCE-MRI is not a standard part of treatment planning for HCC, and imaging data derived from such scans are not routinely used to inform procedural decisions. This is due in part to limited protocol standardization [60], longer acquisition and processing times [61], and the need for expertise in pharmacokinetic modeling and interpretation. Additionally, although promising, its clinical value remains under investigation, which contributes significantly to its limited integration into standard treatment planning for HCC [62]. Such factors can pose barriers to integration. In addition to workflow hurdles, several biological barriers hinder widespread adoption. HCC arises in the context of underlying liver disease, which varies significantly across patients in terms of cirrhosis severity, vascular architecture, and hepatic function [63]. These factors influence contrast kinetics and complicate the interpretation of perfusion parameters. Moreover, the tumor biology of HCC is heterogeneous, and differences in vascularity, differentiation, and microenvironment may affect DCE-MRI measurements and their predictive value [64]. These patient- and tumor-level variables challenge the generalizability of findings derived from small or highly selected study populations.
To date, the use of DCE-MRI in HCC has largely been confined to research settings, particularly in early-phase clinical trials evaluating anti-angiogenic therapies, where it has served as a biomarker of tumor vascular response [65,66]. However, its application in guiding locoregional therapies remains relatively underexplored, with most studies focusing on feasibility assessments rather than clinical implementation. Furthermore, a large portion of research in this area is preclinical. While preclinical findings are promising, their clinical relevance is constrained by the difficulty in translating results from small models to larger patient populations. In addition, there are currently no high-level clinical studies demonstrating an increase in median overall survival with the utilization of DCE-MRI to monitor locoregional therapies such as ablation. This limitation is primarily due to the challenges associated with conducting randomized controlled trials in interventional radiology. Additionally, the lack of pre-procedure imaging further limits the clinical implementation of DCE-MRI.
As the field progresses, it will be crucial to address the logistical and biological barriers to integration. Larger, multicenter clinical trials with more diverse patient cohorts are needed to establish the clinical validity and reproducibility of DCE-MRI across various stages and subtypes of HCC. Protocol standardization in acquisition, post-processing, and pharmacokinetic modeling will be crucial to widespread implementation. Given the heterogeneity of HCC tumor biology and pathological features, future studies should seek to integrate DCE-MRI data with other clinical and imaging biomarkers, such as liver function scores, radiomics, or genomic markers, to refine patient selection and personalize treatment plans. Ultimately, demonstrating that quantitative DCE-MRI can enhance the accuracy of treatment response assessment and improve patient outcomes will be fundamental in securing its position as a standard tool in guiding locoregional therapies for HCC.

8. Conclusions

In conclusion, DCE-MRI presents a promising imaging technique for quantifying liver and tumor perfusion, with the potential to refine treatment strategies and improve patient outcomes in the future. However, realizing this significant potential is contingent upon addressing significant challenges that currently hinder its widespread clinical adoption. These primarily involve standardizing imaging protocols and validating quantitative models to interpret the complex perfusion patterns observed in HCC tumors accurately.
In the context of ablation therapies, DCE-MRI could offer valuable insights into tumor microvascular characteristics, potentially guiding energy delivery during thermal ablation. For TACE, quantitative DCE-MRI parameters such as Ktrans may serve as biomarkers for assessing treatment response and predicting tumor recurrence, especially when combined with molecular-targeted therapies. For 90Y TARE, quantitative DCE-MRI could improve dosimetry planning by providing more accurate assessments of tumor vascularity and microsphere distribution.
While these possibilities are promising, it is clear that quantitative DCE-MRI is not yet a routine part of clinical practice or has established guidelines for guiding locoregional therapies. Consequently, a concerted effort in further research and validation is needed before it can be reliably integrated into treatment planning. This essential next phase of research should prioritize large-scale prospective multicenter trials to confirm preliminary efficacy, collaborative efforts for technical standardization, and studies directly comparing DCE-MRI guided strategies with current standards of care.
If these challenges are successfully navigated, DCE-MRI could become a pivotal tool in personalizing treatment strategies for HCC, ultimately leading to improved patient care and potentially, enhanced survival outcomes.

Author Contributions

Conceptualization, J.C., K.S., and X.M.L.; writing—original draft preparation, X.M.L. and T.N.; writing—review and editing, J.C., K.S., and H.D.S.; supervision, J.C. and K.S. All authors have read and agreed to the published version of the manuscript.

Funding

The authors acknowledge grant support from the RSNA Research Scholar Grant RSCH2303, NIH UL1TR001881, and a UCLA Department of Radiological Sciences Exploratory Grant.

Data Availability Statement

Data sharing does not apply to this article as no new data were created or analyzed in this study.

Acknowledgments

The authors gratefully acknowledge all who provided support and feedback during the preparation of this manuscript.

Conflicts of Interest

The authors declare no conflicts of interest.

Abbreviations

The following abbreviations are used in this manuscript:
DCE-MRIDynamic Contrast-Enhanced Magnetic Resonance Imaging
LRTLocoregional Therapies
HCCHepatocellular Carcinoma
RFARadiofrequency Ablation
MWAMicrowave Ablation
TACETransarterial Chemoembolization
TARETransarterial Radioembolization
BCLCBarcelona Clinic Liver Cancer
CE-MRIContrast-Enhanced Magnetic Resonance Imaging
PKPharmacokinetic

References

  1. Foglia, B.; Turato, C.; Cannito, S. Hepatocellular Carcinoma: Latest Research in Pathogenesis, Detection and Treatment. Int. J. Mol. Sci. 2023, 24, 12224. [Google Scholar] [CrossRef]
  2. Reig, M.; Forner, A.; Rimola, J.; Ferrer-Fàbrega, J.; Burrel, M.; Garcia-Criado, Á.; Kelley, R.K.; Galle, P.R.; Mazzaferro, V.; Salem, R.; et al. BCLC strategy for prognosis prediction and treatment recommendation: The 2022 update. J. Hepatol. 2022, 76, 681–693. [Google Scholar] [CrossRef]
  3. Marrero, J.A.; Kulik, L.M.; Sirlin, C.B.; Zhu, A.X.; Finn, R.S.; Abecassis, M.M.; Roberts, L.R.; Heimbach, J.K. Diagnosis, Staging, and Management of Hepatocellular Carcinoma: 2018 Practice Guidance by the American Association for the Study of Liver Diseases. Hepatology 2018, 68, 723–750. [Google Scholar] [CrossRef]
  4. Liu, K.; Zhang, X.; Xu, W.; Chen, J.; Yu, J.; Gamble, J.R.; McCaughan, G.W. Targeting the vasculature in hepatocellular carcinoma treatment: Starving versus normalizing blood supply. Clin. Transl. Gastroenterol. 2017, 8, e98. [Google Scholar] [CrossRef]
  5. Ronot, M.; Leporq, B.; Van Beers, B.E.; Vilgrain, V. CT and MR perfusion techniques to assess diffuse liver disease. Abdom. Radiol. 2020, 45, 3496–3506. [Google Scholar] [CrossRef]
  6. Wake, N.; Chandarana, H.; Rusinek, H.; Fujimoto, K.; Moy, L.; Sodickson, D.K.; Kim, S.G. Accuracy and precision of quantitative DCE-MRI parameters: How should one estimate contrast concentration? Magn. Reson. Imaging 2018, 52, 16–23. [Google Scholar] [CrossRef]
  7. Consul, N.; Sirlin, C.B.; Chernyak, V.; Fetzer, D.T.; Masch, W.R.; Arora, S.S.; Do, R.K.G.; Marks, R.M.; Fowler, K.J.; Borhani, A.A.; et al. Imaging Features at the Periphery: Hemodynamics, Pathophysiology, and Effect on LI-RADS Categorization. RadioGraphics 2021, 41, 1657–1675. [Google Scholar] [CrossRef]
  8. Hoffmann, E.; Masthoff, M.; Kunz, W.G.; Seidensticker, M.; Bobe, S.; Gerwing, M.; Berdel, W.E.; Schliemann, C.; Faber, C.; Wildgruber, M. Multiparametric MRI for characterization of the tumour microenvironment. Nat. Rev. Clin. Oncol. 2024, 21, 428–448. [Google Scholar] [CrossRef]
  9. Tian, Y.; Adluru, G. Dynamic Contrast-Enhanced MRI: Basic Physics, Pulse Sequences, and Modeling; Elsevier: Amsterdam, The Netherlands, 2020; pp. 321–344. [Google Scholar]
  10. Shukla-Dave, A.; Obuchowski, N.A.; Chenevert, T.L.; Jambawalikar, S.; Schwartz, L.H.; Malyarenko, D.; Huang, W.; Noworolski, S.M.; Young, R.J.; Shiroishi, M.S.; et al. Quantitative imaging biomarkers alliance (QIBA) recommendations for improved precision of DWI and DCE-MRI derived biomarkers in multicenter oncology trials. J. Magn. Reson. Imaging 2019, 49, e101–e121. [Google Scholar] [CrossRef]
  11. Aronhime, S.; Calcagno, C.; Jajamovich, G.H.; Dyvorne, H.A.; Robson, P.; Dieterich, D.; Isabel Fiel, M.; Martel-Laferriere, V.; Chatterji, M.; Rusinek, H.; et al. DCE-MRI of the liver: Effect of linear and nonlinear conversions on hepatic perfusion quantification and reproducibility. J. Magn. Reson. Imaging 2014, 40, 90–98. [Google Scholar] [CrossRef]
  12. Knight, S.P.; Meaney, J.F.; Fagan, A.J. DCE-MRI protocol for constraining absolute pharmacokinetic modeling errors within specific accuracy limits. Med. Phys. 2019, 46, 3592–3602. [Google Scholar] [CrossRef] [PubMed]
  13. Chen, B.-B. DCE-MRI in hepatocellular carcinoma-clinical and therapeutic image biomarker. World J. Gastroenterol. 2014, 20, 3125. [Google Scholar] [CrossRef]
  14. Khalifa, F.; Soliman, A.; El-Baz, A.; Abou El-Ghar, M.; El-Diasty, T.; Gimel’Farb, G.; Ouseph, R.; Dwyer, A.C. Models and methods for analyzing DCE-MRI: A review. Med. Phys. 2014, 41, 124301. [Google Scholar] [CrossRef]
  15. Fritz-Hansen, T.; Rostrup, E.; Larsson, H.B.W.; Søndergaard, L.; Ring, P.; Henriksen, O. Measurement of the arterial concentration of Gd-DTPA using MRI: A step toward quantitative perfusion imaging. Magn. Reson. Med. 1996, 36, 225–231. [Google Scholar] [CrossRef] [PubMed]
  16. Parker, G.J.M.; Roberts, C.; Macdonald, A.; Buonaccorsi, G.A.; Cheung, S.; Buckley, D.L.; Jackson, A.; Watson, Y.; Davies, K.; Jayson, G.C. Experimentally-derived functional form for a population-averaged high-temporal-resolution arterial input function for dynamic contrast-enhanced MRI. Magn. Reson. Med. 2006, 56, 993–1000. [Google Scholar] [CrossRef] [PubMed]
  17. Sourbron, S.P.; Buckley, D.L. Tracer kinetic modelling in MRI: Estimating perfusion and capillary permeability. Phys. Med. Biol. 2012, 57, R1–R33. [Google Scholar] [CrossRef]
  18. Bell, L.C.; Suzuki, Y.; Van Houdt, P.J.; Sourbron, S.; Mutsaerts, H.J.M.M. The road to the ISMRM OSIPI: A community-led initiative for reproducible perfusion MRI. Magn. Reson. Med. 2024, 91, 1740–1742. [Google Scholar] [CrossRef]
  19. Tofts, P.S. Modeling tracer kinetics in dynamic Gd-DTPA MR imaging. J. Magn. Reson. Imaging 1997, 7, 91–101. [Google Scholar] [CrossRef] [PubMed]
  20. Tofts, P.S.; Brix, G.; Buckley, D.L.; Evelhoch, J.L.; Henderson, E.; Knopp, M.V.; Larsson, H.B.W.; Lee, T.-Y.; Mayr, N.A.; Parker, G.J.M.; et al. Estimating kinetic parameters from dynamic contrast-enhanced t1-weighted MRI of a diffusable tracer: Standardized quantities and symbols. J. Magn. Reson. Imaging 1999, 10, 223–232. [Google Scholar] [CrossRef]
  21. Brix, G.; Kiessling, F.; Lucht, R.; Darai, S.; Wasser, K.; Delorme, S.; Griebel, J. Microcirculation and microvasculature in breast tumors: Pharmacokinetic analysis of dynamic MR image series. Magn. Reson. Med. 2004, 52, 420–429. [Google Scholar] [CrossRef] [PubMed]
  22. Mostafa, M.M.S. Diffusion weighted and dynamic contrast enhanced magnetic resonance imaging in assessment of malignant liver tumors after percutaneous radiofrequency ablation. Egypt. J. Radiol. Nucl. Med. 2016, 47, 1195–1205. [Google Scholar] [CrossRef]
  23. Chiang, J.; Cristescu, M.; Lee, M.H.; Moreland, A.; Hinshaw, J.L.; Lee, F.T.; Brace, C.L. Effects of Microwave Ablation on Arterial and Venous Vasculature after Treatment of Hepatocellular Carcinoma. Radiology 2016, 281, 617–624. [Google Scholar] [CrossRef] [PubMed]
  24. Moon, J.; Kim, J.H.; Choi, D.; Yang, J.; Lee, M.W.; Choi, Y.L.; Rhim, M.H. Correlation of quantitative dynamic contrast-enhanced MRI with microvascular density in necrotic, partial necrotic, and viable liver tumors in a rabbit model. J. Appl. Clin. Med. Phys. 2016, 17, 418–427. [Google Scholar] [CrossRef] [PubMed]
  25. Ren, Z.; Feng, G.; Li, B.; Zhang, C.; Du, Y. Dynamic contrast-enhanced magnetic resonance imaging assessment of residual tumor angiogenesis after insufficient microwave ablation and donafenib adjuvant therapy. Sci. Rep. 2024, 14, 4557. [Google Scholar] [CrossRef]
  26. Saleh, T.Y.; Bahig, S.; Shebrya, N.; Ahmed, A.Y. Value of dynamic and DWI MRI in evaluation of HCC viability after TACE via LI-RADS v2018 diagnostic algorithm. Egypt. J. Radiol. Nucl. Med. 2019, 50, 113. [Google Scholar] [CrossRef]
  27. Svecic, A.; Mansour, R.; Tang, A.; Kadoury, S. Prediction of post transarterial chemoembolization MR images of hepatocellular carcinoma using spatio-temporal graph convolutional networks. PLoS ONE 2021, 16, e0259692. [Google Scholar] [CrossRef]
  28. Kuang, Y.; Li, R.; Jia, P.; Ye, W.; Zhou, R.; Zhu, R.; Wang, J.; Lin, S.; Pang, P.; Ji, W. MRI-Based Radiomics: Nomograms predicting the short-term response after transcatheter arterial chemoembolization (TACE) in hepatocellular carcinoma patients with diameter less than 5 cm. Abdom. Radiol. 2021, 46, 3772–3789. [Google Scholar] [CrossRef]
  29. Thibodeau-Antonacci, A.; Petitclerc, L.; Gilbert, G.; Bilodeau, L.; Olivié, D.; Cerny, M.; Castel, H.; Turcotte, S.; Huet, C.; Perreault, P.; et al. Dynamic contrast-enhanced MRI to assess hepatocellular carcinoma response to Transarterial chemoembolization using LI-RADS criteria: A pilot study. Magn. Reson. Imaging 2019, 62, 78–86. [Google Scholar] [CrossRef]
  30. Saito, K.; Ledsam, J.; Sugimoto, K.; Sourbron, S.; Araki, Y.; Tokuuye, K. DCE-MRI for Early Prediction of Response in Hepatocellular Carcinoma after TACE and Sorafenib Therapy: A Pilot Study. J. Belg. Soc. Radiol. 2018, 102, 40. [Google Scholar] [CrossRef]
  31. Pokuri, V.K.; Tomaszewski, G.M.; Ait-Oudhia, S.; Groman, A.; Khushalani, N.I.; Lugade, A.A.; Thanavala, Y.; Ashton, E.A.; Grande, C.; Fetterly, G.J.; et al. Efficacy, Safety, and Potential Biomarkers of Sunitinib and Transarterial Chemoembolization (TACE) Combination in Advanced Hepatocellular Carcinoma (HCC). Am. J. Clin. Oncol. 2018, 41, 332–338. [Google Scholar] [CrossRef] [PubMed]
  32. Hectors, S.J.; Lewis, S.; Kennedy, P.; Bane, O.; Said, D.; Segall, M.; Schwartz, M.; Kim, E.; Taouli, B. Assessment of Hepatocellular Carcinoma Response to 90Y Radioembolization Using Dynamic Contrast Material–enhanced MRI and Intravoxel Incoherent Motion Diffusion-weighted Imaging. Radiol. Imaging Cancer 2020, 2, e190094. [Google Scholar] [CrossRef] [PubMed]
  33. Zhang, Q.; Lee, K.S.; Talenfeld, A.D.; Spincemaille, P.; Prince, M.R.; Wang, Y. Prediction of Lung Shunt Fraction for Yttrium-90 Treatment of Hepatic Tumors Using Dynamic Contrast Enhanced MRI with Quantitative Perfusion Processing. Tomography 2022, 8, 2687–2697. [Google Scholar] [CrossRef]
  34. Llovet, J.M.; De Baere, T.; Kulik, L.; Haber, P.K.; Greten, T.F.; Meyer, T.; Lencioni, R. Locoregional therapies in the era of molecular and immune treatments for hepatocellular carcinoma. Nat. Rev. Gastroenterol. Hepatol. 2021, 18, 293–313. [Google Scholar] [CrossRef]
  35. Hectors, S.J.; Wagner, M.; Bane, O.; Besa, C.; Lewis, S.; Remark, R.; Chen, N.; Fiel, M.I.; Zhu, H.; Gnjatic, S.; et al. Quantification of hepatocellular carcinoma heterogeneity with multiparametric magnetic resonance imaging. Sci. Rep. 2017, 7, 2452. [Google Scholar] [CrossRef] [PubMed]
  36. Tan, J.; Tang, T.; Zhao, W.; Zhang, Z.-S.; Xiao, Y.-D. Initial Incomplete Thermal Ablation Is Associated With a High Risk of Tumor Progression in Patients With Hepatocellular Carcinoma. Front. Oncol. 2021, 11, 760173. [Google Scholar] [CrossRef]
  37. Zhu, Y.; Feng, B.; Wang, P.; Wang, B.; Cai, W.; Wang, S.; Meng, X.; Wang, S.; Zhao, X.; Ma, X. Bi-regional dynamic contrast-enhanced MRI for prediction of microvascular invasion in solitary BCLC stage A hepatocellular carcinoma. Insights Imaging 2024, 15, 149. [Google Scholar] [CrossRef]
  38. Chiang, J.; Sparks, H.; Rink, J.S.; Meloni, M.F.; Hao, F.; Sung, K.H.; Lee, E.W. Dynamic Contrast-Enhanced MR Imaging Evaluation of Perfusional Changes and Ablation Zone Size after Combination Embolization and Ablation Therapy. J. Vasc. Interv. Radiol. 2023, 34, 253–260. [Google Scholar] [CrossRef]
  39. Zhan, N.; Dong, W.-G.; Wang, J. The clinical significance of vascular endothelial growth factor in malignant ascites. Tumor Biol. 2016, 37, 3719–3725. [Google Scholar] [CrossRef]
  40. Lucatelli, P.; Burrel, M.; Guiu, B.; De Rubeis, G.; Van Delden, O.; Helmberger, T. CIRSE Standards of Practice on Hepatic Transarterial Chemoembolisation. Cardiovasc. Interv. Radiol. 2021, 44, 1851–1867. [Google Scholar] [CrossRef]
  41. Chen, S.; Peng, Z.; Zhang, Y.; Chen, M.; Li, J.; Guo, R.; Li, J.; Li, B.; Mei, J.; Feng, S.; et al. Lack of Response to Transarterial Chemoembolization for Intermediate-Stage Hepatocellular Carcinoma: Abandon or Repeat? Radiology 2021, 298, 680–692. [Google Scholar] [CrossRef] [PubMed]
  42. Taouli, B.; Johnson, R.S.; Hajdu, C.H.; Oei, M.T.H.; Merad, M.; Yee, H.; Rusinek, H. Hepatocellular Carcinoma: Perfusion Quantification With Dynamic Contrast-Enhanced MRI. Am. J. Roentgenol. 2013, 201, 795–800. [Google Scholar] [CrossRef] [PubMed]
  43. Hirashima, Y.; Yamada, Y.; Tateishi, U.; Kato, K.; Miyake, M.; Horita, Y.; Akiyoshi, K.; Takashima, A.; Okita, N.; Takahari, D.; et al. Pharmacokinetic parameters from 3-Tesla DCE-MRI as surrogate biomarkers of antitumor effects of bevacizumab plus FOLFIRI in colorectal cancer with liver metastasis. Int. J. Cancer 2012, 130, 2359–2365. [Google Scholar] [CrossRef]
  44. Miller, F.H.; Lopes Vendrami, C.; Gabr, A.; Horowitz, J.M.; Kelahan, L.C.; Riaz, A.; Salem, R.; Lewandowski, R.J. Evolution of Radioembolization in Treatment of Hepatocellular Carcinoma: A Pictorial Review. RadioGraphics 2021, 41, 1802–1818. [Google Scholar] [CrossRef]
  45. Salem, R.; Johnson, G.E.; Kim, E.; Riaz, A.; Bishay, V.; Boucher, E.; Fowers, K.; Lewandowski, R.; Padia, S.A. Yttrium-90 Radioembolization for the Treatment of Solitary, Unresectable HCC: The LEGACY Study. Hepatology 2021, 74, 2342–2352. [Google Scholar] [CrossRef]
  46. Boas, F.E.; Maxwell, A.W.P. Beyond Mean Tumor Dose: The Importance of Particle Density in Radioembolization. J. Vasc. Interv. Radiol. 2023, 34, 1235–1236. [Google Scholar] [CrossRef]
  47. Garin, E.; Tselikas, L.; Guiu, B.; Chalaye, J.; Edeline, J.; De Baere, T.; Assenat, E.; Tacher, V.; Robert, C.; Terroir-Cassou-Mounat, M.; et al. Personalised versus standard dosimetry approach of selective internal radiation therapy in patients with locally advanced hepatocellular carcinoma (DOSISPHERE-01): A randomised, multicentre, open-label phase 2 trial. Lancet Gastroenterol. Hepatol. 2021, 6, 17–29. [Google Scholar] [CrossRef] [PubMed]
  48. Gabr, A.; Riaz, A.; Johnson, G.E.; Kim, E.; Padia, S.; Lewandowski, R.J.; Salem, R. Correlation of Y90-absorbed radiation dose to pathological necrosis in hepatocellular carcinoma: Confirmatory multicenter analysis in 45 explants. Eur. J. Nucl. Med. Mol. Imaging 2021, 48, 580–583. [Google Scholar] [CrossRef]
  49. Maxwell, A.W.P.; Mendoza, H.G.; Sellitti, M.J.; Camacho, J.C.; Deipolyi, A.R.; Ziv, E.; Sofocleous, C.T.; Yarmohammadi, H.; Maybody, M.; Humm, J.L.; et al. Optimizing 90Y Particle Density Improves Outcomes After Radioembolization. Cardiovasc. Interv. Radiol. 2022, 45, 958–969. [Google Scholar] [CrossRef] [PubMed]
  50. Pasciak, A.S.; Abiola, G.; Liddell, R.P.; Crookston, N.; Besharati, S.; Donahue, D.; Thompson, R.E.; Frey, E.; Anders, R.A.; Dreher, M.R.; et al. The number of microspheres in Y90 radioembolization directly affects normal tissue radiation exposure. Eur. J. Nucl. Med. Mol. Imaging 2020, 47, 816–827. [Google Scholar] [CrossRef]
  51. Horsman, M.R.; Overgaard, J. The impact of hypoxia and its modification of the outcome of radiotherapy. J. Radiat. Res. 2016, 57, i90–i98. [Google Scholar] [CrossRef]
  52. Costa, G.; Spencer, B.; Omidvari, N.; Foster, C.; Rusnak, M.; Hunt, H.; Caudle, D.T.; Pillai, R.T.; Vu, C.T.; Roncali, E. Radioembolization Dosimetry with Total-Body 90Y PET. J. Nucl. Med. 2022, 63, 1101–1107. [Google Scholar] [CrossRef]
  53. Wehrenberg-Klee, E.; Gandhi, R.T.; Ganguli, S. Patient Selection and Clinical Outcomes of Y90 in Hepatocellular Carcinoma. Tech. Vasc. Interv. Radiol. 2019, 22, 70–73. [Google Scholar] [CrossRef]
  54. Vouche, M.; Habib, A.; Ward, T.J.; Kim, E.; Kulik, L.; Ganger, D.; Mulcahy, M.; Baker, T.; Abecassis, M.; Sato, K.T.; et al. Unresectable Solitary Hepatocellular Carcinoma Not Amenable to Radiofrequency Ablation: Multicenter Radiology-Pathology Correlation and Survival of Radiation Segmentectomy. Hepatology 2014, 60, 192–201. [Google Scholar] [CrossRef]
  55. Heisen, M.; Fan, X.; Buurman, J.; Van Riel, N.A.W.; Karczmar, G.S.; Ter Haar Romeny, B.M. The influence of temporal resolution in determining pharmacokinetic parameters from DCE-MRI data. Magn. Reson. Med. 2010, 63, 811–816. [Google Scholar] [CrossRef]
  56. Sun, Y.; Zhu, Q.; Huang, M.; Shen, D.; Zhou, Y.; Feng, Q. Liver DCE-MRI registration based on sparse recovery of contrast agent curves. Med. Phys. 2021, 48, 6916–6929. [Google Scholar] [CrossRef] [PubMed]
  57. Larson, A.C.; Wang, D.; Atassi, B.; Sato, K.T.; Ryu, R.K.; Lewandowski, R.J.; Nemcek, A.A.; Mulcahy, M.F.; Kulik, L.M.; Miller, F.H.; et al. Transcatheter Intraarterial Perfusion: MR Monitoring of Chemoembolization for Hepatocellular Carcinoma—Feasibility of Initial Clinical Translation. Radiology 2008, 246, 964–971. [Google Scholar] [CrossRef]
  58. Li, S.P.; Padhani, A.R. Tumor response assessments with diffusion and perfusion MRI. J. Magn. Reson. Imaging 2012, 35, 745–763. [Google Scholar] [CrossRef] [PubMed]
  59. Zheng, X.; Xiao, L.; Fan, X.; Huang, N.; Su, Z.; Xu, X. Free breathing DCE-MRI with motion correction and its values for benign and malignant liver tumor differentiation. Radiol. Infect. Dis. 2015, 2, 65–71. [Google Scholar] [CrossRef]
  60. Leach, M.O.; Brindle, K.M.; Evelhoch, J.L.; Griffiths, J.R.; Horsman, M.R.; Jackson, A.; Jayson, G.C.; Judson, I.R.; Knopp, M.V.; Maxwell, R.J.; et al. The assessment of antiangiogenic and antivascular therapies in early-stage clinical trials using magnetic resonance imaging: Issues and recommendations. Br. J. Cancer 2005, 92, 1599–1610. [Google Scholar] [CrossRef]
  61. Wáng, Y.X.J.; Wang, X.; Wu, P.; Wang, Y.; Chen, W.; Chen, H.; Li, J. Topics on quantitative liver magnetic resonance imaging. Quant. Imaging Med. Surg. 2019, 9, 1840–1890. [Google Scholar] [CrossRef]
  62. Mu, X.; Zhong, Y.; Zhang, X.; Qu, C. Early Diagnosis Value of DCE-MRI Hemodynamic Parameters in Hepatocellular Carcinoma. J. Oncol. 2022, 2022, 9556589. [Google Scholar] [CrossRef]
  63. Safri, F.; Nguyen, R.; Zerehpooshnesfchi, S.; George, J.; Qiao, L. Heterogeneity of hepatocellular carcinoma: From mechanisms to clinical implications. Cancer Gene Ther. 2024, 31, 1105–1112. [Google Scholar] [CrossRef] [PubMed]
  64. O’Connor, J.P.B.; Rose, C.J.; Jackson, A.; Watson, Y.; Cheung, S.; Maders, F.; Whitcher, B.J.; Roberts, C.; Buonaccorsi, G.A.; Thompson, G.; et al. DCE-MRI biomarkers of tumour heterogeneity predict CRC liver metastasis shrinkage following bevacizumab and FOLFOX-6. Br. J. Cancer 2011, 105, 139–145. [Google Scholar] [CrossRef] [PubMed]
  65. Yau, T.; Chen, P.-J.; Chan, P.; Curtis, C.M.; Murphy, P.S.; Suttle, A.B.; Gauvin, J.; Hodge, J.P.; Dar, M.M.; Poon, R.T. Phase I Dose-Finding Study of Pazopanib in Hepatocellular Carcinoma: Evaluation of Early Efficacy, Pharmacokinetics, and Pharmacodynamics. Clin. Cancer Res. 2011, 17, 6914–6923. [Google Scholar] [CrossRef] [PubMed]
  66. Duffy, A.G.; Ma, C.; Ulahannan, S.V.; Rahma, O.E.; Makarova-Rusher, O.; Cao, L.; Yu, Y.; Kleiner, D.E.; Trepel, J.; Lee, M.-J.; et al. Phase I and Preliminary Phase II Study of TRC105 in Combination with Sorafenib in Hepatocellular Carcinoma. Clin. Cancer Res. 2017, 23, 4633–4641. [Google Scholar] [CrossRef] [PubMed]
Figure 1. Conventional multi-phase contrast-enhanced MRI (CE-MRI) in a porcine model. This technique involves acquiring images at distinct, specific time points after contrast administration, typically corresponding to key vascular phases such as the pre-contrast, arterial, and portal venous phases shown. The red circle in the (top panel) indicates the voxel from which the signal intensity is measured to generate the curve in the bottom panel. The resulting signal intensity versus time curve (bottom panel) is sparsely sampled, given the small number of time points. Note the persistent aortic enhancement in the portal venous phase, reflecting the rapid arterial transit times observed in in vivo porcine models. All animal procedures were approved by the Institutional Animal Care and Use Committee (protocol ARC-2016-053) and performed in accordance with national guidelines.
Bioengineering 12 00870 g001
Figure 2. Dynamic contrast-enhanced MRI (DCE-MRI) for quantitative analysis in a porcine model. The red circle in the (top panel) indicates the voxel from which the signal intensity is measured. In contrast to conventional CE-MRI, DCE-MRI utilizes rapid, sequential image acquisition over numerous time points (1-N) following contrast injection in an in vivo porcine liver model. This high temporal resolution captures the dynamic passage of the contrast agent, yielding a densely sampled signal intensity versus time curve (bottom panel). Data with high temporal resolution are essential for quantitative analysis, including pharmacokinetic modeling of tissue perfusion. The successful adoption of DCE-MRI as a quantitative tool is dependent on acquiring data with high temporal resolution, as this is fundamental to the accuracy of pharmacokinetic modeling [12]. All animal procedures were approved by the Institutional Animal Care and Use Committee (protocol ARC-2016-053) and performed in accordance with national guidelines.
Bioengineering 12 00870 g002
Figure 3. General processing pipeline for dynamic contrast-enhanced MRI (DCE-MRI). MR signal intensity derived from dynamic images can be used to generate semiquantitative biomarkers or converted to contrast agent concentration for deriving quantitative biomarkers through pharmacokinetic modeling.
Bioengineering 12 00870 g003
Figure 4. Diagram of semiquantitative and quantitative modeling approaches in DCE-MRI. The semiquantitative method examines the shape and features of the signal intensity curve to gain insights into underlying pathophysiology. Parameters such as the area under the curve (AUC), maximum enhancement, wash-in slope, wash-out slope, etc., can be derived from the signal intensity over time curve. The quantitative modeling graph highlights the process of tracer kinetic modeling, with a tracer kinetic model that fits a mathematical curve to the contrast concentration over time data. This modeling approach quantifies physiological parameters, such as the forward volume transfer constant (Ktrans) and the reverse volume transfer constant (kep).
Bioengineering 12 00870 g004
Figure 5. Ktrans parametric map illustrating increased perfusion in a 10 mm LI-RADS 5 hepatocellular carcinoma (HCC) lesion (right ROI) in a 94-year-old patient compared to normal tissue parenchyma (left ROI). (A) Anatomical T1-weighted MRI obtained in the hepatobiliary phase. (B) Ktrans map overlaid on the anatomical image, where warmer colors indicate higher Ktrans values. These quantitative value maps have the potential to be leveraged to guide more accurate delivery of locoregional therapy.
Bioengineering 12 00870 g005
Figure 6. Variability in thermal ablation efficacy influenced by liver parenchymal differences, despite uniform energy delivery (65 W for 10 min). Arrows in the figure point towards the ablation zone. (A) A 2.5 cm ablation zone is shown on T1 non-contrast MRI with a clear margin surrounding the post-ablation tumor site. (B) In contrast, a 4.3 cm ablation zone is observed in a non-cirrhotic liver with HCC (hepatobiliary phase imaging). Given the same power and time, changes in ablation size and shape are likely related to surrounding blood vessel anatomy and underlying perfusional changes of the liver.
Bioengineering 12 00870 g006
Table 1. Definition of semiquantitative and quantitative metrics of DCE-MRI.
ModelDCE-MRI Parameter SymbolUnitsDefinition
SemiquantitativeOnset TimesTime of contrast agent onset
SemiquantitativeTTPsTime to maximum contrast enhancement
SemiquantitativePeak EnhancementSIMaximum signal intensity reached within a tissue region after contrast injection
SemiquantitativePeak Enhancement Ratio%Peak enhancement relative to the signal intensity at time of onset
SemiquantitativeWash-in Slope%Speed of contrast uptake
SemiquantitativeWash-out Slope%Speed of contrast clearance
SemiquantitativeAUC Area under the signal intensity-time curve
QuantitativeKtransmin−1Forward volume transfer coefficient between blood plasma and EES
Quantitativekepmin−1Reverse volume transfer coefficient between blood plasma and EES
Quantitativeve%EES volume per unit volume of tissue
Quantitativevp%Blood plasma volume per unit volume of tissue
QuantitativeDV%Distribution volume of contrast agent in the total volume of tissue
QuantitativeFmL·g−1·min−1 Total hepatic blood flow
QuantitativeFamL·g−1·min−1 Hepatic artery blood flow
QuantitativeFpmL·g−1·min−1 Hepatic portal blood flow
QuantitativeMTT s Average time for plasma to traverse from arterial to the venous end of the vasculature
Note—TTP = time to peak; SI = signal intensity; AUC = area under the curve; DV = distribution volume; F = total liver blood flow; Fa = arterial–venous blood flow; Fp = portal venous blood flow; MTT = mean transit time; EES = extracellular extravascular space.
Table 2. Summary of studies that integrate dynamic contrast-enhanced MRI methods with locoregional therapies for hepatocellular carcinoma.
Study and YearTreatment MethodSubjectSample SizeModelValuable DCE ParametersMajor Results
Mostafa,
2016; [22]
RFAHumans50QualitativeSignal intensity, heterogeneity, pattern of enhancement, border definitionDynamic contrast-enhanced MRI (DCE-MRI) showed early arterial enhancement and rapid wash-out in patients with recurrent and residual lesions at 1- and 3-month follow-ups.
Chiang et al., 2023; [23]MWAPorcine5QuantitativeKtrans, kepPerfusion parameters were significantly lower in embolized liver lobes than in nonembolized liver lobes, and there was a moderate but significant correlation between normalized kep and ablation volume.
Moon et al.,
2016; [24]
RFARabbit9QuantitativeKtrans, ve, vpMeasuring from both the partial necrotic area (PNA) and viable tumor area (VTA), mean Ktrans values were positively correlated with mean microvascular density (MVD).
Ren et al.,
2024; [25]
MWA, donafenibRabbit40QuantitativeKtransKtrans and tumor diameter were significantly greater in the insufficient MWA group than in the control sufficient MWA group. The serum vascular endothelial growth factor (VEGF) concentration, Ktrans, and tumor diameter were significantly lower in the combined treatment group than in the other two groups.
Saleh et al.,
2019; [26]
TACEHumans30QualitativeArterial-phase hyperenhancementDCE-MRI showed a 100% level of sensitivity using the application of the LI-RADS v2018 (the Liver Imaging Reporting and Data System) diagnostic algorithmic approach to evaluate HCC viability following TACE.
Svecic et al.,
2021; [27]
TACEHumans366QuantitativeSpatial–temporal features of DCE-MRI images pre-TACE, Onset time (To), time to peak (TTP), peak enhancement (ΔS), peak enhancement ratio (PER), normalized maximum intensity time ratio (nMITR), wash-in slope, wash-out slope, distribution volume (DV), arterial fraction (ART), K2, Ka, KpThe Spatial–Temporal Discriminant Graph Neural Network predicted post-TACE response with 93.5% accuracy and generated follow-up images with no significant differences in perfusion parameters compared to ground-truth post-TACE examinations.
Kuang et al., 2021; [28]TACEHumans153QuantitativeDCE-MRI arterial phase features pre-TACENomograms combining DCE-MRI arterial phase radiomics features with clinical variables predicted short-term response in HCC ≤ 5 cm with AUC = 0.83 (training) and 0.81 (validation), outperforming radiomics-only and clinical-only models.
Thibodeau-Antonacci
et al,
2019; [29]
TACEHumans28SemiquantitativeOnset time (To), time to peak (TTP), peak enhancement (ΔS), peak enhancement ratio (PER), normalized maximum intensity time ratio (nMITR), wash-in slope, wash-out slopeFor non-viable tumors, time to peak increased after TACE. For equivocal or viable tumors, time to peak and mean transit time significantly increased and the transfer constant from the extracellular, and extravascular space to the central vein significantly decreased.
Saito et al.,
2018; [30]
TACE, SorafenibHumans11QuantitativeDistribution volume of contrast agent (DV), KtransDV was reduced in responders at 3 and 10 days post-TACE. DV fell in non-responders at three days but was not significantly changed from pre-TACE values after sorafenib.
Pokuri et al., 2018; [31]TACE, SunitinibHumans16QuantitativeKtransMean Ktrans and viable tumor percent decreased with combination therapy.
Hectors et al., 2020; [32]90YHumans24Semiquantitative/QuantitativeArterial–venous blood flow, portal venous blood flow, total liver blood flow, arterial flow fraction, mean transit time, ve, intracellular
uptake rate (Ki), uptake fraction (fi)
Tumor DCE-MRI parameters of arterial–venous blood flow, arterial fraction, and ve showed a significant reduction at 6 weeks post radioembolization compared with baseline values, whereas fi showed a significant increase.
Zhang et al., 2022; [33]90YHumans25QuantitativeKtrans, ve, Quantitative transport mapping (QTM) velocityDCE-MRI with quantitative transport mapping demonstrated significant correlation between QTM velocity (|u|) and lung shunting fraction (LSF), along with increased Ktrans and ve in the high LSF group.
Note—RFA = radiofrequency ablation; MWA = microwave ablation; TACE = transarterial chemoembolization; Ktrans = forward volume transfer coefficient between blood plasma and extracellular extravascular space (EES); kep = reverse volume transfer coefficient between blood plasma and EES; ve = EES volume per unit volume of tissue; vp = blood plasma volume per unit volume of tissue; K2 = transfer constant from the liver tissue to the central vein; Ka = transfer constant from the arterial plasma to EES; Kp = transfer constant from the portal venous plasma to the surrounding tissue.
Disclaimer/Publisher’s Note: The statements, opinions and data contained in all publications are solely those of the individual author(s) and contributor(s) and not of MDPI and/or the editor(s). MDPI and/or the editor(s) disclaim responsibility for any injury to people or property resulting from any ideas, methods, instructions or products referred to in the content.