
The Associations Between the Swimming Speed, Anthropometrics, Kinematics, and Kinetics in the Butterfly Stroke

 ,
,  ,
,  ,
,  ,
,  , and
, and 
Abstract
1. Introduction
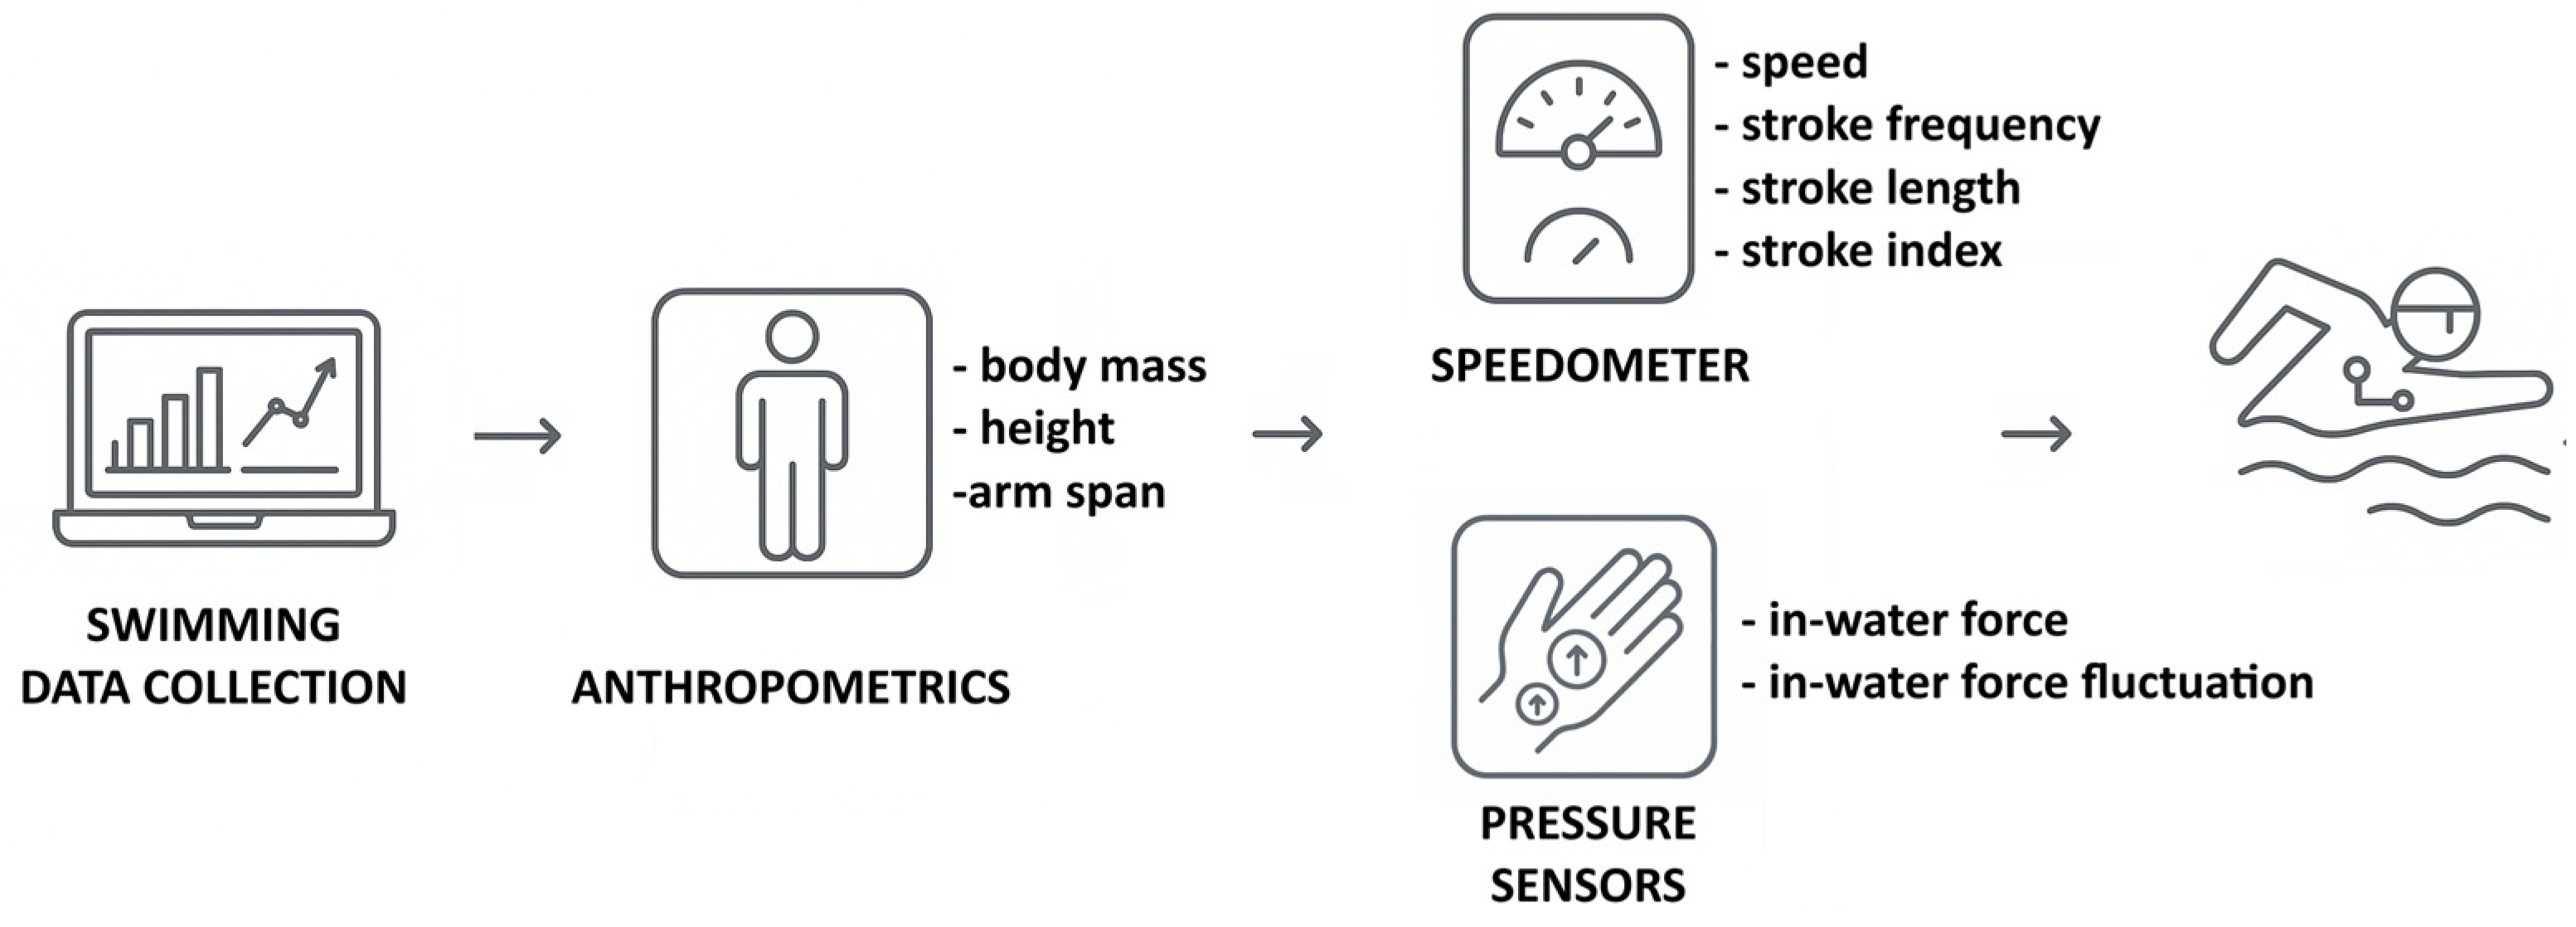
2. Materials and Methods
2.1. Participants
2.2. Study Design
2.3. Anthropometrics
2.4. Kinematics
2.5. Kinetics
2.6. Statistics
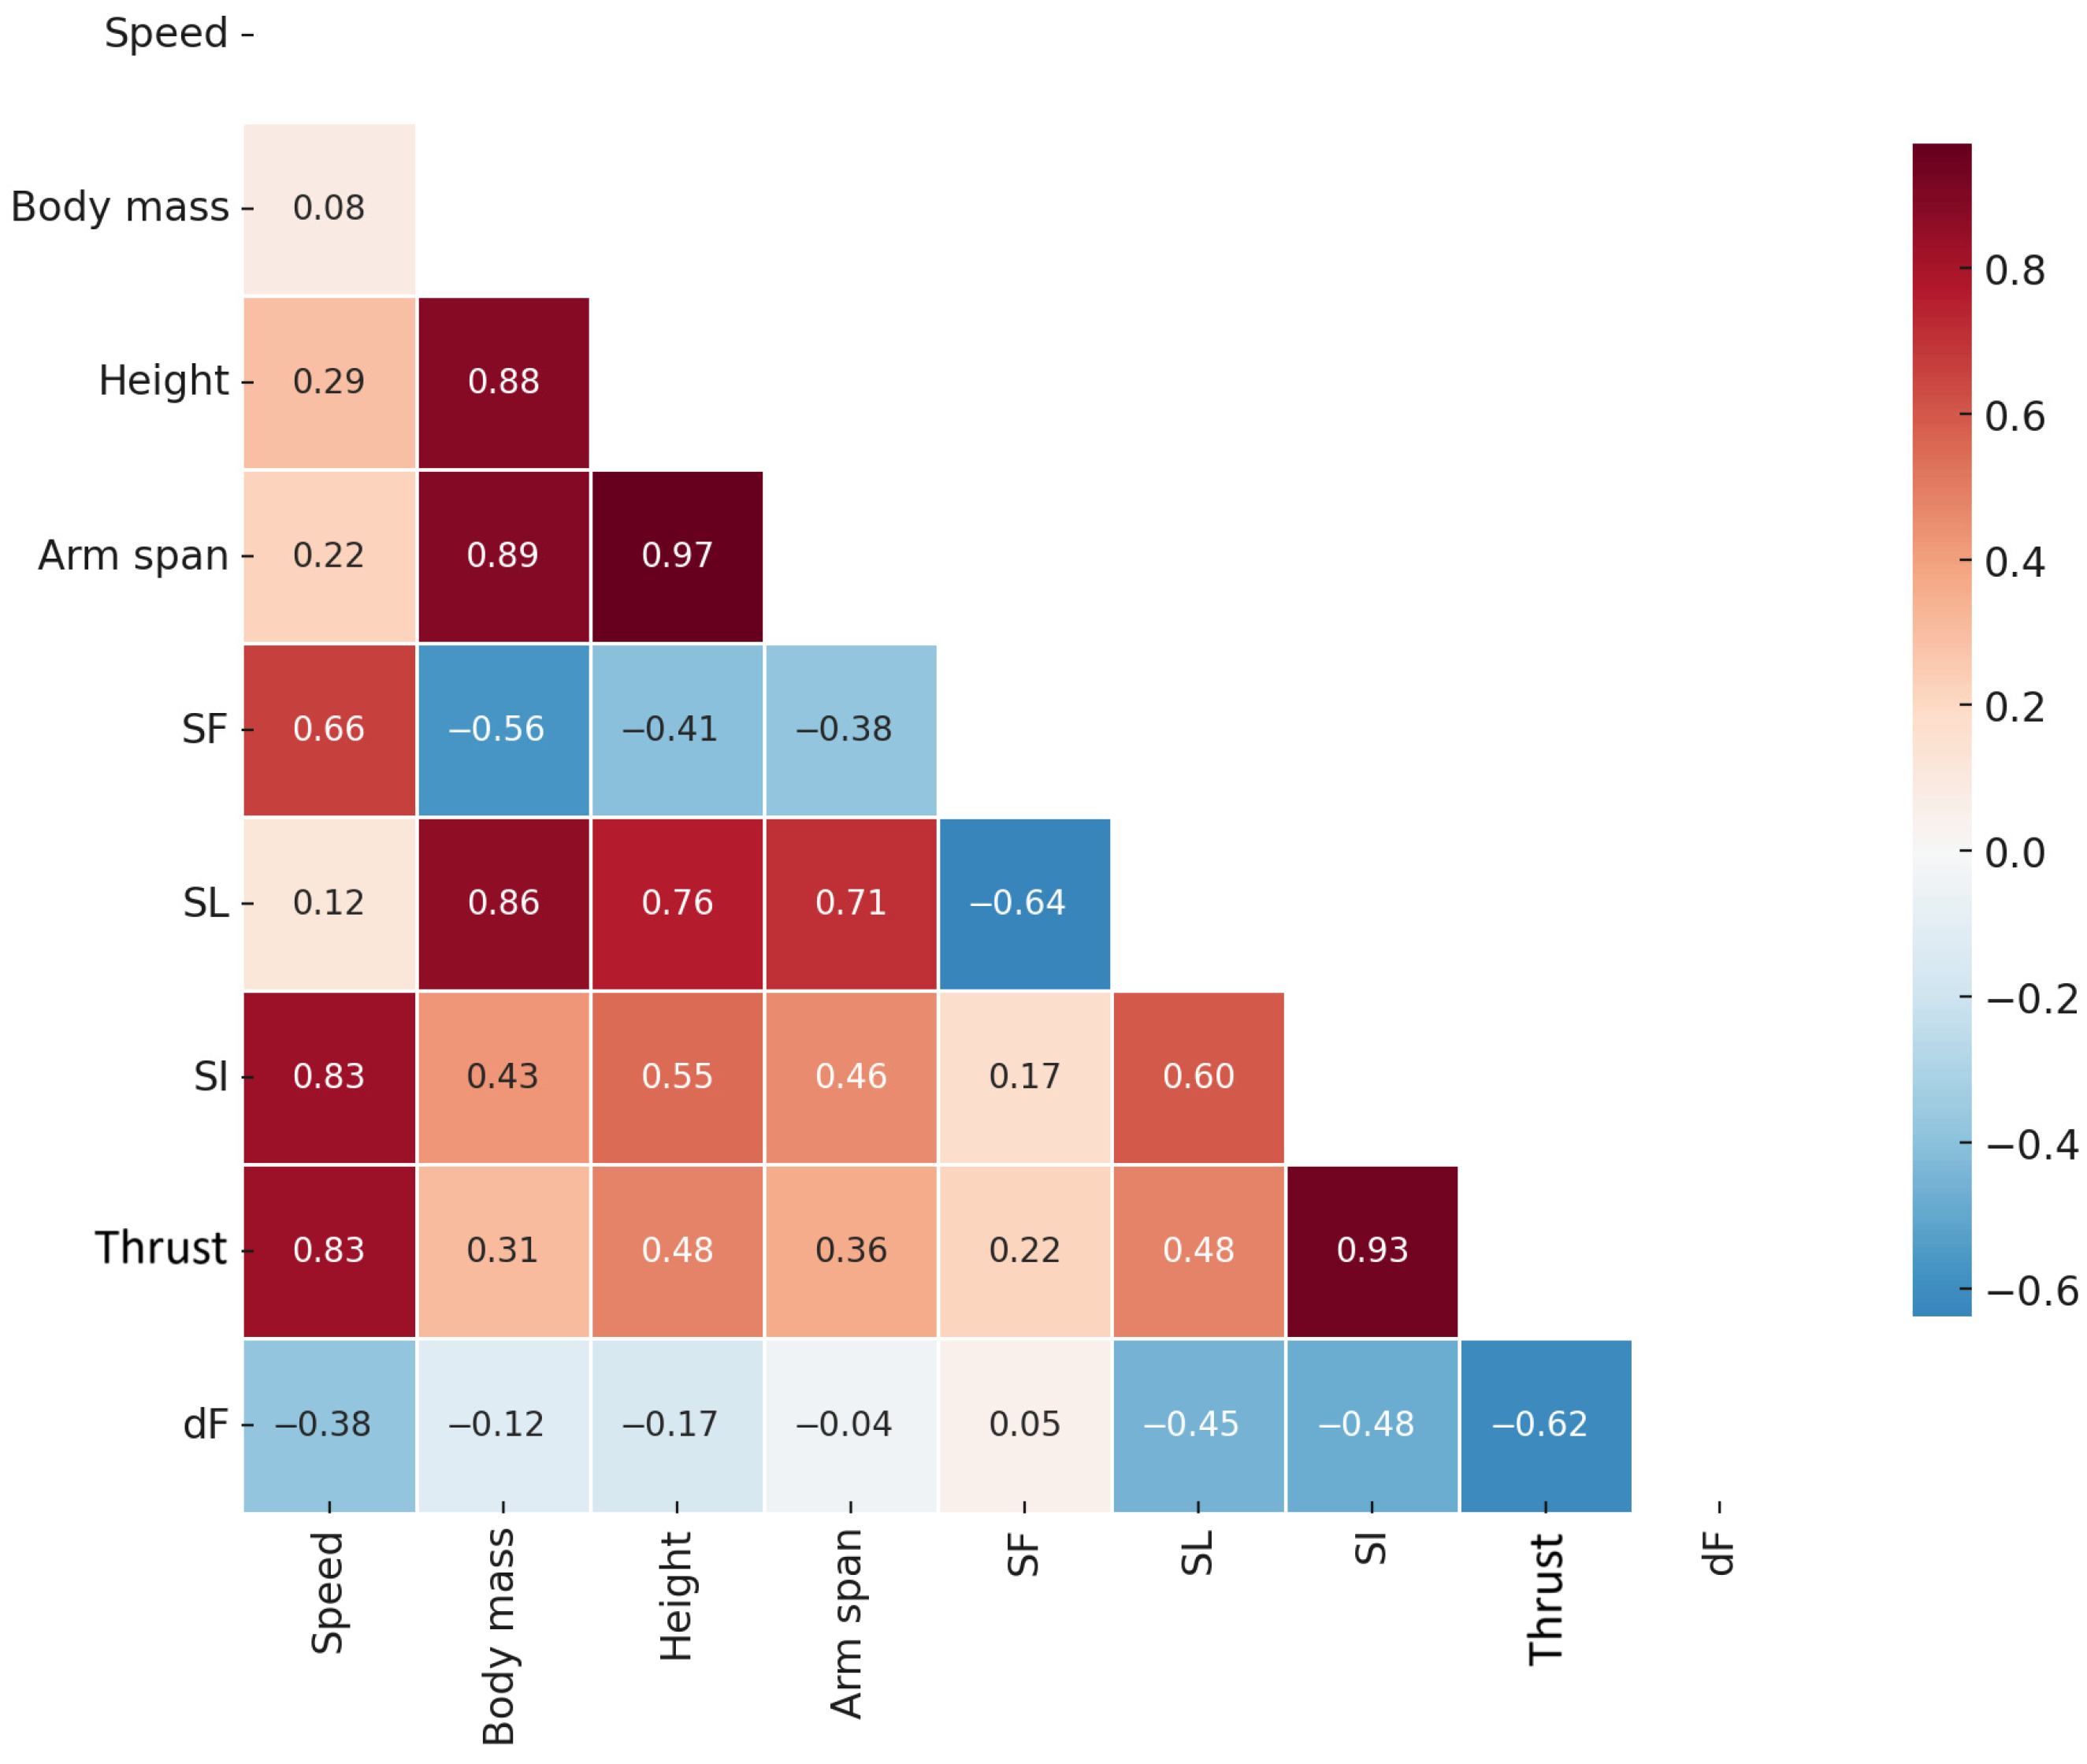
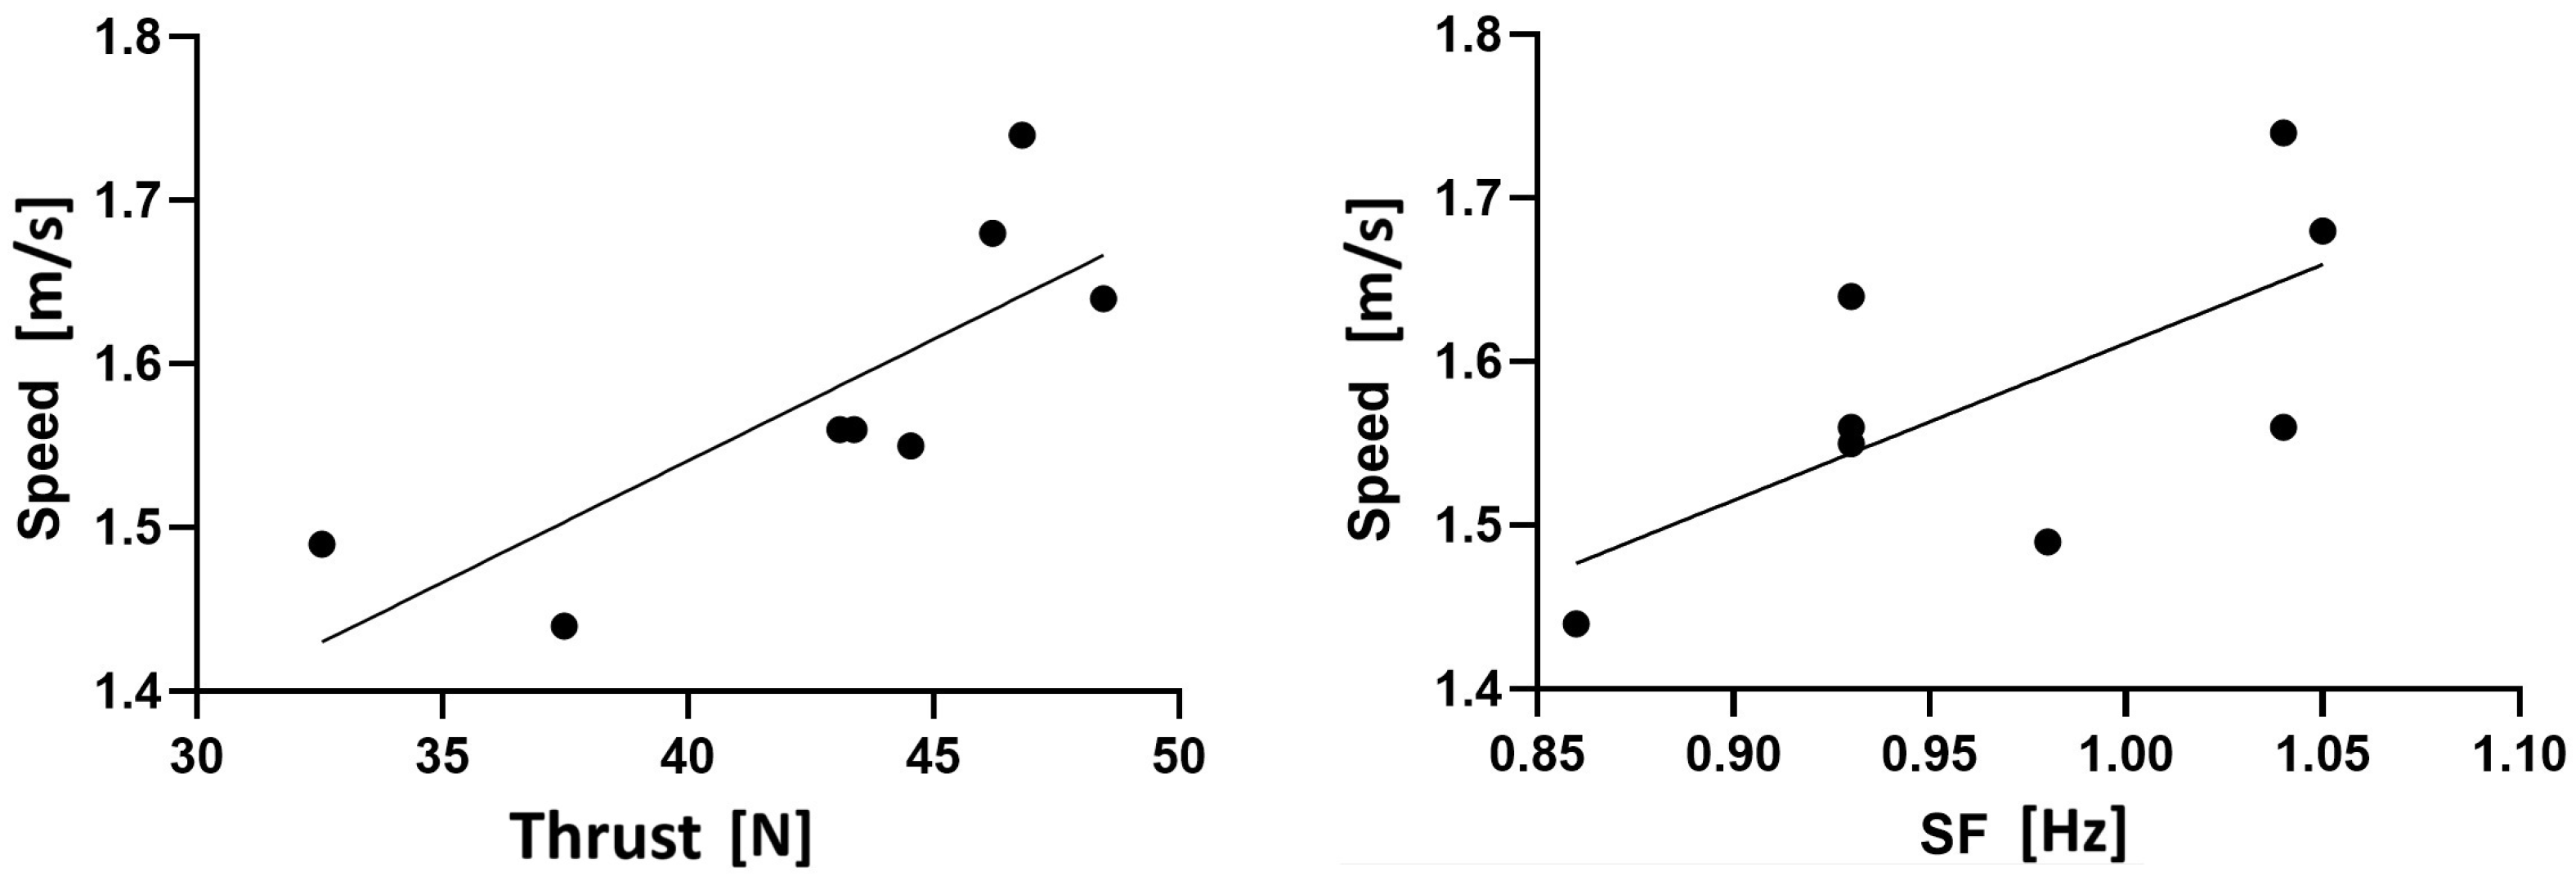
3. Results
4. Discussion
5. Conclusions
Author Contributions
Funding
Institutional Review Board Statement
Informed Consent Statement
Data Availability Statement
Acknowledgments
Conflicts of Interest
References
- McCabe, C.B.; Sanders, R.H. Kinematic Differences between Front Crawl Sprint and Distance Swimmers at a Distance Pace. J. Sports Sci. 2012, 30, 601–608. [Google Scholar] [CrossRef] [PubMed]
- Rejman, M.; Nevill, A.; Garrido, N.D.; Rudnik, D.; Morais, J.E. Identification of Key Somatic Features That Are Common and the Ones That Differ between Swim Strokes through Allometric Modelling. Front. Sports Act. Living 2023, 5, 1308033. [Google Scholar] [CrossRef] [PubMed]
- González-Ravé, J.M.; González-Mohino, F.; Hermosilla Perona, F.; Rodrigo-Carranza, V.; Yustres, I.; Pyne, D.B. Biomechanical, Physiological and Anthropometric Determinants of Backstroke Swimming Performance: A Systematic Review. Sports Med. Open 2025, 11, 68. [Google Scholar] [CrossRef] [PubMed]
- Mallett, A.; Bellinger, P.; Derave, W.; Osborne, M.; Minahan, C. The Age, Height, and Body Mass of Olympic Swimmers: A 50-Year Review and Update. Int. J. Sports Sci. Coach. 2021, 16, 210–223. [Google Scholar] [CrossRef]
- Fernandes, A.; Afonso, J.; Noronha, F.; Mezêncio, B.; Vilas-Boas, J.P.; Fernandes, R.J. Intracycle Velocity Variation in Swimming: A Systematic Scoping Review. Bioengineering 2023, 10, 308. [Google Scholar] [CrossRef] [PubMed]
- Seifert, L.; Chollet, D.; Chatard, J.C. Kinematic Changes during a 100-m Front Crawl: Effects of Performance Level and Gender. Med. Sci. Sports Exerc. 2007, 39, 1784–1793. [Google Scholar] [CrossRef] [PubMed]
- Almeida, T.A.; Pessôa Filho, D.M.; Espada, M.A.; Reis, J.F.; Simionato, A.R.; Siqueira, L.O.; Alves, F.B. V˙O2 Kinetics and Energy Contribution in Simulated Maximal Performance during Short and Middle Distance-Trials in Swimming. Eur. J. Appl. Physiol. 2020, 120, 1097–1109. [Google Scholar] [CrossRef] [PubMed]
- Zamparo, P.; Cortesi, M.; Gatta, G. The Energy Cost of Swimming and Its Determinants. Eur. J. Appl. Physiol. 2020, 120, 41–66. [Google Scholar] [CrossRef] [PubMed]
- Kolmogorov, S. Development of the Technology to Measure Active Drag Ofswimmers by the Method of Small Perturbations. J. Biomech. 2023, 149, 111486. [Google Scholar] [CrossRef] [PubMed]
- Koga, D.; Tsunokawa, T.; Sengoku, Y.; Homoto, K.; Nakazono, Y.; Takagi, H. Relationship Between Hand Kinematics, Hand Hydrodynamic Pressure Distribution and Hand Propulsive Force in Sprint Front Crawl Swimming. Front. Sports Act. Living 2022, 4, 786459. [Google Scholar] [CrossRef] [PubMed]
- Toussaint, H.M.; Beek, P.J. Biomechanics of Competitive Front Crawl Swimming. Sports Med. 1992, 13, 8–24. [Google Scholar] [CrossRef] [PubMed]
- Toussaint, H. Biomechanics of Drag and Propulsion in Front Crawl Swimming. In World Book of Swimming: From Science to Performance; Nova Science Publishers, Inc.: Hauppauge, NY, USA, 2011; pp. 3–20. [Google Scholar]
- Haskins, A.; McCabe, C.; Kennedy, R.; McWade, R.; Lennon, A.B.; Chandar, D. A Novel Method of Determining the Active Drag Profile in Swimming via Data Manipulation of Multiple Tension Force Collection Methods. Sci. Rep. 2023, 13, 10896. [Google Scholar] [CrossRef] [PubMed]
- Morais, J.E.; Sanders, R.H.; Papic, C.; Barbosa, T.M.; Marinho, D.A. The Influence of the Frontal Surface Area and Swim Velocity Variation in Front Crawl Active Drag. Med. Sci. Sports Exerc. 2020, 52, 2357–2364. [Google Scholar] [CrossRef] [PubMed]
- Wang, A.X.; Kabala, Z.J. Body Morphology and Drag in Swimming: CFD Analysis of the Effects of Differences in Male and Female Body Types. Fluids 2022, 7, 332. [Google Scholar] [CrossRef]
- Popa, C.V.; Zaïdi, H.; Arfaoui, A.; Polidori, G.; Redha, T.; Fohanno, S. Analysis of Wall Shear Stress around a Competitive Swimmer Using 3D Navier-Stokes Equations in CFD. Acta Bioeng. Biomech. 2011, 13, 3–11. [Google Scholar] [PubMed]
- Akis, T.; Orcan, Y. Experimental and Analytical Investigation of the Mechanics of Crawl Stroke Swimming. Mech. Res. Commun. 2004, 31, 243–261. [Google Scholar] [CrossRef]
- Narita, K.; Nakashima, M.; Takagi, H. Developing a Methodology for Estimating the Drag in Front-Crawl Swimming at Various Velocities. J. Biomech. 2017, 54, 123–128. [Google Scholar] [CrossRef] [PubMed]
- Morais, J.E.; Barbosa, T.M.; Garrido, N.D.; Cirilo-Sousa, M.S.; Silva, A.J.; Marinho, D.A. Agreement between Different Methods to Measure the Active Drag Coefficient in Front-Crawl Swimming. J. Hum. Kinet. 2023, 86, 41–49. [Google Scholar] [CrossRef] [PubMed]
- Vorontsov, A.; Rumyantsev, V. Propulsive Forces in Swimming. In Biomechanics in Sport: Performance Enhancement and Injury Prevention; Wiley-Blackwell: Hoboken, NJ, USA, 2000; pp. 205–231. [Google Scholar]
- Gatta, G.; Cortesi, M.; Swaine, I.; Zamparo, P. Mechanical Power, Thrust Power and Propelling Efficiency: Relationships with Elite Sprint Swimming Performance. J. Sports Sci. 2018, 36, 506–512. [Google Scholar] [CrossRef] [PubMed]
- Morouco, P.; Keskinen, K.L.; Vilas-Boas, J.P.; Fernandes, R.J. Relationship between Tethered Forces and the Four Swimming Techniques Performance. J. Appl. Biomech. 2011, 27, 161–169. [Google Scholar] [CrossRef] [PubMed]
- Payton, C.J.; Bartlett, R.M. Estimating Propulsive Forces in Swimming from Three-Dimensional Kinematic Data. J. Sports Sci. 1995, 13, 447–454. [Google Scholar] [CrossRef] [PubMed]
- Monoli, C.; Tuhtan, J.A.; Piccinini, L.; Galli, M. Wearable Technologies for Monitoring Aquatic Exercises: A Systematic Review. Clin. Rehabil. 2023, 37, 791–807. [Google Scholar] [CrossRef] [PubMed]
- Vieira, L.; Costa, M.; Santos, C.; da Cruz Ferreira, F.A.; Fernandes, R.; Soares, S.; Goethel, M.; Vilas-Boas, J.P. Swimming Velocity Analysis Using Wearable Inertial Sensors and Speedometer: A Comparative Study. Bioengineering 2024, 11, 757. [Google Scholar] [CrossRef] [PubMed]
- Kadi, T.; Wada, T.; Narita, K.; Tsunokawa, T.; Mankyu, H.; Tamaki, H.; Ogita, F. Novel Method for Estimating Propulsive Force Generated by Swimmers’ Hands Using Inertial Measurement Units and Pressure Sensors. Sensors 2022, 22, 6695. [Google Scholar] [CrossRef] [PubMed]
- Pereira, G.S.; Schut, G.R.; Ruschel, C.; Roesler, H.; Pereira, S.M. Propulsive Force Symmetry Generated during Butterfly Swimming. Rev. Bras. Cineantropometria Desempenho Hum. 2015, 17, 704–712. [Google Scholar] [CrossRef]
- Bartolomeu, R.F.; Costa, M.J.; Barbosa, T.M. Contribution of Limbs’ Actions to the Four Competitive Swimming Strokes: A Nonlinear Approach. J. Sports Sci. 2018, 36, 1836–1845. [Google Scholar] [CrossRef] [PubMed]
- Çiçek, M. Wearable Technologies and Its Future Applications. Int. J. Electr. Electron. Data Commun. 2015, 3, 45–50. [Google Scholar]
- de Magalhaes, F.A.; Vannozzi, G.; Gatta, G.; Fantozzi, S. Wearable Inertial Sensors in Swimming Motion Analysis: A Systematic Review. J. Sports Sci. 2015, 33, 732–745. [Google Scholar] [CrossRef] [PubMed]
- Slopecki, M.; Charbonneau, M.; Deguire, S.; Côté, J.N.; Clément, J. Technical Performance Analyses in Elite Paralympic Swimming Using Wearable Technology: Two Case Studies. Sports Biomech. 2025; in press. [Google Scholar] [CrossRef] [PubMed]
- Slopecki, M.; Charbonneau, M.; Lavallière, J.-M.; Côté, J.N.; Clément, J. Validation of Automatically Quantified Swim Stroke Mechanics Using an Inertial Measurement Unit in Paralympic Athletes. Bioengineering 2023, 11, 15. [Google Scholar] [CrossRef] [PubMed]
- Costa, J.; Silva, C.; Santos, M.; Fernandes, T.; Faria, S. Framework for Intelligent Swimming Analytics with Wearable Sensors for Stroke Classification. Sensors 2021, 21, 5162. [Google Scholar] [CrossRef] [PubMed]
- Bartolomeu, R.F.; Rodrigues, P.; Sokołowski, K.; Strzała, M.; Santos, C.C.; Costa, M.J.; Barbosa, T.M. Nonlinear Analysis of the Hand and Foot Force-Time Profiles in the Four Competitive Swimming Strokes. J. Hum. Kinet. 2023, 90, 71. [Google Scholar] [CrossRef] [PubMed]
- Pyne, D.B.; Sharp, R.L. Physical and Energy Requirements of Competitive Swimming Events. Int. J. Sport Nutr. Exerc. Metab. 2014, 24, 351–359. [Google Scholar] [CrossRef] [PubMed]
- Strzala, M.; Stanula, A.; Krężałek, P.; Ostrowski, A.; Kaca, M.; Glcab, G. Butterfly Sprint Swimming Technique, Analysis of Somatic and Spatial-Temporal Coordination Variables. J. Hum. Kinet. 2017, 60, 51–62. [Google Scholar] [CrossRef] [PubMed]
- Seifert, L.; Delignieres, D.; Boulesteix, L.; Chollet, D. Effect of Expertise on Butterfly Stroke Coordination. J. Sports Sci. 2007, 25, 131–141. [Google Scholar] [CrossRef] [PubMed]
- Gonjo, T.; Eriksrud, O.; Papoutsis, F.; Olstad, B.H. Relationships between a Load-Velocity Profile and Sprint Performance in Butterfly Swimming. Int. J. Sports Med. 2020, 41, 461–467. [Google Scholar] [CrossRef] [PubMed]
- Koga, D.; Gonjo, T.; Kawai, E.; Tsunokawa, T.; Sakai, S.; Sengoku, Y.; Homma, M.; Takagi, H. Effects of Exceeding Stroke Frequency of Maximal Effort on Hand Kinematics and Hand Propulsive Force in Front Crawl. Sports Biomech. 2024, 23, 15–27. [Google Scholar] [CrossRef] [PubMed]
- Kudo, S.; MIWA, T.; Sakurai, Y. Differences in Stroke Technique of Skilled Swimmers to Exert Hand Propulsion between the Front Crawl Stroke and the Butterfly. In Proceedings of the XIIth International Symposium on Biomechanics and Medicine in Swimming, Canberra, Australia, 28 April–1 May 2014. [Google Scholar]
- Morais, J.; Barbosa, T.M.; Lopes, V.P.; Marques, M.C.; Marinho, D.A. Propulsive Force of Upper Limbs and Its Relationship to Swim Velocity in the Butterfly Stroke. Int. J. Sports Med. 2021, 42, 1105–1112. [Google Scholar] [CrossRef] [PubMed]
- McKay, A.; Stellingwerff, T.; Smith, E.; Martin, D.; Mujika, I.; Goosey-Tolfrey, V.; Sheppard, J.; Burke, L. Defining Training and Performance Caliber: A Participant Classification Framework. Int. J. Sports Physiol. Perform. 2022, 17, 317–331. [Google Scholar] [CrossRef] [PubMed]
- Petri, C.; Campa, F.; Holway, F.; Pengue, L.; Arrones, L.S. ISAK-Based Anthropometric Standards for Elite Male and Female Soccer Players. Sports 2024, 12, 69. [Google Scholar] [CrossRef] [PubMed]
- McGowan, C.J.; Pyne, D.B.; Thompson, K.G.; Raglin, J.S.; Osborne, M.; Rattray, B. Elite Sprint Swimming Performance Is Enhanced by Completion of Additional Warm-up Activities. J. Sports Sci. 2017, 35, 1493–1499. [Google Scholar] [CrossRef] [PubMed]
- McCabe, C.B.; Sanders, R.H.; Psycharakis, S.G. Upper Limb Kinematic Differences between Breathing and Non-Breathing Conditions in Front Crawl Sprint Swimming. J. Biomech. 2015, 48, 3995–4001. [Google Scholar] [CrossRef] [PubMed]
- Hamidi Rad, M.; Aminian, K.; Gremeaux, V.; Massé, F.; Dadashi, F. Swimming Phase-Based Performance Evaluation Using a Single IMU in Main Swimming Techniques. Front. Bioeng. Biotechnol. 2021, 9, 793302. [Google Scholar] [CrossRef] [PubMed]
- Winter, D.A. Biomechanics and Motor Control of Human Movement; John Wiley & Sons: Hoboken, NJ, USA, 2009; ISBN 0-470-39818-3. [Google Scholar]
- Papadimitriou, K.; Zafeiriadis, S.; Papadimitriou, N.; Tsalis, G. Case Report: Impact of Dolphin Kick Implementation during Backstroke Finishes on Swimming Performance. From Regional to Olympic-Level Swimmers. A Comparative Case Study. Front. Sports Act. Living 2025, 7, 1531427. [Google Scholar] [CrossRef] [PubMed]
- Scott, M.; Elsworthy, N.; Brackley, V.; Elipot, M.; Kean, C. Agreement between an Automated Video-Based System and Tethered System to Measure Instantaneous Swimming Velocity. Sports Biomech. 2024. [Google Scholar] [CrossRef] [PubMed]
- Costill, D.L.; Kovaleski, J.; Porter, D.; Kirwan, J.; Fielding, R.; King, D. Energy Expenditure during Front Crawl Swimming: Predicting Success in Middle-Distance Events. Int. J. Sports Med. 1985, 6, 266–270. [Google Scholar] [CrossRef] [PubMed]
- Löppönen, A.; Vänttinen, T.; Haverinen, M.; Linnamo, V. The Effect of Paddle Stroke Variables Measured by Trainesense SmartPaddle® on the Velocity of the Kayak. Sensors 2022, 22, 938. [Google Scholar] [CrossRef] [PubMed]
- Marinho, D.A.; Barbosa, T.M.; Auvinen, A.; Lopes, T.; Silva, A.J.; Morais, J.E. Smartpaddle as a New Tool for Monitoring Swimmers’ Kinematic and Kinetic Variables in Real Time. Open Sports Sci. J. 2022, 15, 1–7. [Google Scholar] [CrossRef]
- Havriluk, R. Seasonal Variations in Swimming Force and Training Adaptation. J. Swim. Res. 2013, 21, 1–8. [Google Scholar]
- Hopkins, W.A. Scale of Magnitudes for Effect Statistics. A New View of Statistics. 2002. Available online: http://www.sportsci.org/resource/stats/effectmag.html (accessed on 10 October 2013).
- Nevill, A.; Sandercock, G.; Ramírez-Vélez, R. Developing a New Curvilinear Allometric Model to Improve the Fit and Validity of the 20-m Shuttle Run Test as a Predictor of Cardiorespiratory Fitness in Adults and Youth. Sports Med. 2020, 51, 1581–1589. [Google Scholar] [CrossRef] [PubMed]
- Kjendlie, P.-L.; Stallman, R. Morphology and Swimming Performance. In World Book of Swimming: From Science to Performance; Nova Science Publishers Inc.: New York, NY, USA, 2011; pp. 203–222. [Google Scholar]
- Santos, C.C.; Costa, M.J.; Marinho, D.A. The Effects of 6-Week Training Cessation on Anthropometrics, in-Water Force, Performance, and Kinematics of Young Competitive Swimmers: A Maturity Development Approach. Int. J. Sports Physiol. Perform. 2023, 18, 643–652. [Google Scholar] [CrossRef] [PubMed]
- Sampaio, T.; Oliveira, J.P.; Barbosa, T.M.; Marinho, D.A.; Morais, J.E. Comparison of Propulsion Between Upper Limbs in the Butterfly Stroke Using Statistical Parametric Mapping; Springer: Berlin/Heidelberg, Germany, 2023; pp. 463–470. [Google Scholar]
- Sanders, R.; Mccabe, C.; Sanders, R.H.; McCabe, C.B. Butterfly Technique. In Science of Swimming Faster; Riewald, S., Rodeo, S., Eds.; Human Kinetics: Champaign, IL, USA, 2015; pp. 87–96. ISBN 978-1-4925-0999-8. [Google Scholar]
- Craig, A.B.; Skehan, P.L.; Pawelczyk, J.A.; Boomer, W.L. Velocity, Stroke Rate, and Distance per Stroke during Elite Swimming Competition. Med. Sci. Sports Exerc. 1985, 17, 625–634. [Google Scholar] [CrossRef] [PubMed]
- Morais, J.E.; Barbosa, T.M.; Lopes, T.; Simbaña-Escobar, D.; Marinho, D.A. Race Analysis of the Men’s 50 m Events at the 2021 LEN European Championships. Sports Biomech. 2025, 24, 459–475. [Google Scholar] [CrossRef] [PubMed]
- Longo, S.; Scurati, R.; Michielon, G.; Invernizzi, P.L. Correlation between Two Propulsion Efficiency Indices in Front Crawl Swimming. Sport Sci. Health 2008, 4, 65–71. [Google Scholar] [CrossRef]
- Sanders, R.; Thow, J.; Alcock, A.; Fairweather, M.; Riach, I.; Mather, F. How Can Asymmetries in Swimming Be Measured? J. Swim. Res. 2012, 19, 1–15. [Google Scholar]
- Mayr, S.; Erdfelder, E.; Buchner, A.; Faul, F. A Short Tutorial of GPower. Tutor. Quant. Methods Psychol. 2007, 3, 51–59. [Google Scholar] [CrossRef]
- Riley, R.D.; Snell, K.I.; Ensor, J.; Burke, D.L.; Harrell, F.E., Jr.; Moons, K.G.; Collins, G.S. Minimum Sample Size for Developing a Multivariable Prediction Model: PART II-binary and Time-to-event Outcomes. Stat. Med. 2019, 38, 1276–1296. [Google Scholar] [CrossRef] [PubMed]

| Mean ± SD Poorest Performers | Mean ± SD Best Performers | Mean Difference (95CI) | t-Test (p-Value) | Effect Size (Descriptor) | ||
|---|---|---|---|---|---|---|
| Anthropometrics | Body mass [kg] | 77.6 ± 5.4 | 76.7 ± 13.9 | 0.88 (−17.43 to 19.18) | 0.117 (0.455) | 0.08 (trivial) |
| Height [cm] | 182.0 ± 8.3 | 186.7 ± 11.7 | −4.75 (−22.29 to 12.79) | −0.663 (0.266) | 0.47 (small) | |
| Arm span [cm] | 186.0 ± 5.8 | 190.5 ± 9.6 | −4.50 (−18.32 to 9.32) | −0.797 (0.228) | 0.56 (small) | |
| Kinematics | Speed [m/s] | 1.51 ± 0.05 | 1.65 ± 0.07 | −0.15 (−0.26 to −0.03) | −3.086 (0.011) | 2.18 (very large) |
| SF [Hz] | 0.93 ± 0.05 | 1.02 ± 0.05 | −0.09 (−0.18 to 0.002) | −2.391 (0.027) | 1.69 (large) | |
| SL [m] | 1.63 ± 0.07 | 1.63 ± 0.11 | 0.001 (−0.16 to 0.17) | 0.009 (0.497) | 0.01 (trivial) | |
| SI [m2/s] | 2.47 ± 0.16 | 2.71 ± 0.26 | −0.24 (−0.62 to 0.14) | −1.533 (0.088) | 1.08 (moderate) | |
| Kinetics | Thrust [N] | 39.48 ± 5.56 | 46.14 ± 2.24 | −6.65 (−13.99 to 0.69) | −2.218 (0.034) | 1.57 (large) |
| dF [%] | 63.36 ± 8.37 | 57.17 ± 6.38 | 6.19 (−6.68 to 19.07) | 1.177 (0.142) | 0.83 (moderate) |
Disclaimer/Publisher’s Note: The statements, opinions and data contained in all publications are solely those of the individual author(s) and contributor(s) and not of MDPI and/or the editor(s). MDPI and/or the editor(s) disclaim responsibility for any injury to people or property resulting from any ideas, methods, instructions or products referred to in the content. |
© 2025 by the authors. Licensee MDPI, Basel, Switzerland. This article is an open access article distributed under the terms and conditions of the Creative Commons Attribution (CC BY) license (https://creativecommons.org/licenses/by/4.0/).
Share and Cite
Pinto, M.P.; Neiva, H.P.; Sampaio, T.; Oliveira, J.P.; Marinho, D.A.; Barbosa, T.M.; Morais, J.E. The Associations Between the Swimming Speed, Anthropometrics, Kinematics, and Kinetics in the Butterfly Stroke. Bioengineering 2025, 12, 797. https://doi.org/10.3390/bioengineering12080797
Pinto MP, Neiva HP, Sampaio T, Oliveira JP, Marinho DA, Barbosa TM, Morais JE. The Associations Between the Swimming Speed, Anthropometrics, Kinematics, and Kinetics in the Butterfly Stroke. Bioengineering. 2025; 12(8):797. https://doi.org/10.3390/bioengineering12080797
Chicago/Turabian StylePinto, Mafalda P., Henrique P. Neiva, Tatiana Sampaio, João P. Oliveira, Daniel A. Marinho, Tiago M. Barbosa, and Jorge E. Morais. 2025. "The Associations Between the Swimming Speed, Anthropometrics, Kinematics, and Kinetics in the Butterfly Stroke" Bioengineering 12, no. 8: 797. https://doi.org/10.3390/bioengineering12080797
APA StylePinto, M. P., Neiva, H. P., Sampaio, T., Oliveira, J. P., Marinho, D. A., Barbosa, T. M., & Morais, J. E. (2025). The Associations Between the Swimming Speed, Anthropometrics, Kinematics, and Kinetics in the Butterfly Stroke. Bioengineering, 12(8), 797. https://doi.org/10.3390/bioengineering12080797