
Active and Inactive Tuberculosis Classification Using Convolutional Neural Networks with MLP-Mixer


Abstract
1. Introduction
- (1)
- Development and implementation of an advanced deep learning approach to classify active and inactive TB instead of the TB/non-tuberculosis classification commonly covered in CXR images;
- (2)
- Heatmap-based visualization of lesion locations to find pathological features;
- (3)
- Professional data collection and annotation conducted by experts at Cheonan Soonchunhyang Hospital, not on public datasets;
- (4)
- Application of the trained model in a computer-aided detection (CAD) system for future latent TB screening initiatives.
2. Related Works
3. Proposal Methods
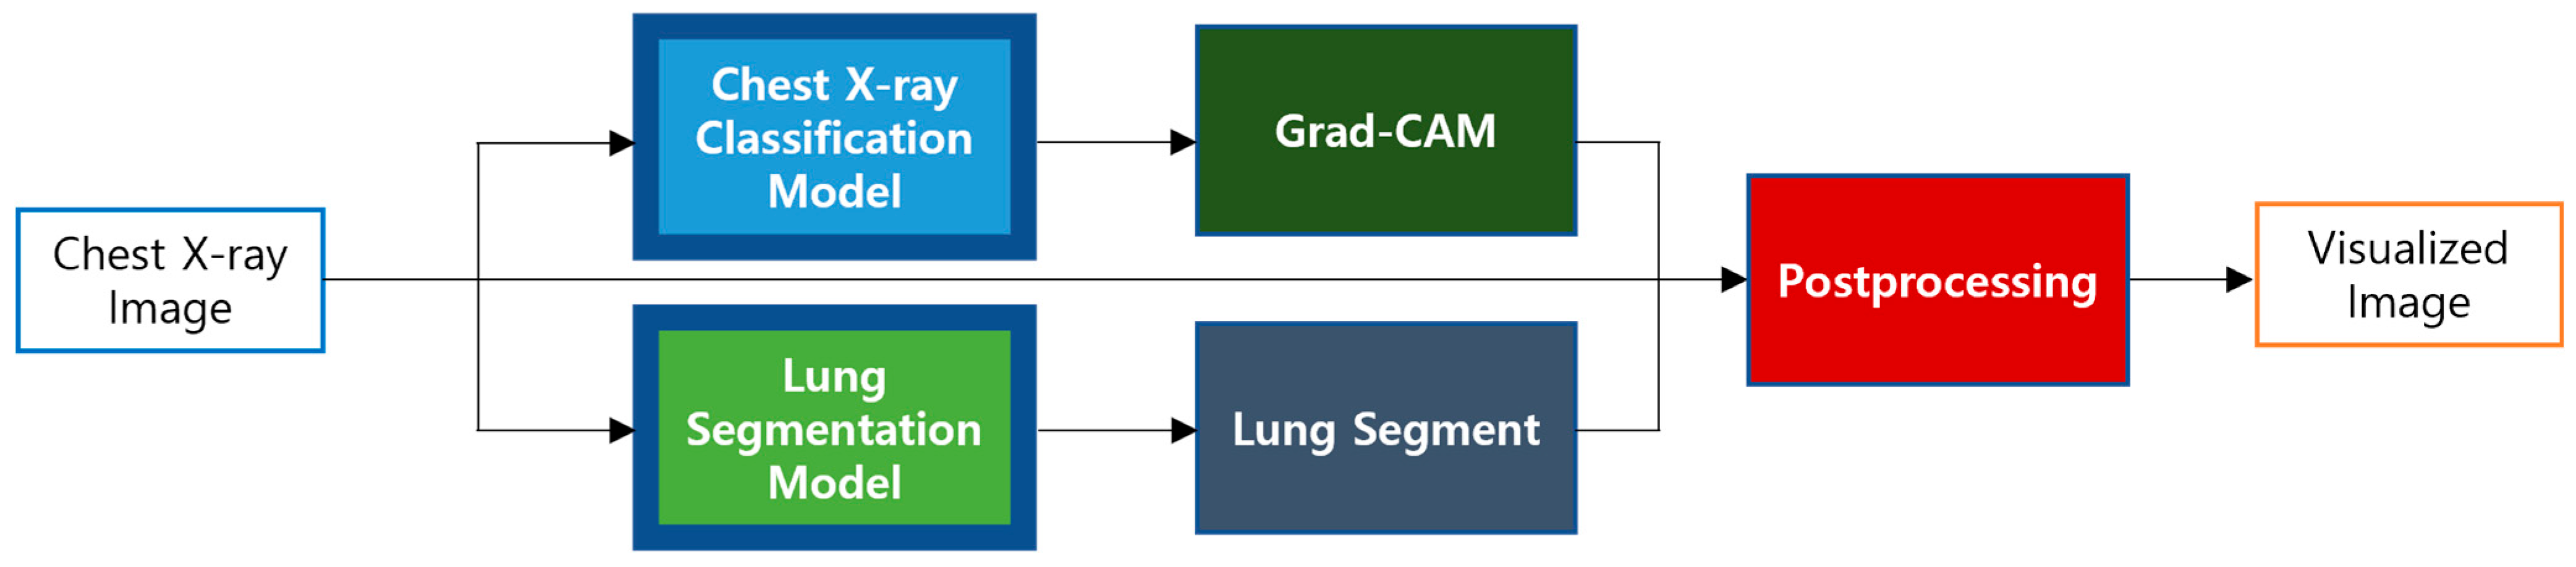
3.1. Model Pipeline
3.2. Proposed Model
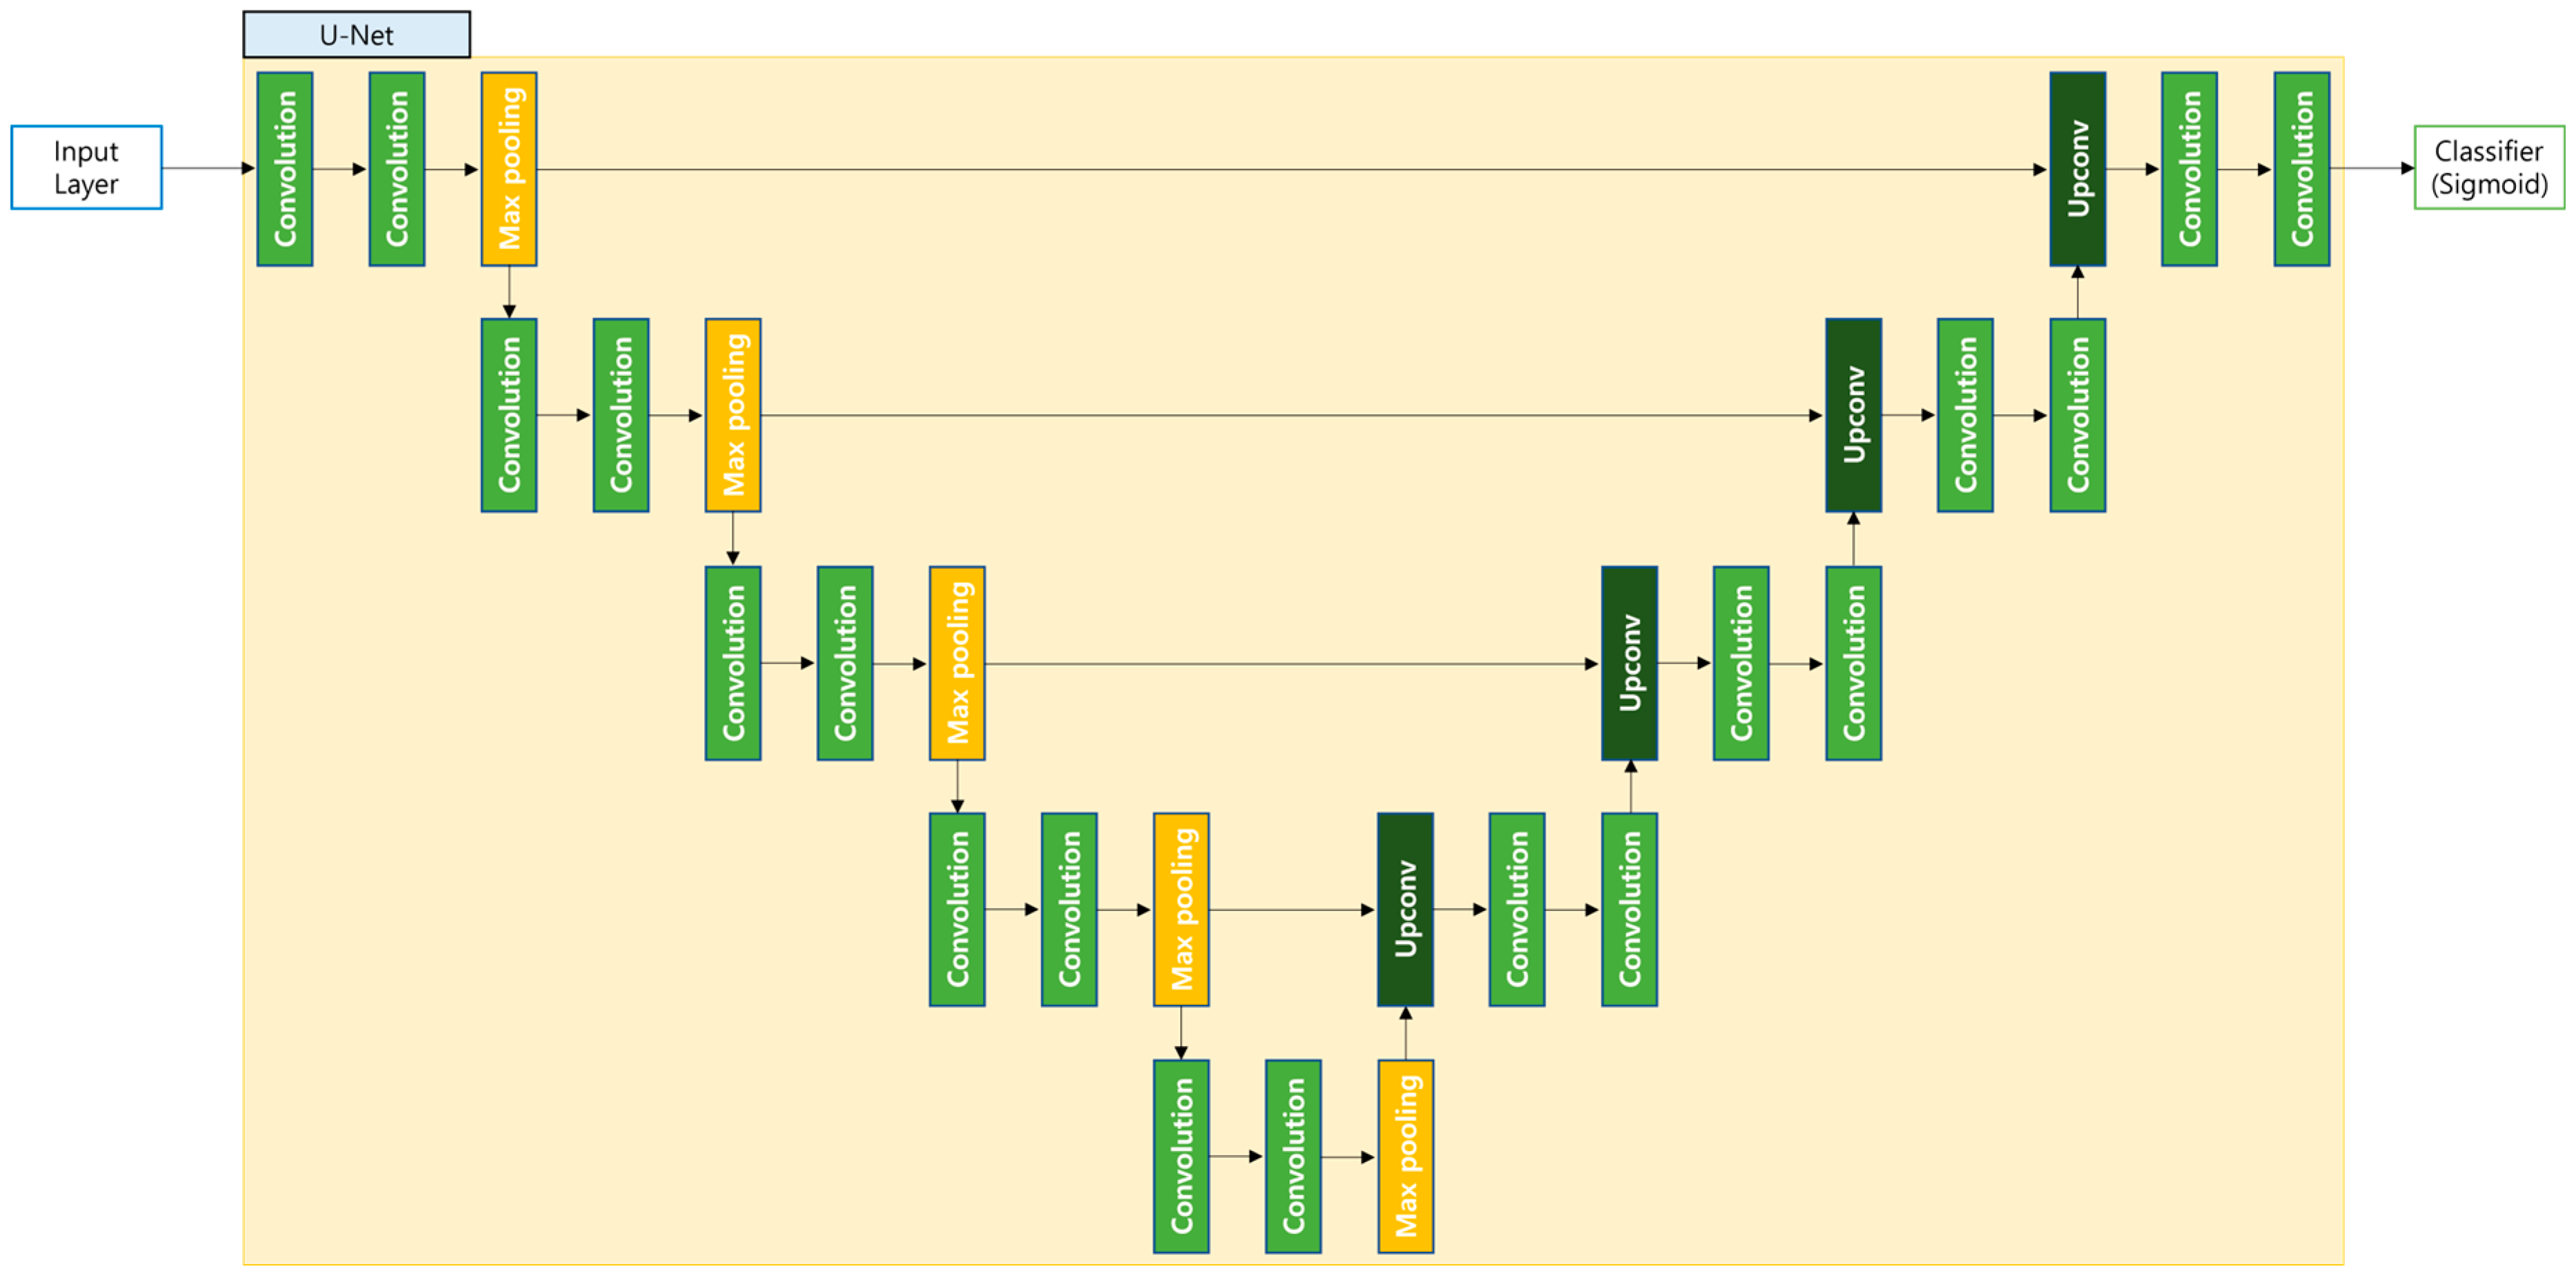
3.3. Semantic Segmentation Model
3.4. Mixed Precision
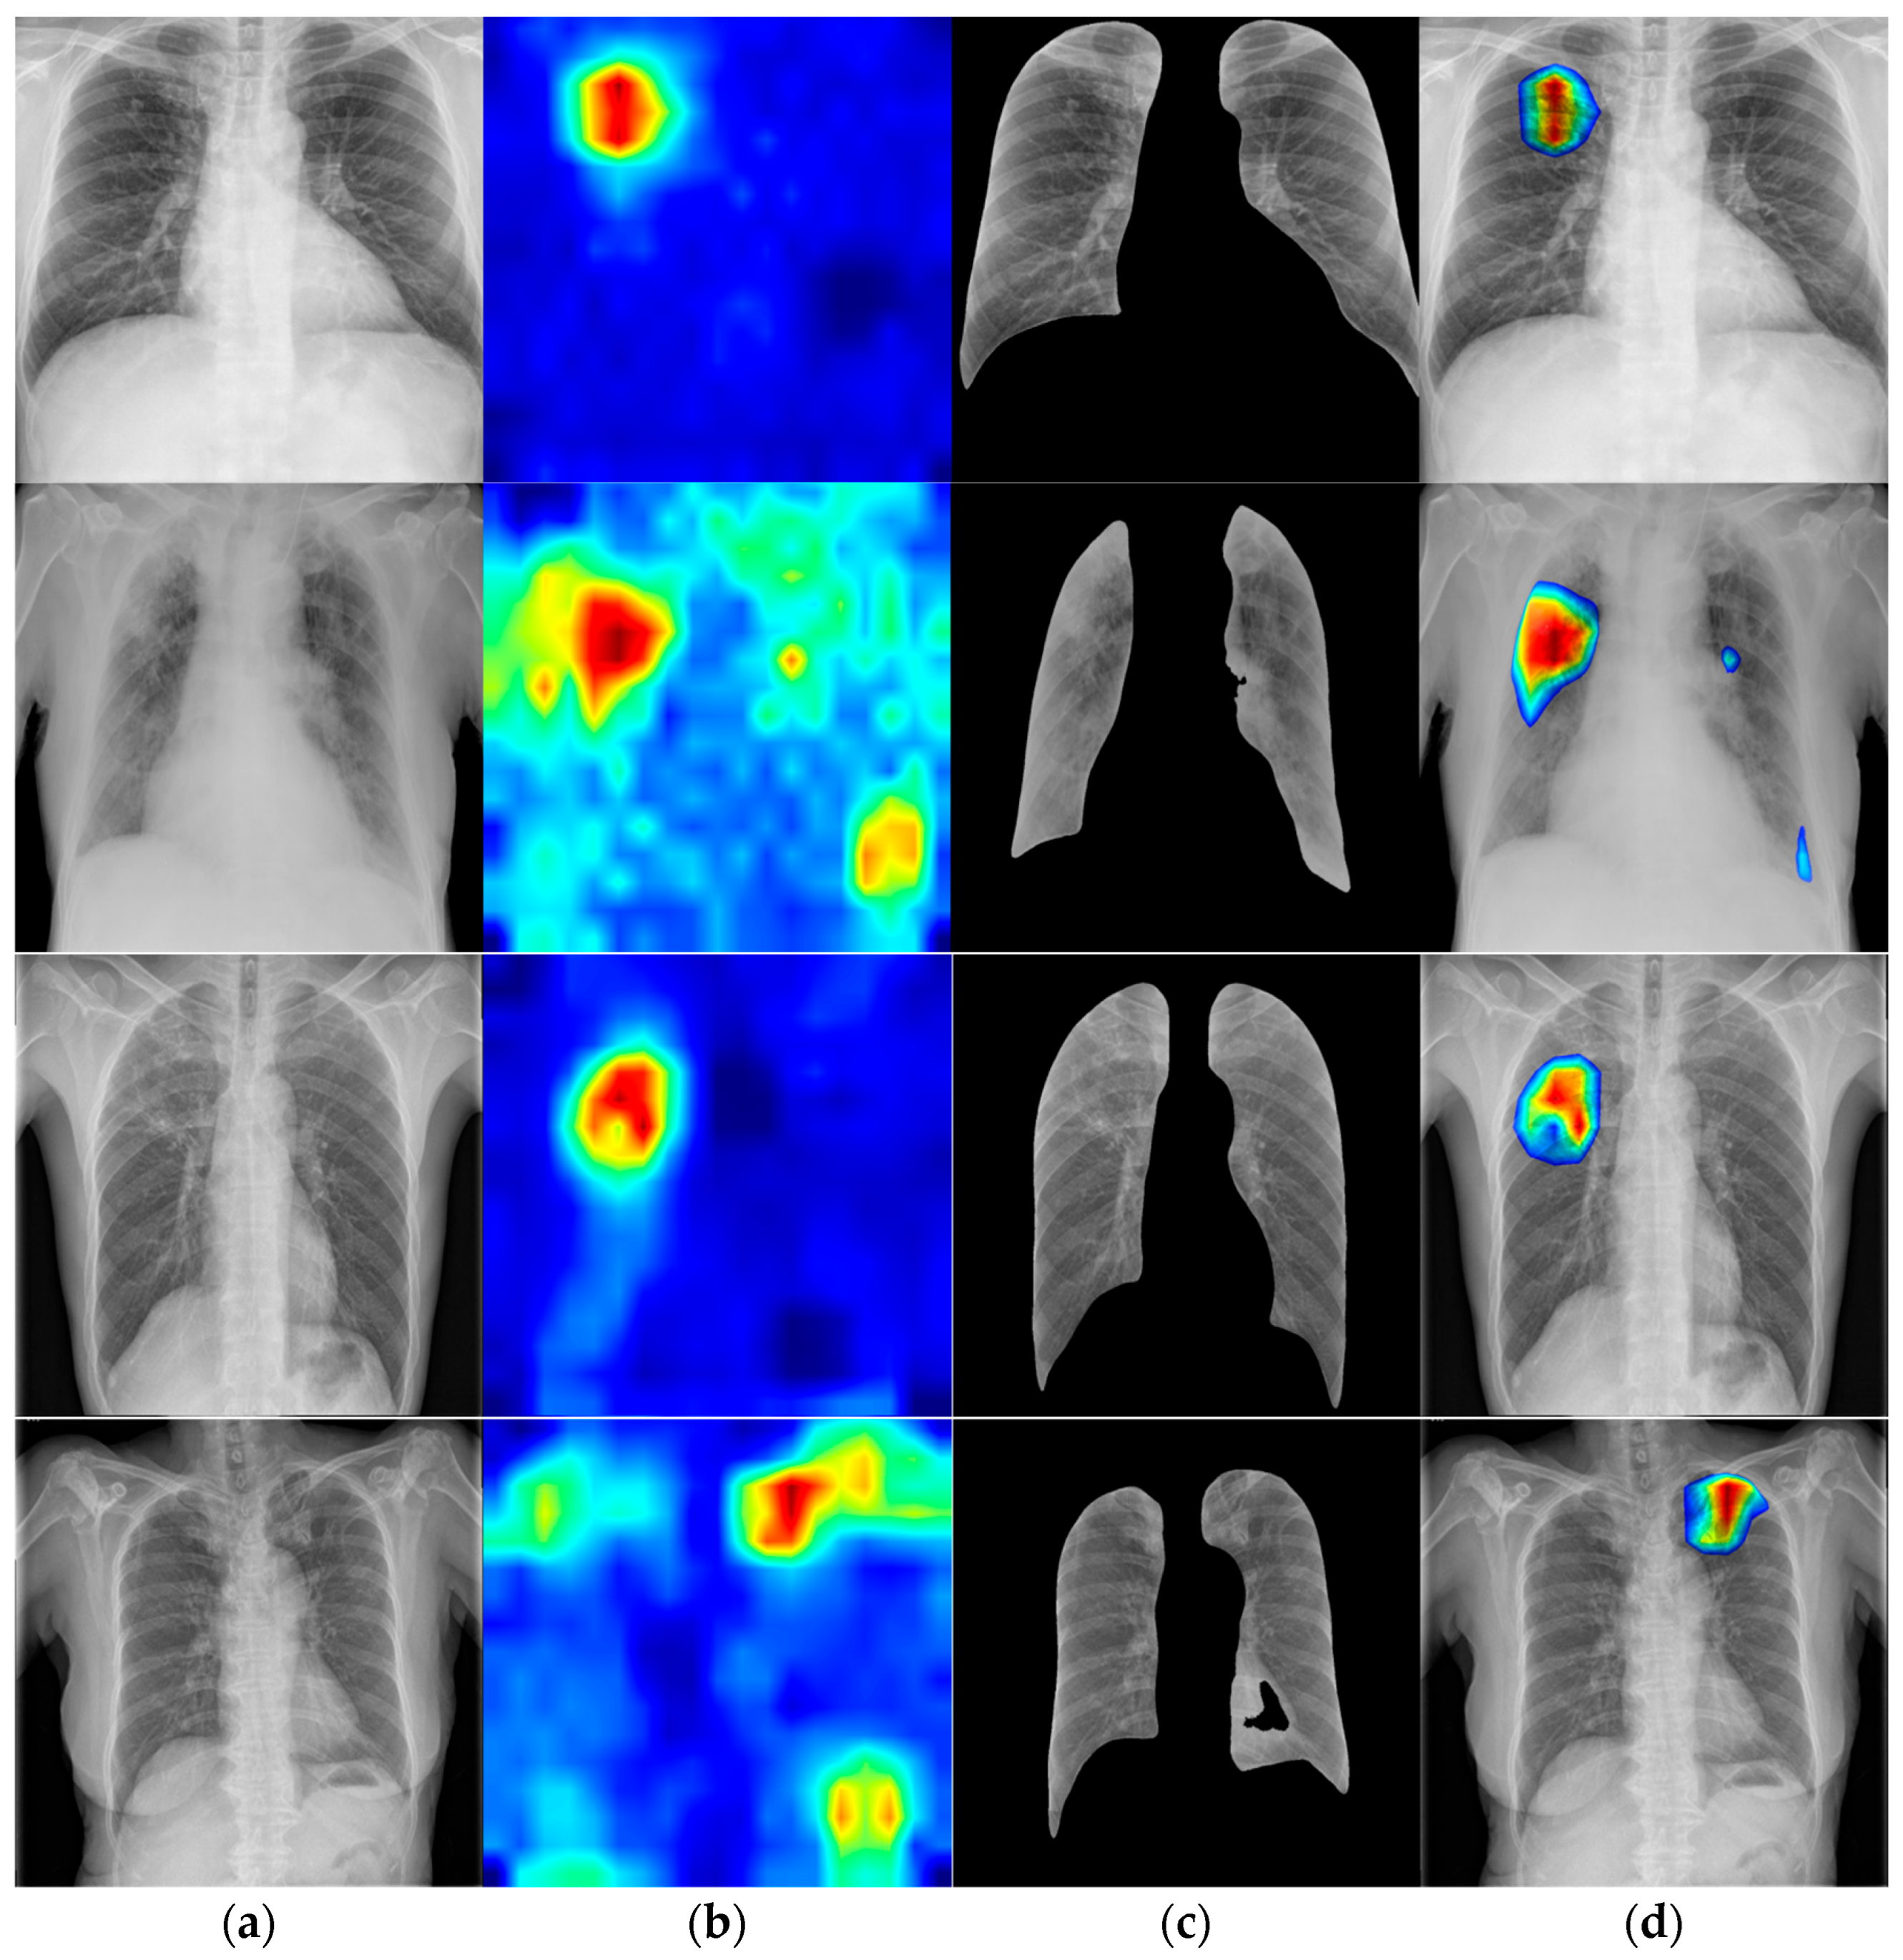
3.5. Visualization
4. Experimental Environment
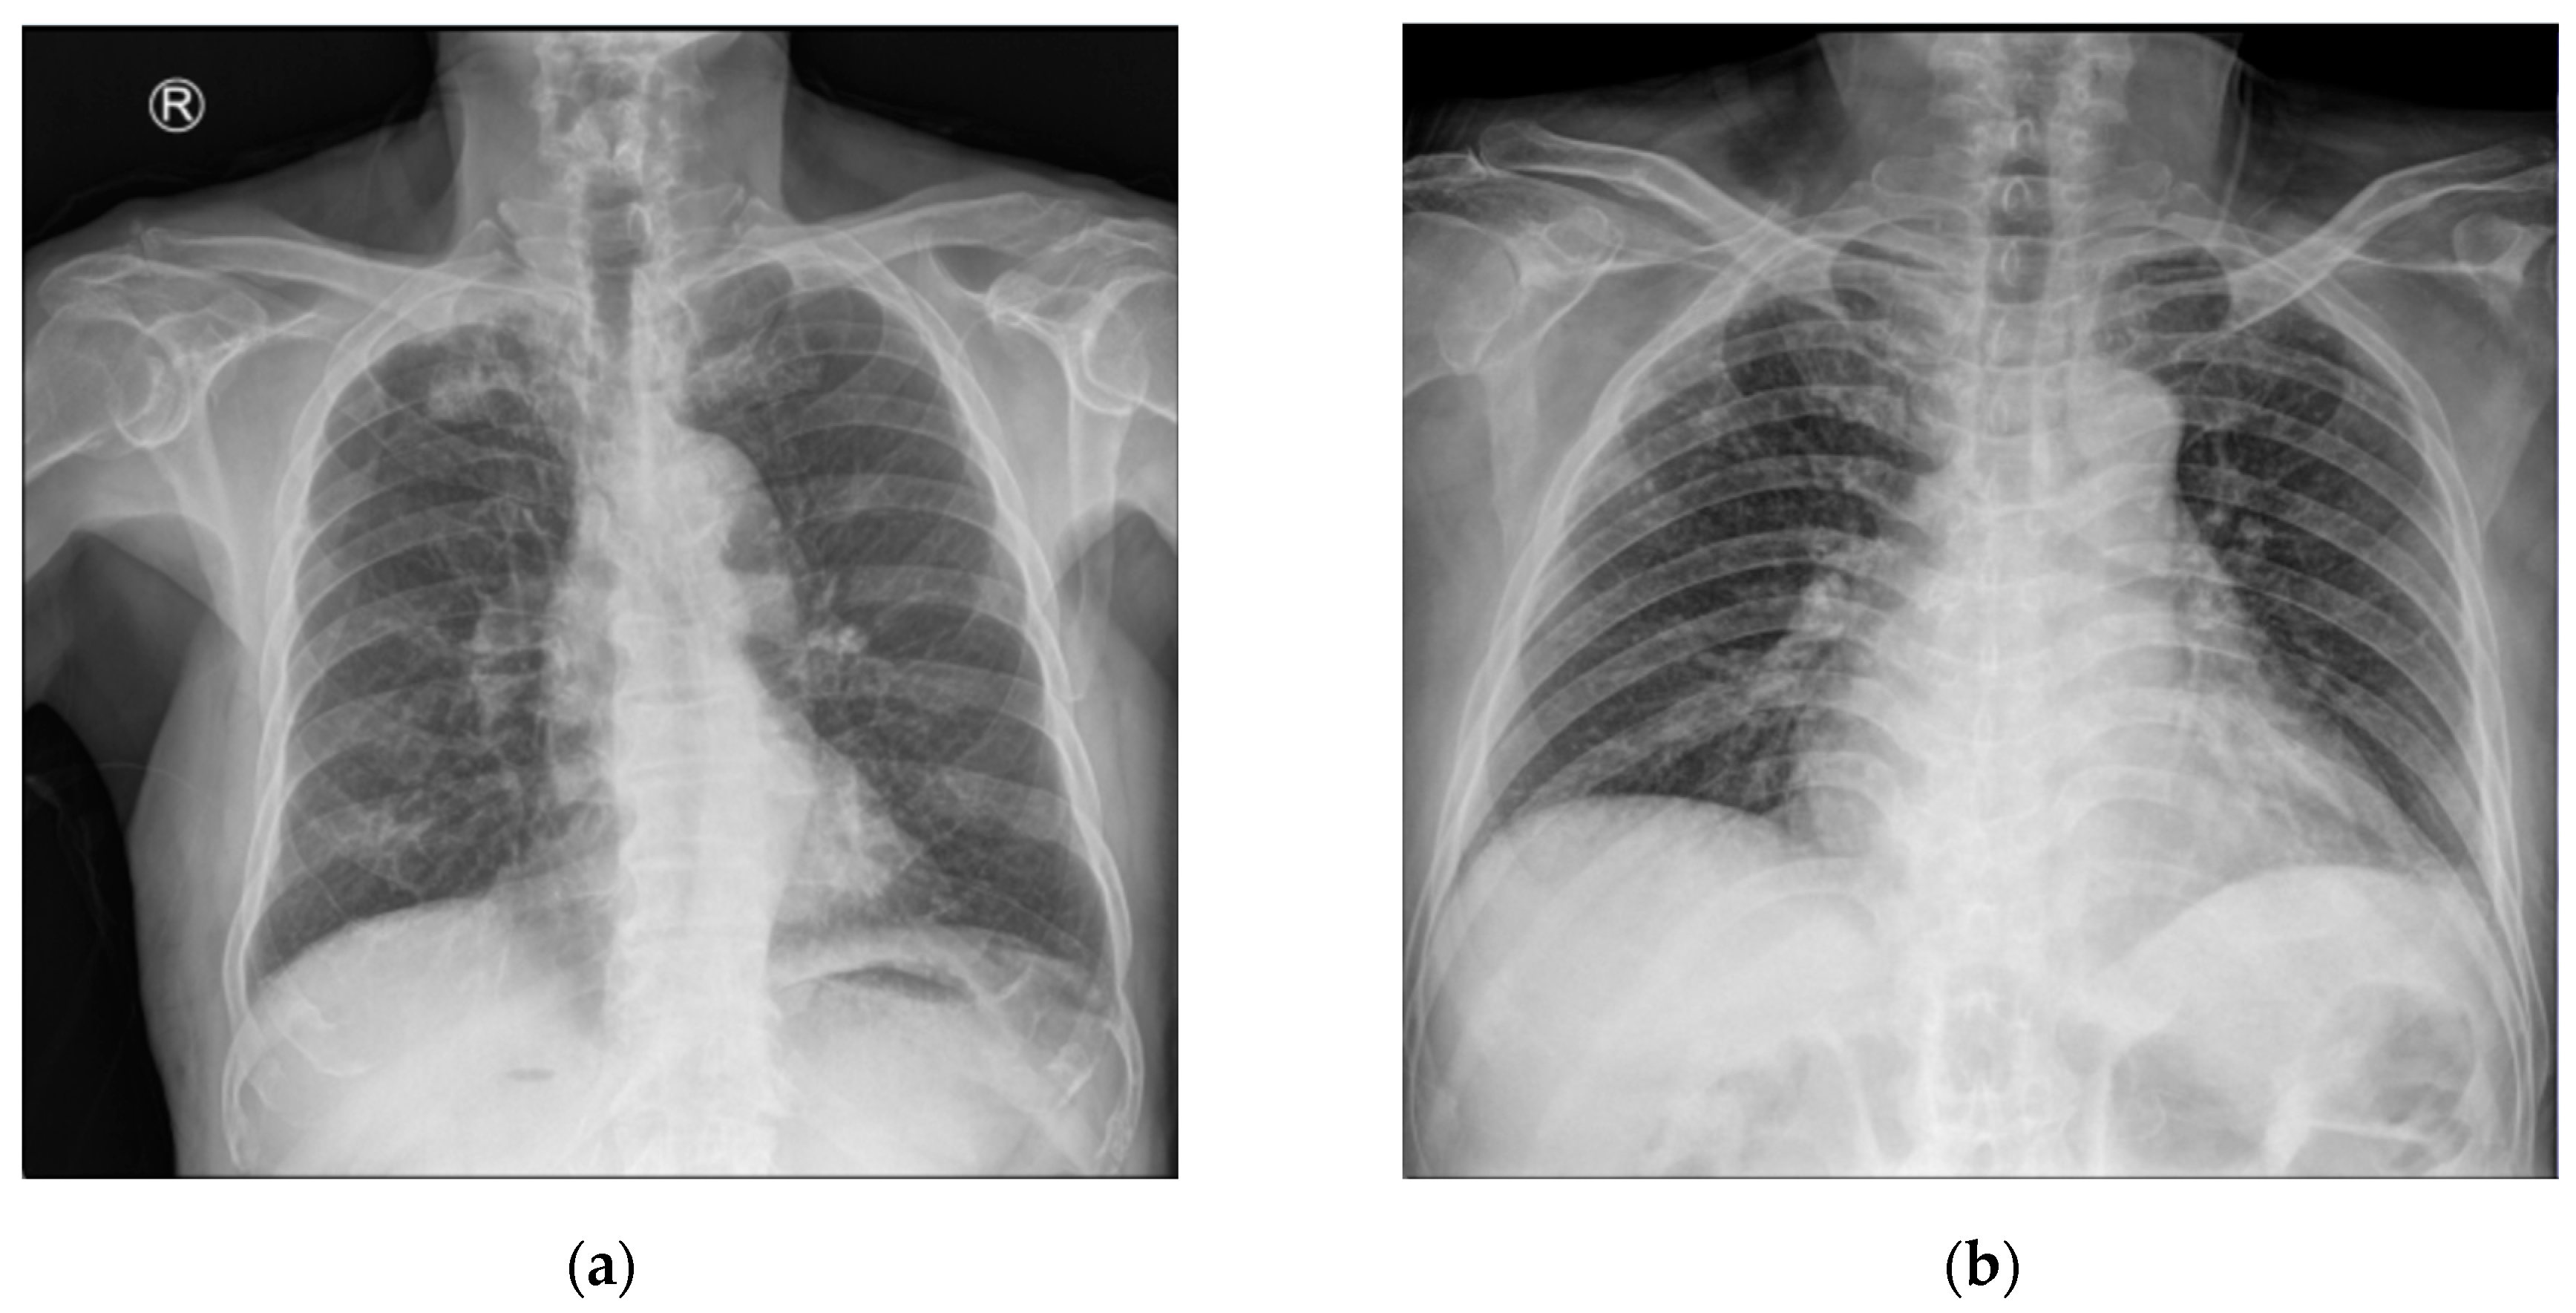
4.1. Dataset
4.2. Data Preprocsssing
4.3. Environmental Setup
4.4. Hyperparameters
4.5. Evaluation Metrics
5. Experimental Results
5.1. Evaluation Result
5.2. Comparison with Prior Work
5.3. Comparison with State-of-the-Art Methods
6. Conclusions
Author Contributions
Funding
Institutional Review Board Statement
Informed Consent Statement
Data Availability Statement
Conflicts of Interest
References
- World Health Organization. Ending TB in the South-East Asia Region: Regional Strategic Plan 2016–2020; World Health Organization: Geneva, Switzerland, 2016.
- Raviglione, M.; Director, G.T. Global Strategy and Targets for Tuberculosis Prevention, Care and Control after 2015; World Health Organization: Geneva, Switzerland, 2013. [Google Scholar]
- Bashir, S.; Kik, S.V.; Ruhwald, M.; Khan, A.; Tariq, M.; Hussain, H.; Denkinger, C.M. Economic analysis of different throughput scenarios and implementation strategies of computer-aided detection software as a screening and triage test for pulmonary TB. PLoS ONE 2022, 17, e0277393. [Google Scholar] [CrossRef] [PubMed]
- Global TB Diagnostics Market. Available online: https://www.sphericalinsights.com/reports/tb-diagnostics-market (accessed on 11 October 2024).
- Clinical Overview of Latent Tuberculosis Infection. Available online: https://www.cdc.gov/tb/hcp/clinical-overview/latent-tuberculosis-infection.html (accessed on 11 October 2024).
- Ding, C.; Hu, M.; Guo, W.; Hu, W.; Li, X.; Wang, S.; Shangguan, Y.; Zhang, Y.; Yang, S.; Xu, K. Prevalence trends of latent tuberculosis infection at the global, regional, and country levels from 1990–2019. Int. J. Infect. Dis. 2022, 122, 46–62. [Google Scholar] [CrossRef]
- Houben, R.M.; Dodd, P.J. The global burden of latent tuberculosis infection: A re-estimation using mathematical modelling. PLoS Med. 2016, 13, e1002152. [Google Scholar] [CrossRef]
- Santosh, K.C.; Allu, S.; Rajaraman, S.; Antani, S. Advances in deep learning for tuberculosis screening using chest X-rays: The last 5 years review. J. Med. Syst. 2022, 46, 82. [Google Scholar] [CrossRef]
- Alim, N.; Mulyantoro, D.K.; Rusyadi, L. The Impact of Implementing a Picture Archiving and Communication System (PACS) on Minimum Service Standards in the Field of Radiology. Int. J. Soc. Health 2024, 3, 245–263. [Google Scholar] [CrossRef]
- Singh, M.; Pujar, G.V.; Kumar, S.A.; Bhagyalalitha, M.; Akshatha, H.S.; Abuhaija, B.; Alsoud, A.R.; Abualigah, L.; Beeraka, N.M.; Gandomi, A.H. Evolution of machine learning in tuberculosis diagnosis: A review of deep learning-based medical applications. Electronics 2022, 11, 2634. [Google Scholar] [CrossRef]
- Yayan, J.; Franke, K.J.; Berger, M.; Windisch, W.; Rasche, K. Early detection of tuberculosis: A systematic review. Pneumonia 2024, 16, 11. [Google Scholar] [CrossRef]
- Vaswani, A.; Shazeer, N.; Parmar, N.; Uszkoreit, J.; Jones, L.; Gomez, A.N.; Kaiser, L.; Polosukhin, I. Attention is all you need. In Proceedings of the Advances in Neural Information Processing Systems 30 (NIPS 2017), Long Beach, CA, USA, 4–9 December 2017. [Google Scholar]
- Hong, M.; Rim, B.; Lee, H.; Jang, H.; Oh, J.; Choi, S. Multi-class classification of lung diseases using CNN models. Appl. Sci. 2021, 11, 9289. [Google Scholar] [CrossRef]
- Kim, S.; Rim, B.; Choi, S.; Lee, A.; Min, S.; Hong, M. Deep learning in multi-class lung diseases’ classification on chest X-ray images. Diagnostics 2022, 12, 915. [Google Scholar] [CrossRef]
- Oh, J.; Park, C.; Lee, H.; Rim, B.; Kim, Y.; Hong, M.; Lyu, J.; Han, S.; Choi, S. OView-AI supporter for classifying pneumonia, pneumothorax, tuberculosis, lung cancer chest X-ray images using multi-stage superpixels classification. Diagnostics 2023, 13, 1519. [Google Scholar] [CrossRef]
- Schalekamp, S.; van Leeuwen, K.; Calli, E.; Murphy, K.; Rutten, M.; Geurts, B.; Peters-Bax, L.; van Ginneken, B.; Prokop, M. Performance of AI to exclude normal chest radiographs to reduce radiologists’ workload. Eur. Radiol. 2024, 34, 7255–7263. [Google Scholar] [CrossRef] [PubMed]
- Choi, Y.R.; Yoon, S.H.; Kim, J.; Yoo, J.Y.; Kim, H.; Jin, K.N. Chest radiography of tuberculosis: Determination of activity using deep learning algorithm. Tuberc. Respir. Dis. 2023, 86, 226. [Google Scholar] [CrossRef] [PubMed]
- He, K.; Zhang, X.; Ren, S.; Sun, J. Deep residual learning for image recognition. In Proceedings of the IEEE Conference on Computer Vision and Pattern Recognition, Las Vegas, NV, USA, 27–30 June 2016; pp. 770–778. [Google Scholar]
- Lee, S.; Yim, J.J.; Kwak, N.; Lee, Y.J.; Lee, J.K.; Lee, J.Y.; Kim, J.S.; Kang, Y.A.; Jeon, D.; Jang, M.J.; et al. Deep learning to determine the activity of pulmonary tuberculosis on chest radiographs. Radiology 2021, 301, 435–442. [Google Scholar] [CrossRef] [PubMed]
- Tan, M.; Le, Q. Efficientnet: Rethinking model scaling for convolutional neural networks. In Proceedings of the International Conference on Machine Learning, Long Beach, CA, USA, 9–15 June 2019; pp. 6105–6114. [Google Scholar]
- Kazemzadeh, S.; Yu, J.; Jamshy, S.; Pilgrim, R.; Nabulsi, Z.; Chen, C.; Beladia, N.; Lau, C.; McKinney, S.M.; Hughes, T.; et al. Deep learning detection of active pulmonary tuberculosis at chest radiography matched the clinical performance of radiologists. Radiology 2023, 306, 124–137. [Google Scholar] [CrossRef]
- Munadi, K.; Muchtar, K.; Maulina, N.; Pradhan, B. Image enhancement for tuberculosis detection using deep learning. IEEE Access 2020, 8, 217897–217907. [Google Scholar] [CrossRef]
- Polesel, A.; Ramponi, G.; Mathews, V.J. Image enhancement via adaptive unsharp masking. IEEE Trans. Image Process. 2000, 9, 505–510. [Google Scholar] [CrossRef]
- Bundy, A.; Wallen, L. High-emphasis filtering. In Catalogue of Artificial Intelligence Tools; Springer: Berlin/Heidelberg, Germany, 1984; p. 47. [Google Scholar]
- Zuiderveld, K. Contrast limited adaptive histogram equalization. Graph. Gems IV 1994, 4, 474–485. [Google Scholar]
- Yogi Pramana, A.A.G.; Ihza Permana, F.; Fazil Maulana, M.; Rahadian Fudholi, D. Few-Shot Learning Approach on Tuberculosis Classification Based on Chest X-Ray Images. arXiv 2024, arXiv:2409.11644. [Google Scholar]
- Snell, J.; Swersky, K.; Zemel, R. Prototypical networks for few-shot learning. In Proceedings of the 31st Conference on Neural Information Processing Systems (NIPS 2017), Long Beach, CA, USA, 4–9 December 2017. [Google Scholar]
- Simonyan, K.; Zisserman, A. Very deep convolutional networks for large-scale image recognition. arXiv 2014, arXiv:1409.1556. [Google Scholar]
- Tasci, E.; Uluturk, C.; Ugur, A. A voting-based ensemble deep learning method focusing on image augmentation and preprocessing variations for tuberculosis detection. Neural Comput. Appl. 2021, 33, 15541–15555. [Google Scholar] [CrossRef]
- Szegedy, C.; Liu, W.; Jia, Y.; Sermanet, P.; Reed, S.; Anguelov, D.; Erhan, D.; Vanhoucke, V.; Rabinovich, A. Going deeper with convolutions. In Proceedings of the IEEE Conference on Computer Vision and Pattern Recognition, Boston, MA, USA, 7–12 June 2015; pp. 1–9. [Google Scholar]
- Chollet, F. Xception: Deep learning with depthwise separable convolutions. In Proceedings of the IEEE Conference on Computer Vision and Pattern Recognition, Honolulu, HI, USA, 21–26 July 2017; pp. 1251–1258. [Google Scholar]
- Prasad, A.; Agarwal, A.; Reddy, C.R. A Transfer learning-Based ViT Model For Tuberculosis Detection And Analysis Using Chest X-ray Images. J. Eng. Sci. 2023, 14, 209–217. [Google Scholar]
- Dosovitskiy, A.; Beyer, L.; Kolesnikov, A.; Weissenborn, D.; Zhai, X.; Unterthiner, T.; Dehghani, M.; Minderer, M.; Heigold, G.; Gelly, S.; et al. An image is worth 16x16 words: Transformers for image recognition at scale. arXiv 2020, arXiv:2010.11929. [Google Scholar]
- Ronneberger, O.; Fischer, P.; Brox, T. U-Net: Convolutional Networks for Biomedical Image Segmentation. In Proceedings of the International Conference on Medical Image Computing and Computer-Assisted Intervention (MICCAI), Munich, Germany, 5–9 October 2015; pp. 234–241. [Google Scholar]
- Tolstikhin, I.; Houlsby, N.; Kolesnikov, A.; Beyer, L.; Zhai, X.; Unterthiner, T.; Yung, J.; Steiner, A.; Keysers, D.; Uszkoreit, J.; et al. MLP-Mixer: An all-MLP Architecture for Vision. arXiv 2021, arXiv:2105.01601. [Google Scholar]
- Sun, C.; Shrivastava, A.; Singh, S.; Gupta, A. Revisiting unreasonable effectiveness of data in deep learning era. In Proceedings of the IEEE International Conference on Computer Vision, Venice, Italy, 22–29 October 2017; pp. 843–852. [Google Scholar]
- Xie, Q.; Luong, M.T.; Hovy, E.; Le, Q.V. Self-training with noisy student improves imagenet classification. In Proceedings of the IEEE/CVF Conference on Computer Vision and Pattern Recognition, Virtual, 14–19 May 2020; pp. 10687–10698. [Google Scholar]
- Wan, L.; Zeiler, M.; Zhang, S.; Le Cun, Y.; Fergus, R. Regularization of neural networks using dropconnect. In Proceedings of the International Conference on Machine Learning, Atlanta, GA, USA, 16–21 June 2013; pp. 1058–1066. [Google Scholar]
- Hinton, G.E.; Srivastava, N.; Krizhevsky, A.; Sutskever, I.; Salakhutdinov, R.R. Improving neural networks by preventing co-adaptation of feature detectors. arXiv 2012, arXiv:1207.0580. [Google Scholar]
- Zhuang, J.; Tang, T.; Ding, Y.; Tatikonda, S.C.; Dvornek, N.; Papademetris, X.; Duncan, J. Adabelief optimizer: Adapting stepsizes by the belief in observed gradients. Adv. Neural Inf. Process. Syst. 2020, 33, 18795–18806. [Google Scholar]
- Lin, T.Y.; Goyal, P.; Girshick, R.; He, K.; Dollár, P. Focal loss for dense object detection. In Proceedings of the IEEE International Conference on Computer Vision, Venice, Italy, 22–29 October 2017; pp. 2980–2988. [Google Scholar]
- Nishikawa, S.; Yamada, I. Studio Ousia at the NTCIR-15 SHINRA2020-ML Task. In Proceedings of the 15th NTCIR Conference on Evaluation of Information Access Technologies, Tokyo, Japan, 8–11 December 2020. [Google Scholar]
- Selvaraju, R.R.; Cogswell, M.; Das, A.; Vedantam, R.; Parikh, D.; Batra, D. Grad-cam: Visual explanations from deep networks via gradient-based localization. In Proceedings of the IEEE International Conference on Computer Vision, Venice, Italy, 22–29 October 2017; pp. 618–626. [Google Scholar]
- The Image Named CHNCXR are Originally from Shenzhen Hospital Tuberculosis CXR Set. Available online: https://data.lhncbc.nlm.nih.gov/public/Tuberculosis-Chest-X-ray-Datasets/Shenzhen-Hospital-CXR-Set/index.html (accessed on 11 April 2025).
- The Image Named MCUCXR are Originally from Montgomery County Tuberculosis CXR Set. Available online: https://data.lhncbc.nlm.nih.gov/public/Tuberculosis-Chest-X-ray-Datasets/Montgomery-County-CXR-Set/MontgomerySet/index.html (accessed on 11 April 2025).
- NIH Chest X-Ray Dataset. Available online: https://cloud.google.com/healthcare/docs/resources/public-datasets/nih-chest (accessed on 1 June 2025).
- Cubuk, E.D.; Zoph, B.; Shlens, J.; Le, Q.V. Randaugment: Practical automated data augmentation with a reduced search space. In Proceedings of the IEEE/CVF Conference on Computer Vision and Pattern Recognition Workshops, Seattle, WA, USA, 14–19 June 2020; pp. 702–703. [Google Scholar]
- Howard, A.; Sandler, M.; Chu, G.; Chen, L.C.; Chen, B.; Tan, M.; Wang, W.; Zhu, Y.; Pang, R.; Vasudevan, V.; et al. Searching for mobilenetv3. In Proceedings of the IEEE International Conference on Computer Vision, Seoul, Republic of Korea, 27 October–2 November 2019; pp. 1314–1324. [Google Scholar]
- Huang, G.; Liu, Z.; Van Der Maaten, L.; Weinberger, K.Q. Densely connected convolutional networks. In Proceedings of the IEEE Conference on Computer Vision and Pattern Recognition, Honolulu, HI, USA, 21–26 July 2017; pp. 2261–2269. [Google Scholar]
- Liu, Z.; Mao, H.; Wu, C.Y.; Feichtenhofer, C.; Darrell, T.; Xie, S. A convnet for the 2020s. In Proceedings of the IEEE/CVF Conference on Computer Vision and Pattern Recognition, New Orleans, LA, USA, 18–24 June 2022; pp. 11976–11986. [Google Scholar]
- Lee, H.C.; Jang, H.W.; Jeon, W.S.; Choi, S.J. Diagnosis of Tympanic Membrane Disease and Pediatric Hearing Using Convolutional Neural Network Models with Multi-Layer Perceptrons. Appl. Sci. 2024, 14, 5457. [Google Scholar] [CrossRef]


| Paper | Class | Model | Task | AUC | Accuracy |
|---|---|---|---|---|---|
| Choi et al. [17] | Active TB, Inactive TB | ResNet50 | Binary | 0.887 | - |
| Lee et al. [19] | Active TB, Inactive TB | EfficientNet | Binary | 0.84 | - |
| Kazemzadeh et al. [21] | Active TB, Inactive TB, Normal | EfficientNet | Multi-class | 0.89 | |
| Munadi et al. [22] | Active TB, Non-TB | EfficientNet | Binary | 0.948 | - |
| Pramana et al. [26] | Active TB, Non-TB, Healthy | ResNet18 (few-shot learning) | Multi-class | - | 0.989 |
| Tasci et al. [29] | Active TB, Normal | InceptionV3 and Xception (ensemble learning) | Binary | - | 0.975 |
| Prasad et al. [32] | TB, Pneumonia, Normal | ViT | Multi-class | 0.954 |
| Training Set | Validation Set | Test Set | Total | |
|---|---|---|---|---|
| Active TB 1 | 1371 | 171 | 171 | 1713 |
| Inactive TB | 1693 | 211 | 211 | 2115 |
| Total | 3064 | 382 | 382 | 3828 |
| Training Set | Test Set | Total | |
|---|---|---|---|
| Lung X-ray data | 562 | 142 | 704 |
| Training Set | Test Set | Total | |
|---|---|---|---|
| Normal | 2676 | 669 | 3345 |
| Pneumonia | 1114 | 278 | 1392 |
| Pneumothorax | 4210 | 1053 | 5263 |
| Total | 8000 | 2000 | 10,000 |
| Parameter | Value |
|---|---|
| Input shape | 600, 600, 3 |
| Feature scaling | [−1, +1] |
| Data augmentation | RandAugment (N = 2, M = 28) |
| Regularization | Drop connect (0.5), drop out (0.5) |
| Optimizer | AdaBelief (Learning rate = 4 × 10⁻⁵, weight decay = 1 × 10⁻⁴, global clipnorm = 1, rectify = true, warmup proportion = 0.1) |
| Loss | Binary focal cross entropy (label smoothing = 0.1, γ = 2) |
| Classifier | Sigmoid |
| Batch size | 32 |
| Epoch | 300 |
| Accuracy | Sensitivity | Specificity | |
|---|---|---|---|
| Validation set | 94.5% | 95.3% | 93.8% |
| Prediction | |||
|---|---|---|---|
| Positive | Negative | ||
| Actual | Positive | 164 | 7 |
| Negative | 7 | 204 | |
| Accuracy | Sensitivity | Specificity | F1-Score | AUC | |
|---|---|---|---|---|---|
| Test set | 96.3% | 95.9% | 96.6% | 95.9% | 98.6% |
| 95% CI | (94.2–98.1%) | (92.6–98.7%) | (94–98.9%) | (93.5–97.9%) | (97.3–99.5%) |
| Dice | IoU | |
|---|---|---|
| Test set | 94.4% | 89.4% |
| Paper | Class | Model | AUC | Accuracy |
|---|---|---|---|---|
| Choi et al. [17] | Active TB, Inactive TB | ResNet50 | 88.7% | |
| Lee et al. [19] | Active TB, Inactive TB | EfficientNet | 84% | |
| Munadi et al. [22] | Active TB, Non-TB | EfficientNet | 94.8% | |
| Kazemzadeh et al. [21] | Active TB, Inactive TB, Normal | EfficientNet | 89% | |
| Prasad et al. [32] | TB, Pneumonia, Normal | ViT | 95.4% | |
| Pramana et al. [26] | Active TB, Non-TB, Healthy | ResNet18 (few-shot learning) | 98.9% | |
| Tasci1 et al. [29] | Active TB, Normal | InceptionV3 and Xception (ensemble learning) | 97.5% | |
| Ours | Active TB, Inactive TB | EfficientNet | 98.6% | 96.3% |
| Model | Accuracy | Sensitivity | Specificity | F1-Score | Per-Frame Latency |
|---|---|---|---|---|---|
| MobileNetV3 [48] | 90.5% | 82.4% | 97.1% | 88.3% | 0.04 s |
| DenseNet201 [49] | 92.6% | 90% | 94.7% | 91.6% | 0.06 s |
| InceptionV3 [30] | 92.9% | 94.7% | 91.4% | 92.3% | 0.05 s |
| EfficientNet B7 [20] | 93.4% | 90.6% | 95.7% | 92.5% | 0.07 s |
| ViT [33] | 93.4% | 92.98% | 93.84% | 92.71% | 0.15 s |
| ConvNeXt [50] | 94.2% | 92.9% | 95.2% | 93.5% | 0.14 s |
| EfficientNet B7 with MLPs [51] | 94.7% | 91.8% | 97.1% | 94% | 0.07 s |
| Ours | 96.3% | 95.9% | 96.6% | 95.9% | 0.07 s |
| Model | Accuracy | Sensitivity | Specificity |
|---|---|---|---|
| VGG 19 [28] | 84.25% | 76.36% | 88.18% |
| DenseNet201 [49] | 84.37% | 76.56% | 88.28% |
| EfficientNet B7 [20] | 84.76% | 77.14% | 88.57% |
| EfficientNet B7 with multi-GAP [13] | 85.15% | 77.73% | 88.86% |
| ConvNeXt [50] | 85.38% | 78.07% | 89.03% |
| Ours | 85.45% | 78.17% | 89.09% |
Disclaimer/Publisher’s Note: The statements, opinions and data contained in all publications are solely those of the individual author(s) and contributor(s) and not of MDPI and/or the editor(s). MDPI and/or the editor(s) disclaim responsibility for any injury to people or property resulting from any ideas, methods, instructions or products referred to in the content. |
© 2025 by the authors. Licensee MDPI, Basel, Switzerland. This article is an open access article distributed under the terms and conditions of the Creative Commons Attribution (CC BY) license (https://creativecommons.org/licenses/by/4.0/).
Share and Cite
Rim, B.; Jang, H.; Lee, H.; Jeon, W. Active and Inactive Tuberculosis Classification Using Convolutional Neural Networks with MLP-Mixer. Bioengineering 2025, 12, 630. https://doi.org/10.3390/bioengineering12060630
Rim B, Jang H, Lee H, Jeon W. Active and Inactive Tuberculosis Classification Using Convolutional Neural Networks with MLP-Mixer. Bioengineering. 2025; 12(6):630. https://doi.org/10.3390/bioengineering12060630
Chicago/Turabian StyleRim, Beanbonyka, Hyeonung Jang, Hongchang Lee, and Wangsu Jeon. 2025. "Active and Inactive Tuberculosis Classification Using Convolutional Neural Networks with MLP-Mixer" Bioengineering 12, no. 6: 630. https://doi.org/10.3390/bioengineering12060630
APA StyleRim, B., Jang, H., Lee, H., & Jeon, W. (2025). Active and Inactive Tuberculosis Classification Using Convolutional Neural Networks with MLP-Mixer. Bioengineering, 12(6), 630. https://doi.org/10.3390/bioengineering12060630