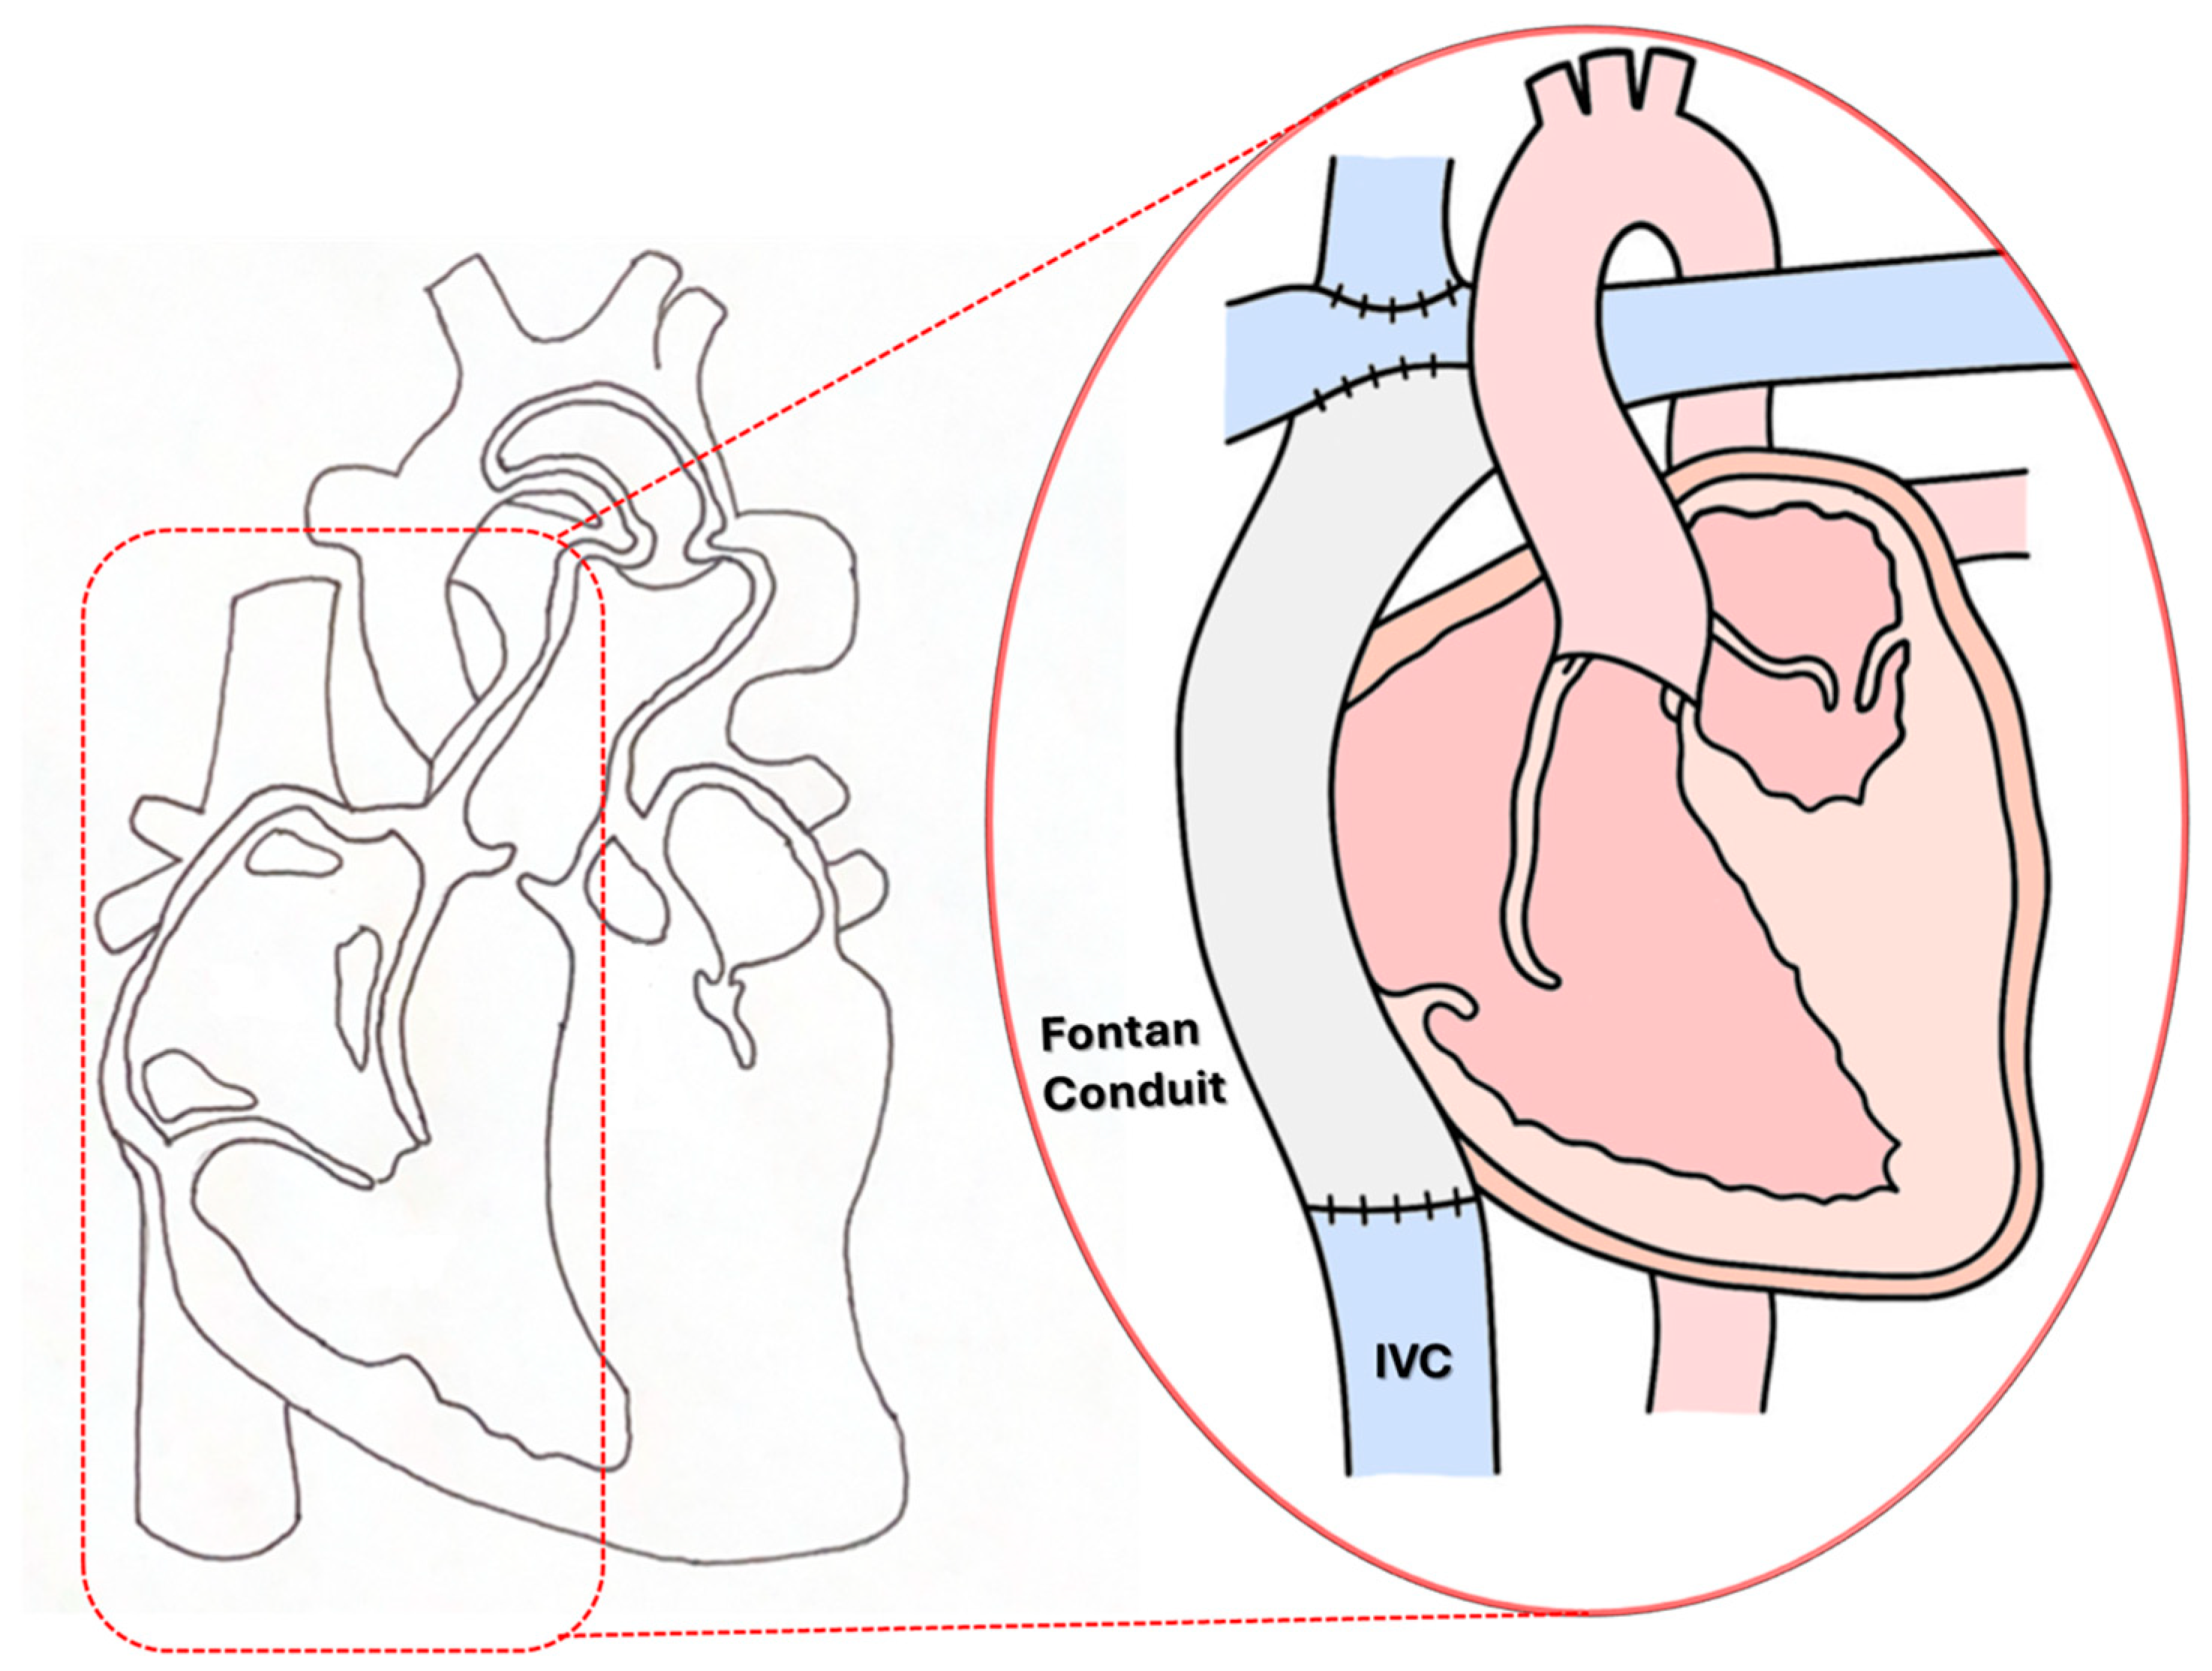
Figure 1.
Schematic illustration of the third-stage “Fontan Kreutzer” palliative procedure for a single ventricle (SV) anomaly.
Figure 1.
Schematic illustration of the third-stage “Fontan Kreutzer” palliative procedure for a single ventricle (SV) anomaly.
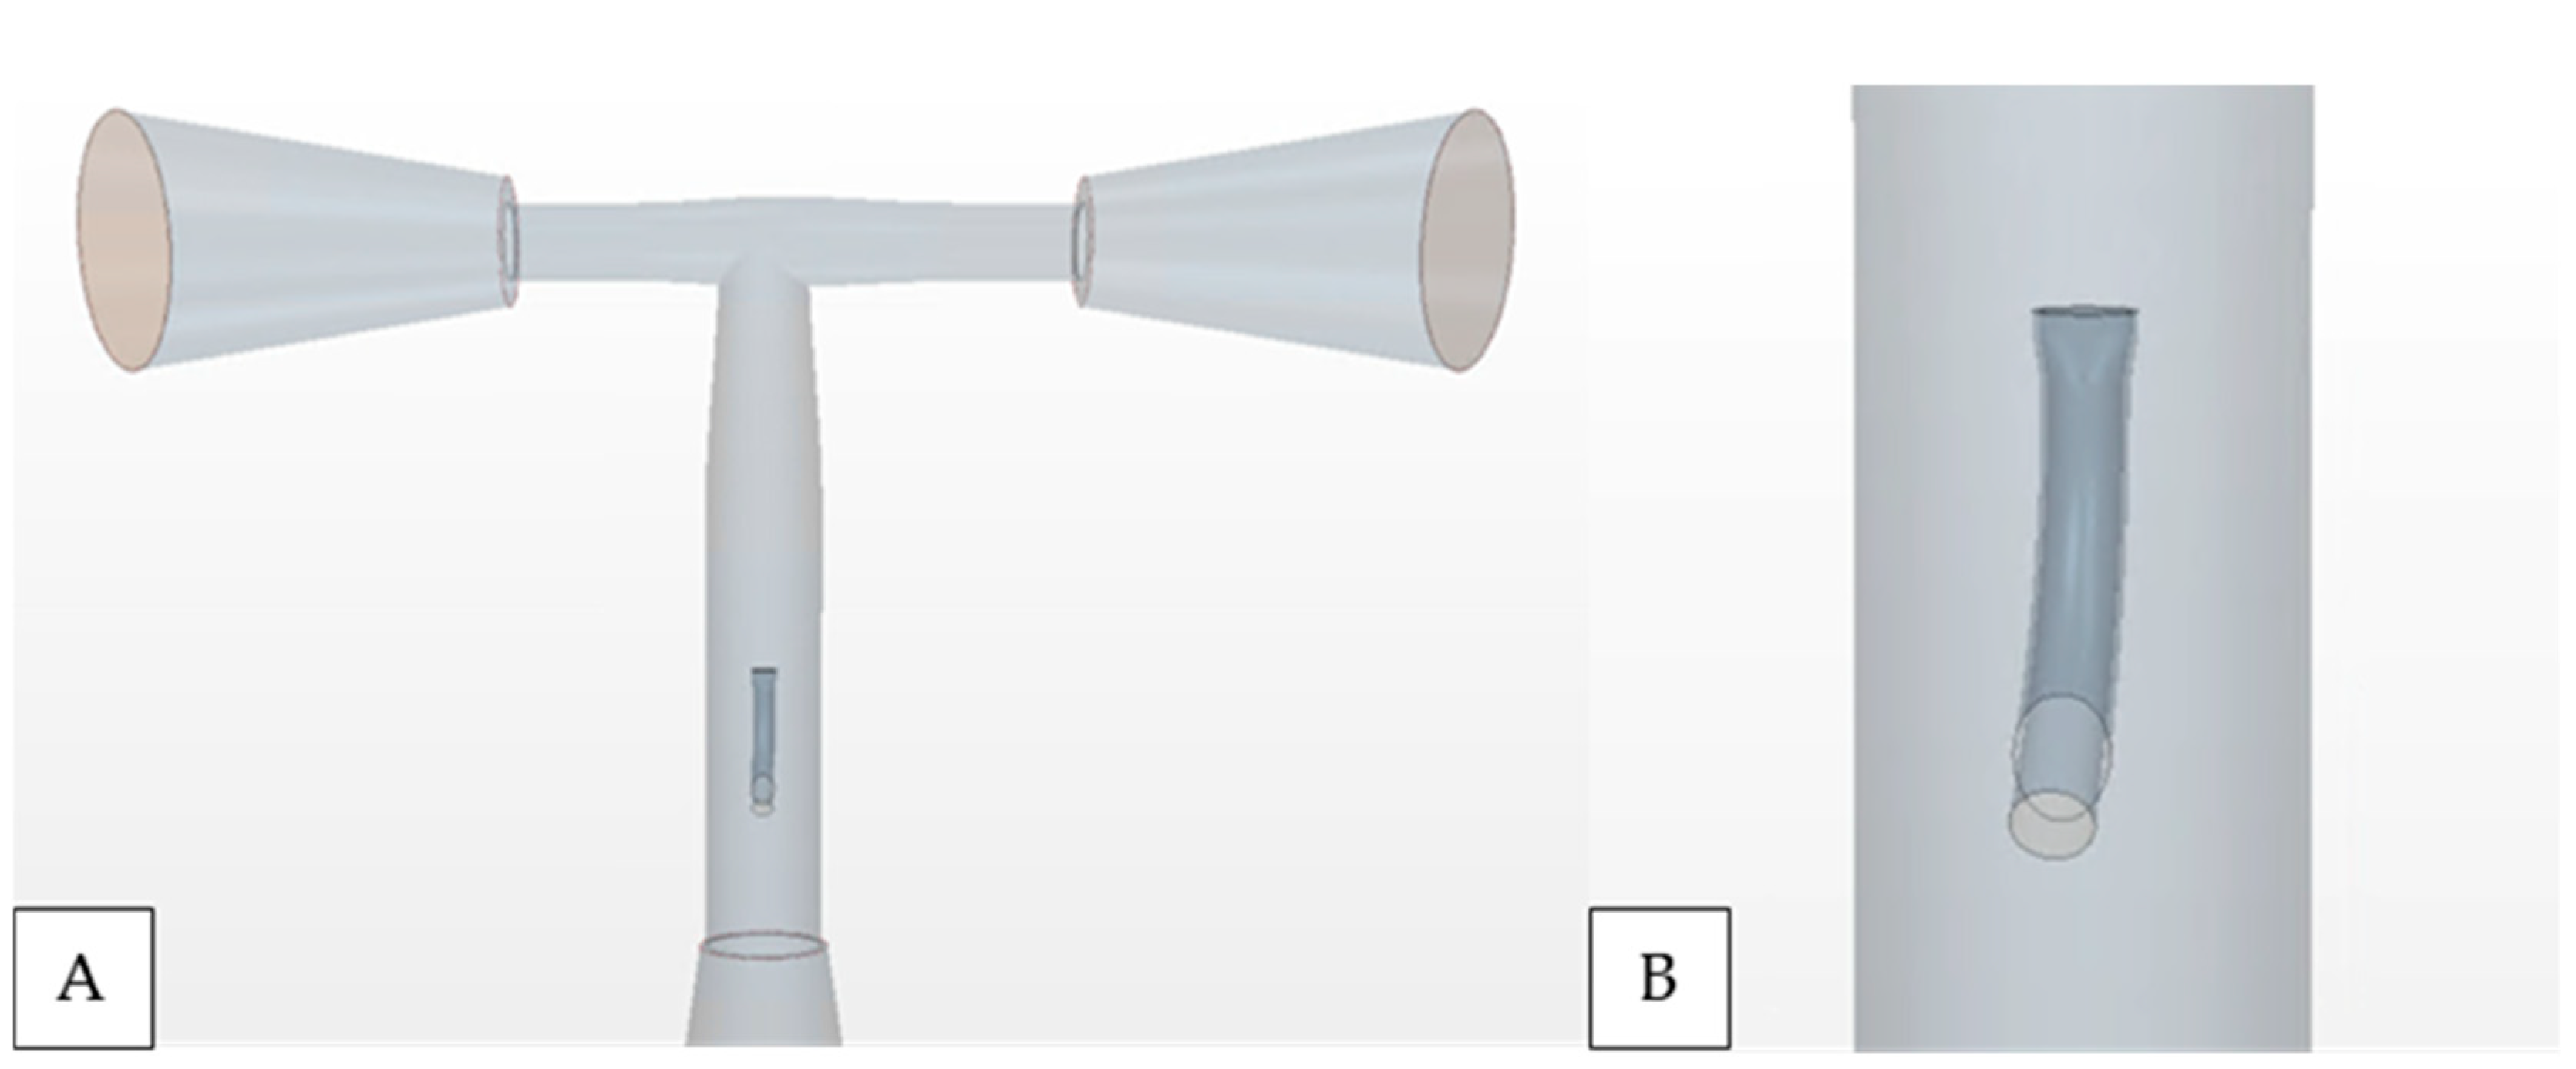
Figure 2.
(A) A simplified isolated T-junction TCPC morphology and (B) elliptical nozzle IJS in the Fontan conduit implemented along the centerline.
Figure 2.
(A) A simplified isolated T-junction TCPC morphology and (B) elliptical nozzle IJS in the Fontan conduit implemented along the centerline.
Figure 3.
Mesh detail in the Fontan conduit near the IJS displaying IJS wall surface refinement and volumetric wake refinement.
Figure 3.
Mesh detail in the Fontan conduit near the IJS displaying IJS wall surface refinement and volumetric wake refinement.
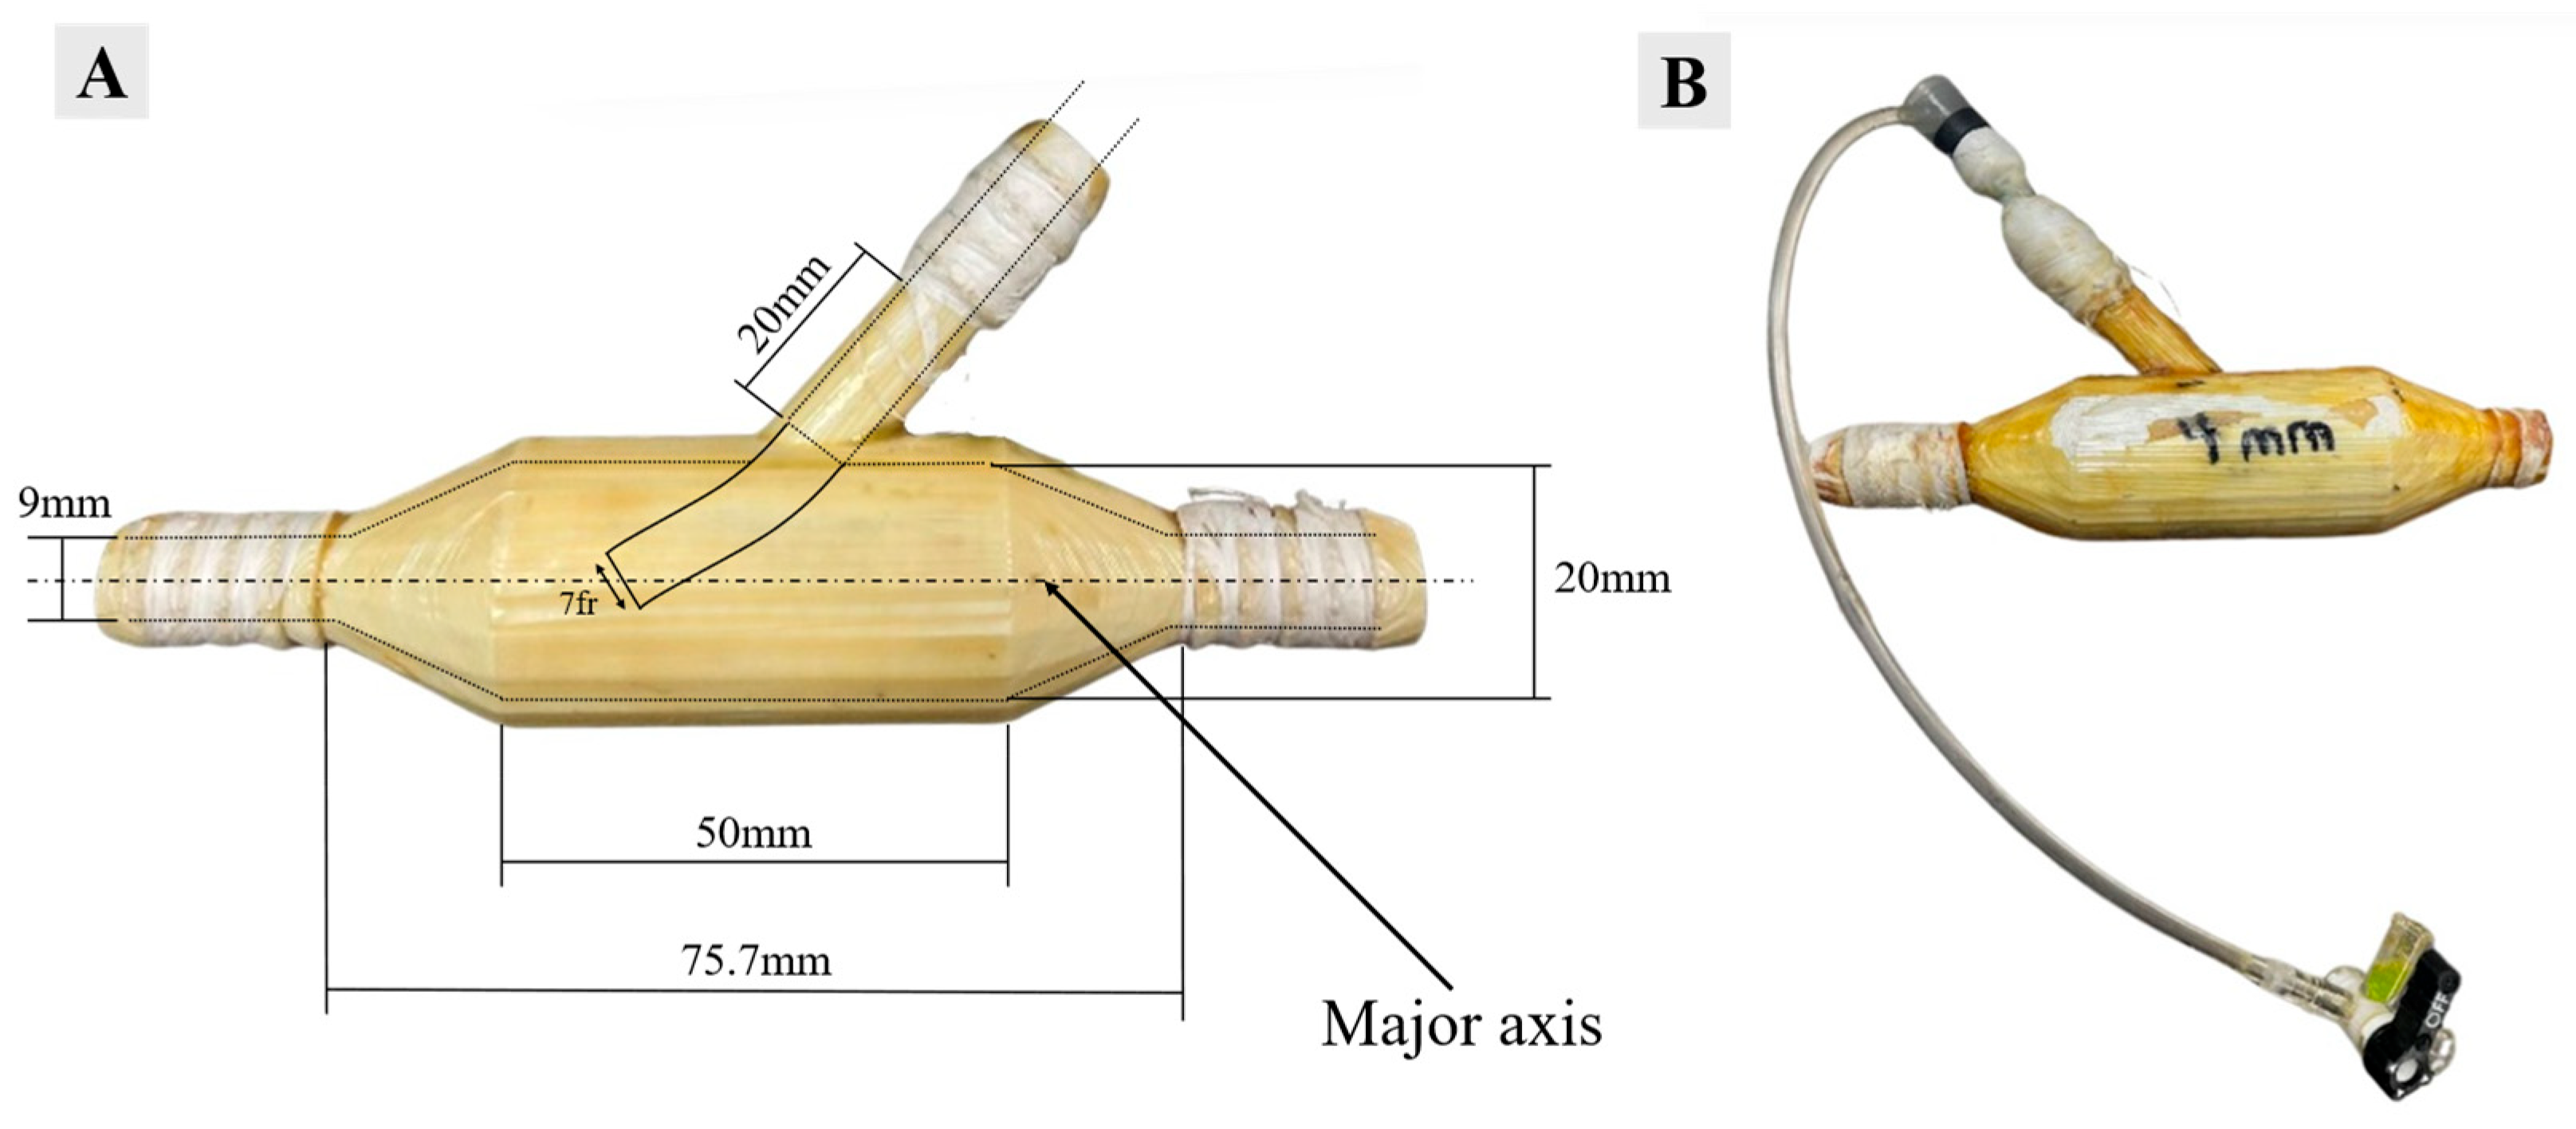
Figure 4.
(A) RPA injection shunt dimensions and (B) RPA injection shunt with a 7 fr catheter inserted.
Figure 4.
(A) RPA injection shunt dimensions and (B) RPA injection shunt with a 7 fr catheter inserted.
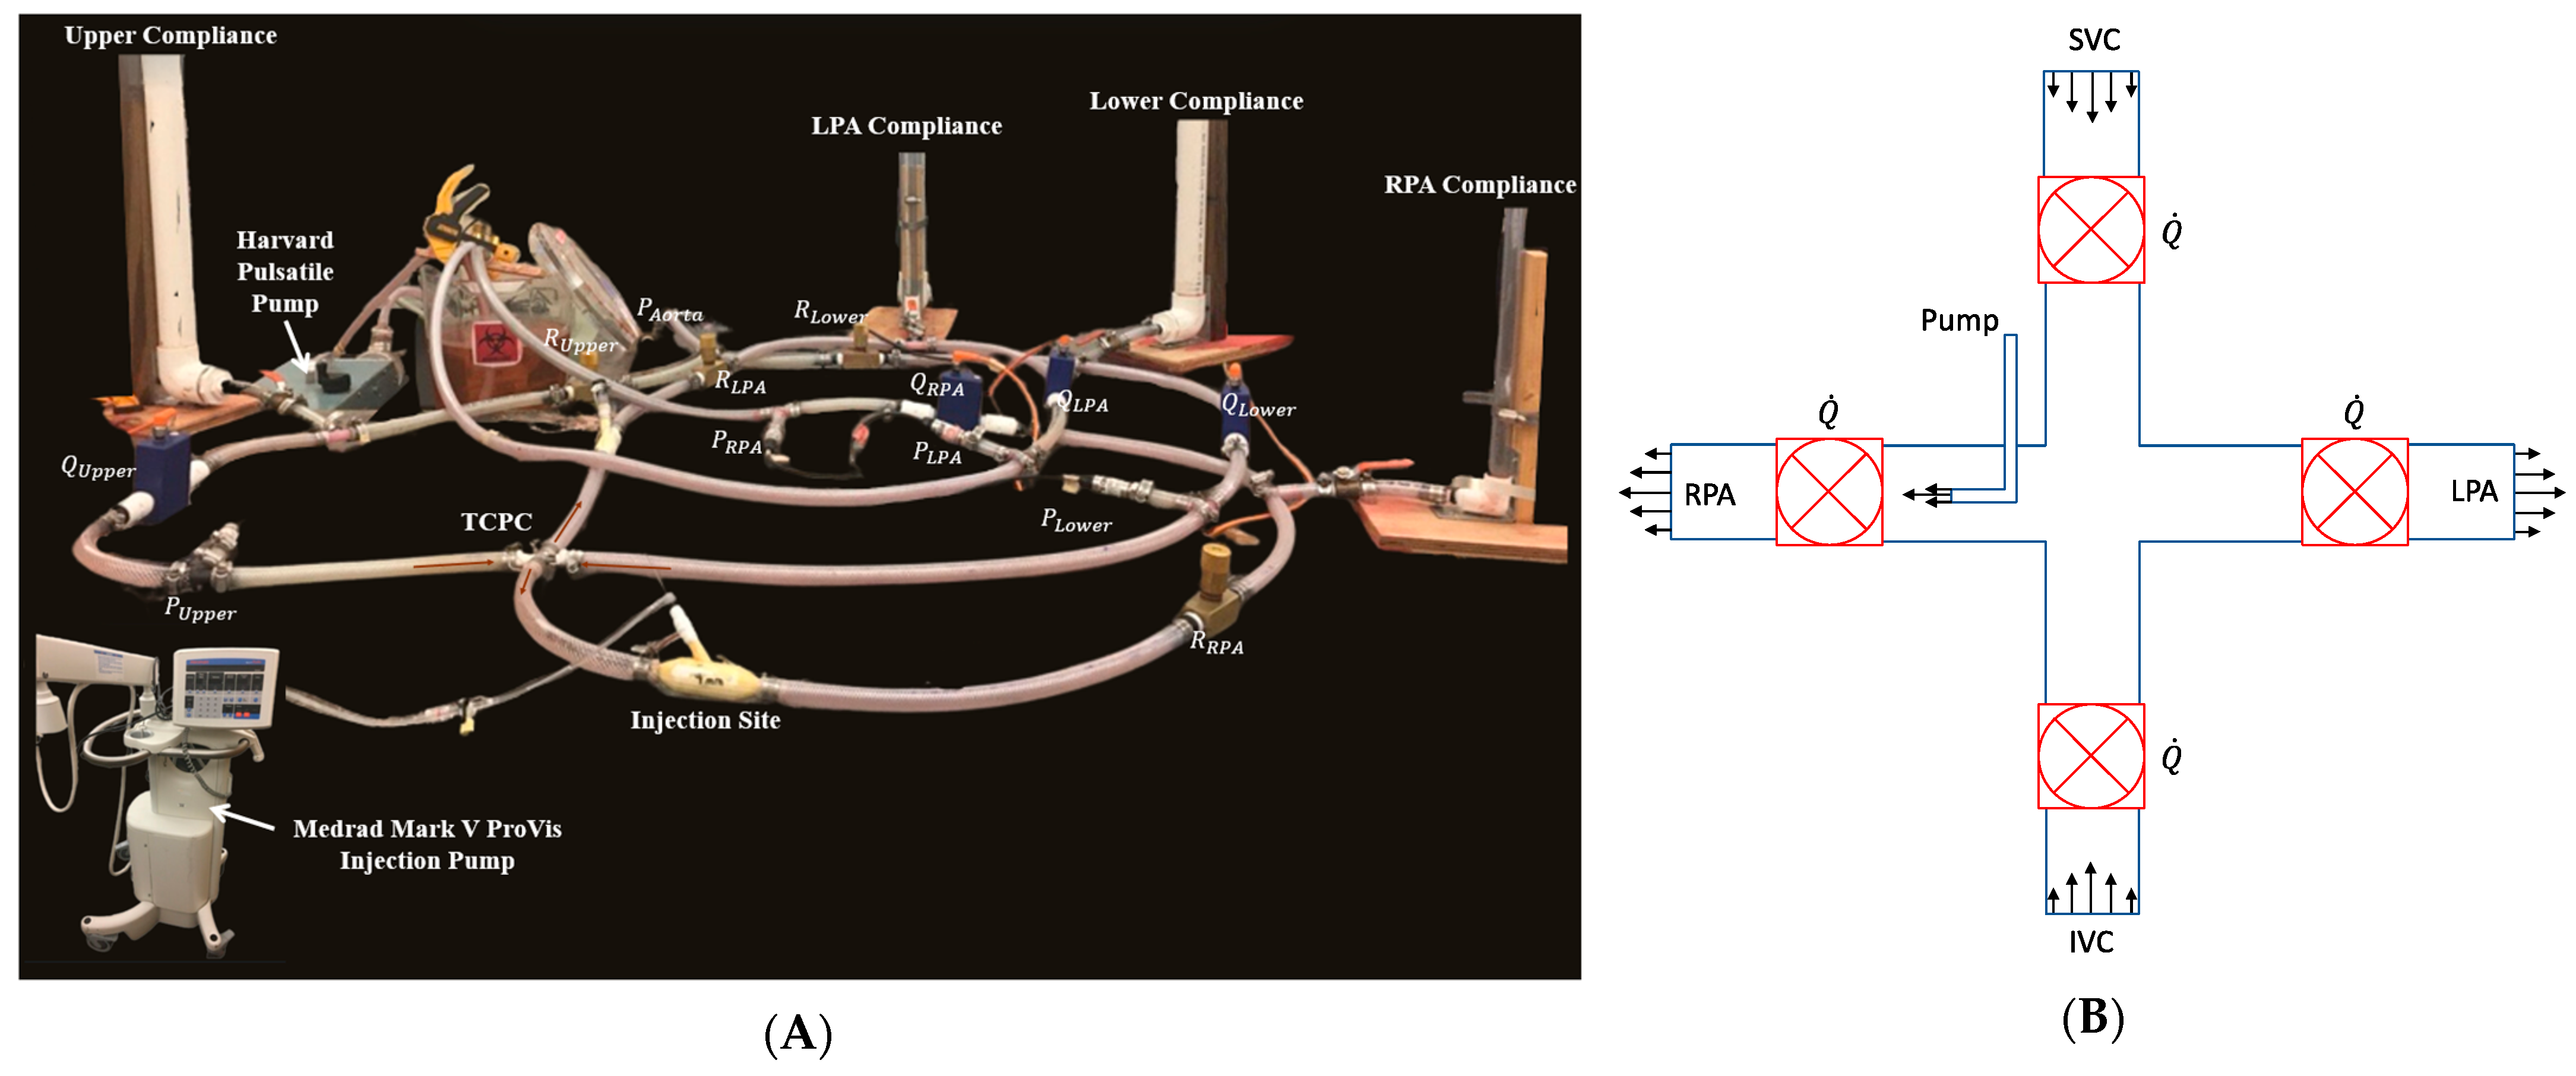
Figure 5.
Lumped parameter model for the benchtop setup.
Figure 5.
Lumped parameter model for the benchtop setup.
Figure 6.
MFL tuning flowchart for continuous and pulsed injection protocols. Baseline Fontan conditions are established before proceeding with the desired injection sequence.
Figure 6.
MFL tuning flowchart for continuous and pulsed injection protocols. Baseline Fontan conditions are established before proceeding with the desired injection sequence.
Figure 7.
(A) Labeled mock flow loop setup depicting LPM compartments and injection site. (B) Schematic of in vitro TCPC section.
Figure 7.
(A) Labeled mock flow loop setup depicting LPM compartments and injection site. (B) Schematic of in vitro TCPC section.
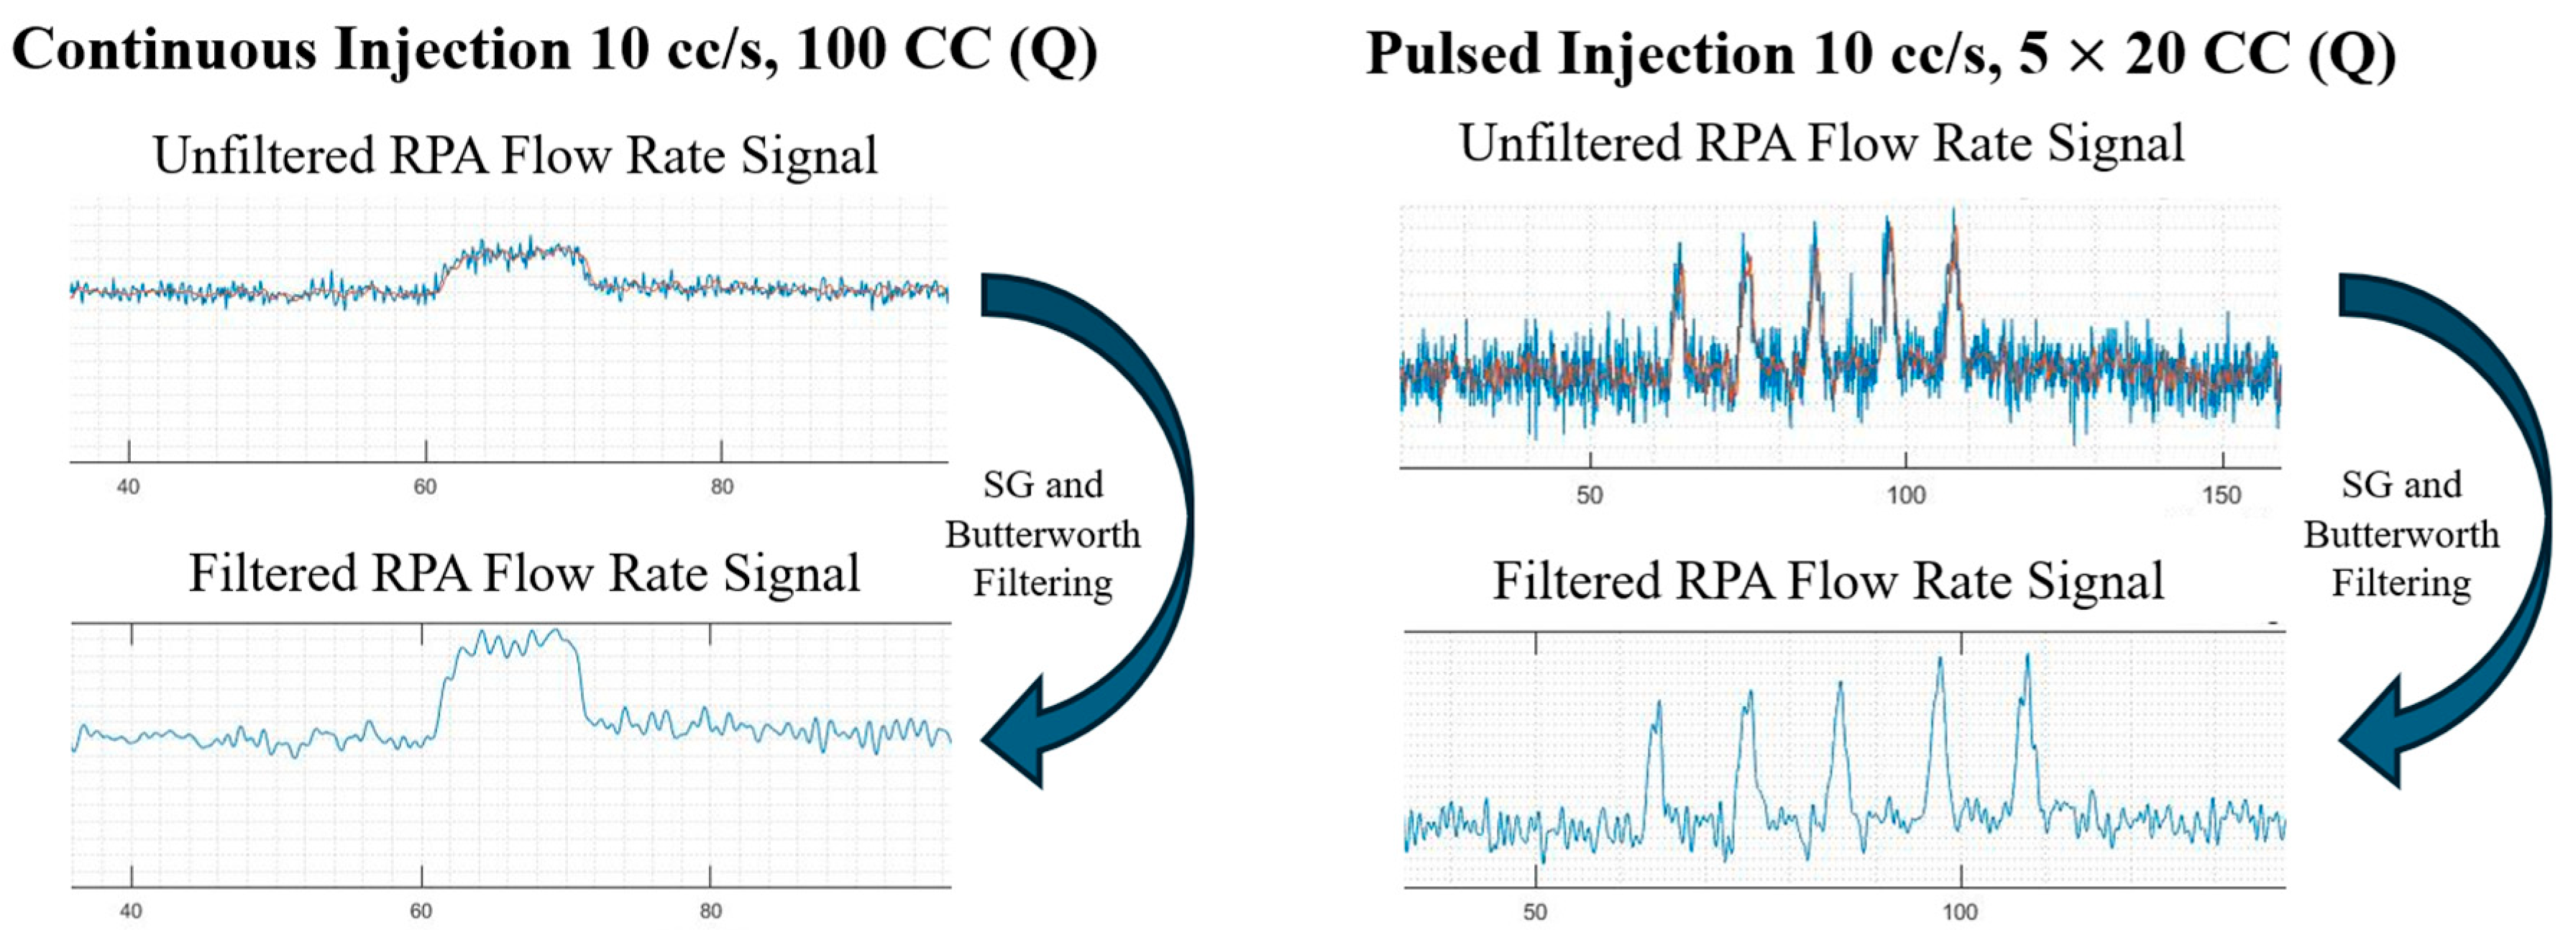
Figure 8.
Filtering mechanism employed on continuous and pulsed injections.
Figure 8.
Filtering mechanism employed on continuous and pulsed injections.
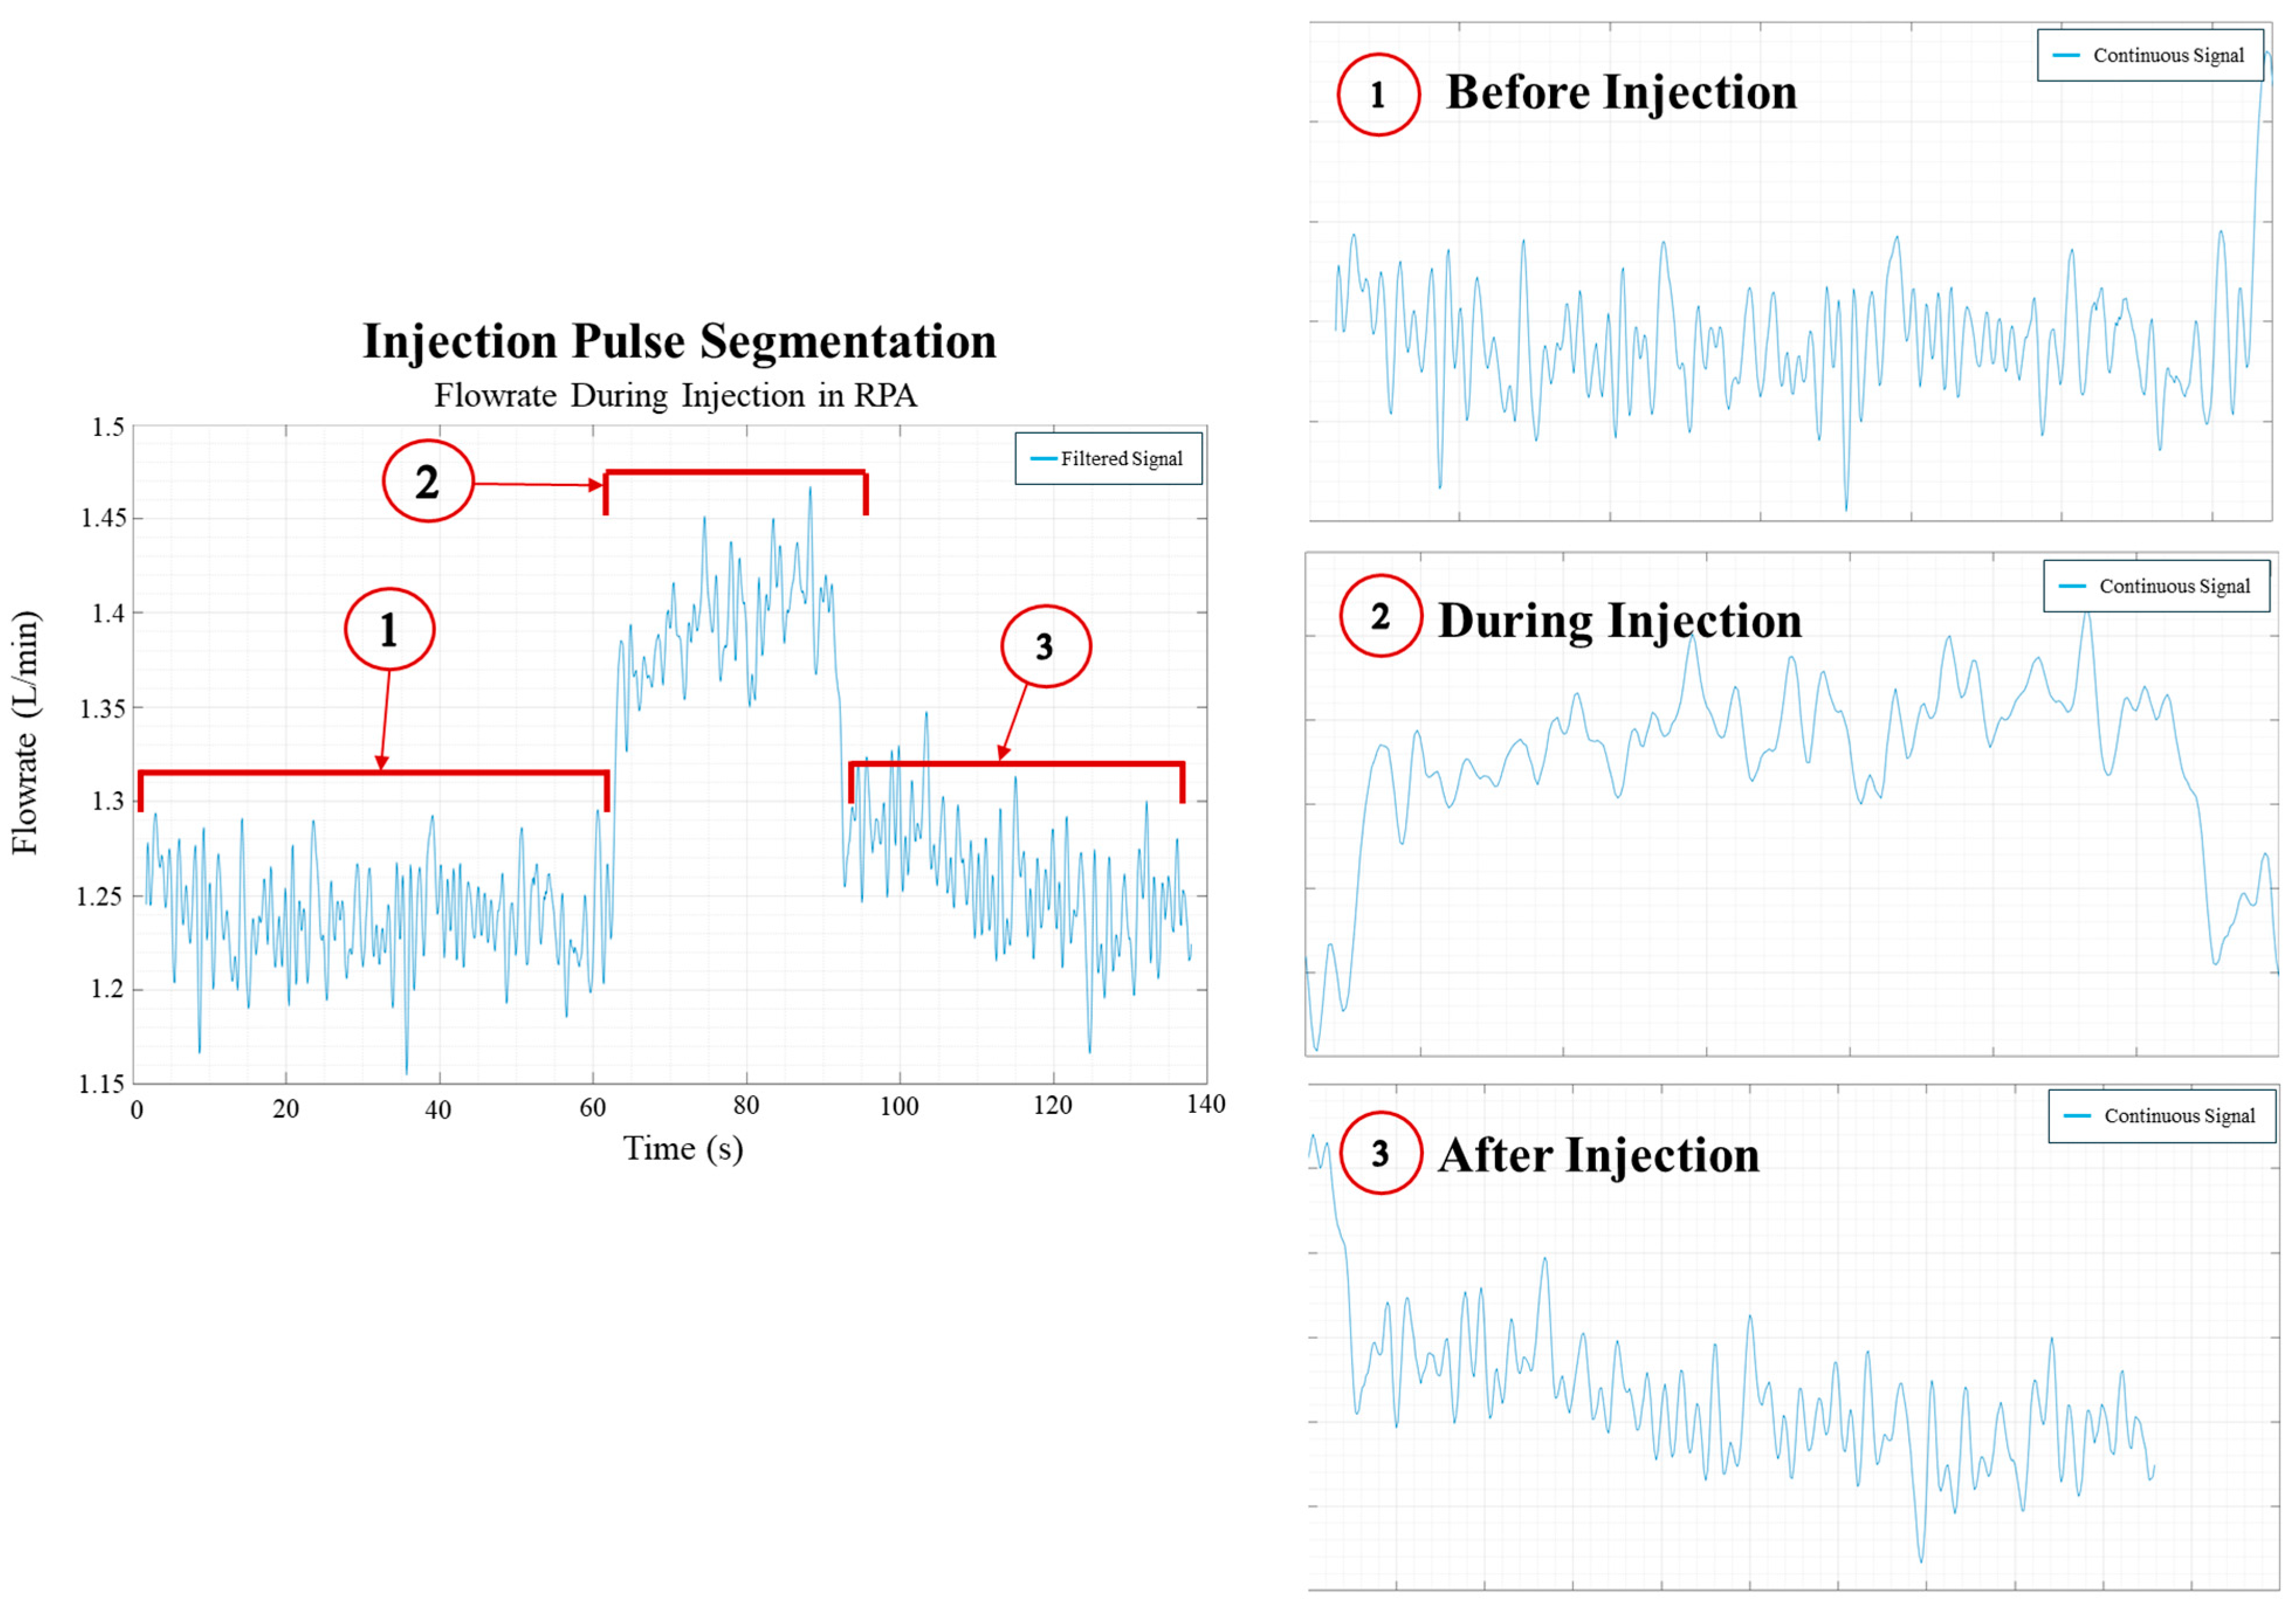
Figure 9.
Segmentation of the injection process from flow rate data.
Figure 9.
Segmentation of the injection process from flow rate data.
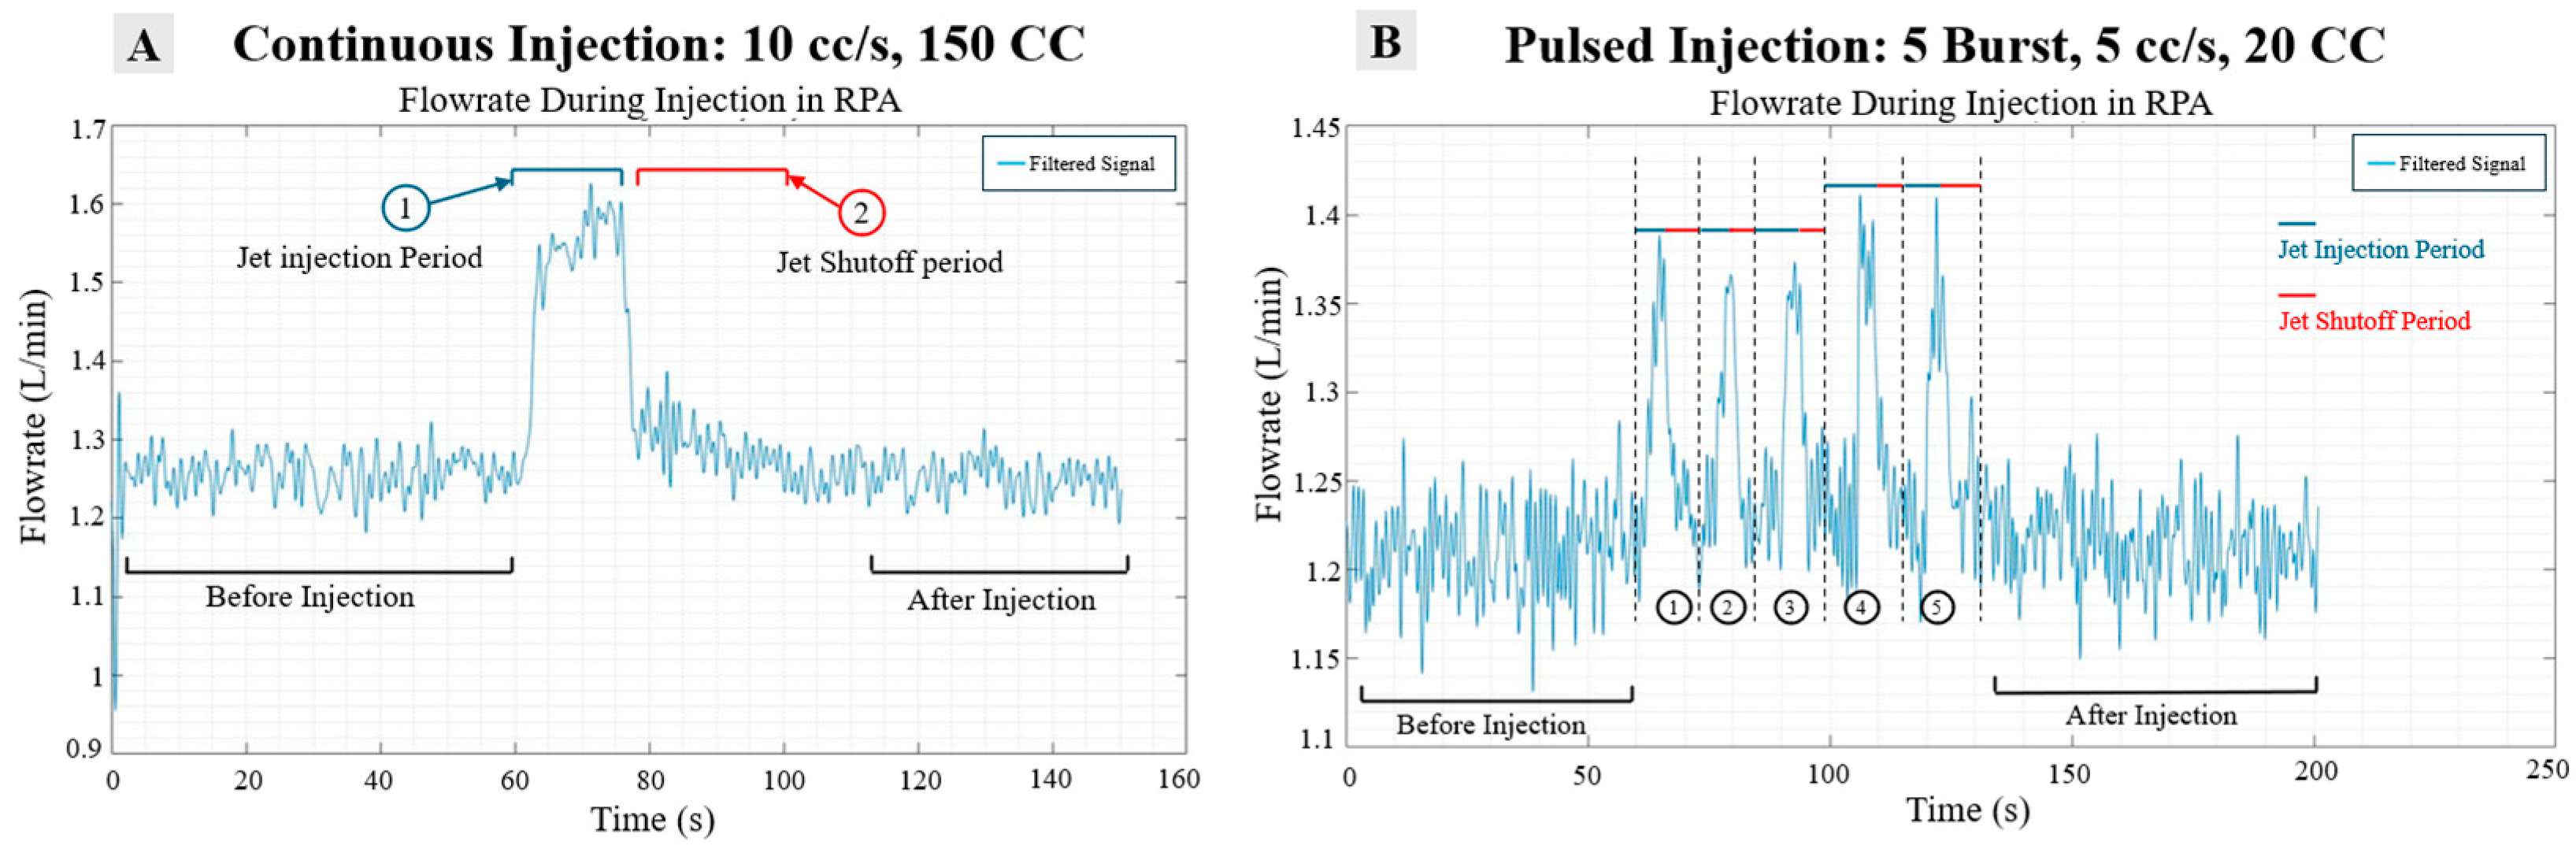
Figure 10.
(A) Segmentation schematic of long shot injection and (B) short burst injection.
Figure 10.
(A) Segmentation schematic of long shot injection and (B) short burst injection.
Figure 11.
Jet rise time (A) and fall time (B) step response for the continuous jet at 10 cc/s, 150 cc.
Figure 11.
Jet rise time (A) and fall time (B) step response for the continuous jet at 10 cc/s, 150 cc.
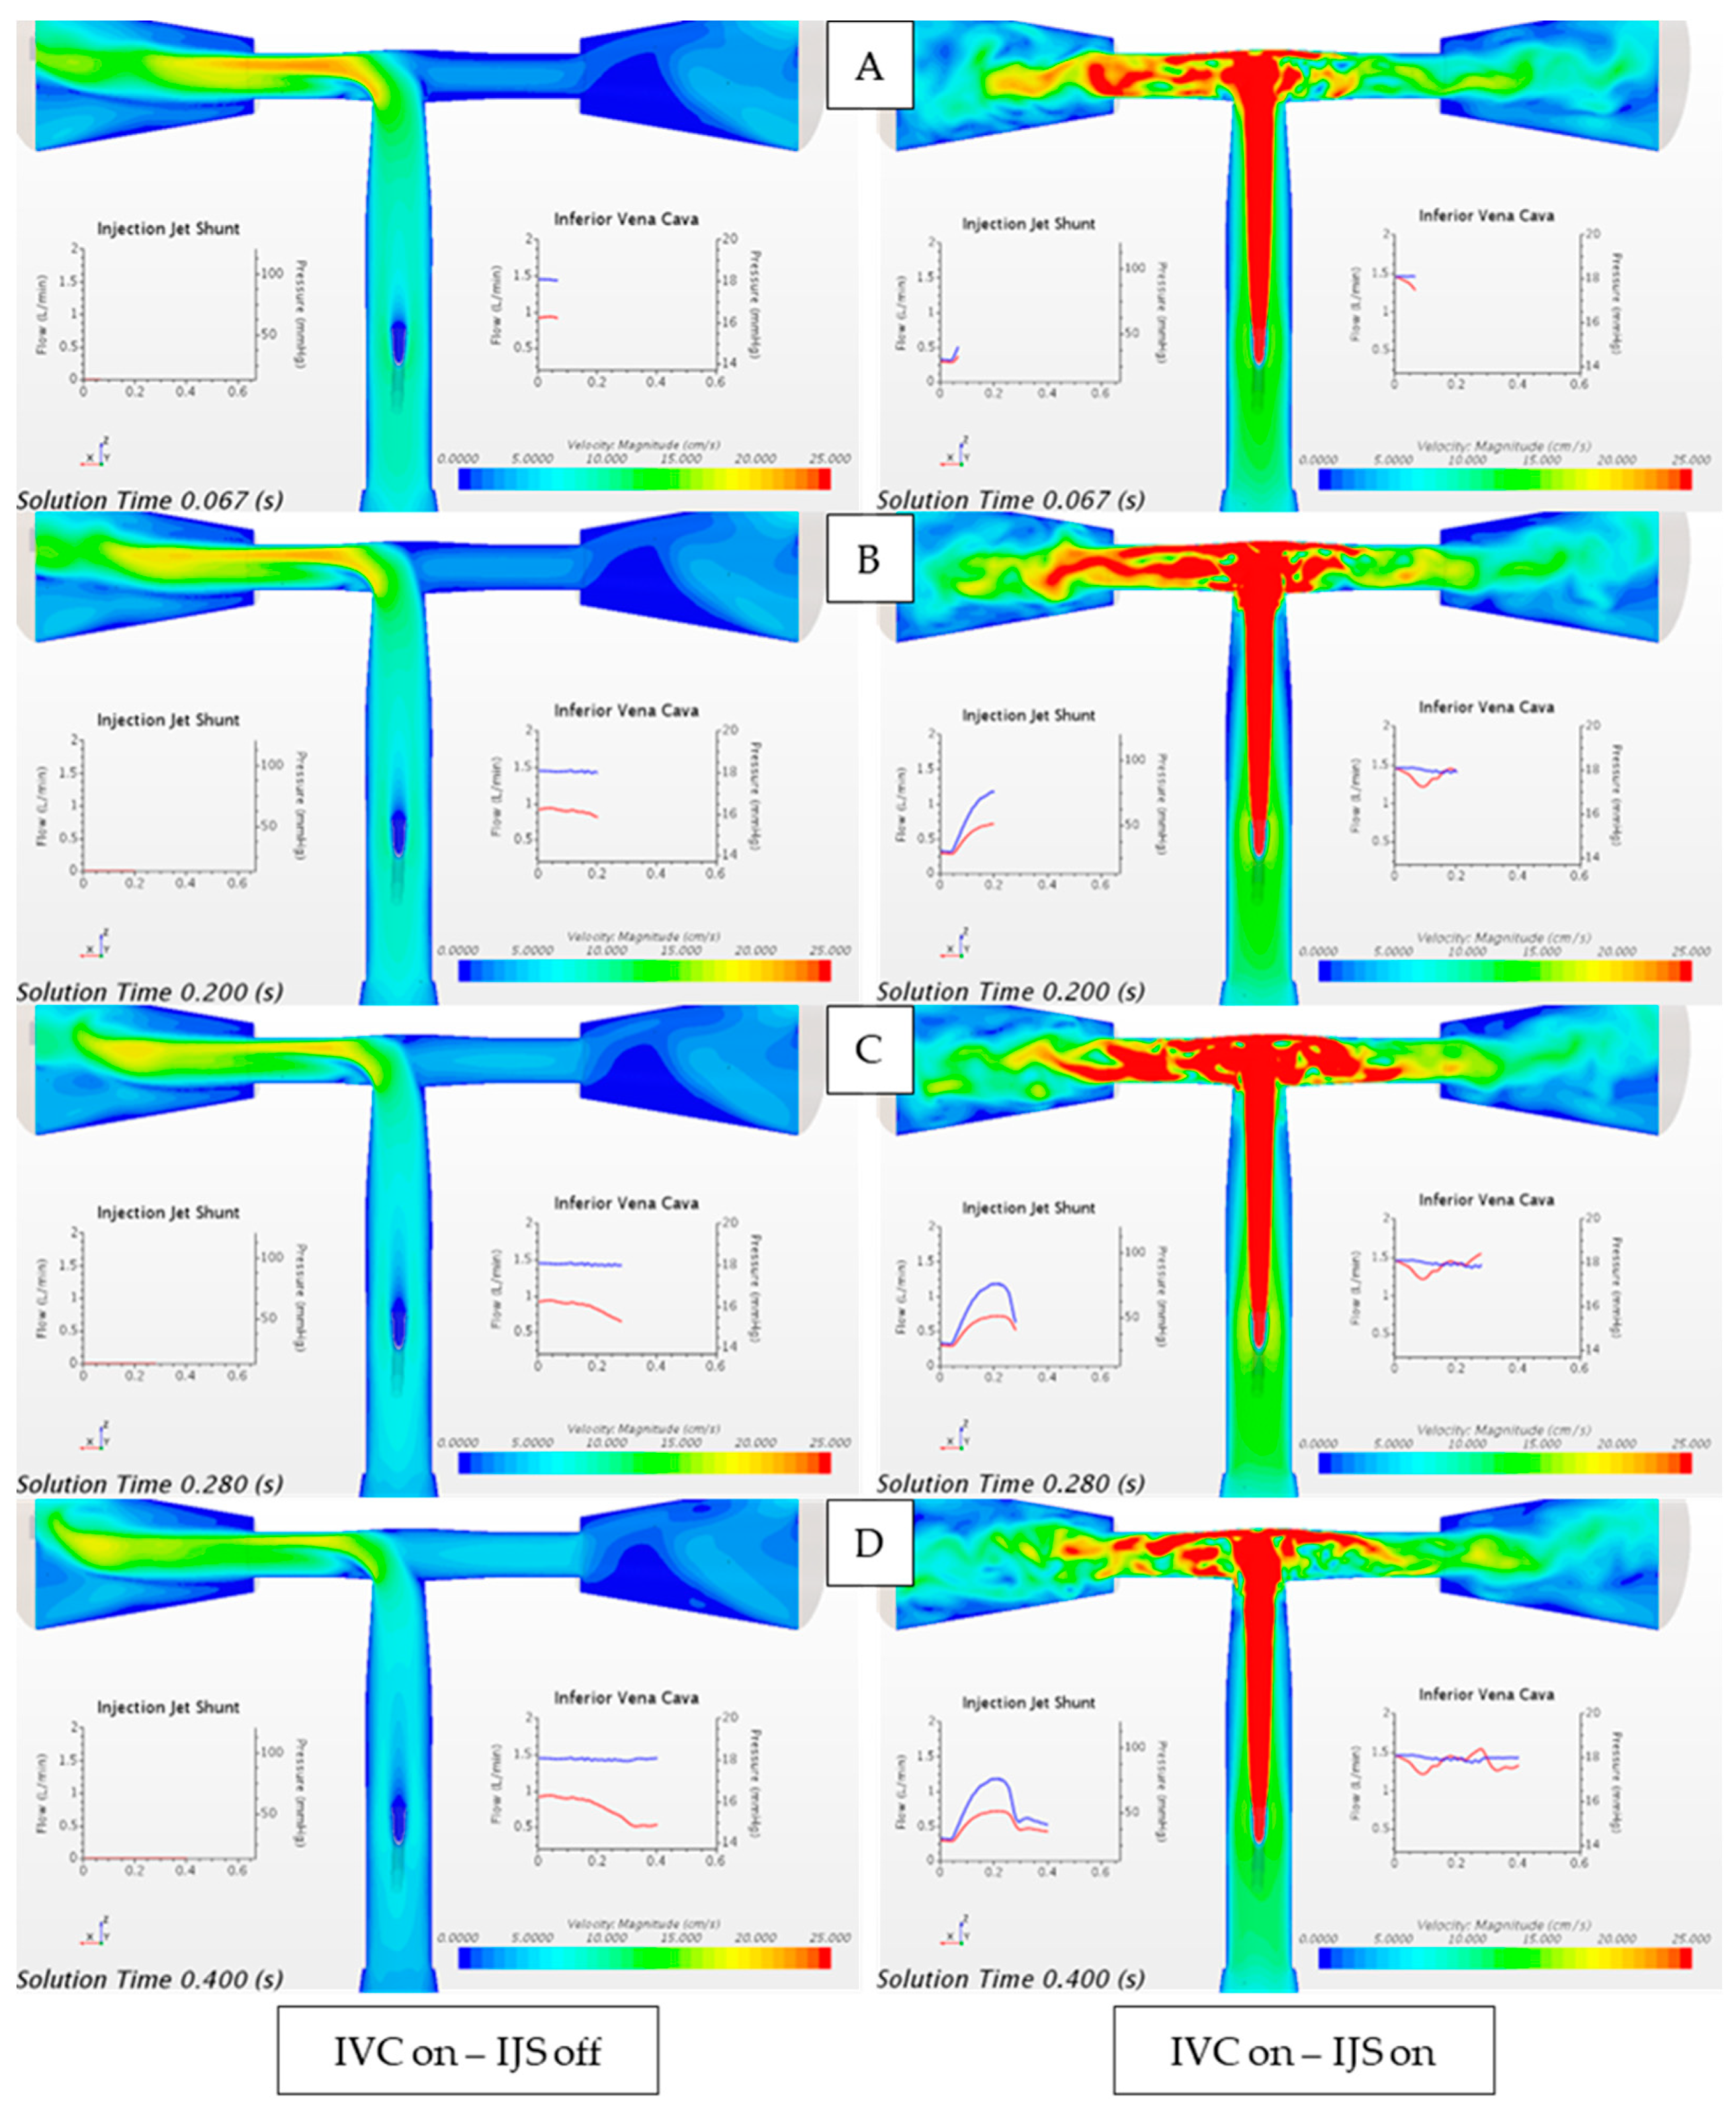
Figure 12.
Velocity magnitude contour plot comparing the flow field when only IVC flow is instantiated through the unsteady volume force (IVC on, IJS off) and when only the IJS mass flow inlet is activated (IVC off, IJS on). Waveforms are reported over a single heart cycle at (A) early systole, (B) peak systole, (C) early diastole, and (D) late diastole. From plots (A–D): red-colored waveform represents volumetric flowrate and blue-colored waveform represents static pressure.
Figure 13.
Velocity magnitude contour plot comparing the flow field when only IVC flow is instantiated through the unsteady volume force (IVC on, IJS off) and when superimposed to the active IJS mass flow inlet (IVC on, IJS on). Waveforms are reported over a single heart cycle at (A) early systole, (B) peak systole, (C) early diastole, and (D) late diastole. From plots (A–D): red-colored waveform represents volumetric flowrate, and blue-colored waveform represents static pressure.
Figure 14.
Flow field measurements comparing IVC static pressure and average IVC flow velocity when (A) IVC flow is instantiated through the unsteady volume force (IVC on, IJS off) with the IJS mass flow inlet activated alone (IVC off, IJS on), and (B) when IVC flow is instantiated through the unsteady volume force (IVC on, IJS off) compared to the case where IVC flow is superimposed to the active IJS mass flow inlet (IVC on, IJS on).
Figure 15.
IVC flow entrainment quantification of IJS implementation. (A) IVC volume flow rate without IVC volume force or IJS (blue), with IJS only (dotted orange), and with IVC volume force only (solid orange) overlaid to IJS volume flow rate (dotted yellow). (B) The relative change in IVC flow () normalized to the cycle average IJS volume flow rate (orange curve) overlaid to IJS volume flow rate (dotted yellow curve).
Figure 16.
IVC flow entrainment quantification of IJS implementation. (A) IVC volume flow rate without IVC volume force or IJS (blue), with IVC volume force only (solid orange), and with IJS and IVC volume force (dotted orange) overlaid to IJS volume flow rate (dotted yellow). (B) The relative change in IVC flow () normalized to the cycle average IJS volume flow rate (orange curve) overlaid to IJS volume flow rate (dotted yellow curve).
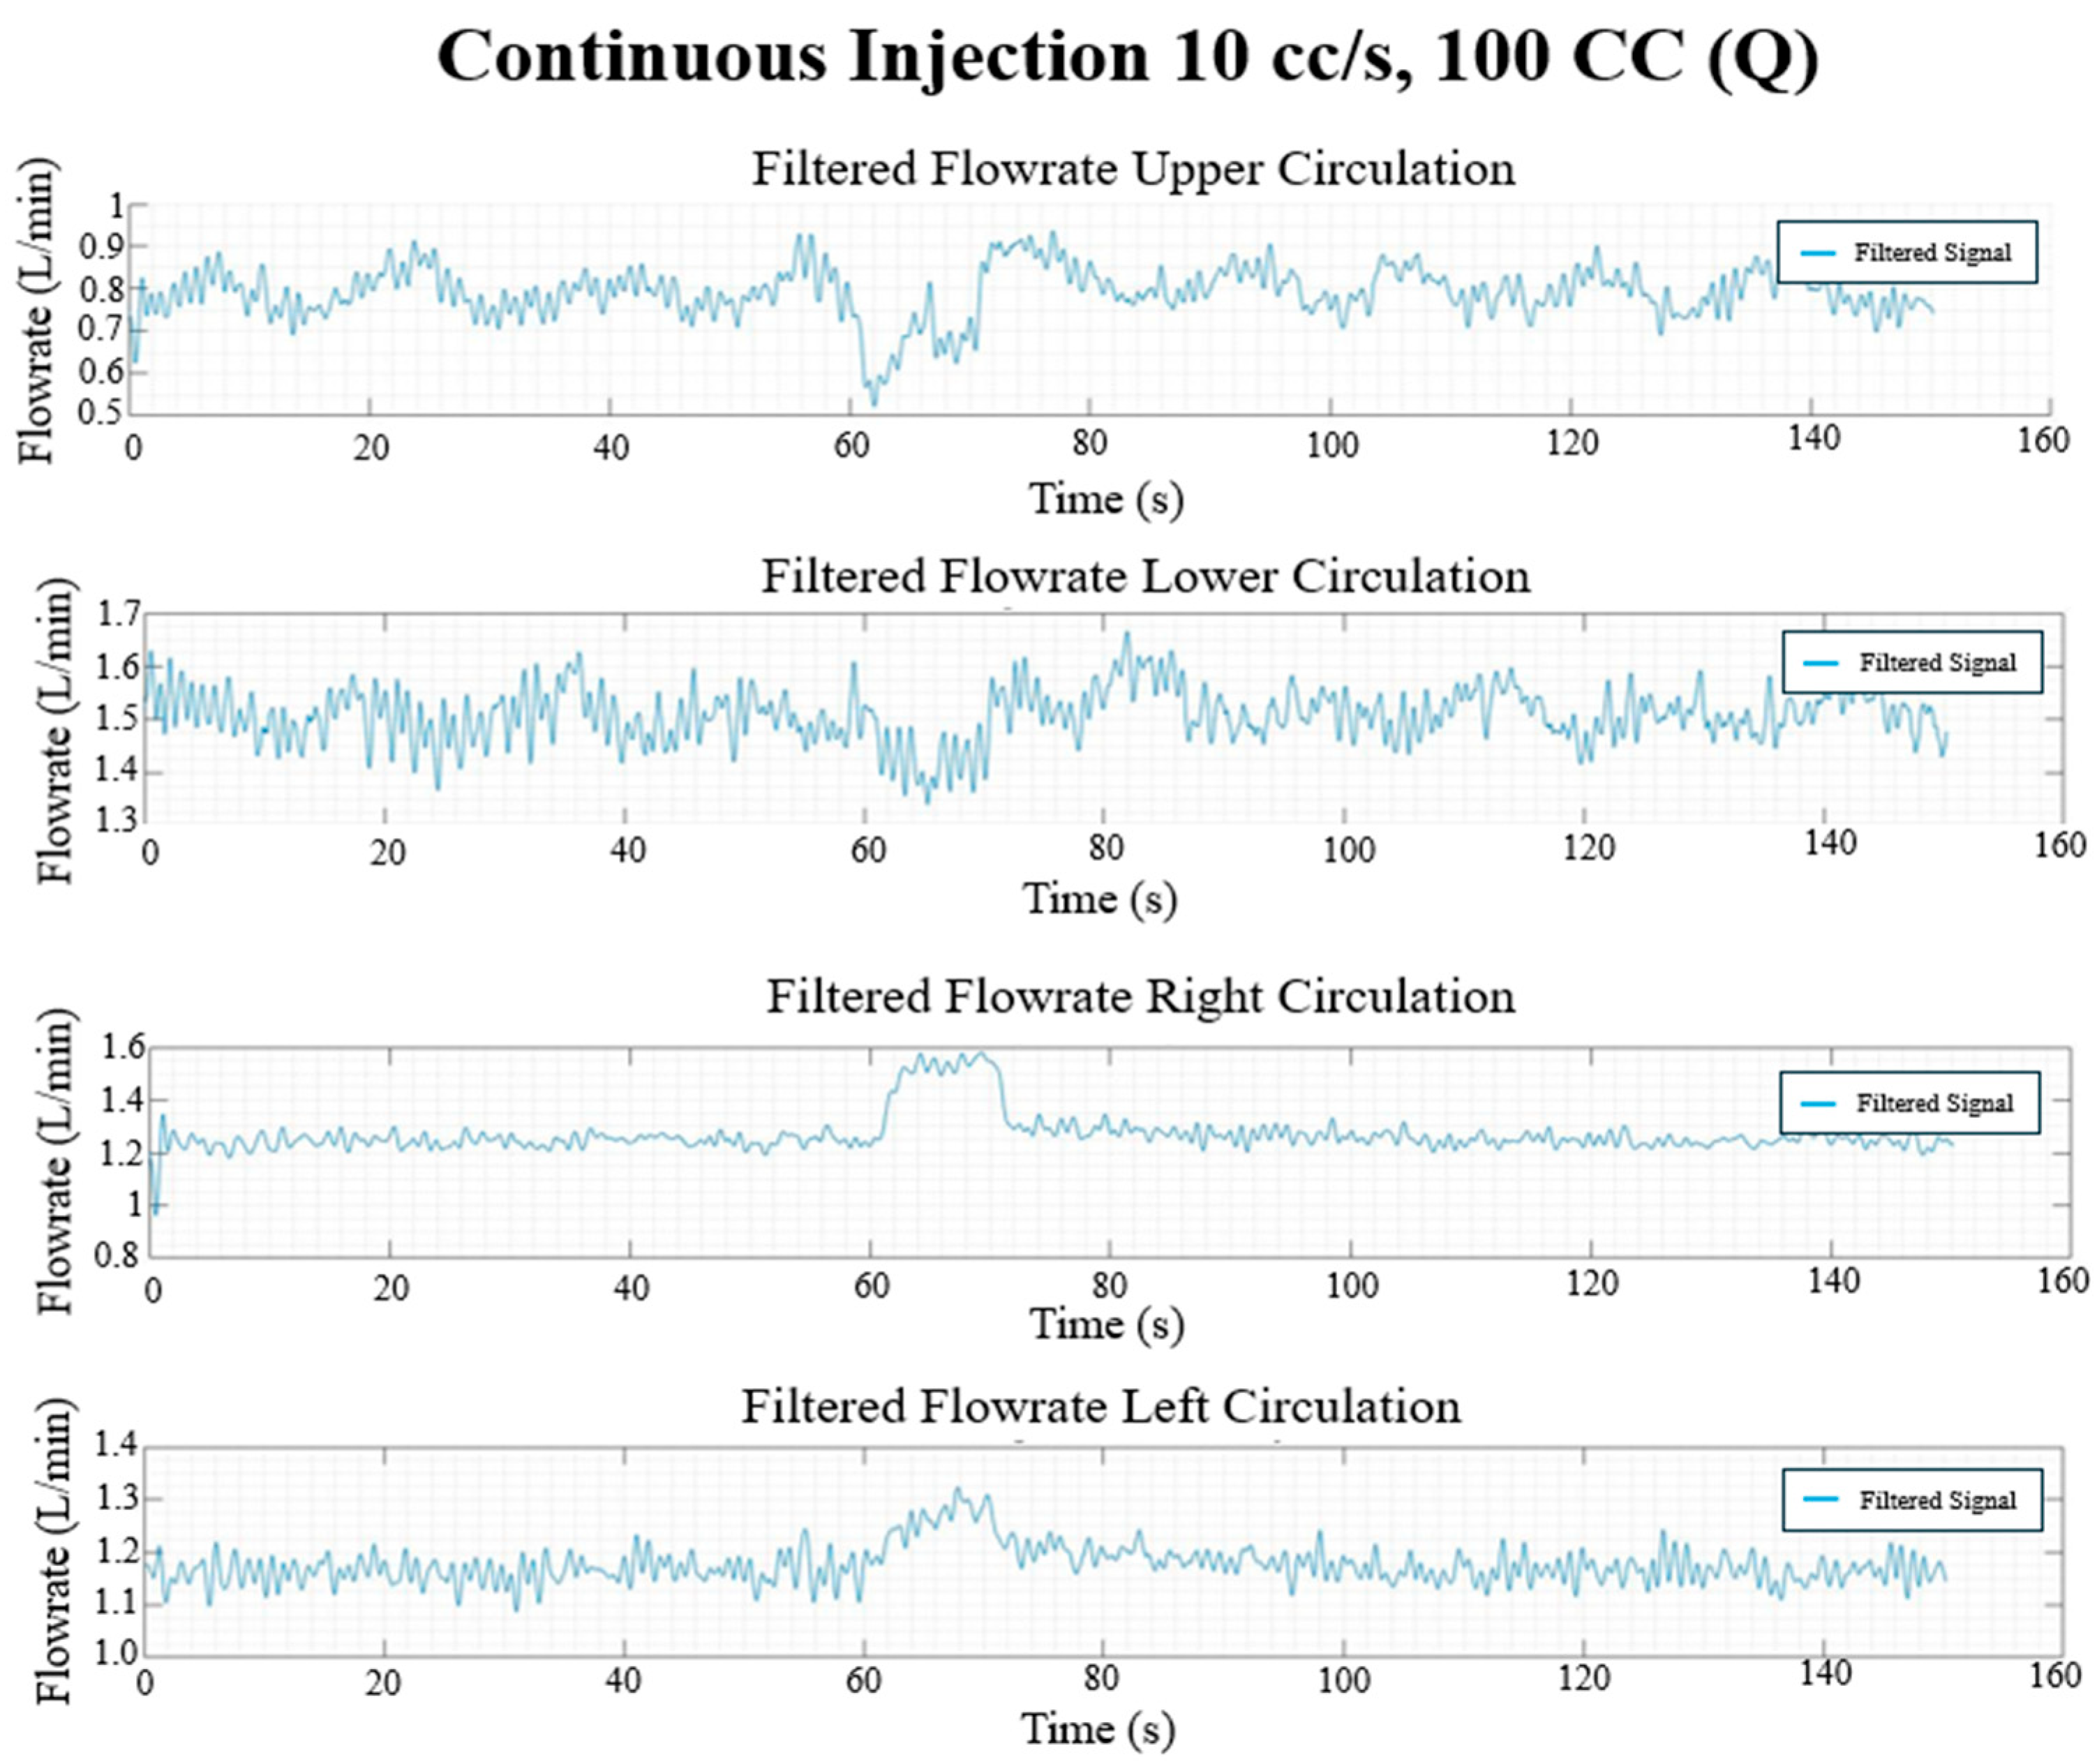
Figure 17.
Continuous injection flow rate waveforms (L/min) in each circulation branch for 10 cc/s injection rate and 100 CC injection volume.
Figure 17.
Continuous injection flow rate waveforms (L/min) in each circulation branch for 10 cc/s injection rate and 100 CC injection volume.
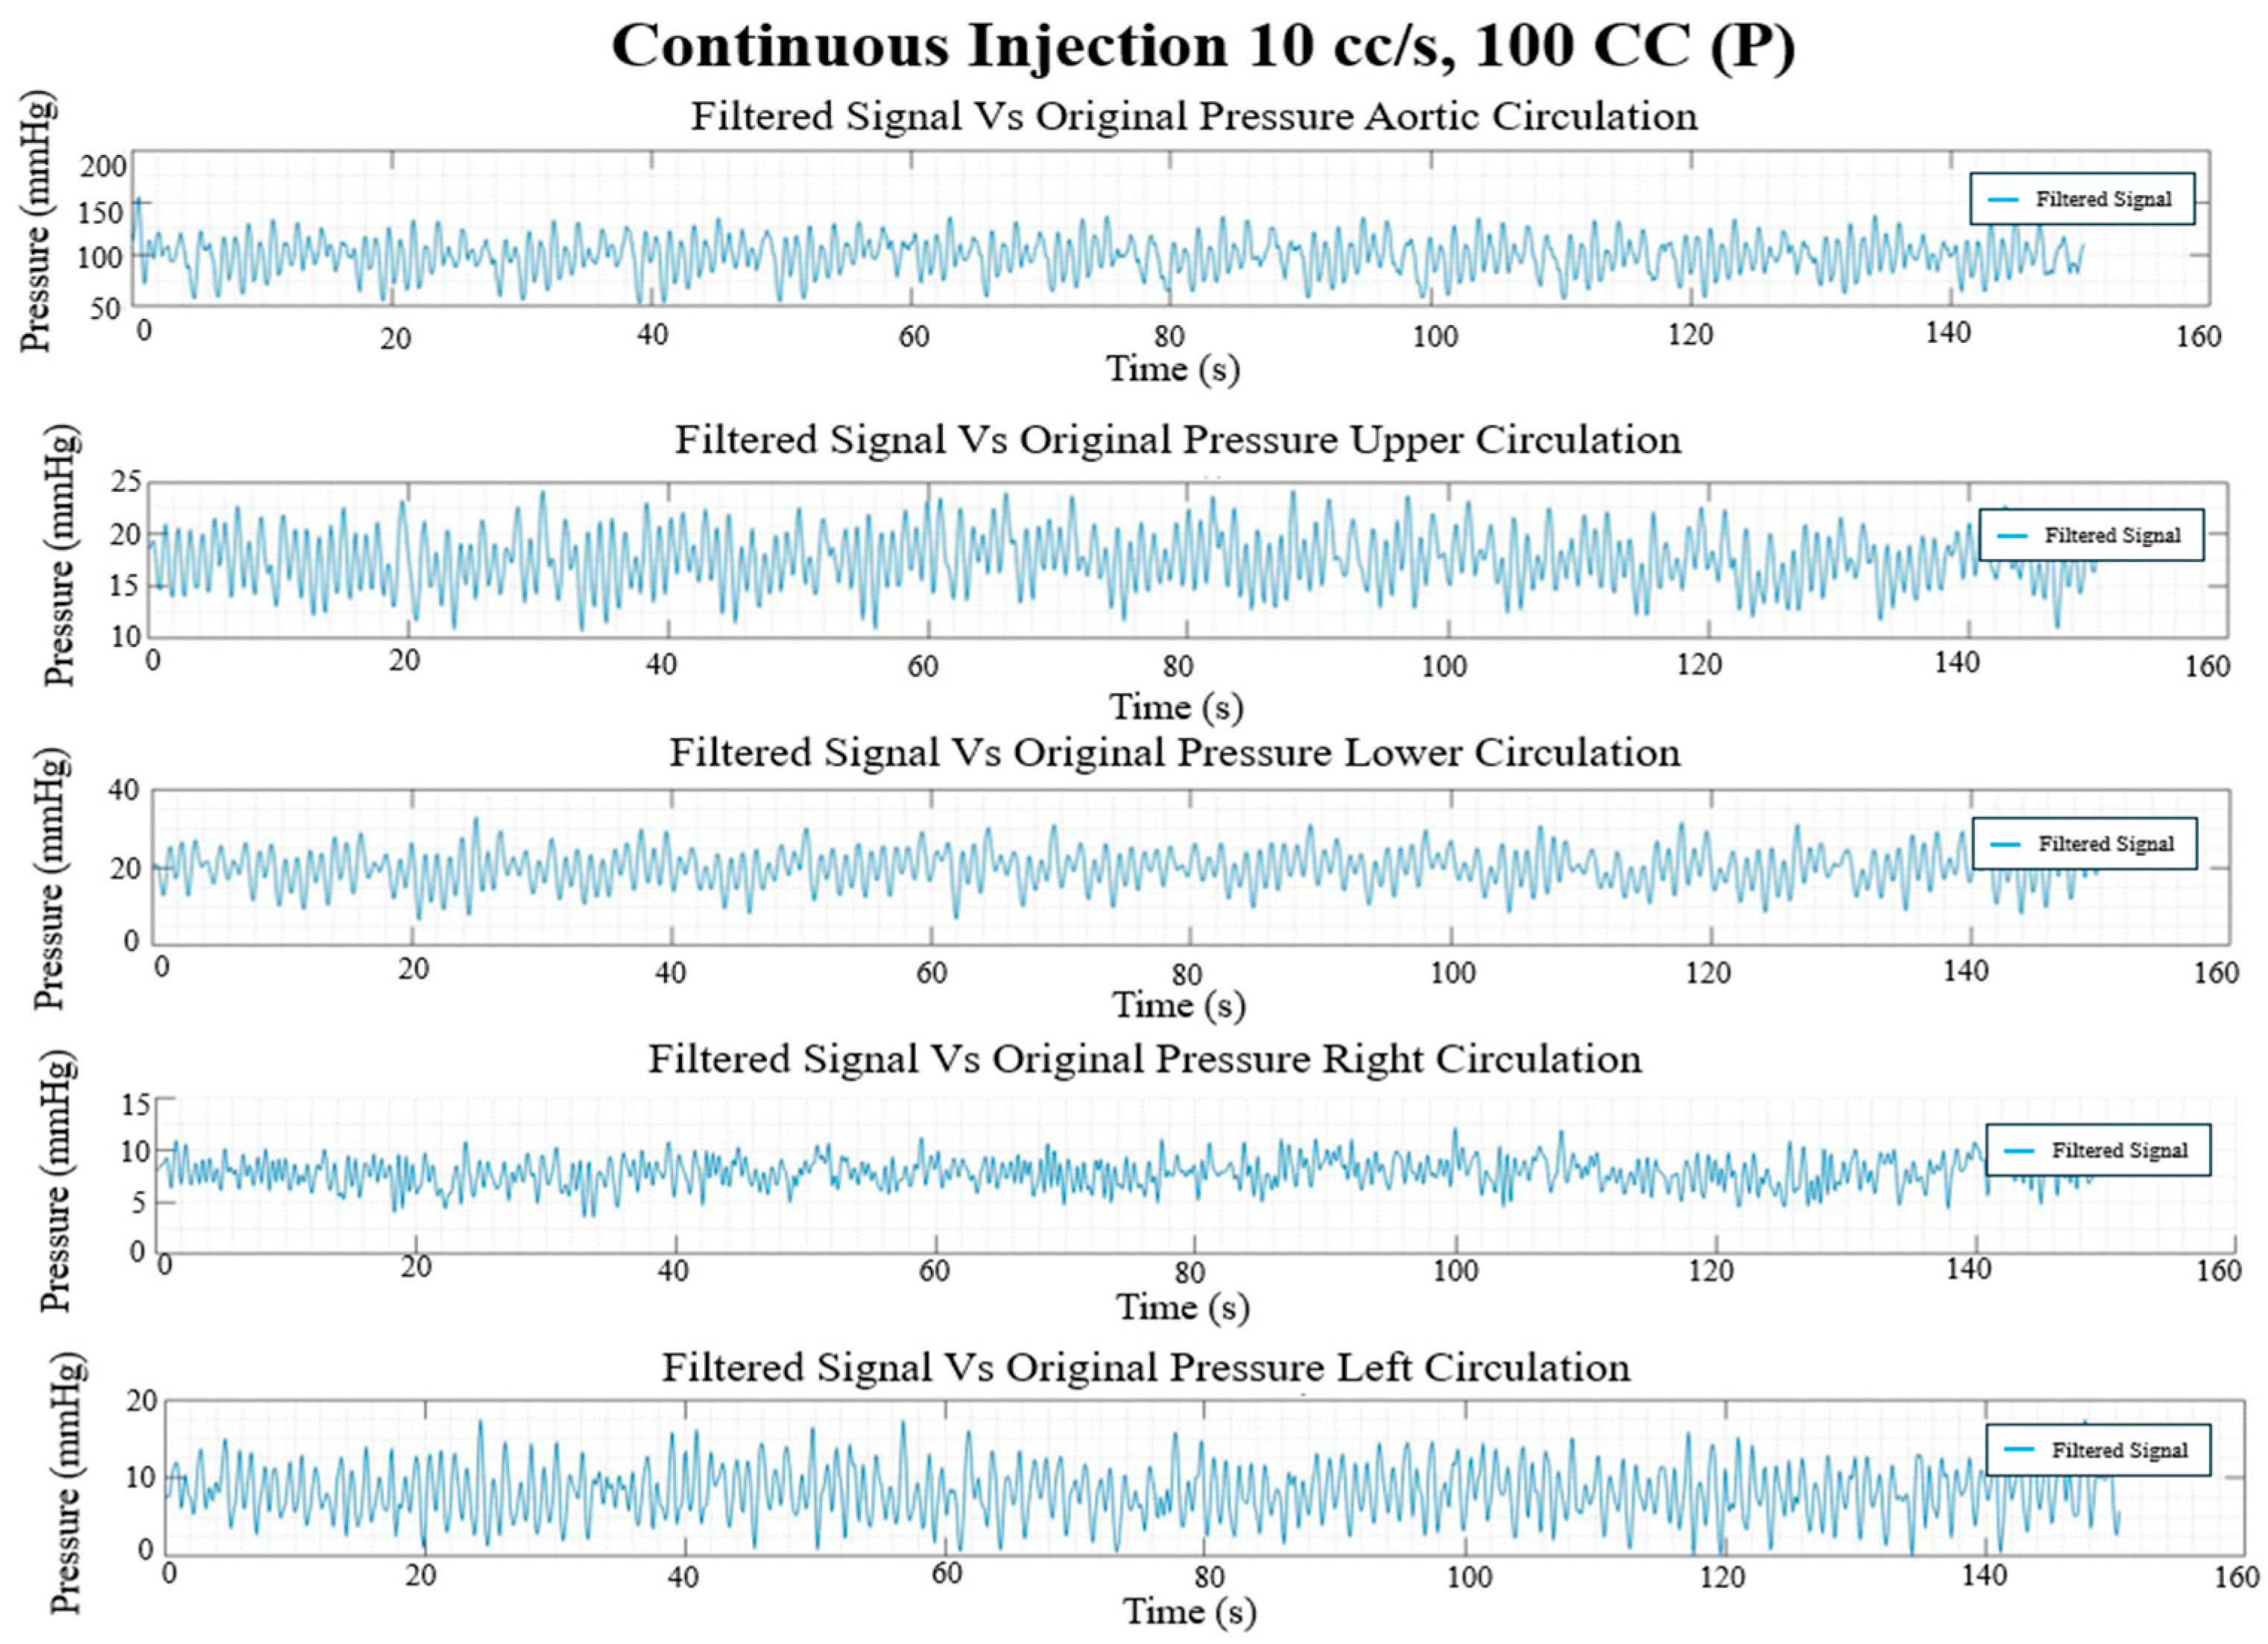
Figure 18.
Continuous injection pressure waveforms (mmHg) in each circulation branch for 10 cc/s injection rate and 100 CC injection volume.
Figure 18.
Continuous injection pressure waveforms (mmHg) in each circulation branch for 10 cc/s injection rate and 100 CC injection volume.
Figure 19.
Pulsed injection flow rate waveforms (L/min) in each circulation branch for 10 cc/s injection rate and 5 × 20 CC burst volume.
Figure 19.
Pulsed injection flow rate waveforms (L/min) in each circulation branch for 10 cc/s injection rate and 5 × 20 CC burst volume.
Figure 20.
Pulsed injection pressure waveforms (mmHg) in each circulation branch for 10 cc/s injection rate and 5 × 20 CC burst volume.
Figure 20.
Pulsed injection pressure waveforms (mmHg) in each circulation branch for 10 cc/s injection rate and 5 × 20 CC burst volume.
Figure 21.
Transient hemodynamic redistribution in TCPC branches during continuous injection at varying volumes. Overlay of flow rate waveforms in right and left pulmonary branches (RPA and LPA), and upper and lower systemic branches (SVC and IVC) during continuous jet injections at 20 cc/s for increasing injection volumes (50 cc, 100 cc, 150 cc).
Figure 22.
Continuous injection entrainment rate versus at = 0.05 L, 0.1 L, 0.15 L.
Figure 22.
Continuous injection entrainment rate versus at = 0.05 L, 0.1 L, 0.15 L.
Table 1.
Injection protocol parameter space.
Table 1.
Injection protocol parameter space.
| | Injections |
|---|
| Case # | Type | Flow Rate | Number (#) | Size (cc) | Total Volume (L) |
|---|
| | | (cc/s) | (L/min) | | | |
|---|
| | Short Multiple Injection | | | | | |
| 1 | | 5 | 0.3 | 5 | 20 | 0.100 |
| 2 | | 5 | 0.3 | 5 | 15 | 0.075 |
| 3 | | 10 | 0.6 | 5 | 20 | 0.100 |
| 4 | | 10 | 0.6 | 5 | 15 | 0.075 |
| 5 | | 15 | 0.9 | 5 | 20 | 0.100 |
| 6 | | 15 | 0.9 | 5 | 15 | 0.075 |
| 7 | | 20 | 1.2 | 5 | 20 | 0.100 |
| 8 | | 20 | 1.2 | 5 | 15 | 0.075 |
| | Long Single Injection | | | | | |
| 9 | | 5 | 0.3 | 1 | 50 | 0.050 |
| 10 | | 5 | 0.3 | 1 | 100 | 0.100 |
| 11 | | 5 | 0.3 | 1 | 150 | 0.150 |
| 12 | | 10 | 0.6 | 1 | 50 | 0.050 |
| 13 | | 10 | 0.6 | 1 | 100 | 0.100 |
| 14 | | 10 | 0.6 | 1 | 150 | 0.150 |
| 15 | | 15 | 0.9 | 1 | 50 | 0.050 |
| 16 | | 15 | 0.9 | 1 | 100 | 0.100 |
| 17 | | 15 | 0.9 | 1 | 150 | 0.150 |
| 18 | | 20 | 1.2 | 1 | 50 | 0.050 |
| 19 | | 20 | 1.2 | 1 | 100 | 0.100 |
| 20 | | 20 | 1.2 | 1 | 150 | 0.150 |
Table 2.
In vitro flow rate results.
Table 2.
In vitro flow rate results.
| Case | Flow Rate (L/min) |
|---|
| | | | | |
|---|
| 1 | 16.56 | 18.77 | 7.27 | 7.90 |
| 2 | 16.57 | 18.76 | 7.31 | 7.54 |
| 3 | 16.56 | 18.81 | 7.26 | 7.59 |
| 4 | 16.68 | 18.86 | 7.37 | 7.58 |
| 5 | 16.99 | 19.21 | 7.52 | 8.43 |
| 6 | 17.41 | 19.55 | 7.66 | 8.94 |
| 7 | 17.60 | 19.75 | 7.70 | 8.94 |
| 8 | 17.42 | 19.63 | 7.65 | 8.93 |
| 9 | 17.36 | 19.56 | 7.70 | 8.23 |
| 10 | 17.58 | 19.74 | 7.78 | 8.32 |
| 11 | 17.55 | 19.74 | 7.73 | 8.31 |
| 12 | 17.41 | 19.61 | 7.69 | 8.26 |
| 13 | 17.59 | 19.83 | 7.79 | 8.24 |
| 14 | 17.78 | 20.01 | 7.73 | 8.29 |
| 15 | 17.28 | 19.48 | 7.75 | 8.22 |
| 16 | 17.27 | 19.51 | 7.63 | 8.17 |
| 17 | 17.36 | 19.59 | 7.79 | 8.20 |
| 18 | 17.39 | 19.45 | 7.64 | 8.99 |
| 19 | 17.42 | 19.61 | 7.61 | 8.89 |
| 20 | 17.46 | 19.61 | 7.66 | 8.98 |
Table 3.
In vitro pressure results.
Table 3.
In vitro pressure results.
| Case | Pressure (mmHg) |
|---|
| | | | | | |
|---|
| 1 | 16.56 | 18.77 | 7.27 | 7.90 | 94.19 |
| 2 | 16.57 | 18.76 | 7.31 | 7.54 | 98.31 |
| 3 | 16.56 | 18.81 | 7.26 | 7.59 | 97.95 |
| 4 | 16.68 | 18.86 | 7.37 | 7.58 | 98.41 |
| 5 | 16.99 | 19.21 | 7.52 | 8.43 | 96.88 |
| 6 | 17.41 | 19.55 | 7.66 | 8.94 | 96.80 |
| 7 | 17.60 | 19.75 | 7.70 | 8.94 | 98.02 |
| 8 | 17.42 | 19.63 | 7.65 | 8.93 | 98.14 |
| 9 | 17.36 | 19.56 | 7.70 | 8.23 | 97.39 |
| 10 | 17.58 | 19.74 | 7.78 | 8.32 | 97.39 |
| 11 | 17.55 | 19.74 | 7.73 | 8.31 | 97.31 |
| 12 | 17.41 | 19.61 | 7.69 | 8.26 | 98.38 |
| 13 | 17.59 | 19.83 | 7.79 | 8.24 | 98.50 |
| 14 | 17.78 | 20.01 | 7.73 | 8.29 | 99.25 |
| 15 | 17.28 | 19.48 | 7.75 | 8.22 | 98.70 |
| 16 | 17.27 | 19.51 | 7.63 | 8.17 | 98.27 |
| 17 | 17.36 | 19.59 | 7.79 | 8.20 | 97.96 |
| 18 | 17.39 | 19.45 | 7.64 | 8.99 | 97.36 |
| 19 | 17.42 | 19.61 | 7.61 | 8.89 | 96.87 |
| 20 | 17.46 | 19.61 | 7.66 | 8.98 | 96.77 |
Table 4.
Entrainment flow rate [L/min] for various injection rates and injection volumes for continuous injections.
Table 4.
Entrainment flow rate [L/min] for various injection rates and injection volumes for continuous injections.
| | | |
|---|
| | | 0.3 | 0.6 | 0.9 | 1.2 |
|---|
| | 0.05 | 0.1646 | 0.0015 | −0.1084 | −0.2263 |
| 0.1 | 0.2125 | 0.0389 | −0.086 | −0.2265 |
| | 0.15 | 0.1985 | 0.0144 | −0.0866 | −0.2454 |
Table 5.
Entrainment flow rate [L/min] for various injection rates and injection volumes for pulsed injections.
Table 5.
Entrainment flow rate [L/min] for various injection rates and injection volumes for pulsed injections.
| | | |
|---|
| | | 0.3 | 0.6 | 0.9 | 1.2 |
|---|
| 0.015 | 0.04412 | −0.14936 | −0.4581 | −0.7167 |
| 0.2 | 0.04964 | −0.1353 | −0.33948 | −0.60956 |
Table 6.
Jet relaxation time [s] for various injection rates and injection volumes for continuous injections.
Table 6.
Jet relaxation time [s] for various injection rates and injection volumes for continuous injections.
| | | |
|---|
| | | 0.3 | 0.6 | 0.9 | 1.2 |
|---|
| | 0.05 | 0.497 | 0.891 | 0.398 | 0.198 |
| 0.1 | 0.103 | 0.100 | 0.509 | 0.504 |
| | 0.15 | 0.495 | 0.607 | 0.399 | 0.107 |
Table 7.
Jet relaxation time [s] for various injection rates and injection volumes for pulsed injections (5 pulses).
Table 7.
Jet relaxation time [s] for various injection rates and injection volumes for pulsed injections (5 pulses).
| | | |
|---|
| | | 0.3 | 0.6 | 0.9 | 1.2 |
|---|
| 0.015 | 0.715 | 0.341 | 0.118 | 0.151 |
| 0.2 | 0.196 | 0.315 | 0.809 | 0.021 |


 ,
, 