

Direct Consideration of Process History During Intensified Design of Experiments Planning Eases Interpretation of Mammalian Cell Culture Dynamics
 ,
,  ,
,  , , and
Abstract
1. Introduction
2. Materials and Methods
2.1. Design Planning and Evaluation
2.2. Cell Culture
2.3. Process Analytics
2.4. Data Pre-Processing
2.5. Ordinary Least Squares Modeling
- = lth observed response (e.g., viable cell density)
- = model intercept
- = ith main effect
- = ijth two-factor interaction
- = iith quadratic effect
- = iijth partial cubic interaction
- = th three-factor interaction
- x =
- = residual error, assuming ε ∼ N(0, . is estimated based on the root mean squared error (RMSE) of each regression model
- = lth predicted response by the polynomial regression model (e.g., viable cell density)
- = estimate of model intercept
- = estimate of ith main effect
- = estimate of iith quadratic effect
- = estimate of ijth two-factor interaction effect
- = estimate of iith quadratic effect
- = estimate of th three-factor interaction
2.6. Model Evaluation
- = number of observations
- = mean predicted response by the polynomial regression model over all
- , , = mean absolute estimate of ith main effect, iith quadratic effect, ijth two-factor interaction
3. Results
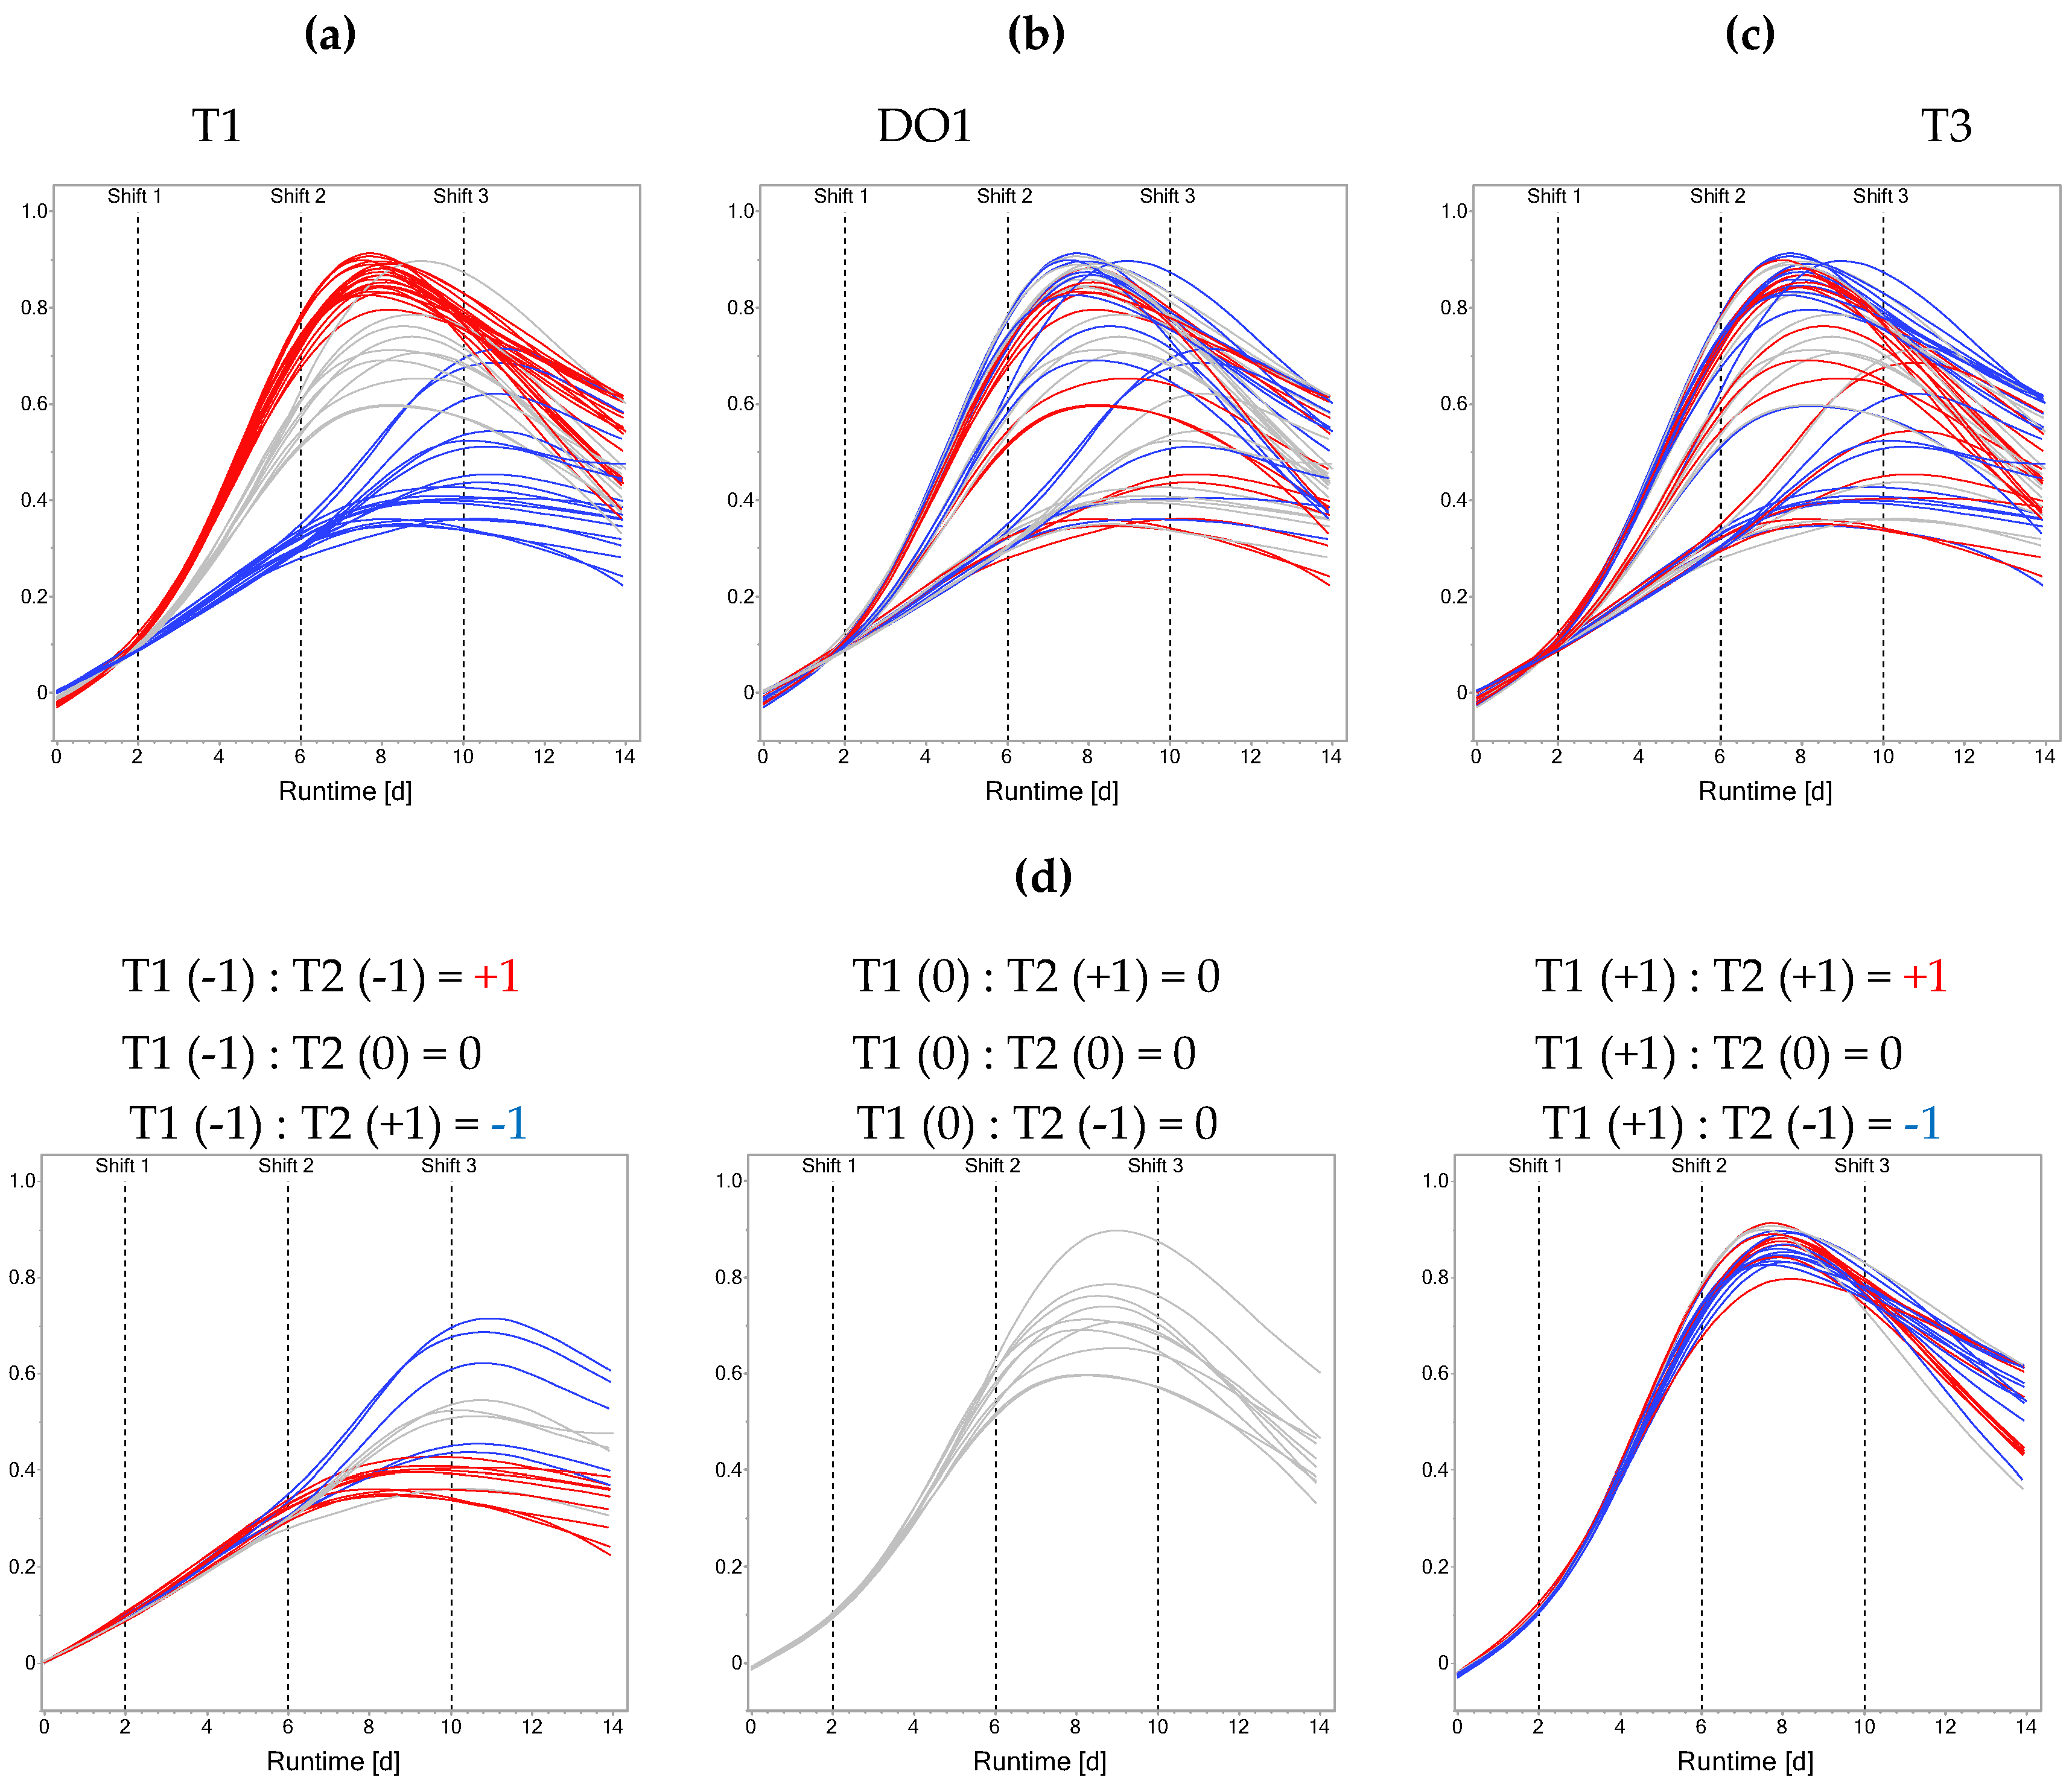
3.1. Across-Stage Interactions Explicitly Account for Memory Effects
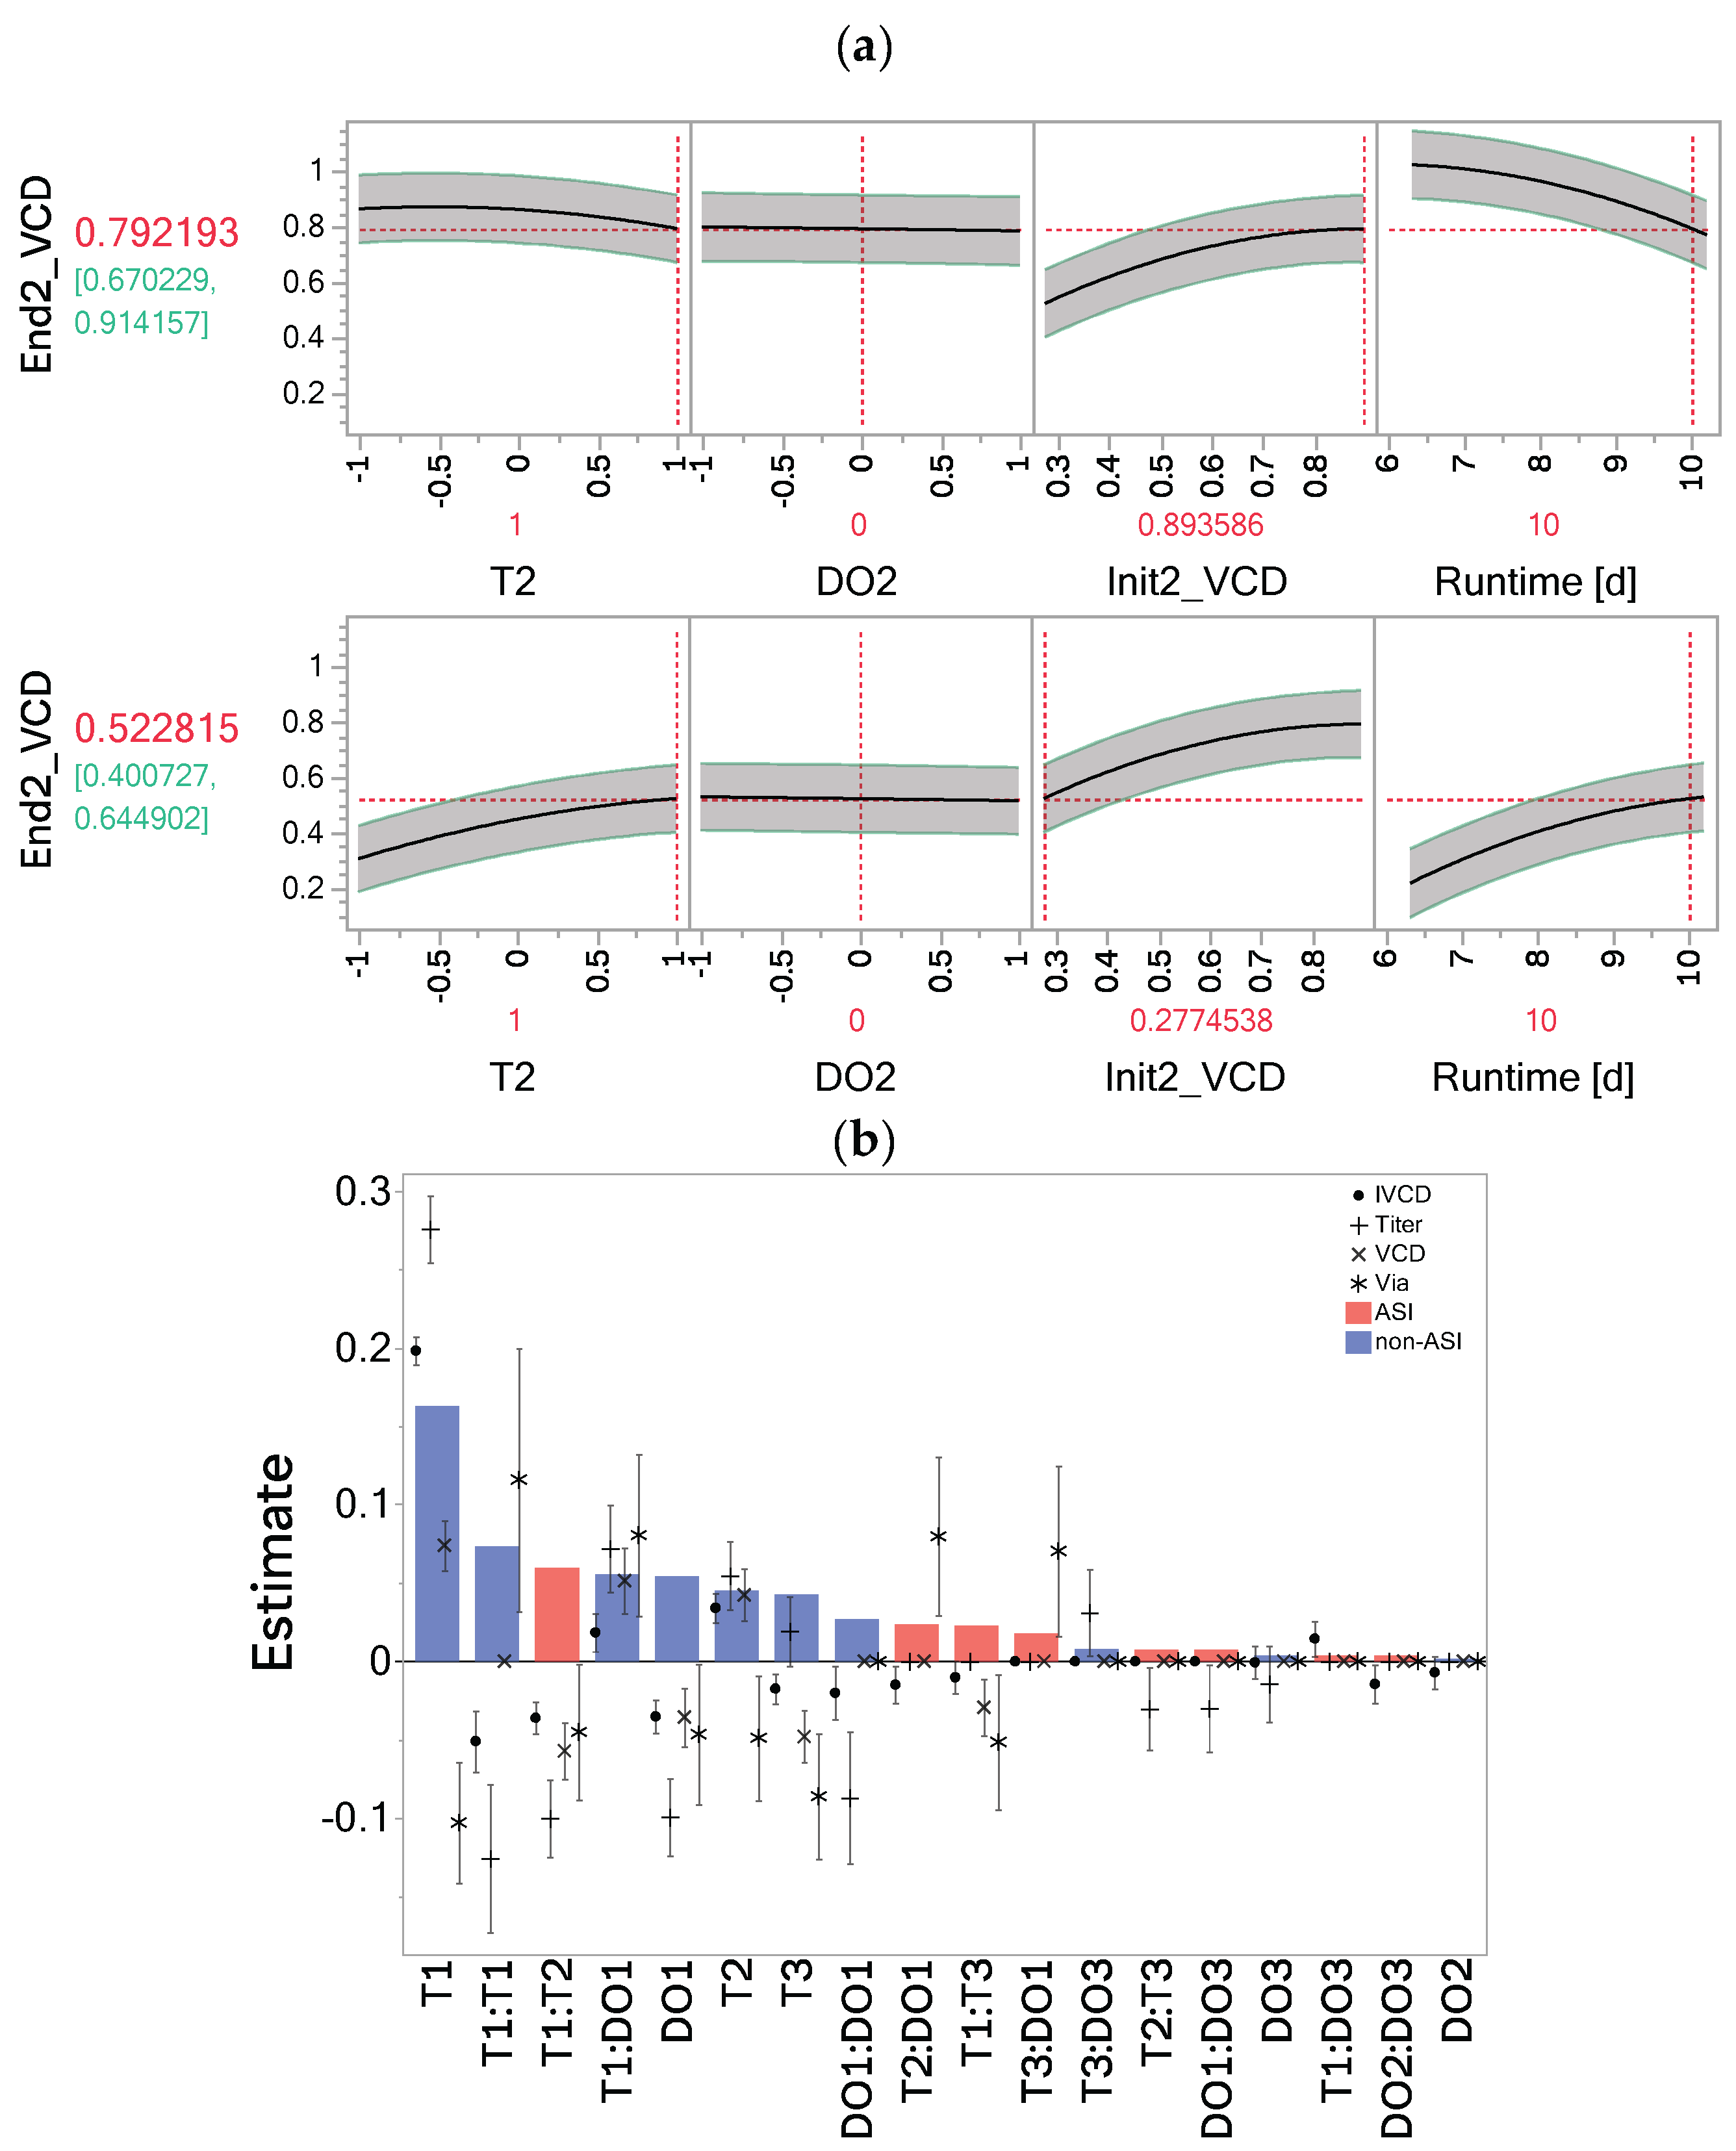
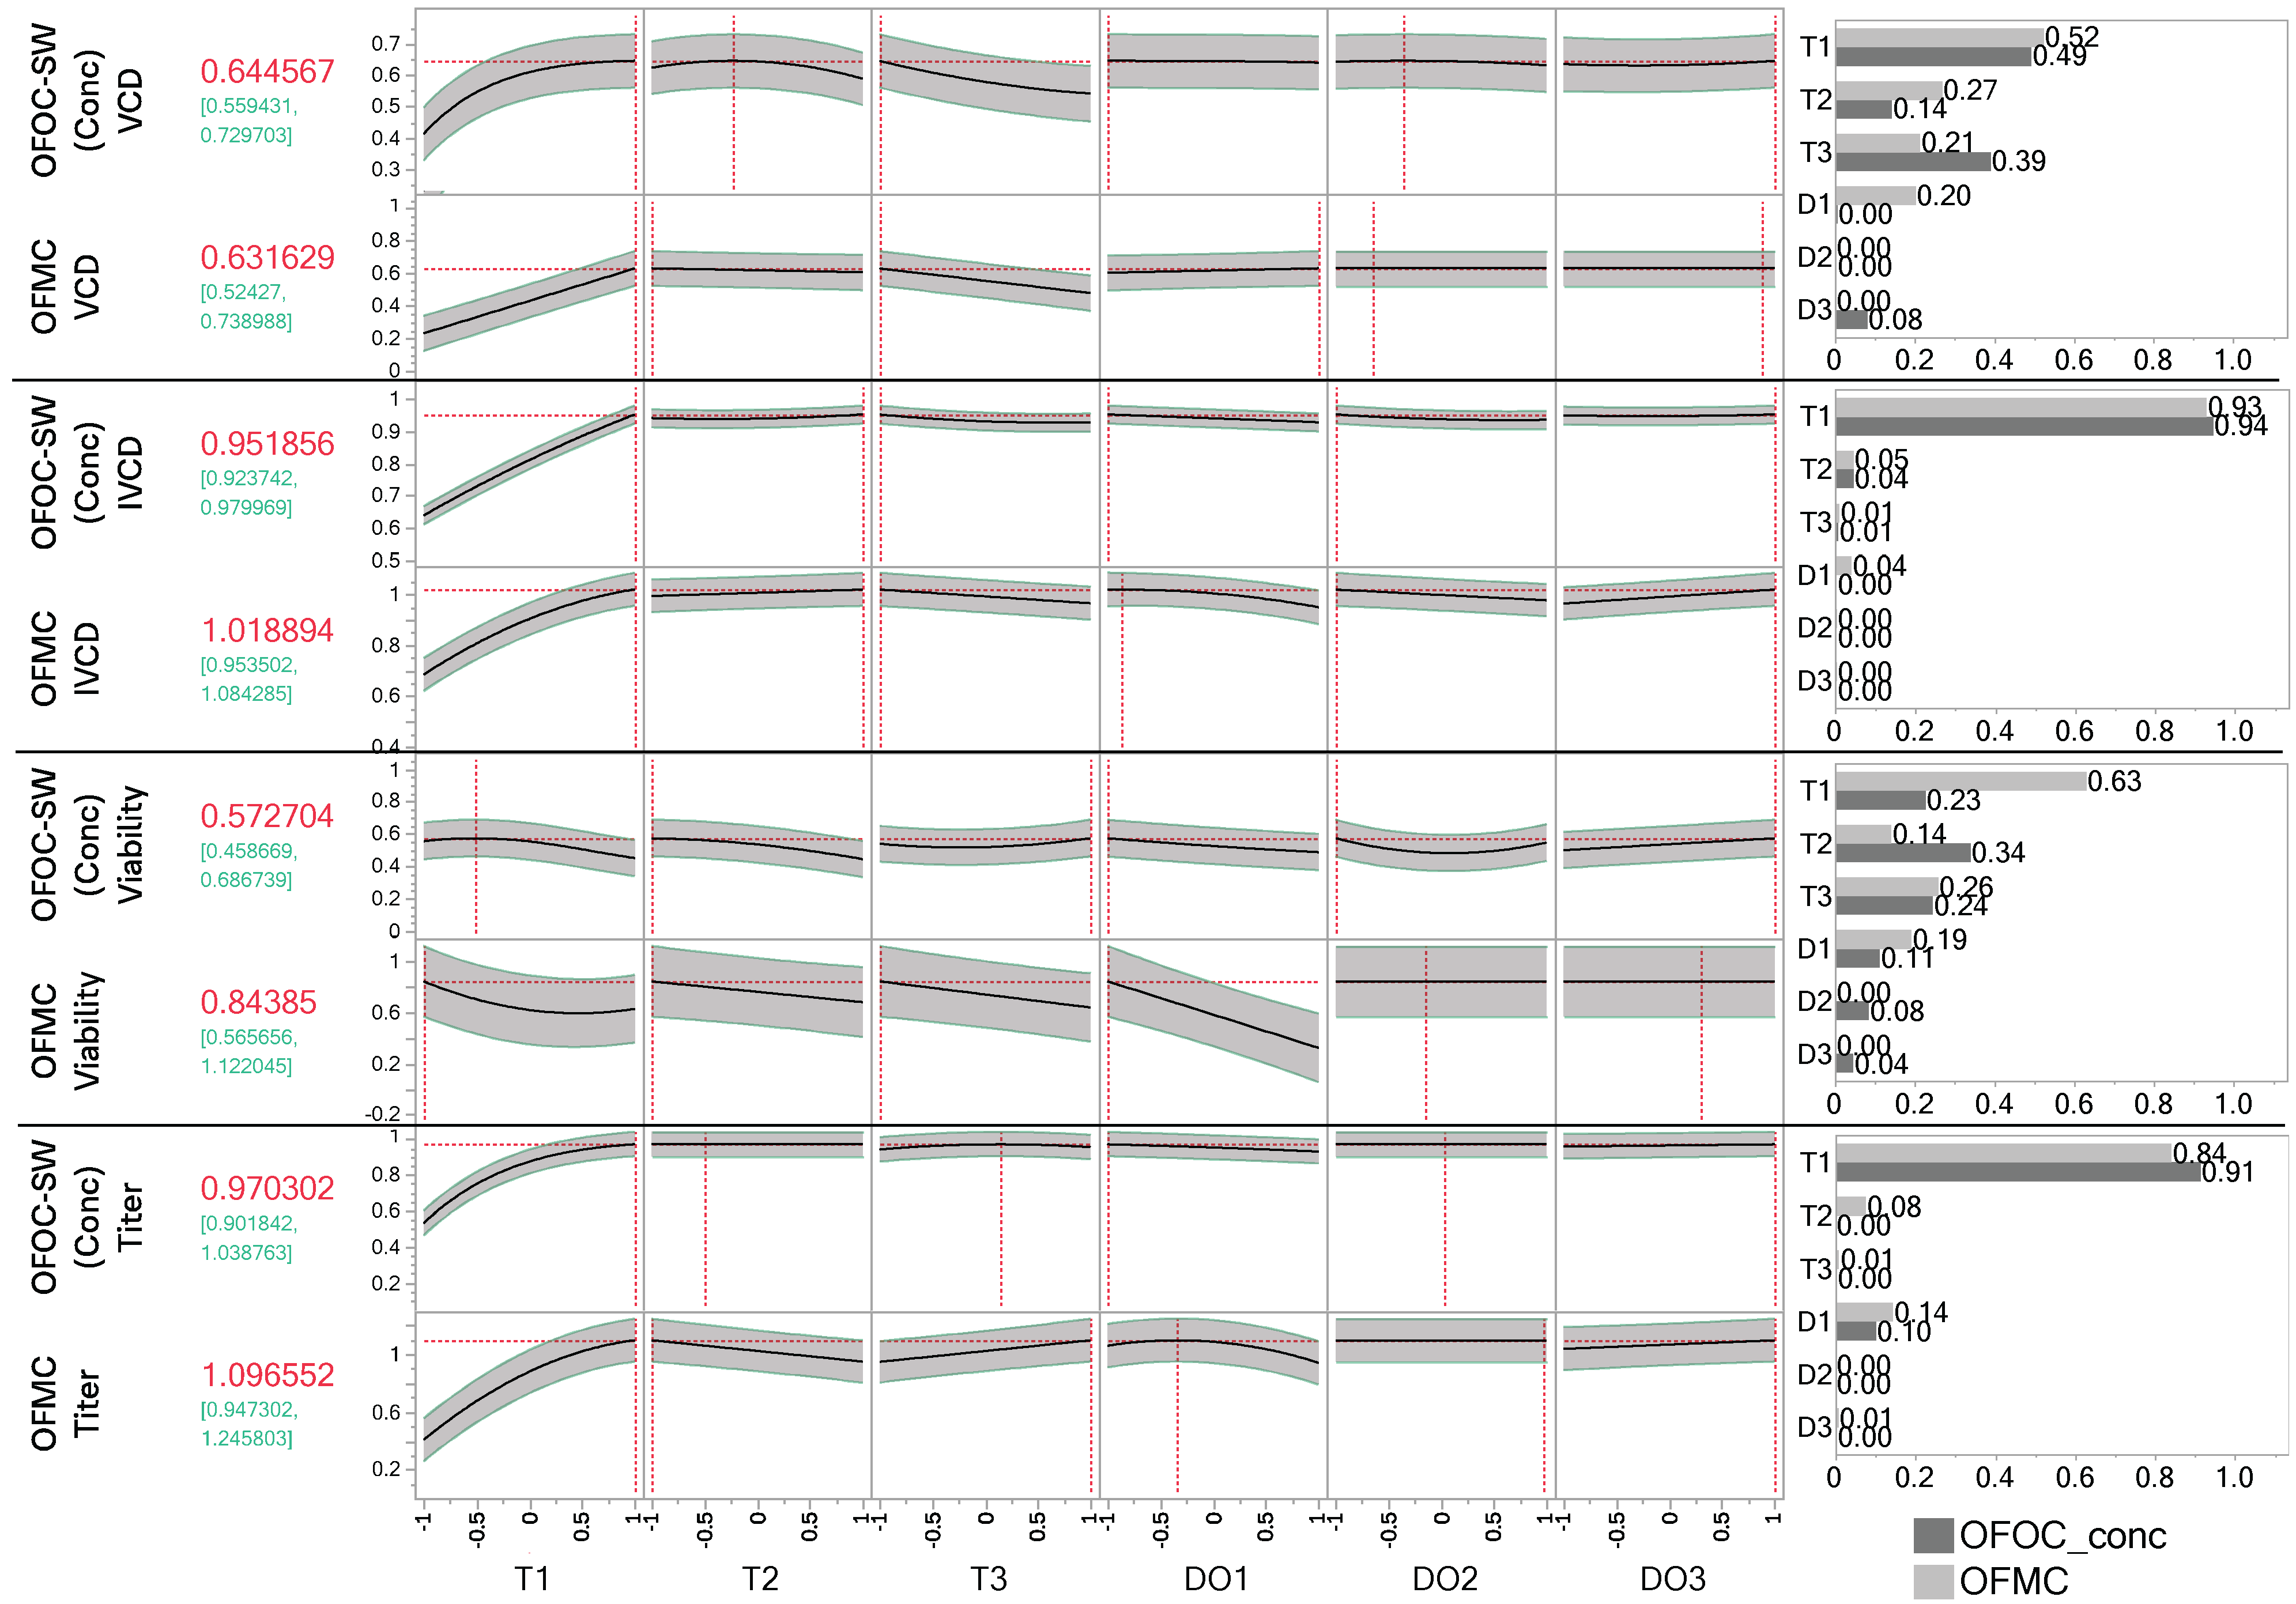
3.2. Impact of Stage 1 Factor Settings Dominates over Effects in Other Stages
3.3. Memory Effect Has Significant Impact on Process Performance
3.4. Multivariate Optimization for Day 14 Results in Similar Suggestions of the Stage-Wise vs. Direct Endpoint Modeling
4. Discussion
4.1. Direct Description of Across-Stage Interactions Simplifies Modeling
4.2. Analysis of Process Outcomes Promotes Robustness of the Analysis Against Shifted Process Kinetics
4.3. Transient Importance of Input Factors Can Be Directly Assessed
4.4. Interpretability and Applicability of Models Differ
5. Conclusions
Supplementary Materials
Author Contributions
Funding
Institutional Review Board Statement
Informed Consent Statement
Data Availability Statement
Acknowledgments
Conflicts of Interest
List of Abbreviations
| Abbreviation | Full Word |
| DO | Dissolved oxygen |
| T | Temperature |
| ASI | Across-stage interaction |
| OFOC | One-factor-one-column |
| SW | Stage-wise |
| OFMC | One-factor-multiple-columns |
| D14 | Direct timepoint model for day 14 |
| DoE | Design of experiments |
| iDoE | Intensified design of experiments |
| OLS | Ordinary least squares |
| PRESS | Predicted residual error sum of squares |
| R2 | Coefficient of determination |
| RMSE | Root mean squared error |
| RASE | Root average squared error |
| TCD | Total cell density |
| VCD | Viable cell density |
| IVCD | Integral viable cell density |
| Via | Viability |
| Init | Initial value of a response at the beginning of a stage |
| AICc | Corrected Akaike information criterion |
| PIs | Prediction intervals |
| VI | Variable importance |
| CHO | Chinese hamster ovary |
References
- Mandenius, C.; Graumann, K.; Schultz, T.W.; Premstaller, A.; Olsson, I.; Petiot, E.; Clemens, C.; Welin, M. Quality-By-Design for biotechnology-related pharmaceuticals. Biotechnol. J. 2009, 4, 600–609. [Google Scholar] [CrossRef] [PubMed]
- Gnoth, S.; Jenzsch, M.; Simutis, R.; Lübbert, A. Process Analytical Technology (PAT): Batch-to-batch reproducibility of fermentation processes by robust process operational design and control. J. Biotechnol. 2007, 132, 180–186. [Google Scholar] [CrossRef] [PubMed]
- Kumar, V.; Bhalla, A.; Rathore, A.S. Design of experiments applications in bioprocessing: Concepts and approach. Biotechnol. Prog. 2014, 30, 86–99. [Google Scholar] [CrossRef]
- Fukuda, I.M.; Pinto, C.F.F.; Moreira, C.D.S.; Saviano, A.M.; Lourenço, F.R. Design of experiments (DoE) applied to pharmaceutical and analytical quality by design (QbD). Braz. J. Pharm. Sci. 2018, 54, e01006. [Google Scholar] [CrossRef]
- Sauer, P.W.; E Burky, J.; Wesson, M.C.; Sternard, H.D.; Qu, L. A High-Yielding, Generic Fed-Batch Cell Culture Process for Production of Recombinant Antibodies. Biotechnol. Bioeng. 2000, 67, 585–597. [Google Scholar] [CrossRef]
- Hu, W. (Ed.) Cell Culture Engineering; Springer: Berlin/Heidelberg, Germany, 2006; Volume 61. [Google Scholar]
- Octavio, T.; Rarnirez, R.M. Cell cycle- and growth phase-dependent variations in size. Biotech Bioeng. 1990, 36, 839–848. [Google Scholar] [CrossRef]
- von Stosch, M.; Hamelink, J.M.; Oliveira, R. Toward intensifying design of experiments in upstream bioprocess development: An industrial Escherichia coli feasibility study. Biotechnol. Prog. 2016, 32, 1343–1352. [Google Scholar] [CrossRef]
- Nold, V.; Junghans, L.; Bisgen, L.; Drerup, R.; Presser, B.; Gorr, I.; Schwab, T.; Knapp, B.; Wieschalka, S. Applying intensified design of experiments to mammalian cell culture processes. Eng. Life Sci. 2021, 22, 784–795. [Google Scholar] [CrossRef]
- Nold, V.; Junghans, L.; Bayer, B.; Bisgen, L.; Duerkop, M. Boost dynamic protocols for producing mammalian biopharmaceuticals with intensified DoE—A practical guide to analyses with OLS and hybrid modeling. Front. Chem. Eng. 2023, 4, 1044245. [Google Scholar] [CrossRef]
- Bayer, B.; Striedner, G.; Duerkop, M. Hybrid Modeling and Intensified DoE: An Approach to Accelerate Upstream Process Characterization. Biotechnol. J. 2020, 15, 2000121. [Google Scholar] [CrossRef]
- Bayer, B.; Duerkop, M.; Striedner, G.; Sissolak, B. Model Transferability and Reduced Experimental Burden in Cell Culture Process Development Facilitated by Hybrid Modeling and Intensified Design of Experiments. Front. Bioeng. Biotechnol. 2021, 9, 740215. [Google Scholar] [CrossRef]
- von Stosch, M.; Oliveira, R.; Peres, J.; Feyo de Azevedo, S. Hybrid semi-parametric modeling in process systems engineering: Past, present and future. Comput. Chem. Eng. 2014, 60, 86–101. [Google Scholar] [CrossRef]
- von Stosch, M.; Willis, M.J. Intensified design of experiments for upstream bioreactors. Eng. Life Sci. 2017, 17, 1173–1184. [Google Scholar] [CrossRef]
- Pappenreiter, M.; Bayer, B.; Logarušić, M.; Sissolak, B.; Jungbauer, A. Irreversible and reversible impact on cellular behavior upon intra-experimental process parameter shifts in a CHO semi-continuous perfusion process. Biochem. Eng. J. 2023, 193, 108876. [Google Scholar] [CrossRef]
- Patarinska, T.; Dochain, D.; Agathos, S.N.; Ganovski, L. Modelling of continuous microbial cultivation taking into account the memory effects. Bioprocess Eng. 2000, 22, 517–527. [Google Scholar] [CrossRef]
- Grilo, A.L.; Mantalaris, A. Apoptosis: A mammalian cell bioprocessing perspective. Biotechnol. Adv. 2019, 37, 459–475. [Google Scholar] [CrossRef]
- Goos, P.; Jones, B. Optimal Design of Experiments; John and Wiley and Sons: Hoboken, NJ, USA, 2011; Volume 45. [Google Scholar]
- JMP Statistical Discovery LLC. JMP® 18 Fitting Linear Models; JMP Statistical Discovery LLC: Cary, NC, USA, 2024. [Google Scholar]
- Peixoto, J.L. Hierarchical Variable Selection in Polynomial Regression Models. Am. Stat. 1987, 41, 311–313. [Google Scholar] [CrossRef]
- Burnham, K.P.; Anderson, D.R. Multimodel inference: Understanding AIC and BIC in model selection. Sociol. Methods Res. 2004, 33, 261–304. [Google Scholar] [CrossRef]
- Yarkoni, T.; Westfall, J. Choosing Prediction Over Explanation in Psychology: Lessons From Machine Learning. Perspect. Psychol. Sci. 2017, 12, 1100–1122. [Google Scholar] [CrossRef]
- Houben, J.H.; Van Dijk, A. Effects of dietary vitamin E supplementation and packaging on the colour stability of sliced pasteurized beef ham. Meat Sci. 2001, 58, 403–407. [Google Scholar] [CrossRef]
- Borra, S.; Di Ciaccio, A. Measuring the prediction error. A comparison of cross-validation, bootstrap and covariance penalty methods. Comput. Stat. Data Anal. 2010, 54, 2976–2989. [Google Scholar] [CrossRef]
- Rajamanickam, V.; Babel, H.; Montano-Herrera, L.; Ehsani, A.; Stiefel, F.; Haider, S.; Presser, B.; Knapp, B. About model validation in bioprocessing. Processes 2021, 9, 961. [Google Scholar] [CrossRef]
- Saltelli, A. Making best use of model evaluations to compute sensitivity indices. Comput. Phys. Commun. 2002, 145, 280–297. [Google Scholar] [CrossRef]
- JMP Statistical Discovery LLC. JMP® 18 Profilers; JMP Statistical Discovery LLC: Cary, NC, USA, 2024. [Google Scholar]
- Kunzelmann, M.; Wittmann, A.; Presser, B.; Brosig, P.; Marhoffer, P.; Haider, M.; Berger, M.; Wucherpfennig, T. Lifecycle DoE—The Companion for a Holistic Development Process. Bioengineering 2024, 11, 1089. [Google Scholar] [CrossRef]
- Cochrane, D.; Orcutt, G.H. Application of Least Squares Regression to Relationships Containing Auto-Correlated Error Terms. J. Am. Stat. Assoc. 1949, 44, 32–61. [Google Scholar] [CrossRef]
- Weese, M.L.; Smucker, B.J.; Edwards, D.J. Searching for powerful supersaturated designs. J. Qual. Technol. 2015, 47, 66–84. [Google Scholar] [CrossRef]
- Núñez Ares, J.; Goos, P. Enumeration and Multicriteria Selection of Orthogonal Minimally Aliased Response Surface Designs. Technometrics 2020, 62, 21–36. [Google Scholar] [CrossRef]
- McHugh, K.P.; Xu, J.; Aron, K.L.; Borys, M.C.; Li, Z.J. Effective temperature shift strategy development and scale confirmation for simultaneous optimization of protein productivity and quality in Chinese hamster ovary cells. Biotechnol. Prog. 2020, 36, e2959. [Google Scholar] [CrossRef]
- Halliwell, B. Oxidative stress in cell culture: An under-appreciated problem? Fed. Eur. Biochem. Soc. 2003, 540, 3–6. [Google Scholar] [CrossRef]
- Kantardjieff, A.; Jacob, N.M.; Yee, J.C.; Epstein, E.; Kok, Y.J.; Philp, R.; Betenbaugh, M.; Hu, W.S. Transcriptome and proteome analysis of Chinese hamster ovary cells under low temperature and butyrate treatment. J. Biotechnol. 2010, 145, 143–159. [Google Scholar] [CrossRef]
- Sou, S.N.; Sellick, C.; Lee, K.; Mason, A.; Kyriakopoulos, S.; Polizzi, K.M.; Kontoravdi, C. How does mild hypothermia affect monoclonal antibody glycosylation? Biotechnol. Bioeng. 2015, 112, 1165–1176. [Google Scholar] [CrossRef] [PubMed]
- Torres, M.; Zúñiga, R.; Gutierrez, M.; Vergara, M.; Collazo, N.; Reyes, J.; Berrios, J.; Aguillon, J.C.; Molina, M.C.; Altamirano, C. Mild hypothermia upregulates myc and xbp1s expression and improves anti-TNFα production in CHO cells. PLoS ONE 2018, 13, e0194510. [Google Scholar] [CrossRef] [PubMed]


| (a) OFMC-D14 | ||
| T1, T2, T3, DO1, DO2, DO3, T1:T1, T1:T2, T2:T2, T1:T3, T2:T3, T3:T3, T1:DO1, T2:DO1, T3:DO1, DO1:DO1, T1:DO2, T2:DO2, T3:DO2, DO1:DO2, DO2:DO2, T1:DO3, T2:DO3, T3:DO3, DO1:DO3, DO2:DO3, DO3:DO3 | ||
| (b) OFOC-SW: Stage 1 | (c) OFOC-SW: Stage 2 | (d) OFOC-SW: Stage 3 |
| T1, DO1, Runtime, T1:T1, T1:DO1, DO1:DO1, T1:Runtime, DO1:Runtime, Runtime:Runtime, T1:T1:Runtime, T1:DO1:Runtime, DO1:DO1:Runtime | T2, DO2, Init2, Runtime, T2:T2, T2:DO2, DO2:DO2, T2:Init2, DO2:Init2, Init2:Init2, T2:Runtime, DO2:Runtime, Init2:Runtime, Runtime:Runtime, T2:T2:Runtime, T2:DO2:Runtime, DO2:DO2:Runtime, T2:Init2:Runtime, DO2:Init2:Runtime, Init2:Init2:Runtime | T3, DO3, Init3, Runtime, T3:T3, T3:DO3, DO3:DO3, T3:Init3, DO3:Init3, Init3:Init3, T3:Runtime, DO3:Runtime, Init3:Runtime, Runtime:Runtime, T3:T3:Runtime, T3:DO3:Runtime, DO3:DO3:Runtime, T3:Init3:Runtime, DO3:Init3:Runtime, Init3:Init3:Runtime |
| (e) Init titer for stage 3 | ||
| T1, T2, DO1, DO2, T1:T1, T2:T2, T1:DO1, DO1:DO1, T2:DO2, DO2:DO2 | ||
| Stage 1 (Day 2–6) | Stage 2 (Day 6–10) | Stage 3 (Day 10–14) | Stage 1 (Day 2–6) | Stage 2 (Day 6–10) | Stage 3 (Day 10–14) | ||||||||
|---|---|---|---|---|---|---|---|---|---|---|---|---|---|
| Run | T1 | DO1 | DO2 | T2 | DO3 | T3 | Run | T1 | DO1 | DO2 | T2 | DO3 | T3 |
| 1 | −1 | 1 | −1 | −1 | −1 | −1 | 25 | 1 | −1 | −1 | −1 | 1 | 0 |
| 2 | 1 | 0 | 0 | −1 | 0 | −1 | 26 | 0 | −1 | 0 | 1 | 0 | −1 |
| 3 | 1 | −1 | −1 | 1 | −1 | −1 | 27 | 1 | 0 | 0 | 0 | 1 | −1 |
| 4 | 1 | 0 | 0 | −1 | 0 | −1 | 28 | 0 | 0 | 0 | 0 | 0 | 0 |
| 5 | −1 | 1 | −1 | 1 | −1 | 1 | 29 | 1 | −1 | 0 | 0 | −1 | 1 |
| 6 | −1 | 0 | 0 | −1 | 0 | −1 | 30 | 0 | 1 | 1 | −1 | 1 | −1 |
| 7 | 1 | 1 | −1 | 1 | 1 | −1 | 31 | −1 | 0 | 1 | 0 | 0 | 1 |
| 8 | 1 | 1 | −1 | −1 | 1 | 1 | 32 | 0 | 1 | 1 | 1 | 1 | 1 |
| 9 | −1 | 0 | −1 | −1 | 1 | −1 | 33 | 0 | 0 | 0 | −1 | −1 | 0 |
| 10 | 1 | 1 | 1 | −1 | 1 | 0 | 34 | 1 | 0 | 0 | 1 | 1 | 0 |
| 11 | −1 | 1 | 1 | 1 | 1 | 0 | 35 | −1 | 1 | 0 | 0 | 0 | 0 |
| 12 | −1 | −1 | −1 | −1 | −1 | 1 | 36 | 1 | 1 | −1 | −1 | −1 | −1 |
| 13 | −1 | −1 | −1 | 1 | 1 | 1 | 37 | −1 | −1 | 1 | −1 | 0 | 0 |
| 14 | 1 | 0 | 0 | 1 | 0 | 1 | 38 | 1 | −1 | 1 | −1 | −1 | −1 |
| 15 | −1 | 0 | 0 | −1 | 0 | −1 | 39 | −1 | 0 | −1 | 1 | 0 | −1 |
| 16 | 1 | 0 | 0 | 1 | 0 | 1 | 40 | 0 | 1 | −1 | −1 | 0 | 0 |
| 17 | −1 | 1 | 1 | −1 | −1 | 1 | 41 | 0 | 0 | −1 | 0 | 0 | 0 |
| 18 | −1 | −1 | 1 | 1 | −1 | 0 | 42 | 0 | 0 | 0 | 0 | 0 | 0 |
| 19 | −1 | 0 | 0 | −1 | 0 | −1 | 43 | 0 | −1 | −1 | 0 | 0 | 1 |
| 20 | 1 | −1 | 1 | −1 | 1 | 1 | 44 | 0 | −1 | 1 | −1 | −1 | 1 |
| 21 | 1 | −1 | 1 | 1 | 1 | −1 | 45 | 1 | 1 | −1 | −1 | −1 | 1 |
| 22 | 1 | 1 | 1 | 1 | −1 | −1 | 46 | −1 | −1 | 0 | 0 | 1 | −1 |
| 23 | 1 | 0 | 0 | 1 | 0 | 1 | 47 | −1 | 0 | 0 | −1 | 1 | 1 |
| 24 | 1 | 0 | 0 | −1 | 0 | −1 | 48 | −1 | 0 | 1 | 0 | −1 | −1 |
| Model | Predictor | R2 | RASE |
|---|---|---|---|
| OFOC-SW(Conc) | VCD | 0.6755 | 0.0673 |
| OFOC-SW(S3) | VCD | 0.8433 | 0.0468 |
| OFMC-D14 | VCD | 0.8588 | 0.0444 |
| OFOC-SW(Conc) | IVCD | 0.9020 | 0.0600 |
| OFOC-SW(S3) | IVCD | 0.9891 | 0.0200 |
| OFMC-D14 | IVCD | 0.9867 | 0.0221 |
| OFOC-SW(Conc) | Via | 0.2287 | 0.1751 |
| OFOC-SW(S3) | Via | 0.7207 | 0.1054 |
| OFMC-D14 | Via | 0.7429 | 0.1011 |
| OFOC-SW(Conc) | Titer | 0.8591 | 0.1111 |
| OFOC-SW(S3) | Titer | 0.9753 | 0.0465 |
| OFMC-D14 | Titer | 0.9666 | 0.0541 |
| OFOC-SW | OFMC-D14 |
|---|---|
| Planning | |
| Response surface model for each stage Manual correction/constraint to balance factor levels within bioreactor and stage Response variability on a stage level is needed | Response surface model with stage-dependent iDoE factors considered Many factors require a lot of runs Unlikely 2 factor interactions, quadratic effects that can be excluded? |
| Execution | |
| Time series data are required (multiple sampling per stage, before/after shifts) for each response | Routine sampling/endpoint sampling sufficient |
| Modeling | |
| Stage-wise OLS regression models with Init and culture duration as additional factors Concatenation of stages based on Init factor to yield whole-process model Errors in models of previous stages are propagated to the next stage (false Init value prediction) Time series modeling required, only D14 predictions are used for optimization | Classical OLS regression model (simultaneously considering stage-dependent factors and interactions impact on D14) |
| Interpretation of factor effects | |
| Impact of individual factors on a stage level should be interpreted in combination with the respective Init factor Impact of individual factors on the whole process can be estimated for the concatenated model | Explicit description of the influence of each stage-dependent factor, interaction, across-stage interaction, and quadratic effect on the whole process |
| Consideration of the memory effect | |
| Stage-dependent factors of earlier stage models influence consecutive stages’ models by their cumulative influence on the Init factor Effect of process history needs to manifest within the modeled stage Accurate prediction of the Init factor is crucial to predict stage-dependent factor effects | Explicit consideration during planning and quantification via across-stage interactions |
| Quality checks | |
| Standard statistical metrics (R2, , RMSE) Regression assumptions/investigation of residuals: linear, normally distributed, equal variances | |
Disclaimer/Publisher’s Note: The statements, opinions and data contained in all publications are solely those of the individual author(s) and contributor(s) and not of MDPI and/or the editor(s). MDPI and/or the editor(s) disclaim responsibility for any injury to people or property resulting from any ideas, methods, instructions or products referred to in the content. |
© 2025 by the authors. Licensee MDPI, Basel, Switzerland. This article is an open access article distributed under the terms and conditions of the Creative Commons Attribution (CC BY) license (https://creativecommons.org/licenses/by/4.0/).
Share and Cite
Kienzle, S.; Junghans, L.; Wieschalka, S.; Diem, K.; Takors, R.; Radde, N.E.; Kunzelmann, M.; Presser, B.; Nold, V. Direct Consideration of Process History During Intensified Design of Experiments Planning Eases Interpretation of Mammalian Cell Culture Dynamics. Bioengineering 2025, 12, 319. https://doi.org/10.3390/bioengineering12030319
Kienzle S, Junghans L, Wieschalka S, Diem K, Takors R, Radde NE, Kunzelmann M, Presser B, Nold V. Direct Consideration of Process History During Intensified Design of Experiments Planning Eases Interpretation of Mammalian Cell Culture Dynamics. Bioengineering. 2025; 12(3):319. https://doi.org/10.3390/bioengineering12030319
Chicago/Turabian StyleKienzle, Samuel, Lisa Junghans, Stefan Wieschalka, Katharina Diem, Ralf Takors, Nicole Erika Radde, Marco Kunzelmann, Beate Presser, and Verena Nold. 2025. "Direct Consideration of Process History During Intensified Design of Experiments Planning Eases Interpretation of Mammalian Cell Culture Dynamics" Bioengineering 12, no. 3: 319. https://doi.org/10.3390/bioengineering12030319
APA StyleKienzle, S., Junghans, L., Wieschalka, S., Diem, K., Takors, R., Radde, N. E., Kunzelmann, M., Presser, B., & Nold, V. (2025). Direct Consideration of Process History During Intensified Design of Experiments Planning Eases Interpretation of Mammalian Cell Culture Dynamics. Bioengineering, 12(3), 319. https://doi.org/10.3390/bioengineering12030319