
Artificial Intelligence in Nephrology: From Early Detection to Clinical Management of Kidney Diseases

 , ,
, ,  , and
, and 
Abstract
1. Introduction
1.1. Artificial Intelligence
1.2. Machine Learning and Deep Learning
1.3. Kidney Diseases and Treatments
- (i).
- Acute Kidney Injury (AKI) refers to a kidney malfunction characterized by rapid deterioration of its functions. Generally, AKI causes renal dysfunction in patients already suffering from other diseases, only for short periods. Despite its reversibility, an incomplete recovery can lead to the terminal stages of the disease and, though not commonly, to death.
- (ii).
- Chronic Kidney Disease (CKD) refers to sustained kidney malfunction related to the presence of structural or functional abnormalities. CKD is stated when a reduction in the so-called “estimated Glomerular Filtration Rate” (eGFR) lasts for three months or more [11]. Chronic kidney disease is very common in patients with diabetes and hypertension and can lead to death. Specifically, eGFR is the best index for kidney function as it measures the kidneys’ ability to filter toxins and waste from the blood. Dialysis treatment or a kidney transplant is required when eGFR is very low. Equation (1) shows the Cockcroft–Gault law for the eGFR calculation [12]:
1.4. Artificial Intelligence Application on Kidney Diseases and Hemodialysis
- AI techniques used as tools for predicting chronic kidney disease in renal-healthy patients or the probability of survival in renal-ill patients, starting from both numeric data and diagnostic images.
- AI techniques used as tools to support traditional methods for the CKD detection in renal-ill patients, considering both numeric data and diagnostic images.
- AI techniques used as tools to improve dialysis treatment or support physicians in managing patients in their care.
- AI techniques used as tools to predict dialysis complications during the treatment or mortality in patients awaiting renal transplantation.
2. Machine Learning: Models’ Classification and Performance Parameters
2.1. Machine Learning and Its Ramifications
- Supervised Learning uses training data that include the desired outputs. It comprises two main types of models: classification, which assigns inputs to predefined categories, and regression, which predicts continuous numerical values based on input features.
- Unsupervised Learning uses training data that do not include the desired outputs. It embraces clustering (based on grouping similar data points), association models (based on identifying relationships between variables), and dimensionality reduction (based on simplifying datasets by reducing the number of features to reduce the computational load) [30].
- Semi-Supervised Learning uses training data that include a small amount of desired outputs. It includes self-training (based on generating new labeled data using self-generated predictions), low-density separation (used in classification problems where classes are separated by low-density regions), and graph-based algorithms (based on the use of graphical representations to model relationships between data instances) [29].
- Reinforcement Learning trains an agent to make decisions in a complex environment. Input data is not provided; instead, only the output is presented. The algorithm learns how to derive this output through trial and error, relying on past experiences. It includes dynamic programming (based on solving problems by breaking them into sub-problems), Monte Carlo methods (based on estimating solutions via random sampling), and heuristic methods (based on approximating solutions when optimal ones are hard to find).
Supervised Learning Models
2.2. Deep Learning Models
2.2.1. Supervised Neural Networks
- Alex Networks (AlexNets) were developed by Krizhevsky et al. [48] in 2012. It popularized deep learning in image classification with five convolutional layers.
- Residual Networks (ResNets) use residual blocks to address the gradient degradation, simplifying the back-propagation process during training.
- Inception Networks (InceptionNets), also called GoogLe Networks (GoogLeNets), have multiple convolution modules to capture features at different spatial scales and learn richer representations.
- U-Networks (U-Nets), mainly used for biomedical image segmentation, use a contraction path followed by an expansion path (encoder-decoder), resulting in a typical “U-shape”.
- Dense Networks (DenseNets) connect each convolutional layer to all previous ones within the same dense block, improving learning efficiency.
- Squeeze Networks (SqueezeNets) are similar to AlexNets but smaller in size, used for applications that require low memory usage and high processing speed while maintaining good image classification accuracy.
- Condensed Networks (CondenseNets) reduce parameters and operations through a condensation technique, maintaining high image classification performance with low memory and computational cost.
- Fully Connected Networks, where each neuron in one layer is connected to all neurons in the next layer. A simple form is the MultiLayer Perceptron (MLP), with three layers of nodes: an input layer, one or more hidden layers, and an output layer. MLP is effective for solving general supervised learning tasks.
- Probabilistic Neural Networks (PNNs) provide output probability estimates instead of single predictions. They help to better understand the uncertainty in the data and improve the accuracy of predictions.
- Simple Recurrent Neural Networks (SimpleRNNs) are the simplest form of RNNs, where the output of a hidden layer is fed back as input for the hidden layer itself at each time step.
- Long Short Term Memory (LSTM) networks handle long-term time dependencies, suitable for complex sequences. They can also be used in unsupervised scenarios.
- Gated Recurrent Units (GRUs), similar to LSTM, efficiently address the vanishing gradient problem, consisting of the excessive shrinkage of gradients during back-propagation.
- Simple Recurrent Units (SRUs) are faster and less computationally expensive than GRU, ideal for real-time use. They present an internal state that updates efficiently at each time step, allowing relevant information to be stored over time.
2.2.2. Unsupervised Neural Networks
2.2.3. Hybrid Neural Networks
2.3. Machine Learning Models’ Performance Indicators
2.3.1. Classification Performance Indicators
- Accuracy is the percentage of correct predictions over total predictions.
- Specificity is the percentage of negative instances correctly identified.
- Recall (or Sensitivity or True Positive Rate (TPR)) is the percentage of positives correctly identified.
- Precision is the percentage of positive instances correctly identified among all predicted positives.
- Fβ-Score combines precision and recall into a single value weighted by β, thus providing an overall measure of the performance. In Equation (6), for β > 1 the score favors recall, while for β < 1 it gives more weight to precision. The most common is the F1-Score (β = 1), which gives equal weight to precision and recall.
- False Positive Rate (FPR) is the ratio of the number of cases misclassified as positive to the total number of true negatives.
- Area Under the Receiver Operating Characteristic Curve (AUC-ROC) is the area subtended by the TPR vs. FPR curve, as shown in Figure 10a.
- Area Under the Precision-Recall Curve (AUC-PR) is the area subtended by the Precision vs. Recall curve, as shown in Figure 10b.
- Average Precision (AP) is the precision averaged across different Recall levels along the Precision-Recall curve.
- The mean Average Precision (mAP) is the average of AP across all classes, used to assess the performance of classification or object detection models.
- The Dice coefficient is used in image analysis; it assesses how closely a segmented region of an image coincides with a reference or truth region.
- Matthews Correlation Coefficient (MCC) measures the correlation between the predictions of a binary classification model and the actual class labels, returning a value from −1 (inverse prediction) to +1 (perfect prediction), with 0 indicating a random prediction.
2.3.2. Regression Performance Indicators
- R2 Score measures how well a statistical model predicts an outcome. R2 ranges between 0 and 1: if R2 = 0, the model does not predict the outcome; if R2 = 1, the model perfectly predicts the outcome; if 0 < R2 < 1, the model does not predict the outcome perfectly.
- Mean Squared Error (MSE) calculates the mean square of the differences between predicted and actual values.
- Mean Absolute Error (MAE) averages the absolute differences between predicted and actual values.
- Root Mean Squared Error (RMSE) measures the square root of MSE between predicted values and actual values.
- Concordance index (C-index) measures how well a model predicts the order of events (e.g., survival time of patients). It compares the model predictions with what actually happens. It is the ratio of concordant pairs between real and predicted labels to the total number of comparable pairs.
2.4. Comparative Insights: The Main Machine Learning Models Applied to Nephrology
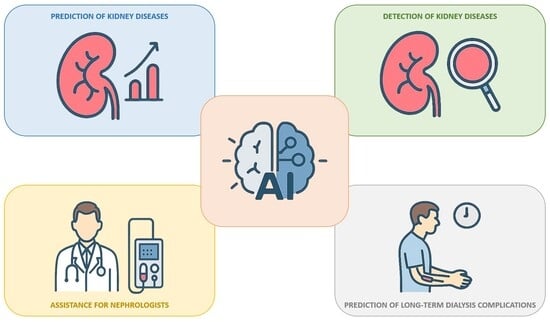
3. Machine Learning Models Used as Prediction, Detection, and Treatment Support Tools in the Renal Field
3.1. Machine Learning as a Tool to Predict Kidney Diseases

| Authors and Ref. | Year of Publication | Models | Dataset | Input Variables | Best Results | Aim |
|---|---|---|---|---|---|---|
| Adhikari et al. [100] | 2019 | IDEA model | 2911 adult surgical patients from the University of Florida Health, FL, USA | 285 (pre-operative, and intraoperative variables) | AUC-ROC: 86% Accuracy: 78% | Early prediction of post-operative AKI in patients undergoing surgery |
| Akter et al. [136] | 2023 | CKD.Net model | Regular health check information of 1 million CKD patients from several (unspecified) hospitals of the National Health Insurance Sharing Service (NHISS) website, released by Wonju-si, Gangwon-do, Republic of Korea | 27 (demographic information, clinical variables, and laboratory data) | Accuracy: 99.80% | Prediction of different CKD stages and monitoring of eGFR and creatinine levels in patients aged 25 to 90 |
| Akter et al. [79] | 2021 | ANN model LSTM model Bidirectional LSTM model GRU model Bidirectional GRU model MLP model SimpleRNN model | 400 records from the ML repository of the University of California, Irvine, CA, USA | 25 (demographic information, clinical variables, and laboratory data) | Accuracy (ANN model): 99% | Early diagnosis of CKD and identification of the associated risk factors based on patients’ data |
| Alfieri et al. [129] | 2021 | CNN model Log. Reg. model | 35,573 ICU patients from the electronic Intensive Care Unit (eICU) database, released by Massachusetts Institute of Technology, Cambridge, MA, USA + MIMIC-III database, released by Beth Israel Deaconess Medical Center (BIDMC), Boston, MA, USA | Demographic information, and laboratory data (n.a. for CNN model, 11 for Log. Reg. model) | AUC-ROC (CNN model): 89% | Prediction of AKI in ICU patients based on changes in urinary flow |
| Alfieri et al. [130] | 2022 | Log. Reg. model DL model | 10,596 ICU patients from the University Hospital ICU of Amsterdam, Amsterdam, Netherlands | Hourly urine output values, creatinine levels, and demographic data | AUC-ROC (DL model): 90.70% | Prediction of AKI patients based on serum creatinine and decrease in urine output |
| Almansour et al. [77] | 2019 | ANN model SVM model | 400 records from Apollo Hospitals, Tamil Nadu, India, released by the ML repository of the University of California, Irvine, CA, USA | 24 (demographic information, clinical variables, and laboratory data) | Accuracy (ANN model): 99.75% | Early diagnosis of CKD patients to reduce the risk of progression to chronic renal failure |
| Arulanthu et al. [92] | 2020 | Log. Reg. model | 400 records from the ML repository of the University of California, Irvine, CA, USA | 24 (demographic information, clinical variables, and laboratory data) | Accuracy: 97.75% | Prediction of CKD patients via IoT devices and cloud platforms |
| Arumugham et al. [68] | 2023 | DNN model | 400 records from the ML repository of the University of California, Irvine, CA, USA | 25 (demographic information, clinical variables, and laboratory data) | AUC-ROC: 98.86% Accuracy: 98.75% | Prediction of early-stage CKD via explainable models based on patients’ data |
| Bandera et al. [88] | 2023 | GBM model AdaBoost model RF model (all preceded by the Neutrosophic DEMATEL algorithm) | 400 records from the ML repository of the University of California, Irvine, CA, USA | 28 (demographic information, clinical variables, and laboratory data) | Accuracy (Neutrosophic DEMATEL algorithm + AdaBoost model): 99.17% | Prediction of CKD progression considering only the most relevant features of patients’ data |
| Bell et al. [95] | 2020 | Multivariate logistic regression model | 273,450 adult patients from hospitals in Tayside, Scotland, UK + 218,091 patients of hospitals in Kent, England, UK; and 1,173,607 adult patients from hospitals in Alberta, Canada, both for model validation | 4 (demographic information, previous pathologies, and laboratory data) | C-index: 80% (Tayside) | Prediction of the development of AKI based on serum creatinine values of adult patients |
| Bellocchio et al. [137] | 2021 | PROGRES-CKD model | 24,535 CKD patients from Fresenius Medical Care’s (FMC) NephroCare network in Europe + 6760 patients from German Chronic Kidney Disease (GCKD), Germany | 34 (demographic information, previous pathologies, clinical variables, and laboratory data) | AUC-ROC (GCKD): 91% (6 months), 85% (24 months) | Prediction of ESKD in CKD patients at 6 and 24 months |
| Bermudez-Lop et al. [96] | 2019 | NMR spectroscopy + RF model | 395 non-diabetic individuals from NEFRONA cohort including different hospitals, Spain | 17 (demographic information, previous pathologies, clinical variables, and laboratory data) | AUC-ROC: 78.90% | Prediction of the risk of atherosclerosis in non-diabetic CKD patients |
| Black et al. [140] | 2020 | ResNet model | 127 digital renal images of 63 human kidney stones from the stone laboratory Louis C. Herring and Co., Orlando, FL, USA | Structural and morphological features extracted by the model | Recall: 85% | Prediction of human kidney stones composition from digital renal photographs |
| Bredt et al. [104] | 2022 | Log. Reg. model ANN model | 145 Deceased-Donor Liver Transplantation (DDLT) cases from a tertiary referral hospital, Brazil | 6 (demographic information, clinical variables, and diagnostic data) | AUC-ROC (ANN model): 81% | Prediction of AKI after liver transplantation in transplant patients |
| Chen et al. [71] | 2023 | VB-MrFo-Net model + RF model + SVM model | 126,345 CT images of 838 patients from cohorts of Shanghai General Hospital, China + The Cancer Genome Atlas (TCGA), USA + Clinical Proteomic Tumor Analysis Consortium (CPTAC), USA + Kidney Tumor Segmentation Challenge, USA | 2600 (VB-MrFo-Net model; tumor structure and texture information extracted by the model) 22 (RF model + SVM model; tumor structure and texture information) | Dice score: 87% (VB-MrFo-Net model) AUC-ROC: 78.20% (RF model + SVM model) | Non-invasive segmentation and prediction of ccRCC prognosis and its stage based on patients’ data |
| Chen et al. [73] | 2020 | AHDCNN model | CT and MRI images of 100 patients from National Institutes of Health (NIH) Clinical Center, Bethesda, Maryland, MD, USA | Renal nodules structure and texture information extracted by the model | Accuracy: 97.14% F1-Score: 97.30% | Early diagnosis of CKD patients, with attention to kidney cancer and its subtypes using IoT platform |
| Elhoseny et al. [67] | 2019 | D-ACO model | 400 records from the ML repository of the University of California, Irvine, CA, USA | 24 (demographic information, clinical variables, and laboratory data) | Accuracy: 95% | Prediction and classification of CKD based on patients’ data |
| Galloway et al. [121] | 2019 | CNN model | 1,638,546 ECGs of 511,345 patients from three Mayo Clinic centers in MN, FL, and AZ, USA | 4 (ECG leads) | AUC-ROC: 88.30% | Prediction of hyperkalemia in patients with renal disease based on potassium level |
| Hamedan et al. [91] | 2020 | Fuzzy system model | 216 kidney disease patients from two teaching hospitals in Tehran, Iran | 16 (demographic information, clinical data, laboratory data, and previous pathologies) | Accuracy: 92.13% AUC-ROC: 92% | Prediction of CKD based on patients’ data |
| He et al. [102] | 2021 | RF model SVM model DT model CIT model Log. Reg. model | 493 Donations after Cardiac Death Liver Transplantation (DCDLT) patients from the First Affiliated Hospital, Zhejiang University School of Medicine, Hangzhou, Zhejiang, China | 51 (demographic information, pre-operative, intraoperative, and post-operative data) | AUC-ROC (RF model): 85% Accuracy (RF model): 79% | Prediction of AKI in DCDLT patients |
| Hu et al. [131] | 2022 | XGBoost model RF model NB model Log. Reg. model SVM model kNN model DT model | 22,360 ICU patients from MIMIC-IV database, released by BIDMC’s ICU, Boston, MA, USA | 29 (demographic information, clinical data, laboratory data, and previous pathologies) | AUC-ROC (XGBoost model): 89% Accuracy (XGBoost model): 87.70% | Prediction of mortality in ICU patients with AKI |
| Inaguma et al. [124] | 2020 | Log. Reg. model RF model | 9911 CKD patients from Fujita Health University Hospital, Toyonaka, Aichi, Osaka, Kansai, Japan | 11 (clinical data, laboratory data, and previous pathologies) | AUC-ROC (RF model): 73% | Prediction of the rapid renal decline in CKD patients |
| Islam et al. [75] | 2019 | AdaBoost model + J48 model LogitBoost model + Ant-Miner | 2800 CKD and non-CKD patients from unspecified hospitals | 24 (demographic information, clinical variables, laboratory data, and previous pathologies) | F1-Score (LogitBoost + Ant-Miner models): 99.75% | Prediction of CKD patients and rule generation of the relationship between CKD attributes |
| Kalisnik et al. [111] | 2022 | Detect-A(K)I model Log. Reg. model RF model SVM model DNN model | 7214 cardiac surgery patients from the Department of Cardiac Surgery at Klinikum Nurernberg-Paracelsus Medical University, Nurnberg, Germany | 21 (demographic information, pre-operative clinical status, peri-operative, and post-operative variables) | Accuracy (Detect-A(K)I model): 82.10% AUC-ROC (Detect-A(K)I model): 88% | Early detection of CSA-AKI patients |
| Kanda et al. [93] | 2019 | BNN model + SVM model | 7465 health patients from Yamagata, Tohoku, Japan | 11 (demographic information, clinical variables, and laboratory data) | Generic test error (unspecified): 0.1186 | Identification of patients at risk of CKD progression in a healthy population |
| Kanda et al. [118] | 2022 | XGBoost model Log. Reg. model DNN model | 24,949 adult hyperkalemic patients the Japanese national database Medical Data Vision Company, Tokyo, Japan + 86,279 adult hyperkalemic patients from the Japanese national database Real World Data Vision Company, Osaka, Japan | 64 (medications, medical history, and risk factors) | AUC-ROC (XGBoost model): 95.70% | Prediction of CKD development in hyperkalemic patients |
| Kandasamy et al. [127] | 2023 | GMM model + Hybrid RBFNN model | 40,000 CKD patients from MIMIC-IV database, released by BIDMC’s ICU, Boston, MA, USA | Laboratory results, radiographies, clinical notes and observations, progress reports, historical medication records, and patients’ personal information | n.a. (framework designed to exceed the performance of existing models) | Prediction of disease progression in CKD patients |
| Kers et al. [141] | 2022 | CNN model | 5844 digital WSIs of kidney allograft biopsies from 1948 patients hospitalized in Amsterdam University Medical Center, Amsterdam, Netherlands; from the University Medical Center of Utrecht, Utrecht, Netherlands; and from the Institute of Pathology, Rheinisch-Westfälische Technische Hochschule (RWTH) Aachen University, Aachen, Germany | Structural and morphological features extracted by the model | AUC-ROC: ≃78% | Classification of kidney allograft biopsies into normal and rejected to predict kidney rejection in transplant patients |
| Konieczny et al. [115] | 2021 | RF model MLP model DT model Gaussian NB model AdaBoost model SVM model kNN model | 80 patients with biopsy-proven IgAN from the Department of Nephrology and Transplantation Medicine, Wroclaw Medical University, Wroclaw, Poland | 35 (demographic information, clinical variables, and laboratory data) | Accuracy (RF model): 80.25% | Prediction of renal functions deterioration in patients with IgA nephropathy |
| Kordzadeh et al. [108] | 2021 | ANN model | 241 post-EndoVascular Aneurysm Repair (post-EVAR) patients from Mid Essex National Health Service (NHS) Trust Foundation, Essex, UK | 26 (demographic information, pre-operative variables, post-operative complications, aneurysm morphology, and hospitalization data) | Accuracy: >86% | Prediction of possible complications post-EVAR in operated patients |
| Kuo et al. [126] | 2019 | ResNet model XGBoost model | 4505 kidney UltraSound (US) images of 1299 patients from China Medical University Hospital, Taiwan | Structural and morphological features extracted by the model | Accuracy (ResNet model): 85.60% AUC-ROC (ResNet model): 90.40% | Prediction of renal functions deterioration and its severity based on patients’ eGFR values |
| Lakshmanaprabu et al. [90] | 2019 | PSO algorithm + DNN model | 400 records from the ML repository of the University of California, Irvine, CA, USA | 24 (demographic information, clinical variables, and laboratory data) | AUC-ROC: 98.47% Accuracy: 99.25% | Prediction and severity assessment of CKD patients using IoT and cloud-based frameworks |
| Lee et al. [114] | 2022 | RF model Extra Trees model XGBoost model Landmark-Boosting model LGBM model Log. Reg. model | 11,661 CKD patients from Taipei Veterans General Hospital (VGH) Big Data Center, Taipei, Taiwan | Demographic characteristics, comorbidities, laboratory data, and medication prescriptions | AUC-ROC (Landmark-Boosting model): 87.90% Accuracy (Landmark-Boosting model): 89.10% | Prediction of ESKD development in CKD patients surviving sepsis |
| Lee et al. [123] | 2022 | Transfer learning with pre-trained neural networks + BoW method + clustering algorithm + RF model | 107,471 histopathology images obtained from 161 biopsy of 57 patients, released by C-PROBE cohort, University of Michigan, MI, USA | 4 (demographic information, and clinical variables) | AUC-ROC: 93% (present), 80% (1 year apart) Accuracy: 90.17% (present), 78.27% (1 year apart) | Prediction of the kidney function and 1-year change based on patients’ eGFR values |
| Lei et al. [99] | 2019 | Log. Reg. model GBM model RF model | 42,615 surgical patients from four academic hospitals, USA | Pre-hospitalization, pre-operative, and peri-operative variables | AUC-ROC (GBM model): 81.70% | Prediction of post-operative AKI in patients undergoing surgery |
| Liu et al. [132] | 2022 | DT model RF model SVM model kNN model Log. Reg. model | 2678 HF patients from MIMIC-IV database, released by BIDMC, Boston, MA, USA | 39 (demographic information, clinical variables, laboratory data, and medications) | AUC-ROC (RF model): 96% | Prediction of AKI occurrence in heart failure patients |
| Liu et al. [109] | 2023 | SVM model Log. Reg. model RF model kNN model LGBM model XGBoost model | 88 post kidney transplantation patients with pneumocystis carinii pneumonia from Renmin Hospital of Wuhan University, Wuhan, China | 5 (demographic data, clinical manifestations upon admission, laboratory results, and past medical history) | AUC-ROC (RF model): 92% | Prediction of severe pneumocystis carinii pneumonia in post kidney-transplant patients |
| Lokuarachchi et al. [117] | 2020 | ANN model (1) CNN model (2) RF model (3) | 609 CKDu patients from Care Research Center of Panadura, Panadura, Sri Lanka | 22 (1) (clinical variables, laboratory data, and risk factors) n.a. (2) n.a. (3) | R2 Score (ANN model): 0.143 Specificity (CNN model): 89.28% n.a. (RF model) | Prediction of CKDu patients considering creatinine level of blood (1), Kidney Disease Quality of Life (KDQOL) score (1), ankle swelling (2), and risk factors influencing creatinine level of blood (3) |
| Lu et al. [113] | 2022 | LSTM model + FNN model | 4839 AKI and non-AKI hospitalized patients with COVID-19 from Montefiore Health System, New York City, NY, USA; and from Stony Brook University Hospital, New York City, NY, USA | 19 (demographic information, clinical variables, laboratory data, and comorbidities) | AUC-ROC: 96.50% Accuracy: 89.57% | Prediction of AKI onset in hospitalized patients with COVID-19 |
| Marechal et al. [94] | 2022 | Combination of two CNN models | 241 samples from patients with healthy kidney tissue from University Hospital of Dijon, Dijon, France; and from the University Hospital of Besancon, Besancon, France | Glomerular density, glomerular volume, vascular luminal stenosis, severity of interstitial fibrosis or tubular atrophy | Accuracy: >90% AUC-ROC: 92% | Prediction of CKD in healthy patients analyzing histological prognostic factors |
| Mathis et al. [105] | 2020 | Combination of two multivariate logistic regression models | 138,021 patients underwent non-cardiac interventions from eight academic and private centers, USA | Demographic information, clinical variables, pre-operative, and operative data | Odds ratio intraoperative hypotension—AKI patients: 2.62 C-index: 73% | Prediction of AKI risk linked to the intraoperative hypotension in patients underwent non-cardiac interventions |
| Moreno-Sànchez [84] | 2023 | RF model Extra Trees model XGBoost model AdaBoost model | 400 records from Apollo Hospitals, Karaikudi, India, released by the ML repository of the University of California, Irvine, CA, USA | 25 (demographic information, clinical variables, and laboratory data) | F1-Score (XGBoost model): 99.40% Accuracy (XGBoost model): 97.50% | Early diagnosis of CKD patients using an explainable model |
| Naser et al. [112] | 2021 | Multivariate logistic regression model | 353 COVID-19 patients from Bahrain Defence Force (BDF) Royal Medical Services, Riffa, Bahrain | Demographic information, laboratory test data, and medical conditions | Odds ratio AKI patients died—no AKI patients: 48.6 | Prognosis of AKI in patients affected by COVID-19 |
| Nasir et al. [72] | 2022 | Transfer learning with pre-trained AlexNet model + SGDM algorithm + ADAM algorithm + RMSPROP algorithm | 3300 data samples images of kidney cancer from the online source Kaggle database, released by Google Limited Liability Company (LLC), Mountain View, CA, USA | Structural and morphological features extracted by the model | Accuracy: 99.20% F1-Score: 99.70% | Early diagnosis of renal cancer patients using a combination of IoT and blockchain technologies for data security |
| Nunez et al. [85] | 2022 | SVM model kNN model NB model | 400 records from the ML repository of the University of California, Irvine, CA, USA + kidney diseases data from the online source Kaggle database, released by Google LLC, Mountain View, CA, USA | 25 (demographic information, clinical variables, and laboratory data) | Accuracy (NB model): 96% | Early diagnosis of CKD patients analyzing relevant risk factors |
| Ogunleye et al. [78] | 2020 | Log. Reg. model LDA model SVM model kNN model XGBoost model | 400 records from the ML repository of the University of California, Irvine, CA, USA | 25 (demographic information, clinical variables, and laboratory data) | Accuracy (XGBoost model): ≃100% AUC-ROC (XGBoost model): ≃100% | Early diagnosis of CKD patients based on their data |
| Ou et al. [142] | 2023 | Log. Reg. model Extra Trees model RF model GBDT model XGBoost model LGBM model | 53,477 diabetic patients from Taipei Veterans General Hospital, Taipei, Taiwan | 78 (demographic information, medications, previous pathologies, and laboratory data) | AUC-ROC (XGBoost model): 95.30% | Prediction of ESKD in newly diagnosed diabetic patients based on their routine data |
| Paquette et al. [106] | 2022 | DeepSurv model DeepHit model RF model RNN model | 180,141 transplant patients from Scientific Registry of Transplant Recipients (SRTR), released by Hennepin Healthcare Research Institute, Minneapolis, MN, USA | 170 (socio-demographic information, previous pathologies, laboratory data, and transplant details) | C-index (DeepHit): 66.10% | Prediction of graft survival probability after kidney transplantation from deceased donors |
| Pareek et al. [69] | 2023 | CNN model | n.a. | 25 (demographic information, laboratory data, and clinical variables) | F1-Score: 96% | Prediction of early stages of CKD based on patients’ data |
| Patel et al. [87] | 2022 | XGBoost model DT model AdaBoost model SVM model kNN model Log. Reg. model RF model NB model | 400 records from the ML repository of the University of California, Irvine, CA, USA | 25 (demographic information, clinical variables, and laboratory data) | F1-Score (RF model, Log. Reg. model): 99% F1-Score (RF model, Log. Reg. Model): 99% | Prediction of CKD based on patients’ data |
| Pati et al. [89] | 2023 | ANN model + Voting technique ANN model + Bagging technique ANN model + Voting technique + Bagging technique | 400 records from Apollo Hospitals, Tamil Nadu, India, released by the ML repository of the University of California, Irvine, CA, USA | 25 (demographic information, clinical variables, and laboratory data) | F1-Score (ANN model + Voting Classifier + Bagging Classifier): 98.80% Accuracy (ANN model + Voting Classifier + Bagging Classifier): 96.67% | Prediction of CKD based on patients’ data |
| Poonia et al. [80] | 2022 | Log. Reg. model + Chi-square algorithm kNN model ANN model SVM model NB model | 400 records from the ML repository of the University of California, Irvine, CA, USA | 24 (demographic information, clinical variables, and laboratory data) | Accuracy (Log. Reg. model): ≃98% F1-Score (Log. Reg. model): ≃98% | Prediction of CKD considering the most relevant patients’ data |
| Priya et al. [83] | 2023 | ANN model SVM model kNN model DT model (all post-processed with the HGSAPSO algorithm) | 400 records from the ML repository of the University of California, Irvine, CA, USA | 25 (demographic information, clinical variables, and laboratory data) | Accuracy (ANN model + HGSAPSO algorithm): 93% | Prediction of CKD based on patients’ data |
| Rabby et al. [74] | 2019 | kNN model SVM model RF model Gaussian NB model AdaBoost model LDA model Log. Reg model DT model GBM model ANN model | 400 records of South Indian patients from the ML repository of the University of California, Irvine, CA, USA | 25 (demographic information, clinical variables, and laboratory data) | Accuracy (DT model, Gaussian NB model): ≃100% F1-Score (DT model, Gaussian NB model): ≃100% | Prediction of CKD based on patients’ data |
| Rady et al. [135] | 2019 | PNN model MLP model SVM model RBFNN model | 361 CKD Indian patients from the ML repository of the University of California, Irvine, CA, USA | 25 (demographic information, clinical variables, and laboratory data) | Accuracy (PNN model): ≃99% F1-Score (PNN model): ≃97% | Prediction of CKD patients and classification in 5 stages based on eGFR values |
| Rajeshwari et al. [81] | 2022 | NB model RF model DT model SVM model | 400 records of 80 CKD and non-CKD Indian patients from unspecified hospital structures in India | 14 (clinical variables, and laboratory data) | F1-Score (RF model): 99% Accuracy (RF model): 98.75% | Prediction of CKD based on patients’ data |
| Rashid et al. [82] | 2022 | Log. Reg. model NB model kNN model SVM model RF model DT model PSO algorithm + ANN model | 189 CKD patients from the ML repository of the University of California, Irvine, CA, USA + online source Kaggle database, released by Google LLC, Mountain View, CA, USA + online source Dataworld database, Austin, TX, USA | 26 (demographic information, laboratory data, and previous pathologies) | Accuracy (PSO algorithm + ANN model): 99.76% | Prediction of CKD considering the most relevant patients’ features |
| Rashidi et al. [97] | 2020 | Log. Reg. model kNN model RF model SVM model DNN model | 50 patients with burns major than 20% of the total body + 51 patients with injuries unrelated to burn trauma, both from the University of California Davis Health Clinic Hospital, Sacramento, CA, USA | 4 (laboratory data) | AUC-ROC (DNN model): 92% Accuracy (DNN model): 92% | Early identification of AKI in burned and non-burned trauma patients |
| Raynaud et al. [107] | 2021 | DISPO model | 13,608 transplant patients from eighteen academic transplant centers in Europe, the United States, and South America | eGFR and proteinuria measurements + clinical, histological, and immunological variables | AUC-ROC: 85.70% | Prediction of renal survival among kidney transplant recipients |
| Revathi et al. [86] | 2023 | ANN model NB model kNN model SVM model DT model Log. Reg. model | 400 records of South Indian patients from the ML repository of the University of California, Irvine, CA, USA | 25 (demographic information, clinical variables, and laboratory data) | F1-Score (ANN model): 96% Accuracy (ANN model): 96% | Prediction of CKD based on patients’ data |
| Schena et al. [116] | 2021 | ANN model (classification model + regressor model) | 1115 IgAN patients from the European Validation Study of the Oxford Classification of IgAN (called “VALIGA”) cohort; from Thessaloniki Renal Unit, Greece; and from six undefined renal units in Europe | 7 (demographic information, clinical variables, laboratory data, disease status, and therapy) | AUC-ROC: 82% (5 years apart), 89% (10 years apart) | Prediction of ESKD and time remaining to its onset in patients with primary IgAN |
| Schmid et al. [101] | 2023 | Undefined ML model | 21,045 ICU patients from Robert Bosch Hospital, Stuttgart, Germany | Demographic information, clinical variables, and laboratory data | 1.80% of AKI cases documented vs. 65.40% automatically detected | Prediction of AKI in post-operative patients |
| Schulz et al. [70] | 2021 | MMDLM model | 230 ccRCC patients from the TCGA database, Germany + 18 patients from the University Medical Center of Mainz, Mainz, Germany | Structural and morphological features extracted by the model | Accuracy: 83.43% AUC-ROC: 91.60% AUC-PR: 94.40% C-index: 81.23% | Prediction of prognosis in ccRCC patients |
| Shabaniyan et al. [139] | 2019 | QDA model kNN model MLP model SVM model (all preceded by SFS + FDA algorithms) | 254 PCNL and CKD patients from Faqihi Hospital, Shiraz, Iran | 26 (demographic information, renal stones characteristics, previous pathologies, and laboratory data) | Accuracy (SFS + FDA algorithms + SVM model): 94.80% | Prediction of post-PCNL treatment outcomes in patients with large kidney stones |
| Song et al. [119] | 2020 | Landmark-Boosting model | 14,039 adult patients with type 2 diabetes from the Healthcare Enterprise Repository for Ontological Narration (HERON) clinical data repository of the University of Kansas, KS, USA | 6624 (visit details, procedures, laboratory test, medications, allergies, diagnoses, alerts, and demographic data) | AUC-ROC: 83% (years 2 since diabetes mellitus onset) AUC-PR: 75% (years 4 since diabetes mellitus onset) | Prediction of CKD among patients with type 2 diabetes |
| Song et al. [125] | 2020 | DS-GBT model | 153,821 hospital admissions from twelve independent health systems of the Greater Plains Collaborative network, USA | 1933 (demographic, clinical, hospital encounter, and outcome variables) | AUC-ROC: ≃81% | Prediction of patients at risk of developing AKI among three possible stages within 48 h of hospital admission |
| Tomašev et al. [133] | 2019 | SRU model | 703,782 hospitalized adult patients from more than 1200 sites at Department of Veterans Affairs (VA), USA | 315 (demographic and admission information, clinical variables, laboratory tests, and diagnoses) | AUC-ROC: 92.10% | Risk prediction of future deterioration in hospitalized adult patients up to 48 h in advance |
| Tran et al. [138] | 2023 | BNN model DL model Log. Reg. model RF model | 534 CKD patients from Photo-Graphe 3 Study, France | 7 (demographic information, previous pathologies, laboratory data, and nutritional status) | AUC-ROC (Log. Reg. model): 76% Accuracy (Log. Reg. model): 81.80% | Prediction of 2-year mortality in end-stages CKD patients |
| Tseng et al. [110] | 2020 | Log. Reg. model SVM model RF model XGBoost model RF model + XGBoost model | 671 patients undergoing cardiac surgery from Far Eastern Memorial Hospital (FEMH), New Taipei City, Taiwan | 94 (demographic information, clinical variables, pre-operative, and intraoperative variables) | AUC-ROC (RF model + XGBoost model): 84.30% | Prediction of mortality in CSA-AKI patients |
| Wang [76] | 2020 | Log. Reg. model DNN model | 400 records of kidney disease patients from undefined hospitals in India | 25 (demographic information, clinical variables, and laboratory data) | F1-Score (DNN model): 95% AUC-ROC (DNN model): 96% | Prediction of CKD based on patients’ data |
| Wessels et al. [120] | 2023 | DINO-ViT model | 709 renal WSIs from the TCGA, USA + University Medical Centre of Mannheim, Mannheim, Germany | Structural and morphological features extracted by the model | Hazard ratio disease survival: 2.31 | Prediction of disease-specific survival in ccRCC patients using histopathological images |
| Xiao et al. [134] | 2019 | ElasticNet model LASSO model Ridge model Log. Reg. model SVM model RF model XGBoost model kNN model NN model | 551 patients with proteinuria from the Department of Nephrology at Huadong Hospital, Shanghai, China, affiliated with Fudan University, Shanghai, China | 18 (demographic information, and laboratory data) | AUC-ROC (Log. Reg. model): 87.30% | Prediction of proteinuria severity and progress in CKD patients |
| Xu et al. [122] | 2020 | kNN model Log. Reg. model RF classifiers DT model | 1117 EHRs of patients with type 2 diabetes from Beijing Pinggu Hospital, Beijing, China | 29 (demographic information, and laboratory data) | Accuracy (RF classifiers): 89.15% F1-Score (RF classifiers): 94% | Early diagnosis of diabetic kidney disease patients and identification of risk groups |
| Yue et al. [98] | 2022 | Log. Reg. model kNN model SVM model DT model RF model XGBoost model ANN model | 3176 patients affected by sepsis from MIMIC-III database, released by BIDMC, Boston, MA, USA | 36 (demographic information, previous pathologies, laboratory data, therapy, and vital signs) | AUC-ROC (XGBoost model): 81.70% Accuracy (XGBoost model): 83.20% F1-Score (XGBoost model): 89.50% | Prediction of AKI development in patients with sepsis |
| Zhang et al. [103] | 2021 | Log. Reg. model SVM model RF model GBM model AdaBoost model | 975 patients underwent liver transplantation from the Third Affiliated Hospital of Sun Yat-sen University-Lingnan Hospital, Guangdong, China | 14 (demographic information, peri-operative variables, donor characteristics, etiology, previous pathologies, and medications) | AUC-ROC (GBM model): 76% F1-Score (GBM model): 73% | Prediction of AKI patients after liver transplantation |
| Zimmerman et al. [128] | 2019 | Multivariate logistic regression model RF model ANN model | 23,950 ICU patients from MIMIC-III database, released by BIDMC, Boston, MA, USA | 22 (demographic information, laboratory data, and vital signs) | AUC-ROC (Multivariate logistic regression model): ≃78% | Prediction of AKI onset in ICU patients within 72 h of hospital admission |
3.2. Machine Learning as a Tool to Detect Kidney Diseases
3.3. Machine Learning as an Assistant Tool for Nephrologists
3.4. Machine Learning as a Tool to Predict Long-Term Complications in Dialysis Patients
3.5. Recent Developments and Emerging Trends in Artificial Intelligence for Nephrology
3.6. Limitations and Challenges of Artificial Intelligence in Clinical Adoption
4. Conclusions and Outlooks
Author Contributions
Funding
Institutional Review Board Statement
Informed Consent Statement
Data Availability Statement
Acknowledgments
Conflicts of Interest
Abbreviations
| ACO | Ant Colony-based Optimization |
| ACR | Albumin-to-Creatinine Ratio |
| AdaBoost | Adaptive Boosting |
| ADAM | ADAptive Moment estimation |
| ADR | ADRamycin |
| AHDCNN | Adaptive Hybridized Deep Convolutional Neural Network |
| AI | Artificial Intelligence |
| AISACS | Artificial Intelligence Supported Anemia Control System |
| AKI | Acute Kidney Injury |
| AlexNet | Alex Network |
| ANN | Artificial Neural Network |
| AP | Average Precision |
| APC | Atherosclerotic Plaque Characteristics |
| AUC-PR | Area Under the Precision-Recall Curve |
| AUC-ROC | Area Under the Receiver Operating Characteristic Curve |
| AUSCAD | AUStralian Chronic Allograft Dysfunction |
| AVF | ArterioVenous Fistula |
| bCO | binary COvariance |
| BDF | Bahrain Defence Force |
| BES | Beijing Eye Study |
| BIDMC | Beth Israel Deaconess Medical Center |
| BINCM | BINary Classifier Model |
| BiT-M | Big Transfer-Medium |
| BiT-S | Big Transfer-Small |
| BNN | Bayesian Neural Network |
| BoW | Bag-of-Words |
| CART | Classification And Regression Tree |
| CatBoost | Categorical Boosting |
| CC-FII | China Consortium of Fundus Image Investigation |
| ccRCC | clear-cell Renal-Cell Carcinoma |
| CCT | Contrast-enhanced Computed Tomography |
| CCTA | Coronary Computed Tomography Angiography |
| ChatGPT | Chat Generative Pre-trained Transformer |
| C-index | Concordance index |
| CIT | Conditional Inference Tree |
| CKD | Chronic Kidney Disease |
| CKDu | Chronic Kidney Disease of unknown etiology |
| CNN | Convolutional Neural Network |
| COCO | Common Objects in COntext |
| Col4a3 KO | Collagen Type IV Alpha 3 Chain Knock-Out |
| CondenseNet | Condensed Network |
| CORN | Consistent Ordinal Regression Network |
| CPTAC | Clinical Proteomic Tumor Analysis Consortium |
| CSA-AKI | Cardiac Surgery-Associated Acute Kidney Injury |
| CT | Computational Tomography |
| DCDLT | Donation after Cardiac Death Liver Transplantation |
| DDLT | Deceased-Donor Liver Transplantation |
| DEMATEL | Decision Making Trial And Evaluation Laboratory |
| DenseNet | Dense Network |
| DETO | Department of Emergency and Organ Transplantations |
| DFS | Density-based Feature Selection |
| DINO-ViT | DIstillation with NO labels-Vision Transformer |
| DISPO | Dynamic Integrative System for Predicting Outcome |
| DL | Deep Learning |
| DNN | Deep Neural Network |
| DPCNN | Dual-Path Convolutional Neural Network |
| DS-GBT | Deep Support-Gradient Boosting Trees |
| DT | Decision Tree |
| ECG | ElectroCardioGram |
| eGFR | estimated Glomerular Filtration Rate |
| EHR | Electronic Health Record |
| eICU | electronic Intensive Care Unit |
| EM | Electron Microscopy |
| EMT | Extended Maxima Transform |
| eqU | equilibrated post-dialysis blood Urea |
| ESKD | End-Stage Kidney Disease |
| EuCliD | European Clinical Database |
| Extra Trees | Extremely Randomized Trees |
| FCDR | False Clustering Discovery Reduction |
| FDA | Fisher Discriminant Analysis |
| FEMH | Far Eastern Memorial Hospital |
| FISS | Focal Instance Structural Similarity |
| FMC | Fresenius Medical Care |
| FN | False Negative |
| FNN | Feedforward Neural Network |
| FP | False Positive |
| FPR | False Positive Rate |
| GAM | Generalised Additive Model |
| GAN | Generative Adversarial Network |
| GBDT | Gradient Boosting Decision Tree |
| GBM | Gradient Boosting Machine |
| GCKD | German Chronic Kidney Disease |
| GGS | Global GlomeruloSclerosis |
| GMM | Gaussian Mixture Model |
| GoCAR | Genomics of Chronic Allograft Rejection |
| Grad-CAM | Gradient-weighted Class Activation Mapping |
| GRNN | Generalised Regression Neural Network |
| GRU | Gated Recurrent Unit |
| GSA | Gravitational Search Algorithm |
| HD | HemoDialysis |
| HDF | HemoDiaFiltration |
| HERON | Healthcare Enterprise Repository for Ontological Narration |
| HF | HemoFiltration |
| HGSAPSO | Hybrid Gravitational Search Algorithm and Particle Swarm Optimization |
| HIS | Hospital Information System |
| HQMS | Hospital Quality Monitoring System |
| ICU | Intensive Care Unit |
| IDEA | Intraoperative and Data Embedded Analytics |
| IDH | IntraDialytic Hypotension |
| IDS | Intelligent Dosing System |
| IFTA | Interstitial Fibrosis and Tubular Atrophy |
| IgAN | Immunoglobulin A Nephropathy |
| InceptionNet | Inception Network |
| InceptionResNet-v2 | Inception-Residual Network version 2 |
| IoT | Internet of Things |
| JSDT | Japanese Society for Dialysis Therapy |
| KD | Kidney Disease |
| KDQOL | Kidney Disease Quality Of Life |
| KELM | Kernel Extreme Learning Machine |
| KFRE | Kidney Failure Risk Equation |
| KH | Kitano Hospital |
| kNN | k-Nearest Neighbors |
| LASSO | Least Absolute Shrinkage and Selection Operator |
| LDA | Linear Discriminant Analysis |
| LGBM | Light Gradient Boosting Machine |
| LIME | Local Interpretable Model-agnostic Explanations |
| LLC | Limited Liability Company |
| LLM | Large Language Model |
| Log. Reg. | Logistic Regression |
| LogitBoost | Logistic Boosting |
| LR | Linear Regression |
| LSTM | Long Short Term Memory |
| LUS | Lung UltraSound |
| MAE | Mean Absolute Error |
| MANet | Multiple-Attention Network |
| mAP | mean Average Precision |
| Mask R-CNN | Mask Region-based Convolutional Neural Network |
| MCC | Matthews Correlation Coefficient |
| MCD | Minimal Change Disease |
| MHD | Maintenance HemoDialysis |
| MIL | Multiple Instance Learning |
| MIMIC-III/IV | Medical Information Mart for Intensive Care III/IV |
| ML | Machine Learning |
| MLP | MultiLayer Perceptron |
| MMDLM | MultiModal Deep Learning Model |
| MN | Membranous Nephropathy |
| MN-Net | Membranous Nephropathy Network |
| MRI | Magnetic Resonance Image |
| MSE | Mean Squared Error |
| NASNet | Neural Architecture Search Network |
| NB | Naive Bayes |
| NCCT | Non-Contrast Computed Tomography |
| NHANES | National Health And Nutrition Examination Survey |
| NHISS | National Health Insurance Sharing Service |
| NHS | National Health Service |
| NIH | National Institutes of Health |
| NLP | Natural Language Processing |
| NMR | Nuclear Magnetic Resonance |
| NN | Neural Network |
| OPTN | Organ Procurement and Transplantation Network |
| PACS | Picture Archiving and Communication System |
| PCNL | PerCutaneous NephroLithotomy |
| p-LOS | prolonged Length Of Stay |
| PNN | Probabilistic Neural Network |
| post-EVAR | post-EndoVascular Aneurysm Repair |
| PSO | Particle Swarm Optimization |
| QDA | Quadratic Discriminant Analysis |
| RBFNN | Radial Basis Function Neural Network |
| RDLCDC | Robust Deep Learning-based Clinical Data Classification |
| REPTree | Reduced Error Pruning Tree |
| Re-RX | Recursive Rule eXtraction |
| ResNet | Residual Network |
| RF | Random Forest |
| RMDS | Renal Mass Diagnostic System |
| RMSE | Root Mean Squared Error |
| RMSPROP | Root Mean Square PROPagation |
| RNN | Recurrent Neural Network |
| RWTH | Rheinisch-Westfälische Technische Hochschule |
| SACNN | Self-Attention Convolutional Neural Network |
| SB | Surface-Based |
| SEED | Singapore Epidemiology of Eye Diseases |
| Seq2Seq | Sequence-To-Sequence |
| SFS | Sequential Forward Selection |
| SGDM | Stochastic Gradient Descent with Momentum |
| SHAP | SHapley Additive exPlanations |
| SimpleRNN | Simple Recurrent Neural Network |
| SOA | Season Optimization Algorithm |
| SP2 | Singapore Prospective Study Program |
| SqueezeNet | Squeeze Network |
| SRI | Solute Removal Index |
| SRTR | Scientific Registry of Transplant Recipients |
| SRU | Simple Recurrent Unit |
| SSA | Slice Scanning Algorithm |
| SSD | Single Shot Detector |
| SSO | Sparrow Search Optimization |
| SVM | Support Vector Machine |
| TAN | Tree Augmented Naive |
| TCGA | The Cancer Genome Atlas |
| TN | True Negative |
| TP | True Positive |
| TPR | True Positive Rate |
| UAAN | Uncertainty-Aided Apportionment Network |
| U-Net | U-Network |
| UNETR | U-NEt TRansformer |
| US | UltraSound |
| UTH | University of Tokyo Hospital |
| VA | Veterans Affairs |
| VAE | Variational AutoEncoder |
| VB-MrFo-Net | V Bottleneck Multi-resolution and Focus-organ Network |
| VGG-16/19 | Visual Geometry Group 16/19 |
| VGH | Veterans General Hospital |
| VIT | Vellore Institute of Technology |
| ViT | Vision Transformer |
| WOA | Whale Optimization Algorithm |
| WSI | Whole-Slide Image |
| WVR | Watson Visual Recognition |
| XAI | eXplainable AI |
| XGBoost | eXtreme Gradient Boosting |
References
- Chen, J.; Remulla, D.; Nguyen, J.H.; Dua, A.; Liu, Y.; Dasgupta, P.; Hung, A.J. Current Status of Artificial Intelligence Applications in Urology and Their Potential to Influence Clinical Practice. BJU Int. 2019, 124, 567–577. [Google Scholar] [CrossRef] [PubMed]
- Russell, S.J.; Norvig, P. Artificial Intelligence: A Modern Approach, 4th Global ed.; Prentice Hall series in artificial intelligence; Pearson: Boston, MA, USA, 2022; ISBN 978-1-292-40113-3. [Google Scholar]
- Montesinos López, O.A.; Montesinos López, A.; Crossa, J. (Eds.) Fundamentals of Artificial Neural Networks and Deep Learning. In Multivariate Statistical Machine Learning Methods for Genomic Prediction; Springer International Publishing: Cham, Switzerland, 2022; pp. 379–425. ISBN 978-3-030-89010-0. [Google Scholar]
- Magris, M.; Iosifidis, A. Bayesian Learning for Neural Networks: An Algorithmic Survey. Artif. Intell. Rev. 2023, 56, 11773–11823. [Google Scholar] [CrossRef]
- Mori, F.; Tsuji, H. A System for Decision Support without Explicit Objective Functions. Omega 1983, 11, 567–574. [Google Scholar] [CrossRef]
- Okajima, M.; Stark, L.; Whipple, G.; Yasui, S. Computer Pattern Recognition Techniques: Some Results with Real Electrocardiographic Data. IRE Trans. Bio-Med. Electron. 1963, 10, 106–114. [Google Scholar] [CrossRef]
- Gagliardo, E. An Example of a Test for Adaptive Techniques in a Medical Investigation. Comput. Biol. Med. 1975, 5, 97–104. [Google Scholar] [CrossRef]
- Davis, R.; Buchanan, B.; Shortliffe, E. Production Rules as a Representation for a Knowledge-Based Consultation Program. Artif. Intell. 1977, 8, 15–45. [Google Scholar] [CrossRef]
- Heppner, G.H.; Stolbach, L.; Byrne, M.; Cummings, F.J.; McDonough, E.; Calabresi, P. Cell-Mediated and Serum Blocking Reactivity to Tumor Antigens in Patients with Malignant Melanoma. Int. J. Cancer 1973, 11, 245–260. [Google Scholar] [CrossRef]
- Pauker, S.G.; Gorry, G.A.; Kassirer, J.P.; Schwartz, W.B. Towards the Simulation of Clinical Cognition: Taking a Present Illness by Computer. Am. J. Med. 1976, 60, 981–996. [Google Scholar] [CrossRef]
- Chen, T.K.; Knicely, D.H.; Grams, M.E. Chronic Kidney Disease Diagnosis and Management. JAMA 2019, 322, 1294–1304. [Google Scholar] [CrossRef]
- Ram, E.; Beckerman, P.; Segev, A.; Shlomo, N.; Atlas-Lazar, A.; Sternik, L.; Raanani, E. The Predictive Value of Creatinine Clearance for Mortality in Patients Undergoing Revascularization. J. Cardiothorac. Surg. 2021, 16, 120. [Google Scholar] [CrossRef] [PubMed]
- Kovesdy, C.P. Epidemiology of Chronic Kidney Disease: An Update 2022. Kidney Int. Suppl. 2022, 12, 7–11. [Google Scholar] [CrossRef] [PubMed]
- He, L.; Wei, Q.; Liu, J.; Yi, M.; Liu, Y.; Liu, H.; Sun, L.; Peng, Y.; Liu, F.; Venkatachalam, M.A.; et al. AKI on CKD: Heightened Injury, Suppressed Repair, and the Underlying Mechanisms. Kidney Int. 2017, 92, 1071–1083. [Google Scholar] [CrossRef] [PubMed]
- Cancilla, N.; Gurreri, L.; Marotta, G.; Ciofalo, M.; Cipollina, A.; Tamburini, A.; Micale, G. Performance Comparison of Alternative Hollow-Fiber Modules for Hemodialysis by Means of a CFD-Based Model. Membranes 2022, 12, 118. [Google Scholar] [CrossRef] [PubMed]
- Ledebo, I. Principles and Practice of Hemofiltration and Hemodiafiltration. Artif. Organs 1998, 22, 20–25. [Google Scholar] [CrossRef] [PubMed]
- Teitelbaum, I.; Burkart, J. Peritoneal Dialysis. Am. J. Kidney Dis. 2003, 42, 1082–1096. [Google Scholar] [CrossRef]
- Gan, L.; Razdan, R.; Xu, Y.-Q.; Tsai, J.J.-P. RENPAD: An Expert System for Preliminary Diagnosis of Primary Renal Disease. In WESTEX-87; IEEE: New York, NY, USA, 1987; pp. 231–237. [Google Scholar]
- Agar, J.W.M.; Webb, G.I. Application of Machine Learning to a Renal Biopsy Database. Nephrol. Dial. Transplant. 1992, 7, 472–478. [Google Scholar] [CrossRef]
- Chang, P.L.; Li, Y.C.; Wu, C.J.; Huang, M.H. Using ILIAD System Shell to Create an Expert System for Differential Diagnosis of Renal Masses. J. Med. Syst. 1993, 17, 289–297. [Google Scholar] [CrossRef]
- McMichael, J.; Lieberman, R.; Doyle, H.; McCauley, J.; Fung, J.; Starzl, T.E. An Intelligent and Cost-Effective Computer Dosing System for Individualizing FK506 Therapy in Transplantation and Autoimmune Disorders. J. Clin. Pharmacol. 1993, 33, 599–605. [Google Scholar] [CrossRef]
- Hapgood, W. Using Knowledge Base Systems in Healthcare. Healthc. Inform. Bus. Mag. Inf. Commun. Syst. 1991, 8, 37–38, 41. [Google Scholar]
- Akl, A.I.; Sobh, M.A.; Enab, Y.M.; Tattersall, J. Artificial Intelligence: A New Approach for Prescription and Monitoring of Hemodialysis Therapy. Am. J. Kidney Dis. 2001, 38, 1277–1283. [Google Scholar] [CrossRef]
- Fernández, E.A.; Valtuille, R.; Willshaw, P.; Perazzo, C.A. Using Artificial Intelligence to Predict the Equilibrated Postdialysis Blood Urea Concentration. Blood Purif. 2001, 19, 271–285. [Google Scholar] [CrossRef]
- Ray, M.; Qidwai, U. Artificial Intelligence Approach to Determine Minimum Dose of Haemodialysis. Int. Jt. Conf. Neural Netw. 2003, 1, 137–142. [Google Scholar] [CrossRef]
- Hussain, M.A.; Hamarneh, G.; O’Connell, T.W.; Mohammed, M.F.; Abugharbieh, R. Segmentation-Free Estimation of Kidney Volumes in CT with Dual Regression Forests. In Machine Learning in Medical Imaging; Springer: Berlin/Heidelberg, Germany, 2016; pp. 156–163. [Google Scholar] [CrossRef]
- Norouzi, J.; Yadollahpour, A.; Mirbagheri, S.A.; Mazdeh, M.M.; Hosseini, S.A. Predicting Renal Failure Progression in Chronic Kidney Disease Using Integrated Intelligent Fuzzy Expert System. Comput. Math. Methods Med. 2016, 2016, 6080814. [Google Scholar] [CrossRef]
- Niel, O.; Bastard, P.; Boussard, C.; Hogan, J.; Kwon, T.; Deschênes, G. Artificial Intelligence Outperforms Experienced Nephrologists to Assess Dry Weight in Pediatric Patients on Chronic Hemodialysis. Pediatr. Nephrol. 2018, 33, 1799–1803. [Google Scholar] [CrossRef]
- Nassif, A.B.; Shahin, I.; Attili, I.; Azzeh, M.; Shaalan, K. Speech Recognition Using Deep Neural Networks: A Systematic Review. IEEE Access 2019, 7, 19143–19165. [Google Scholar] [CrossRef]
- Taye, M.M. Understanding of Machine Learning with Deep Learning: Architectures, Workflow, Applications and Future Directions. Computers 2023, 12, 91. [Google Scholar] [CrossRef]
- 1. Supervised Learning. Available online: https://scikit-learn.org/stable/supervised_learning.html (accessed on 26 September 2025).
- 1.9. Naive Bayes. Available online: https://scikit-learn.org/stable/modules/naive_bayes.html (accessed on 26 September 2025).
- Berkson, J. Bayes’ Theorem. Ann. Math. Stat. 1930, 1, 42–56. [Google Scholar] [CrossRef]
- 1.1. Linear Models. Available online: https://scikit-learn.org/stable/modules/linear_model.html (accessed on 26 September 2025).
- Friedman, J.; Hastie, T.; Tibshirani, R. Additive Logistic Regression: A Statistical View of Boosting (With Discussion and a Rejoinder by the Authors). Ann. Stat. 2000, 28, 337–407. [Google Scholar] [CrossRef]
- 1.2. Linear and Quadratic Discriminant Analysis. Available online: https://scikit-learn.org/stable/modules/lda_qda.html (accessed on 26 September 2025).
- James, G.; Witten, D.; Hastie, T.; Tibshirani, R.; Taylor, J. Linear Regression. In An Introduction to Statistical Learning: With Applications in Python; James, G., Witten, D., Hastie, T., Tibshirani, R., Taylor, J., Eds.; Springer International Publishing: Cham, Switzerland, 2023; pp. 69–134. ISBN 978-3-031-38747-0. [Google Scholar]
- 1.4. Support Vector Machines. Available online: https://scikit-learn.org/stable/modules/svm.html (accessed on 26 September 2025).
- 1.10. Decision Trees. Available online: https://scikit-learn.org/stable/modules/tree.html (accessed on 26 September 2025).
- 1.11. Ensembles: Gradient Boosting, Random Forests, Bagging, Voting, Stacking. Available online: https://scikit-learn.org/stable/modules/ensemble.html (accessed on 26 September 2025).
- ExtraTreeClassifier. Available online: https://scikit-learn.org/stable/modules/generated/sklearn.tree.ExtraTreeClassifier.html (accessed on 26 September 2025).
- Rodriguez, J.J.; Kuncheva, L.I.; Alonso, C.J. Rotation Forest: A New Classifier Ensemble Method. IEEE Trans. Pattern Anal. Mach. Intell. 2006, 28, 1619–1630. [Google Scholar] [CrossRef]
- Boldini, D.; Grisoni, F.; Kuhn, D.; Friedrich, L.; Sieber, S.A. Practical Guidelines for the Use of Gradient Boosting for Molecular Property Prediction. J. Cheminform. 2023, 15, 73. [Google Scholar] [CrossRef]
- Sarker, I.H. Deep Learning: A Comprehensive Overview on Techniques, Taxonomy, Applications and Research Directions. SN Comput. Sci. 2021, 2, 420. [Google Scholar] [CrossRef] [PubMed]
- Vaswani, A.; Shazeer, N.; Parmar, N.; Uszkoreit, J.; Jones, L.; Gomez, A.N.; Kaiser, Ł.; Polosukhin, I. Attention Is All You Need. In Advances in Neural Information Processing Systems; Curran Associates, Inc.: Red Hook, NY, USA, 2017; Volume 30. [Google Scholar]
- Lin, T.; Wang, Y.; Liu, X.; Qiu, X. A Survey of Transformers. AI Open 2022, 3, 111–132. [Google Scholar] [CrossRef]
- Elgendy, M. Deep Learning for Vision Systems; Simon and Schuster: New York, NY, USA, 2020; ISBN 978-1-61729-619-2. [Google Scholar]
- Krizhevsky, A.; Sutskever, I.; Hinton, G.E. ImageNet Classification with Deep Convolutional Neural Networks. In Advances in Neural Information Processing Systems; Curran Associates, Inc.: Red Hook, NY, USA, 2012; Volume 25. [Google Scholar]
- Fine, T.L. Feedforward Neural Network Methodology; Springer: New York, NY, USA, 1999; ISBN 978-0-387-98745-3. [Google Scholar] [CrossRef]
- Salem, F.M. Recurrent Neural Networks: From Simple to Gated Architectures; Springer Nature: Berlin/Heidelberg, Germany, 2022; ISBN 978-3-030-89929-5. [Google Scholar] [CrossRef]
- Wang, C.; Zhang, S.; Ma, T.; Xiao, Y.; Chen, M.Z.; Wang, L. Swarm Intelligence: A Survey of Model Classification and Applications. Chin. J. Aeronaut. 2025, 38, 102982. [Google Scholar] [CrossRef]
- Liu, F.; Zheng, H.; Ma, S.; Zhang, W.; Liu, X.; Chua, Y.; Shi, L.; Zhao, R. Advancing Brain-Inspired Computing with Hybrid Neural Networks. Natl. Sci. Rev. 2024, 11, nwae066. [Google Scholar] [CrossRef]
- Ashraf, M.; Abid, F.; Din, I.U.; Rasheed, J.; Yesiltepe, M.; Yeo, S.F.; Ersoy, M.T. A Hybrid CNN and RNN Variant Model for Music Classification. Appl. Sci. 2023, 13, 1476. [Google Scholar] [CrossRef]
- Gurusubramani, S.; Latha, B. Enhancing Cardiac Diagnostics through Semantic-Driven Image Synthesis: A Hybrid GAN Approach. Neural Comput. Appl. 2024, 36, 8181–8197. [Google Scholar] [CrossRef]
- Miller, C.; Portlock, T.; Nyaga, D.M.; O’Sullivan, J.M. A Review of Model Evaluation Metrics for Machine Learning in Genetics and Genomics. Front. Bioinform. 2024, 4, 1457619. [Google Scholar] [CrossRef]
- Singh, P.; Goyal, L.; Mallick, D.C.; Surani, S.R.; Kaushik, N.; Chandramohan, D.; Simhadri, P.K. Artificial Intelligence in Nephrology: Clinical Applications and Challenges. Kidney Med. 2025, 7, 100927. [Google Scholar] [CrossRef]
- Iliyas, I.I.; Boukari, S.; Gital, A.Y. Recent Trends in Prediction of Chronic Kidney Disease Using Different Learning Approaches: A Systematic Literature Review. J. Med. Artif. Intell. 2025, 8, 62. [Google Scholar] [CrossRef]
- Cama-Olivares, A.; Braun, C.; Takeuchi, T.; O’Hagan, E.C.; Kaiser, K.A.; Ghazi, L.; Chen, J.; Forni, L.G.; Kane-Gill, S.L.; Ostermann, M.; et al. Systematic Review and Meta-Analysis of Machine Learning Models for Acute Kidney Injury Risk Classification. J. Am. Soc. Nephrol. 2024, 10-1681. [Google Scholar] [CrossRef]
- Rehman, A.U.; Neyra, J.A.; Chen, J.; Ghazi, L. Machine Learning Models for Acute Kidney Injury Prediction and Management: A Scoping Review of Externally Validated Studies. Crit. Rev. Clin. Lab. Sci. 2025, 62, 454–476. [Google Scholar] [CrossRef]
- Li, C.; Liu, J.; Fu, P.; Zou, J. Artificial Intelligence Models in Diagnosis and Treatment of Kidney Diseases: Current Status and Prospects. Kidney Dis. 2025, 11, 501–517. [Google Scholar] [CrossRef]
- Ghosh, S.K.; Khandoker, A.H. Investigation on Explainable Machine Learning Models to Predict Chronic Kidney Diseases. Sci. Rep. 2024, 14, 3687. [Google Scholar] [CrossRef]
- Li, X.; Wang, P.; Zhu, Y.; Zhao, W.; Pan, H.; Wang, D. Interpretable Machine Learning Model for Predicting Acute Kidney Injury in Critically Ill Patients. BMC Med. Inform. Decis. Mak. 2024, 24, 148. [Google Scholar] [CrossRef]
- Gao, Y.; Wang, C.; Dong, W.; Li, B.; Wang, J.; Li, J.; Tian, Y.; Liu, J.; Wang, Y. An Explainable Machine Learning Model to Predict Acute Kidney Injury After Cardiac Surgery: A Retrospective Cohort Study. Clin. Epidemiol. 2023, 15, 1145–1157. [Google Scholar] [CrossRef] [PubMed]
- Lv, J.-C.; Zhang, L.-X. Prevalence and Disease Burden of Chronic Kidney Disease. Adv. Exp. Med. Biol. 2019, 1165, 3–15. [Google Scholar] [CrossRef]
- Ferro, C.J.; Wanner, C.; Luyckx, V.; Fontana, M.; Gallego, D.; Vanholder, R.; Torra, R.; Ortiz, A. A Call for Urgent Action on Chronic Kidney Disease across Europe. Lancet Reg. Health-Eur. 2025, 54, 101347. [Google Scholar] [CrossRef]
- Kister, T.S.; Remmler, J.; Schmidt, M.; Federbusch, M.; Eckelt, F.; Isermann, B.; Richter, H.; Wehner, M.; Krause, U.; Halbritter, J.; et al. Acute Kidney Injury and Its Progression in Hospitalized Patients—Results from a Retrospective Multicentre Cohort Study with a Digital Decision Support System. PLoS ONE 2021, 16, e0254608. [Google Scholar] [CrossRef] [PubMed]
- Elhoseny, M.; Shankar, K.; Uthayakumar, J. Intelligent Diagnostic Prediction and Classification System for Chronic Kidney Disease. Sci. Rep. 2019, 9, 9583. [Google Scholar] [CrossRef]
- Arumugham, V.; Sankaralingam, B.P.; Jayachandran, U.M.; Krishna, K.V.S.S.R.; Sundarraj, S.; Mohammed, M. An Explainable Deep Learning Model for Prediction of Early-Stage Chronic Kidney Disease. Comput. Intell. 2023, 39, 1022–1038. [Google Scholar] [CrossRef]
- Pareek, N.K.; Soni, D.; Degadwala, S. Early Stage Chronic Kidney Disease Prediction Using Convolution Neural Network. In Proceedings of the 2023 2nd International Conference on Applied Artificial Intelligence and Computing (ICAAIC), Salem, India, 4–6 May 2023; pp. 16–20. [Google Scholar] [CrossRef]
- Schulz, S.; Woerl, A.-C.; Jungmann, F.; Glasner, C.; Stenzel, P.; Strobl, S.; Fernandez, A.; Wagner, D.-C.; Haferkamp, A.; Mildenberger, P.; et al. Multimodal Deep Learning for Prognosis Prediction in Renal Cancer. Front. Oncol. 2021, 11, 788740. [Google Scholar] [CrossRef]
- Chen, S.; Song, D.; Chen, L.; Guo, T.; Jiang, B.; Liu, A.; Pan, X.; Wang, T.; Tang, H.; Chen, G.; et al. Artificial Intelligence-Based Non-Invasive Tumor Segmentation, Grade Stratification and Prognosis Prediction for Clear-Cell Renal-Cell Carcinoma. Precis. Clin. Med. 2023, 6, pbad019. [Google Scholar] [CrossRef]
- Nasir, M.U.; Zubair, M.; Ghazal, T.M.; Khan, M.F.; Ahmad, M.; Rahman, A.-U.; Hamadi, H.A.; Khan, M.A.; Mansoor, W. Kidney Cancer Prediction Empowered with Blockchain Security Using Transfer Learning. Sensors 2022, 22, 7483. [Google Scholar] [CrossRef]
- Chen, G.; Ding, C.; Li, Y.; Hu, X.; Li, X.; Ren, L.; Ding, X.; Tian, P.; Xue, W. Prediction of Chronic Kidney Disease Using Adaptive Hybridized Deep Convolutional Neural Network on the Internet of Medical Things Platform. IEEE Access 2020, 8, 100497–100508. [Google Scholar] [CrossRef]
- Rabby, A.K.M.S.A.; Mamata, R.; Laboni, M.A.; Ohidujjaman; Abujar, S. Machine Learning Applied to Kidney Disease Prediction: Comparison Study. In Proceedings of the 2019 10th International Conference on Computing, Communication and Networking Technologies (ICCCNT), Kanpur, India, 6–8 July 2019; pp. 1–7. [Google Scholar] [CrossRef]
- Arif-Ul-Islam; Ripon, S.H. Rule Induction and Prediction of Chronic Kidney Disease Using Boosting Classifiers, Ant-Miner and J48 Decision Tree. In Proceedings of the 2019 International Conference on Electrical, Computer and Communication Engineering (ECCE), Cox’s Bazar, Bangladesh, 7–9 February 2019; pp. 1–6. [Google Scholar] [CrossRef]
- Wang, B. Kidney Disease Diagnosis Based on Machine Learning. In Proceedings of the 2020 International Conference on Computing and Data Science (CDS), Stanford, CA, USA, 1–2 August 2020; pp. 307–310. [Google Scholar] [CrossRef]
- Almansour, N.A.; Syed, H.F.; Khayat, N.R.; Altheeb, R.K.; Juri, R.E.; Alhiyafi, J.; Alrashed, S.; Olatunji, S.O. Neural Network and Support Vector Machine for the Prediction of Chronic Kidney Disease: A Comparative Study. Comput. Biol. Med. 2019, 109, 101–111. [Google Scholar] [CrossRef] [PubMed]
- Ogunleye, A.; Wang, Q.-G. XGBoost Model for Chronic Kidney Disease Diagnosis. IEEE/ACM Trans. Comput. Biol. Bioinform. 2020, 17, 2131–2140. [Google Scholar] [CrossRef]
- Akter, S.; Habib, A.; Islam, A.; Hossen, S.; Fahim, W.A.; Sarkar, P.R.; Ahmed, M. Comprehensive Performance Assessment of Deep Learning Models in Early Prediction and Risk Identification of Chronic Kidney Disease. IEEE Access 2021, 9, 165184–165206. [Google Scholar] [CrossRef]
- Poonia, R.C.; Gupta, M.K.; Abunadi, I.; Albraikan, A.A.; Al-Wesabi, F.N.; Hamza, M.A.; B, T. Intelligent Diagnostic Prediction and Classification Models for Detection of Kidney Disease. Healthcare 2022, 10, 371. [Google Scholar] [CrossRef]
- Rajeshwari; Yogish, H.K. Prediction of Chronic Kidney Disease Using Machine Learning Technique. In Proceedings of the 2022 Fourth International Conference on Cognitive Computing and Information Processing (CCIP), Bengaluru, India, 23–24 December 2022; pp. 1–6. [Google Scholar] [CrossRef]
- Rashid, J.; Batool, S.; Kim, J.; Wasif Nisar, M.; Hussain, A.; Juneja, S.; Kushwaha, R. An Augmented Artificial Intelligence Approach for Chronic Diseases Prediction. Front. Public Health 2022, 10, 860396. [Google Scholar] [CrossRef] [PubMed]
- Priya, S.; Saranya, N. An Intelligent Approach for Accurate Prediction of Chronic Diseases. CSSE 2023, 46, 2571–2587. [Google Scholar] [CrossRef]
- Moreno-Sánchez, P.A. Data-Driven Early Diagnosis of Chronic Kidney Disease: Development and Evaluation of an Explainable AI Model. IEEE Access 2023, 11, 38359–38369. [Google Scholar] [CrossRef]
- Nunez, I.; Navarro, N.; Saldana Barrios, J. First Experiences in the Process of Developing a Low-Cost Machine Learning Prototype Model Using an Open Access Dataset of Chronic Kidney Diseases—A Case of Study. In Proceedings of the International Conference on Ubiquitous Computing & Ambient Intelligence (UCAmI 2022), Córdoba, Spain, 29 November–2 December 2022; pp. 181–188, ISBN 978-3-031-21332-8. [Google Scholar]
- Revathi, M.; Raghuraman, G.; Visumathi, J. Performance Analysis of Machine Learning Algorithms in the Systematic Prediction of Chronic Kidney Disease on an Imbalanced Dataset. In Inventive Computation and Information Technologies; Smys, S., Kamel, K.A., Palanisamy, R., Eds.; Springer Nature: Singapore, 2023; pp. 149–168. [Google Scholar] [CrossRef]
- Patel, S.; Patel, R.; Ganatra, N.; Khant, S.; Patel, A. An Experimental Study and Performance Analysis of Supervised Machine Learning Algorithms for Prognosis of Chronic Kidney Disease. In Proceedings of the 2022 First International Conference on Electrical, Electronics, Information and Communication Technologies (ICEEICT), Trichy, India, 16–18 February 2022; pp. 1–6. [Google Scholar]
- Bandera, N.H.; Arizaga, J.M.M.; Reyes, E.R. Assessment and Prediction of Chronic Kidney Using an Improved Neutrosophic Artificial Intelligence Model. Int. J. Neutrosophic Sci. 2023, 21, 174–183. [Google Scholar] [CrossRef]
- Pati, A.; Parhi, M.; Pattanayak, B.K. An Ensemble Deep Learning Approach for Chronic Kidney Disease (CKD) Prediction. AIP Conf. Proc. 2023, 2819, 030002. [Google Scholar] [CrossRef]
- Lakshmanaprabu, S.K.; Mohanty, S.N.; Sheeba, R.S.; Krishnamoorthy, S.; Uthayakumar, J.; Shankar, K. Online Clinical Decision Support System Using Optimal Deep Neural Networks. Appl. Soft Comput. 2019, 81, 105487. [Google Scholar] [CrossRef]
- Hamedan, F.; Orooji, A.; Sanadgol, H.; Sheikhtaheri, A. Clinical Decision Support System to Predict Chronic Kidney Disease: A Fuzzy Expert System Approach. Int. J. Med. Inform. 2020, 138, 104134. [Google Scholar] [CrossRef]
- Arulanthu, P.; Perumal, E. An Intelligent IoT with Cloud Centric Medical Decision Support System for Chronic Kidney Disease Prediction. Int. J. Imaging Syst. Technol. 2020, 30, 815–827. [Google Scholar] [CrossRef]
- Kanda, E.; Kanno, Y.; Katsukawa, F. Identifying Progressive CKD from Healthy Population Using Bayesian Network and Artificial Intelligence: A Worksite-Based Cohort Study. Sci. Rep. 2019, 9, 5082. [Google Scholar] [CrossRef] [PubMed]
- Marechal, E.; Jaugey, A.; Tarris, G.; Paindavoine, M.; Seibel, J.; Martin, L.; Funes de la Vega, M.; Crepin, T.; Ducloux, D.; Zanetta, G.; et al. Automatic Evaluation of Histological Prognostic Factors Using Two Consecutive Convolutional Neural Networks on Kidney Samples. Clin. J. Am. Soc. Nephrol. 2022, 17, 260–270. [Google Scholar] [CrossRef]
- Bell, S.; James, M.T.; Farmer, C.K.T.; Tan, Z.; de Souza, N.; Witham, M.D. Development and External Validation of an Acute Kidney Injury Risk Score for Use in the General Population. Clin. Kidney J. 2020, 13, 402–412. [Google Scholar] [CrossRef]
- Bermudez-Lopez, M.; Forne, C.; Amigo, N.; Bozic, M.; Arroyo, D.; Bretones, T.; Alonso, N.; Cambray, S.; Del Pino, M.D.; Mauricio, D.; et al. An In-Depth Analysis Shows a Hidden Atherogenic Lipoprotein Profile in Non-Diabetic Chronic Kidney Disease Patients. Expert Opin. Ther. Targets 2019, 23, 619–630. [Google Scholar] [CrossRef]
- Rashidi, H.H.; Sen, S.; Palmieri, T.L.; Blackmon, T.; Wajda, J.; Tran, N.K. Early Recognition of Burn- and Trauma-Related Acute Kidney Injury: A Pilot Comparison of Machine Learning Techniques. Sci. Rep. 2020, 10, 205. [Google Scholar] [CrossRef]
- Yue, S.; Li, S.; Huang, X.; Liu, J.; Hou, X.; Zhao, Y.; Niu, D.; Wang, Y.; Tan, W.; Wu, J. Machine Learning for the Prediction of Acute Kidney Injury in Patients with Sepsis. J. Transl. Med. 2022, 20, 215. [Google Scholar] [CrossRef]
- Lei, V.J.; Luong, T.; Shan, E.; Chen, X.; Neuman, M.D.; Eneanya, N.D.; Polsky, D.E.; Volpp, K.G.; Fleisher, L.A.; Holmes, J.H.; et al. Risk Stratification for Postoperative Acute Kidney Injury in Major Noncardiac Surgery Using Preoperative and Intraoperative Data. JAMA Netw. Open 2019, 2, e1916921. [Google Scholar] [CrossRef]
- Adhikari, L.; Ozrazgat-Baslanti, T.; Ruppert, M.; Madushani, R.W.M.A.; Paliwal, S.; Hashemighouchani, H.; Zheng, F.; Tao, M.; Lopes, J.M.; Li, X.; et al. Improved Predictive Models for Acute Kidney Injury with IDEA: Intraoperative Data Embedded Analytics. PLoS ONE 2019, 14, e0214904. [Google Scholar] [CrossRef]
- Schmid, N.; Ghinescu, M.; Schanz, M.; Christ, M.; Schricker, S.; Ketteler, M.; Alscher, M.D.; Franke, U.; Goebel, N. Algorithm-Based Detection of Acute Kidney Injury According to Full KDIGO Criteria Including Urine Output Following Cardiac Surgery: A Descriptive Analysis. BioData Min. 2023, 16, 12. [Google Scholar] [CrossRef] [PubMed]
- He, Z.-L.; Zhou, J.-B.; Liu, Z.-K.; Dong, S.-Y.; Zhang, Y.-T.; Shen, T.; Zheng, S.-S.; Xu, X. Application of Machine Learning Models for Predicting Acute Kidney Injury Following Donation after Cardiac Death Liver Transplantation. Hepatobiliary Pancreat. Dis. Int. 2021, 20, 222–231. [Google Scholar] [CrossRef] [PubMed]
- Zhang, Y.; Yang, D.; Liu, Z.; Chen, C.; Ge, M.; Li, X.; Luo, T.; Wu, Z.; Shi, C.; Wang, B.; et al. An Explainable Supervised Machine Learning Predictor of Acute Kidney Injury after Adult Deceased Donor Liver Transplantation. J. Transl. Med. 2021, 19, 321. [Google Scholar] [CrossRef]
- Bredt, L.C.; Peres, L.A.B.; Risso, M.; Barros, L.C.d.A.L. Risk Factors and Prediction of Acute Kidney Injury after Liver Transplantation: Logistic Regression and Artificial Neural Network Approaches. World J. Hepatol. 2022, 14, 570–582. [Google Scholar] [CrossRef]
- Mathis, M.R.; Naik, B.I.; Freundlich, R.E.; Shanks, A.M.; Heung, M.; Kim, M.; Burns, M.L.; Colquhoun, D.A.; Rangrass, G.; Janda, A.; et al. Preoperative Risk and the Association between Hypotension and Postoperative Acute Kidney Injury. Anesthesiology 2020, 132, 461–475. [Google Scholar] [CrossRef] [PubMed]
- Paquette, F.-X.; Ghassemi, A.; Bukhtiyarova, O.; Cisse, M.; Gagnon, N.; Della Vecchia, A.; Rabearivelo, H.A.; Loudiyi, Y. Machine Learning Support for Decision-Making in Kidney Transplantation: Step-by-Step Development of a Technological Solution. JMIR Med. Inf. 2022, 10, e34554. [Google Scholar] [CrossRef]
- Raynaud, M.; Aubert, O.; Divard, G.; Reese, P.P.; Kamar, N.; Yoo, D.; Chin, C.-S.; Bailly, É.; Buchler, M.; Ladrière, M.; et al. Dynamic Prediction of Renal Survival among Deeply Phenotyped Kidney Transplant Recipients Using Artificial Intelligence: An Observational, International, Multicohort Study. Lancet Digit. Health 2021, 3, e795–e805. [Google Scholar] [CrossRef]
- Kordzadeh, A.; Hanif, M.A.; Ramirez, M.J.; Railton, N.; Prionidis, I.; Browne, T. Prediction, Pattern Recognition and Modelling of Complications Post-Endovascular Infra Renal Aneurysm Repair by Artificial Intelligence. Vascular 2021, 29, 171–182. [Google Scholar] [CrossRef]
- Liu, Y.; Qiu, T.; Hu, H.; Kong, C.; Zhang, Y.; Wang, T.; Zhou, J.; Zou, J. Machine Learning Models for Prediction of Severe Pneumocystis Carinii Pneumonia after Kidney Transplantation: A Single-Center Retrospective Study. Diagnostics 2023, 13, 2735. [Google Scholar] [CrossRef] [PubMed]
- Tseng, P.-Y.; Chen, Y.-T.; Wang, C.-H.; Chiu, K.-M.; Peng, Y.-S.; Hsu, S.-P.; Chen, K.-L.; Yang, C.-Y.; Lee, O.K.-S. Prediction of the Development of Acute Kidney Injury Following Cardiac Surgery by Machine Learning. Crit. Care 2020, 24, 478. [Google Scholar] [CrossRef]
- Kalisnik, J.M.; Bauer, A.; Vogt, F.A.; Stickl, F.J.; Zibert, J.; Fittkau, M.; Bertsch, T.; Kounev, S.; Fischlein, T. Artificial Intelligence-Based Early Detection of Acute Kidney Injury after Cardiac Surgery. Eur. J. Cardio-Thorac. Surg. 2022, 62, ezac289. [Google Scholar] [CrossRef] [PubMed]
- Naser, M.N.; Al-Ghatam, R.; Darwish, A.H.; Alqahtani, M.M.; Alahmadi, H.A.; Mohamed, K.A.; Hasan, N.K.; Perez, N.S. Risk Factors, Predictions, and Progression of Acute Kidney Injury in Hospitalized COVID-19 Patients: An Observational Retrospective Cohort Study. PLoS ONE 2021, 16, e0257253. [Google Scholar] [CrossRef]
- Lu, J.Y.; Zhu, J.; Zhu, J.; Duong, T.Q. Long-Short-Term Memory Machine Learning of Longitudinal Clinical Data Accurately Predicts Acute Kidney Injury Onset in COVID-19: A Two-Center Study. Int. J. Infect. Dis. 2022, 122, 802–810. [Google Scholar] [CrossRef] [PubMed]
- Lee, K.-H.; Chu, Y.-C.; Tsai, M.-T.; Tseng, W.-C.; Lin, Y.-P.; Ou, S.-M.; Tarng, D.-C. Artificial Intelligence for Risk Prediction of End-Stage Renal Disease in Sepsis Survivors with Chronic Kidney Disease. Biomedicines 2022, 10, 546. [Google Scholar] [CrossRef]
- Konieczny, A.; Stojanowski, J.; Krajewska, M.; Kusztal, M. Machine Learning in Prediction of IgA Nephropathy Outcome: A Comparative Approach. J. Pers. Med. 2021, 11, 312. [Google Scholar] [CrossRef]
- Schena, F.P.; Anelli, V.W.; Trotta, J.; Di Noia, T.; Manno, C.; Tripepi, G.; D’Arrigo, G.; Chesnaye, N.C.; Russo, M.L.; Stangou, M.; et al. Development and Testing of an Artificial Intelligence Tool for Predicting End-Stage Kidney Disease in Patients with Immunoglobulin A Nephropathy. Kidney Int. 2021, 99, 1179–1188. [Google Scholar] [CrossRef]
- Lokuarachchi, D.N.; Tharindu Manoj, J.V.; Weerasooriya, M.N.H.; Waseem, M.N.M.; Aslam, F.; Kumarasinghe, N.; Kasthurirathne, D. Prediction of CKDu Using KDQOL Score, Ankle Swelling and Risk Factor Analysis Using Neural Networks. In Proceedings of the 2020 2nd International Conference on Advancements in Computing (ICAC), Malabe, Sri Lanka, 10–11 December 2020; pp. 91–96. [Google Scholar]
- Kanda, E.; Okami, S.; Kohsaka, S.; Okada, M.; Ma, X.; Kimura, T.; Shirakawa, K.; Yajima, T. Machine Learning Models Predicting Cardiovascular and Renal Outcomes and Mortality in Patients with Hyperkalemia. Nutrients 2022, 14, 4614. [Google Scholar] [CrossRef]
- Song, X.; Waitman, L.R.; Yu, A.S.L.; Robbins, D.C.; Hu, Y.; Liu, M. Longitudinal Risk Prediction of Chronic Kidney Disease in Diabetic Patients Using a Temporal-Enhanced Gradient Boosting Machine: Retrospective Cohort Study. JMIR Med. Inform. 2020, 8, e15510. [Google Scholar] [CrossRef]
- Wessels, F.; Schmitt, M.; Krieghoff-Henning, E.; Nientiedt, M.; Waldbillig, F.; Neuberger, M.; Kriegmair, M.C.; Kowalewski, K.-F.; Worst, T.S.; Steeg, M.; et al. A Self-Supervised Vision Transformer to Predict Survival from Histopathology in Renal Cell Carcinoma. World J. Urol. 2023, 41, 2233–2241. [Google Scholar] [CrossRef]
- Galloway, C.D.; Valys, A.V.; Shreibati, J.B.; Treiman, D.L.; Petterson, F.L.; Gundotra, V.P.; Albert, D.E.; Attia, Z.I.; Carter, R.E.; Asirvatham, S.J.; et al. Development and Validation of a Deep-Learning Model to Screen for Hyperkalemia From the Electrocardiogram. JAMA Cardiol. 2019, 4, 428–436. [Google Scholar] [CrossRef] [PubMed]
- Xu, H.; Kong, Y.; Tan, S. Predictive Modeling of Diabetic Kidney Disease Using Random Forest Algorithm along with Features Selection. In Proceedings of the 1st International Symposium on Artificial Intelligence in Medical Sciences, Beijing, China, 11–13 September 2020; Association for Computing Machinery: New York, NY, USA, 2020; pp. 23–27. [Google Scholar] [CrossRef]
- Lee, J.; Warner, E.; Shaikhouni, S.; Bitzer, M.; Kretzler, M.; Gipson, D.; Pennathur, S.; Bellovich, K.; Bhat, Z.; Gadegbeku, C.; et al. Unsupervised Machine Learning for Identifying Important Visual Features through Bag-of-Words Using Histopathology Data from Chronic Kidney Disease. Sci. Rep. 2022, 12, 4832. [Google Scholar] [CrossRef] [PubMed]
- Inaguma, D.; Kitagawa, A.; Yanagiya, R.; Koseki, A.; Iwamori, T.; Kudo, M.; Yuzawa, Y. Increasing Tendency of Urine Protein Is a Risk Factor for Rapid EGFR Decline in Patients with CKD: A Machine Learning-Based Prediction Model by Using a Big Database. PLoS ONE 2020, 15, e0239262. [Google Scholar] [CrossRef]
- Song, X.; Yu, A.S.L.; Kellum, J.A.; Waitman, L.R.; Matheny, M.E.; Simpson, S.Q.; Hu, Y.; Liu, M. Cross-Site Transportability of an Explainable Artificial Intelligence Model for Acute Kidney Injury Prediction. Nat. Commun. 2020, 11, 5668. [Google Scholar] [CrossRef] [PubMed]
- Kuo, C.-C.; Chang, C.-M.; Liu, K.-T.; Lin, W.-K.; Chiang, H.-Y.; Chung, C.-W.; Ho, M.-R.; Sun, P.-R.; Yang, R.-L.; Chen, K.-T. Automation of the Kidney Function Prediction and Classification through Ultrasound-Based Kidney Imaging Using Deep Learning. Npj Digit. Med. 2019, 2, 29. [Google Scholar] [CrossRef]
- Kandasamy, N.; Chaussalet, T.; Basukoski, A. A Conceptual Framework to Predict Disease Progressions in Patients with Chronic Kidney Disease, Using Machine Learning and Process Mining. Stud. Health Technol. Inf. 2023, 305, 190–193. [Google Scholar] [CrossRef]
- Zimmerman, L.P.; Reyfman, P.A.; Smith, A.D.R.; Zeng, Z.; Kho, A.; Sanchez-Pinto, L.N.; Luo, Y. Early Prediction of Acute Kidney Injury Following ICU Admission Using a Multivariate Panel of Physiological Measurements. BMC Med. Inf. Decis. Mak. 2019, 19, 16. [Google Scholar] [CrossRef]
- Alfieri, F.; Ancona, A.; Tripepi, G.; Crosetto, D.; Randazzo, V.; Paviglianiti, A.; Pasero, E.; Vecchi, L.; Cauda, V.; Fagugli, R.M. A Deep-Learning Model to Continuously Predict Severe Acute Kidney Injury Based on Urine Output Changes in Critically Ill Patients. J. Nephrol. 2021, 34, 1875–1886. [Google Scholar] [CrossRef]
- Alfieri, F.; Ancona, A.; Tripepi, G.; Randazzo, V.; Paviglianiti, A.; Pasero, E.; Vecchi, L.; Politi, C.; Cauda, V.; Fagugli, R.M. External Validation of a Deep-Learning Model to Predict Severe Acute Kidney Injury Based on Urine Output Changes in Critically Ill Patients. J. Nephrol. 2022, 35, 2047–2056. [Google Scholar] [CrossRef]
- Hu, C.; Tan, Q.; Zhang, Q.; Li, Y.; Wang, F.; Zou, X.; Peng, Z. Application of Interpretable Machine Learning for Early Prediction of Prognosis in Acute Kidney Injury. Comput. Struct. Biotechnol. J. 2022, 20, 2861–2870. [Google Scholar] [CrossRef]
- Liu, W.T.; Liu, X.Q.; Jiang, T.T.; Wang, M.Y.; Huang, Y.; Huang, Y.L.; Jin, F.Y.; Zhao, Q.; Wu, Q.Y.; Liu, B.C.; et al. Using a Machine Learning Model to Predict the Development of Acute Kidney Injury in Patients with Heart Failure. Front. Cardiovasc. Med. 2022, 9, 911987. [Google Scholar] [CrossRef]
- Tomašev, N.; Glorot, X.; Rae, J.W.; Zielinski, M.; Askham, H.; Saraiva, A.; Mottram, A.; Meyer, C.; Ravuri, S.; Protsyuk, I.; et al. A Clinically Applicable Approach to Continuous Prediction of Future Acute Kidney Injury. Nature 2019, 572, 116–119. [Google Scholar] [CrossRef] [PubMed]
- Xiao, J.; Ding, R.; Xu, X.; Guan, H.; Feng, X.; Sun, T.; Zhu, S.; Ye, Z. Comparison and Development of Machine Learning Tools in the Prediction of Chronic Kidney Disease Progression. J. Transl. Med. 2019, 17, 119. [Google Scholar] [CrossRef] [PubMed]
- Rady, E.-H.A.; Anwar, A.S. Prediction of Kidney Disease Stages Using Data Mining Algorithms. Inform. Med. Unlocked 2019, 15, 100178. [Google Scholar] [CrossRef]
- Akter, S.; Ahmed, M.; Al Imran, A.; Habib, A.; Ul Haque, R.; Rahman, S.; Hasan, R.; Mahjabeen, S. CKD.Net: A Novel Deep Learning Hybrid Model for Effective, Real-Time, Automated Screening Tool towards Prediction of Multi Stages of CKD along with eGFR and Creatinine. Expert Syst. Appl. 2023, 223, 119851. [Google Scholar] [CrossRef]
- Bellocchio, F.; Lonati, C.; Ion Titapiccolo, J.; Nadal, J.; Meiselbach, H.; Schmid, M.; Baerthlein, B.; Tschulena, U.; Schneider, M.; Schultheiss, U.T.; et al. Validation of a Novel Predictive Algorithm for Kidney Failure in Patients Suffering from Chronic Kidney Disease: The Prognostic Reasoning System for Chronic Kidney Disease (PROGRES-CKD). Int. J. Env. Res. Public Health 2021, 18, 12649. [Google Scholar] [CrossRef]
- Tran, N.T.D.; Balezeaux, M.; Granal, M.; Fouque, D.; Ducher, M.; Fauvel, J.-P. Prediction of All-Cause Mortality for Chronic Kidney Disease Patients Using Four Models of Machine Learning. Nephrol. Dial. Transpl. 2023, 38, 1691–1699. [Google Scholar] [CrossRef]
- Shabaniyan, T.; Parsaei, H.; Aminsharifi, A.; Movahedi, M.M.; Jahromi, A.T.; Pouyesh, S.; Parvin, H. An Artificial Intelligence-Based Clinical Decision Support System for Large Kidney Stone Treatment. Australas. Phys. Eng. Sci. Med. 2019, 42, 771–779. [Google Scholar] [CrossRef]
- Black, K.M.; Law, H.; Aldoukhi, A.; Deng, J.; Ghani, K.R. Deep Learning Computer Vision Algorithm for Detecting Kidney Stone Composition. BJU Int. 2020, 125, 920–924. [Google Scholar] [CrossRef] [PubMed]
- Kers, J.; Bülow, R.D.; Klinkhammer, B.M.; Breimer, G.E.; Fontana, F.; Abiola, A.A.; Hofstraat, R.; Corthals, G.L.; Peters-Sengers, H.; Djudjaj, S.; et al. Deep Learning-Based Classification of Kidney Transplant Pathology: A Retrospective, Multicentre, Proof-of-Concept Study. Lancet Digit. Health 2022, 4, e18–e26. [Google Scholar] [CrossRef]
- Ou, S.-M.; Tsai, M.-T.; Lee, K.-H.; Tseng, W.-C.; Yang, C.-Y.; Chen, T.-H.; Bin, P.-J.; Chen, T.-J.; Lin, Y.-P.; Sheu, W.H.-H.; et al. Prediction of the Risk of Developing End-Stage Renal Diseases in Newly Diagnosed Type 2 Diabetes Mellitus Using Artificial Intelligence Algorithms. BioData Min. 2023, 16, 8. [Google Scholar] [CrossRef]
- Farrell, D.R.; Vassalotti, J.A. Screening, Identifying, and Treating Chronic Kidney Disease: Why, Who, When, How, and What? BMC Nephrol. 2024, 25, 34. [Google Scholar] [CrossRef]
- Kaur, B.; Nikita; Sadawarti, H.; Singla, J. A Comprehensive Review of Medical Expert Systems for Diagnosis of Chronic Kidney Diseases. In Proceedings of the 2019 International Conference on Smart Systems and Inventive Technology (ICSSIT), Tirunelveli, India, 27–29 November 2019; pp. 1008–1013. [Google Scholar] [CrossRef]
- Senan, E.M.; Al-Adhaileh, M.H.; Alsaade, F.W.; Aldhyani, T.H.H.; Alqarni, A.A.; Alsharif, N.; Uddin, M.I.; Alahmadi, A.H.; Jadhav, M.E.; Alzahrani, M.Y. Diagnosis of Chronic Kidney Disease Using Effective Classification Algorithms and Recursive Feature Elimination Techniques. J. Healthc. Eng. 2021, 2021, 1004767. [Google Scholar] [CrossRef]
- Ram, S.; Gupta, S. Building Machine Learning Based Diseases Diagnosis System Considering Various Features of Datasets. In Emerging Trends in Expert Applications and Security; Rathore, V.S., Worring, M., Mishra, D.K., Joshi, A., Maheshwari, S., Eds.; Springer: Singapore, 2019; pp. 147–155. [Google Scholar] [CrossRef]
- Khamparia, A.; Saini, G.; Pandey, B.; Tiwari, S.; Gupta, D.; Khanna, A. KDSAE: Chronic Kidney Disease Classification with Multimedia Data Learning Using Deep Stacked Autoencoder Network. Multimed Tools Appl. 2020, 79, 35425–35440. [Google Scholar] [CrossRef]
- Al-Momani, R.; Al-Mustafa, G.; Zeidan, R.; Alquran, H.; Mustafa, W.A.; Alkhayyat, A. Chronic Kidney Disease Detection Using Machine Learning Technique. In Proceedings of the 2022 5th International Conference on Engineering Technology and Its Applications (IICETA), Al-Najaf, Iraq, 1–25 May 2022; pp. 153–158. [Google Scholar] [CrossRef]
- Alsadi, A.; Majeed, N.; Saeed, D.; Dharmamer, Y.; Singh, M.; Patel, T. A Deep-Learning Approach at Automated Detection of Electron-Dense Immune Deposits in Medical Renal Biopsies. J. Nephropathol. 2020, 11, e17123. [Google Scholar] [CrossRef]
- Vashisth, S.; Dhall, I.; Saraswat, S. Chronic Kidney Disease (CKD) Diagnosis Using Multi-Layer Perceptron Classifier. In Proceedings of the 2020 10th International Conference on Cloud Computing, Data Science & Engineering (Confluence), Noida, India, 29–31 January 2020; pp. 346–350. [Google Scholar] [CrossRef]
- Alikhan, J.S.; Alageswaran, R.; Amali, S.M.J. Self-Attention Convolutional Neural Network Optimized with Season Optimization Algorithm Espoused Chronic Kidney Diseases Diagnosis in Big Data System. Biomed. Signal Process. Control 2023, 85, 105011. [Google Scholar] [CrossRef]
- Granal, M.; Slimani, L.; Florens, N.; Sens, F.; Pelletier, C.; Pszczolinski, R.; Casiez, C.; Kalbacher, E.; Jolivot, A.; Dubourg, L.; et al. Prediction Tool to Estimate Potassium Diet in Chronic Kidney Disease Patients Developed Using a Machine Learning Tool: The UniverSel Study. Nutrients 2022, 14, 2419. [Google Scholar] [CrossRef] [PubMed]
- Lassau, N.; Estienne, T.; de Vomecourt, P.; Azoulay, M.; Cagnol, J.; Garcia, G.; Majer, M.; Jehanno, E.; Renard-Penna, R.; Balleyguier, C.; et al. Five Simultaneous Artificial Intelligence Data Challenges on Ultrasound, CT, and MRI. Diagn. Interv. Imaging 2019, 100, 199–209. [Google Scholar] [CrossRef]
- Onthoni, D.D.; Sheng, T.-W.; Sahoo, P.K.; Wang, L.-J.; Gupta, P. Deep Learning Assisted Localization of Polycystic Kidney on Contrast-Enhanced CT Images. Diagnostics 2020, 10, 1113. [Google Scholar] [CrossRef]
- Les, T.; Markiewicz, T.; Dziekiewicz, M.; Lorent, M. Kidney Boundary Detection Algorithm Based on Extended Maxima Transformations for Computed Tomography Diagnosis. Appl. Sci. 2020, 10, 7512. [Google Scholar] [CrossRef]
- Tsai, M.-C.; Lu, H.H.-S.; Chang, Y.-C.; Huang, Y.-C.; Fu, L.-S. Automatic Screening of Pediatric Renal Ultrasound Abnormalities: Deep Learning and Transfer Learning Approach. JMIR Med. Inf. 2022, 10, e40878. [Google Scholar] [CrossRef]
- Yamaguchi, R.; Kawazoe, Y.; Shimamoto, K.; Shinohara, E.; Tsukamoto, T.; Shintani-Domoto, Y.; Nagasu, H.; Uozaki, H.; Ushiku, T.; Nangaku, M.; et al. Glomerular Classification Using Convolutional Neural Networks Based on Defined Annotation Criteria and Concordance Evaluation Among Clinicians. Kidney Int. Rep. 2020, 6, 716–726. [Google Scholar] [CrossRef] [PubMed]
- Jayapandian, C.P.; Chen, Y.; Janowczyk, A.R.; Palmer, M.B.; Cassol, C.A.; Sekulic, M.; Hodgin, J.B.; Zee, J.; Hewitt, S.M.; O’Toole, J.; et al. Development and Evaluation of Deep Learning–Based Segmentation of Histologic Structures in the Kidney Cortex with Multiple Histologic Stains. Kidney Int. 2021, 99, 86–101. [Google Scholar] [CrossRef] [PubMed]
- Altalbe, A.; Javed, A. Applying Customized Convolutional Neural Network to Kidney Image Volumes for Kidney Disease Detection. CSSE 2023, 47, 2119–2134. [Google Scholar] [CrossRef]
- Kumar, K.; Pradeepa, M.; Mahdal, M.; Verma, S.; RajaRao, M.V.L.N.; Ramesh, J.V.N. A Deep Learning Approach for Kidney Disease Recognition and Prediction through Image Processing. Appl. Sci. 2023, 13, 3621. [Google Scholar] [CrossRef]
- Hao, F.; Li, M.; Liu, X.; Li, X.; Yue, J.; Han, W. Classification of Glomeruli with Membranous Nephropathy on Renal Digital Pathological Images with Deep Learning. In Proceedings of the 2020 Conference on Artificial Intelligence and Healthcare, Taiyuan, China, 23–25 October 2020; Association for Computing Machinery: New York, NY, USA, 2020; pp. 239–243. [Google Scholar] [CrossRef]
- Parakh, A.; Lee, H.; Lee, J.H.; Eisner, B.H.; Sahani, D.V.; Do, S. Urinary Stone Detection on CT Images Using Deep Convolutional Neural Networks: Evaluation of Model Performance and Generalization. Radiol. Artif. Intell. 2019, 1, e180066. [Google Scholar] [CrossRef] [PubMed]
- Yildirim, K.; Bozdag, P.G.; Talo, M.; Yildirim, O.; Karabatak, M.; Acharya, U.R. Deep Learning Model for Automated Kidney Stone Detection Using Coronal CT Images. Comput. Biol. Med. 2021, 135, 104569. [Google Scholar] [CrossRef]
- Li, D.; Xiao, C.; Liu, Y.; Chen, Z.; Hassan, H.; Su, L.; Liu, J.; Li, H.; Xie, W.; Zhong, W.; et al. Deep Segmentation Networks for Segmenting Kidneys and Detecting Kidney Stones in Unenhanced Abdominal CT Images. Diagnostics 2022, 12, 1788. [Google Scholar] [CrossRef]
- Asif, S.; Zhao, M.; Chen, X.; Zhu, Y. StoneNet: An Efficient Lightweight Model Based on Depthwise Separable Convolutions for Kidney Stone Detection from CT Images. Interdiscip. Sci. Comput. Life Sci. 2023, 15, 633–652. [Google Scholar] [CrossRef] [PubMed]
- Subramanian, R.R.; Abilakshmi, A.; Kalyani, T.; Sunayana, P.; Monalisa, G.; Chaithanya, C.V. Design and Evaluation of a Deep Learning Aided Approach for Kidney Stone Detection in CT Scan Images. In Proceedings of the 2023 International Conference on Applied Intelligence and Sustainable Computing (ICAISC), Dharwad, India, 16–17 June 2023; pp. 1–6. [Google Scholar] [CrossRef]
- Gondim, D.D.; Al-Obaidy, K.I.; Idrees, M.T.; Eble, J.N.; Cheng, L. Artificial Intelligence-Based Multi-Class Histopathologic Classification of Kidney Neoplasms. J. Pathol. Inform. 2023, 14, 100299. [Google Scholar] [CrossRef]
- Jhumka, K.; Khan, M.H.-M.; Mungloo-Dilmohamud, Z.; Fedally, S.A. Classification of Kidney Abnormalities Using Deep Learning with Explainable AI. In Proceedings of the 2023 Sixth International Conference of Women in Data Science at Prince Sultan University (WiDS PSU), Riyadh, Saudi Arabia, 14–15 March 2023; pp. 133–137. [Google Scholar] [CrossRef]
- Ginley, B.; Jen, K.-Y.; Han, S.S.; Rodrigues, L.; Jain, S.; Fogo, A.B.; Zuckerman, J.; Walavalkar, V.; Miecznikowski, J.C.; Wen, Y.; et al. Automated Computational Detection of Interstitial Fibrosis, Tubular Atrophy, and Glomerulosclerosis. J. Am. Soc. Nephrol. 2021, 32, 837–850. [Google Scholar] [CrossRef]
- Yi, Z.; Salem, F.; Menon, M.C.; Keung, K.; Xi, C.; Hultin, S.; Haroon Al Rasheed, M.R.; Li, L.; Su, F.; Sun, Z.; et al. Deep Learning Identified Pathological Abnormalities Predictive of Graft Loss in Kidney Transplant Biopsies. Kidney Int. 2022, 101, 288–298. [Google Scholar] [CrossRef]
- Tang, Z.-Y.; Lin, Y.-C.; Shen, C.-C. Dual-Path Convolutional Neural Network for Chronic Kidney Disease Classification in Ultrasound Echography. In Proceedings of the 2022 IEEE International Ultrasonics Symposium (IUS), Venice, Italy, 10–13 October 2022; pp. 1–4. [Google Scholar]
- Weis, C.-A.; Bindzus, J.N.; Voigt, J.; Runz, M.; Hertjens, S.; Gaida, M.M.; Popovic, Z.V.; Porubsky, S. Assessment of Glomerular Morphological Patterns by Deep Learning Algorithms. J. Nephrol. 2022, 35, 417–427. [Google Scholar] [CrossRef]
- Zhang, L.; Li, M.; Wu, Y.; Hao, F.; Wang, C.; Han, W.; Niu, D.; Zheng, W. Classification of Renal Biopsy Direct Immunofluorescence Image Using Multiple Attention Convolutional Neural Network. Comput. Methods Programs Biomed. 2022, 214, 106532. [Google Scholar] [CrossRef]
- Lu, Y.; Yang, H.; Asad, Z.; Zhu, Z.; Yao, T.; Xu, J.; Fogo, A.B.; Huo, Y. Holistic Fine-Grained Global Glomerulosclerosis Characterization: From Detection to Unbalanced Classification. J. Med. Imaging 2022, 9, 014005. [Google Scholar] [CrossRef] [PubMed]
- Pesce, F.; Albanese, F.; Mallardi, D.; Rossini, M.; Pasculli, G.; Suavo-Bulzis, P.; Granata, A.; Brunetti, A.; Cascarano, G.D.; Bevilacqua, V.; et al. Identification of Glomerulosclerosis Using IBM Watson and Shallow Neural Networks. J. Nephrol. 2022, 35, 1235–1242. [Google Scholar] [CrossRef] [PubMed]
- Akatsuka, A.; Horai, Y.; Akatsuka, A. Automated Recognition of Glomerular Lesions in the Kidneys of Mice by Using Deep Learning. J. Pathol. Inf. 2022, 13, 100129. [Google Scholar] [CrossRef]
- Nan, Y.; Li, F.; Tang, P.; Zhang, G.; Zeng, C.; Xie, G.; Liu, Z.; Yang, G. Automatic Fine-Grained Glomerular Lesion Recognition in Kidney Pathology. Pattern Recognit. 2022, 127, 108648. [Google Scholar] [CrossRef]
- Pilia, N.; Mesa, M.H.; Dossel, O.; Loewe, A. ECG-Based Estimation of Potassium and Calcium Concentrations: Proof of Concept with Simulated Data. In Proceedings of the 2019 41st Annual International Conference of the IEEE Engineering in Medicine and Biology Society (EMBC), Berlin, Germany, 23–27 July 2019; pp. 2610–2613. [Google Scholar] [CrossRef]
- Hayashi, Y. Detection of Lower Albuminuria Levels and Early Development of Diabetic Kidney Disease Using an Artificial Intelligence-Based Rule Extraction Approach. Diagnostics 2019, 9, 133. [Google Scholar] [CrossRef] [PubMed]
- Bhaskar, N.; Manikandan, S. A Deep-Learning-Based System for Automated Sensing of Chronic Kidney Disease. IEEE Sens. Lett. 2019, 3, 7001904. [Google Scholar] [CrossRef]
- Sabanayagam, C.; Xu, D.; Ting, D.S.W.; Nusinovici, S.; Banu, R.; Hamzah, H.; Lim, C.; Tham, Y.-C.; Cheung, C.Y.; Tai, E.S.; et al. A Deep Learning Algorithm to Detect Chronic Kidney Disease from Retinal Photographs in Community-Based Populations. Lancet Digit. Health 2020, 2, e295–e302. [Google Scholar] [CrossRef] [PubMed]
- Zhang, K.; Liu, X.; Xu, J.; Yuan, J.; Cai, W.; Chen, T.; Wang, K.; Gao, Y.; Nie, S.; Xu, X.; et al. Deep-Learning Models for the Detection and Incidence Prediction of Chronic Kidney Disease and Type 2 Diabetes from Retinal Fundus Images. Nat. Biomed. Eng. 2021, 5, 533–545. [Google Scholar] [CrossRef]
- Davenport, A. Why Is Intradialytic Hypotension the Commonest Complication of Outpatient Dialysis Treatments? Kidney Int. Rep. 2022, 8, 405–418. [Google Scholar] [CrossRef]
- Li, Y.; Zhao, D.; Liu, G.; Liu, Y.; Bano, Y.; Ibrohimov, A.; Chen, H.; Wu, C.; Chen, X. Intradialytic Hypotension Prediction Using Covariance Matrix-Driven Whale Optimizer with Orthogonal Structure-Assisted Extreme Learning Machine. Front. Neuroinform. 2022, 16, 956423. [Google Scholar] [CrossRef]
- Mendoza-Pitti, L.; Gómez, J.; Vargas-Lombardo, M.; Gomez-Pulido, J.A.; Polo-Luque, M.-L.; Rodriguez-Puyol, D. Machine-Learning Model to Predict the Intradialytic Hypotension Based on Clinical-Analytical Data. IEEE Access 2022, 10, 72065–72079. [Google Scholar] [CrossRef]
- Mohammed, I.H.; Obaid, M.K.; Hadi, M.R.; Alzubaidi, L.H.; Mohammed, A.; Hassan, A.R. Artificial Intelligence Based Robust Clinical Data Classification for Intradialytic Hypotension Diagnosis. In Proceedings of the 2023 6th International Conference on Engineering Technology and its Applications (IICETA), Al-Najaf, Iraq, 15–16 July 2023; pp. 78–84. [Google Scholar] [CrossRef]
- Hong, D.; Chang, H.; He, X.; Zhan, Y.; Tong, R.; Wu, X.; Li, G. Construction of an Early Alert System for Intradialytic Hypotension before Initiating Hemodialysis Based on Machine Learning. Kidney Dis. 2023, 9, 433–442. [Google Scholar] [CrossRef]
- Shih, C.; Lai, Y.; Chen, C.; Chu, W.C.-C. An Early Warning System for Hemodialysis Complications Utilizing Transfer Learning from HD IoT Dataset. In Proceedings of the 2020 IEEE 44th Annual Computers, Software, and Applications Conference (COMPSAC), Madrid, Spain, 13–17 July 2020; pp. 759–767. [Google Scholar]
- Othman, M.; Elbasha, A.M.; Naga, Y.S.; Moussa, N.D. Early Prediction of Hemodialysis Complications Employing Ensemble Techniques. Biomed. Eng. OnLine 2022, 21, 74. [Google Scholar] [CrossRef] [PubMed]
- Song, W.T.; Chen, C.C.; Yu, Z.-W.; Huang, H.-C. An Effective AI Model for Automatically Detecting Arteriovenous Fistula Stenosis. Sci. Rep. 2023, 13, 17659. [Google Scholar] [CrossRef]
- Ota, K.; Nishiura, Y.; Ishihara, S.; Adachi, H.; Yamamoto, T.; Hamano, T. Evaluation of Hemodialysis Arteriovenous Bruit by Deep Learning. Sensors 2020, 20, 4852. [Google Scholar] [CrossRef]
- Balamuthusamy, S.; Dhanabalsamy, N.; Thankavel, B.; Bala, M.; Pfaffle, A. Utility of Machine Learning (ML)Analytics on Real Time Risk Stratification and Re-Intervention Risk Prediction on AV Access Outcomes and Cost. J. Vasc. Access 2023, 25, 1224–1228. [Google Scholar] [CrossRef]
- Zhang, H.; Preddie, D.; Krackov, W.; Sor, M.; Waguespack, P.; Kuang, Z.; Ye, X.; Kotanko, P. Deep Learning to Classify Arteriovenous Access Aneurysms in Hemodialysis Patients. Clin. Kidney J. 2021, 15, 829–830. [Google Scholar] [CrossRef]
- Hong, J. Care of Maintenance Hemodialysis Patients through Intelligent Algorithm-Based Low-Dose Digital Subtraction Angiography. Sci. Program. 2021, 2021, 8746962. [Google Scholar] [CrossRef]
- Barbieri, C.; Cattinelli, I.; Neri, L.; Mari, F.; Ramos, R.; Brancaccio, D.; Canaud, B.; Stuard, S. Development of an Artificial Intelligence Model to Guide the Management of Blood Pressure, Fluid Volume, and Dialysis Dose in End-Stage Kidney Disease Patients: Proof of Concept and First Clinical Assessment. Kidney Dis. 2019, 5, 28–33. [Google Scholar] [CrossRef]
- Brito, C.; Esteves, M.; Peixoto, H.; Abelha, A.; Machado, J. A Data Mining Approach to Classify Serum Creatinine Values in Patients Undergoing Continuous Ambulatory Peritoneal Dialysis. Wirel. Netw. 2022, 28, 1269–1277. [Google Scholar] [CrossRef]
- Tan, G.F.L.; Du, T.; Liu, J.S.; Chai, C.C.; Nyein, C.M.; Liu, A.Y.L. Automated Lung Ultrasound Image Assessment Using Artificial Intelligence to Identify Fluid Overload in Dialysis Patients. BMC Nephrol. 2022, 23, 410. [Google Scholar] [CrossRef] [PubMed]
- Cho, G.W.; Ghanem, A.K.; Quesada, C.G.; Crabtree, T.R.; Jennings, R.S.; Budoff, M.J.; Choi, A.D.; Min, J.K.; Karlsberg, R.P.; Earls, J.P. Quantitative Plaque Analysis with A.I.-Augmented CCTA in End-Stage Renal Disease and Complex CAD. Clin. Imaging 2022, 89, 155–161. [Google Scholar] [CrossRef] [PubMed]
- Kanda, E.; Epureanu, B.I.; Adachi, T.; Tsuruta, Y.; Kikuchi, K.; Kashihara, N.; Abe, M.; Masakane, I.; Nitta, K. Application of Explainable Ensemble Artificial Intelligence Model to Categorization of Hemodialysis-Patient and Treatment Using Nationwide-Real-World Data in Japan. PLoS ONE 2020, 15, e0233491. [Google Scholar] [CrossRef] [PubMed]
- Qarajeh, A.; Tangpanithandee, S.; Thongprayoon, C.; Suppadungsuk, S.; Krisanapan, P.; Aiumtrakul, N.; Garcia Valencia, O.A.; Miao, J.; Qureshi, F.; Cheungpasitporn, W. AI-Powered Renal Diet Support: Performance of ChatGPT, Bard AI, and Bing Chat. Clin. Pract. 2023, 13, 1160–1172. [Google Scholar] [CrossRef]
- Cheng, C.-I.; Lin, W.-J.; Liu, H.-T.; Chen, Y.-T.; Chiang, C.-K.; Hung, K.-Y. Implementation of Artificial Intelligence Chatbot in Peritoneal Dialysis Nursing Care: Experience from a Taiwan Medical Center. Nephrology 2023, 28, 655–662. [Google Scholar] [CrossRef]
- Tveit, D.P.; Hshieh, P.; Cruess, D.; Agodoa, L.Y.C.; Welch, P.G.; Abbott, K.C. Risk Factors for Pulmonary Embolism in Chronic Dialysis Patients. J. Nephrol. 2002, 15, 241–247. [Google Scholar]
- Arulkumaran, N.; Navaratnarajah, A.; Pillay, C.; Brown, W.; Duncan, N.; McLean, A.; Taube, D.; Brown, E.A. Causes and Risk Factors for Acute Dialysis Initiation among Patients with End-Stage Kidney Disease—A Large Retrospective Observational Cohort Study. Clin. Kidney J. 2019, 12, 550–558. [Google Scholar] [CrossRef]
- Harmankaya, O.; Akalin, N.; Akay, H.; Okuturlar, Y.; Erturk, K.; Kaptanogullari, H.; Kocoglu, H. Comparison of Risk Factors for Cardiovascular Disease in Hemodialysis and Peritoneal Dialysis Patients. Clinics 2015, 70, 601–605. [Google Scholar] [CrossRef]
- Díez-Sanmartín, C.; Cabezuelo, A.S.; Belmonte, A.A. A New Approach to Predicting Mortality in Dialysis Patients Using Sociodemographic Features Based on Artificial Intelligence. Artif. Intell. Med. 2023, 136, 102478. [Google Scholar] [CrossRef]
- Noh, J.; Yoo, K.D.; Bae, W.; Lee, J.S.; Kim, K.; Cho, J.-H.; Lee, H.; Kim, D.K.; Lim, C.S.; Kang, S.-W.; et al. Prediction of the Mortality Risk in Peritoneal Dialysis Patients Using Machine Learning Models: A Nation-Wide Prospective Cohort in Korea. Sci. Rep. 2020, 10, 7470. [Google Scholar] [CrossRef] [PubMed]
- Siga, M.M.; Ducher, M.; Florens, N.; Roth, H.; Mahloul, N.; Fouque, D.; Fauvel, J.-P. Prediction of All-Cause Mortality in Haemodialysis Patients Using a Bayesian Network. Nephrol. Dial. Transplant. 2020, 35, 1420–1425. [Google Scholar] [CrossRef] [PubMed]
- Gotta, V.; Tancev, G.; Marsenic, O.; Vogt, J.E.; Pfister, M. Identifying Key Predictors of Mortality in Young Patients on Chronic Haemodialysis—A Machine Learning Approach. Nephrol. Dial. Transplant. 2021, 36, 519–528. [Google Scholar] [CrossRef] [PubMed]
- Ohara, T.; Ikeda, H.; Sugitani, Y.; Suito, H.; Huynh, V.Q.H.; Kinomura, M.; Haraguchi, S.; Sakurama, K. Artificial Intelligence Supported Anemia Control System (AISACS) to Prevent Anemia in Maintenance Hemodialysis Patients. Int. J. Med. Sci. 2021, 18, 1831–1839. [Google Scholar] [CrossRef]
- Liao, H.; Yang, Y.; Zeng, Y.; Qiu, Y.; Chen, Y.; Zhu, L.; Fu, P.; Yan, F.; Chen, Y.; Yuan, H. Use Machine Learning to Help Identify Possible Sarcopenia Cases in Maintenance Hemodialysis Patients. BMC Nephrol. 2023, 24, 34. [Google Scholar] [CrossRef] [PubMed]
- Garbelli, M.; Neri, L.; Bellocchio, F. Arteriovenous Fistula Flow Level Prediction through Ordinal Classifier Methods. CEUR Workshop 2022, 3307, 12–19. [Google Scholar]
- Monaghan, C.K.; Larkin, J.W.; Chaudhuri, S.; Han, H.; Jiao, Y.; Bermudez, K.M.; Weinhandl, E.D.; Dahne-Steuber, I.A.; Belmonte, K.; Neri, L.; et al. Machine Learning for Prediction of Patients on Hemodialysis with an Undetected SARS-CoV-2 Infection. Kidney360 2021, 2, 456–468. [Google Scholar] [CrossRef]
- Tang, S.-Y.; Chen, T.-H.; Kuo, K.-L.; Huang, J.-N.; Kuo, C.-T.; Chu, Y.-C. Using Artificial Intelligence Algorithms to Predict the Overall Survival of Hemodialysis Patients during the COVID-19 Pandemic: A Prospective Cohort Study. J. Chin. Med. Assoc. 2023, 86, 1020–1027. [Google Scholar] [CrossRef]
- Wu, J.; Kong, G.; Lin, Y.; Chu, H.; Yang, C.; Shi, Y.; Wang, H.; Zhang, L. Development of a Scoring Tool for Predicting Prolonged Length of Hospital Stay in Peritoneal Dialysis Patients through Data Mining. Ann. Transl. Med. 2020, 8, 1437. [Google Scholar] [CrossRef] [PubMed]
- Kong, G.; Wu, J.; Chu, H.; Yang, C.; Lin, Y.; Lin, K.; Shi, Y.; Wang, H.; Zhang, L. Predicting Prolonged Length of Hospital Stay for Peritoneal Dialysis–Treated Patients Using Stacked Generalization: Model Development and Validation Study. JMIR Med. Inf. 2021, 9, e17886. [Google Scholar] [CrossRef] [PubMed]
- Shickel, B.; Bihorac, A. The Dawn of Multimodal Artificial Intelligence in Nephrology. Nat. Rev. Nephrol. 2024, 20, 79–80. [Google Scholar] [CrossRef]
- Dong, Z.; Wang, X.; Pan, S.; Weng, T.; Chen, X.; Jiang, S.; Li, Y.; Wang, Z.; Cao, X.; Wang, Q.; et al. A Multimodal Transformer System for Noninvasive Diabetic Nephropathy Diagnosis via Retinal Imaging. Npj Digit. Med. 2025, 8, 50. [Google Scholar] [CrossRef]
- Hu, X.; Yang, J.; Li, Y.; Gong, Y.; Ni, H.; Wei, Q.; Yang, M.; Zhang, Y.; Huang, J.; Ma, C.; et al. Multimodal Deep Learning Improving the Accuracy of Pathological Diagnoses for Membranous Nephropathy. Ren. Fail. 2025, 47, 2528106. [Google Scholar] [CrossRef]
- Saly, D.L.; Allegretti, A.S.; Ufere, N.N.; on behalf of the MGH SILK Collaborative. The SILK Collaborative: A Multidisciplinary Approach to Serious Illness Communication for Patients with Liver Failure and AKI. Kidney360 2024, 5, 456. [Google Scholar] [CrossRef]
- Yun, D.; Yang, H.-L.; Kim, S.G.; Kim, K.; Kim, D.K.; Oh, K.-H.; Joo, K.W.; Kim, Y.S.; Han, S.S. Real-Time Dual Prediction of Intradialytic Hypotension and Hypertension Using an Explainable Deep Learning Model. Sci. Rep. 2023, 13, 18054. [Google Scholar] [CrossRef]
- Koirala, P.; Thongprayoon, C.; Miao, J.; Garcia Valencia, O.A.; Sheikh, M.S.; Suppadungsuk, S.; Mao, M.A.; Pham, J.H.; Craici, I.M.; Cheungpasitporn, W. Evaluating AI Performance in Nephrology Triage and Subspecialty Referrals. Sci. Rep. 2025, 15, 3455. [Google Scholar] [CrossRef] [PubMed]
- Pham, J.H.; Thongprayoon, C.; Miao, J.; Suppadungsuk, S.; Koirala, P.; Craici, I.M.; Cheungpasitporn, W. Large Language Model Triaging of Simulated Nephrology Patient Inbox Messages. Front. Artif. Intell. 2024, 7, 1452469. [Google Scholar] [CrossRef]
- Khalid, F.; Alsadoun, L.; Khilji, F.; Mushtaq, M.; Eze-odurukwe, A.; Mushtaq, M.M.; Ali, H.; Farman, R.O.; Ali, S.M.; Fatima, R.; et al. Predicting the Progression of Chronic Kidney Disease: A Systematic Review of Artificial Intelligence and Machine Learning Approaches. Cureus 2024, 16, e60145. [Google Scholar] [CrossRef]
- Takkavatakarn, K.; Oh, W.; Cheng, E.; Nadkarni, G.N.; Chan, L. Machine Learning Models to Predict End-Stage Kidney Disease in Chronic Kidney Disease Stage 4. BMC Nephrol. 2023, 24, 376. [Google Scholar] [CrossRef]
- Saito, H.; Yoshimura, H.; Tanaka, K.; Kimura, H.; Watanabe, K.; Tsubokura, M.; Ejiri, H.; Zhao, T.; Ozaki, A.; Kazama, S.; et al. Predicting CKD Progression Using Time-Series Clustering and Light Gradient Boosting Machines. Sci. Rep. 2024, 14, 1723. [Google Scholar] [CrossRef]
- Chen, J.; Fan, H.; Shao, D.; Dai, S. MRFA-Net: Kidney Segmentation Method Based on Multi-Scale Feature Fusion and Residual Full Attention. Appl. Sci. 2024, 14, 2302. [Google Scholar] [CrossRef]
- Hu, W.; Yang, S.; Guo, W.; Xiao, N.; Yang, X.; Ren, X. STC-UNet: Renal Tumor Segmentation Based on Enhanced Feature Extraction at Different Network Levels. BMC Med. Imaging 2024, 24, 179. [Google Scholar] [CrossRef] [PubMed]
- Giordano, A.; Cancilla, N.; Martín-Guerrero, J.D.; Vives-Gilabert, Y.; Ciofalo, M.; Micale, G.; Tamburini, A. A Machine Learning-Based Surrogate Model of a Hemodialyzer for the Prediction of the Urea Dialyzer Clearance. In Proceedings of the Artificial Intelligence in Healthcare, Cambridge, UK, 8–10 September 2025; Cafolla, D., Rittman, T., Ni, H., Eds.; Springer Nature Switzerland: Cham, Switzerland, 2026; pp. 263–276. [Google Scholar] [CrossRef]
- Nicosia, A.; Cancilla, N.; Di Liberti, E.; Guerrero, J.D.M.; Gilabert, Y.V.; Ferrantelli, A.; Iacono, F.; Brucato, V.M.B.; La Carrubba, V.; Tinnirello, I.; et al. Performance Comparison of Machine Learning Models for the Prediction of Dialysis Treatment Variables. In Proceedings of the Artificial Intelligence in Healthcare, Cambridge, UK, 8–10 September 2025; Cafolla, D., Rittman, T., Ni, H., Eds.; Springer Nature: Cham, Switzerland, 2026; pp. 157–170. [Google Scholar] [CrossRef]
- Nicosia, A.; Cancilla, N.; Passerini, M.; Sau, F.; Tinnirello, I.; Cipollina, A. Performance Comparison of a Neural Network and a Regression Linear Model for Predictive Maintenance in Dialysis Machine Components. Bioengineering 2025, 12, 941. [Google Scholar] [CrossRef]


| Accuracy | (2) | |
| Specificity | (3) | |
| Recall | (4) | |
| Precision | (5) | |
| Fβ-Score | (6) | |
| FPR | (7) | |
| AP | (8) | |
| mAP | (9) | |
| Dice coefficient | (10) | |
| MCC | (11) |
| R2 Score | (12) | |
| MSE | (13) | |
| MAE | (14) | |
| RMSE | (15) | |
| C-index | (16) |
| Model Category | Models Used in Nephrology | Strengths | Limitations | Applications | Performance Metrics |
|---|---|---|---|---|---|
| Classification and Regression models | Logistic Regression, Ridge, LASSO, ElasticNet, SVM, Decision Tree, Random Forest, Extra Trees, kNN, Gradient Boosting | Linear models: simple, well-validated, highly interpretable, robust with small datasets; Tree-based/ boosting: capture non-linear relationships, handle missing data, high predictive accuracy, moderately interpretable | Linear models: cannot capture complex interactions; Tree-based/ boosting: risk of overfitting if not tuned, limited temporal modeling | Clinical risk prediction, hospitalization risk, EHR-based stratification | Linear models: AUC-ROC, Accuracy, C-index; Tree-based/ boosting: AUC-ROC, Fβ-Score |
| Feedforward Neural Networks | ANN, MLP | Capture complex non-linear patterns, flexible architectures | Require careful tuning, risk of overfitting with small data, less interpretable | CKD staging, prognosis prediction, comorbidity classification | Accuracy, AUC-ROC, Fβ-Score |
| Convolutional Neural Networks | CNN, U-Net, ResNet, DenseNet | State-of-the-art for image analysis, automatic feature extraction | Require large annotated datasets and resources, black-box nature | Kidney biopsy segmentation, CT/MRI classification | Dice coefficient, Accuracy, Fβ-Score |
| Transformer-based models | ViT, multimodal attention-based models | Strong performance on large-scale imaging, enable multimodal data fusion | Still emerging in nephrology, very data- and compute-intensive | Whole-slide image classification, multimodal pipelines | Accuracy, AUC-ROC, Fβ-Score |
| Recurrent Neural Networks | SimpleRNN, LSTM, GRU | Capture temporal dependencies, ideal for longitudinal monitoring | Computationally expensive, prone to overfitting with scarce data | Dialysis session forecasting, ICU time-series risk modeling | AUC-ROC, Fβ-Score, RMSE, MAE |
| Hybrid models | CNN-RNN, multimodal architectures | Combine multiple modalities, allow survival analysis and uncertainty quantification | Complex training and tuning, lower transparency | Multimodal risk prediction, personalized therapy optimization | C-index, AUC-ROC |
| Authors and Ref. | Year of Publication | Models | Dataset | Input Variables | Best Results | Aim |
|---|---|---|---|---|---|---|
| Akatsuka et al. [176] | 2022 | DenseNet model | 24 glomerular WSIs of mice from Collagen Type IV Alpha 3 Chain Knock-Out (Col4a3 KO) mice; and from ADRamycin (ADR)-induced nephropathy mice | Structural and morphological features extracted by the model | Accuracy: 90% | Automatic evaluation of renal pathology through the detection of glomerular lesions in the renal tissues |
| Alikhan et al. [151] | 2023 | SACNN model + SOA algorithm | 400 records from the ML repository of the University of California, Irvine, CA, USA | 24 (demographic information, clinical variables, and laboratory data) | F1-Score: ≃96% Accuracy: ≃99% | Diagnosis and classification of CKD patients via IoT devices and cloud platforms |
| Al-Momani et al. [148] | 2022 | ANN model SVM model kNN model | 400 records from the ML repository of the University of California, Irvine, CA, USA | 13 (demographic information, clinical variables, and laboratory data) | Accuracy (ANN model): 99.20% | Diagnosis and classification of CKD based on patients’ data |
| Alsadi et al. [149] | 2020 | VGG-16 model VGG-19 model InceptionResNet-v2 model ResNet model NASNet model Inception-v3 model (transfer learning with pre-trained CNN for all six models) | 900 EM images from native and transplant kidney biopsies from the University of Illinois Hospital & Health Sciences System, Chicago, IL, USA | Structural and morphological features extracted by the model | Accuracy (VGG-19 model): 78% F1-Score (VGG-19 model): ≃78% | Automatic evaluation of renal pathology by the identification of immune biological materials in renal biopsies |
| Altalbe et al. [159] | 2023 | CNN model | 12,446 CT images from several undefined hospitals in Dhaka, Bangladesh | Structural and morphological features extracted by the model | F1-Score: 98.70% Accuracy: 99.20% | Diagnosis and classification of cysts, tumors, stones, and normal conditions using CT images |
| Asif et al. [165] | 2023 | StoneNet model | 1799 CT images of 433 health patients or with renal stones from Elazıg Fethi Sekin City Hospital, Elazıg, Turkey | Structural and morphological features extracted by the model | Accuracy: 97.98% F1-Score: 97.87% | Detection of kidney stones in diseased patients for mobile devices |
| Bhaskar et al. [180] | 2019 | CNN model + SVM model | 1000 saliva samples from 102 healthy and unhealthy patients from Vellore Institute of Technology (VIT), Tamil Nadu, India | Raw sensor signals extracted by the model | Accuracy: 98.04% R2: 97.99% | Detection of CKD patients based on urea concentration from saliva samples |
| Ginley et al. [169] | 2021 | DeepLab-v3 model DeepLab-v3 model + ResNet model | 205 WSIs of fibrosis and glomerulosclerosis pathologies from five hospitals in Portugal, USA, and Republic of Korea | Structural and morphological features extracted by the model | MCC (DeepLab-v3 model + ResNet-50): 67% (IFTA), 89% (non-sclerotic glomeruli), 66% (glomerulosclerosis) | Automated detection of patients with IFTA, non-sclerotic glomeruli and glomerulosclerosis using WSIs |
| Gondim et al. [167] | 2023 | AI-based image classifier on Google AutoML Vision platform | 252 renal neoplasm WSIs from four health institutions, USA | Structural and morphological features extracted by the model | AUC-PR: 93% | Detection and classification of patients with kidney neoplasms using WSIs |
| Granal et al. [152] | 2022 | BNN model | 375 adult CKD patients from the Hopital Edouard Herriot, Lyon, France | 25 (demographic data, previous pathologies, vital signs, medications, and nutritional parameters) | Accuracy: 74% | Estimation of potassium intake in CKD patients |
| Hao et al. [161] | 2022 | MN-Net model ResNet model | 1199 WSIs of 1281 MN and healthy patients from the Second Hospital of Shanxi Medical University, Taiyuan, China; and from Shanxi Provincial People’s Hospital, Taiyuan, China | Structural and morphological features extracted by the model | Precision (MN-Net model): 95.34% F1-Score (MN-Net model): 97.62% Accuracy (MN-Net model): 95.69% | Diagnosis of MN patients through the detection and classification of glomeruli in renal pathological images |
| Hayashi [179] | 2019 | Re-RX model | 1466 diabetic and pre-diabetic patients from the National Health And Nutrition Examination Survey (NHANES) database, USA | 19 (demographic information, previous pathologies, clinical variables, patient habits, and metabolic variables) | Accuracy: 77.56% AUC-ROC: 75% | Detection of diabetic kidney diseases based on urinary Albumin-to-Creatinine Ratio (ACR) values |
| Jayapandian et al. [158] | 2021 | U-Net model | 459 WSIs of 125 Minimal Change Disease (MCD) patients from the NEPTUNE digital pathology repository, North America, USA | Structural and morphological features extracted by the model | F1-Score: 94% | Diagnosis of CKD patients by automatic segmentation of histological structures of kidney tissue |
| Jhumka et al. [168] | 2023 | ResNet model | 9527 CT images from several hospitals in Bangladesh, released by the online source Kaggle database, Google LLC, Mountain View, CA, USA; and from several hospitals in Turkey, released by the online source GitHub database, Microsoft, San Francisco, CA, USA | Structural and morphological features extracted by the model | F1-Score: ≃97% Accuracy: ≃97% | Detection and classification of patients with kidney cancers and stones using CT images |
| Khamparia et al. [147] | 2020 | Multilayer autoencoder + SoftMax probabilistic classifier | 400 records from the ML repository of the University of California, Irvine, CA, USA | 24 (demographic information, clinical variables, and laboratory data) | F1-Score: ≃100% Accuracy: ≃100% | Diagnosis of CKD among healthy and not healthy patients based on their data |
| Kumar et al. [160] | 2023 | Hybrid fuzzy-deep neural network | 5617 CKD patients from Changhua Christian Hospital, Taichung, Taiwan | 35 (demographic information, clinical variables, and previous pathologies) | Accuracy: 99.23% | Diagnosis of CKD based on patients’ data and images processing |
| Lassau et al. [153] | 2019 | ML model (unspecified) | 4170 images (whose 787 of renal cortex) from forty-six public, private hospitals, and cancer centers, France | Structural and morphological features extracted by the model | Accuracy: ≃84% (>90% specifically on renal cortex) | Detection and characterization of tissue lesions through segmentation of several tissues, including the kidney cortex |
| Les et al. [155] | 2020 | U-Net model + EMT algorithm + SSA | 1692 CT images of kidney lesions of 138 patients from the Military Institute of Medicine of Warsaw, Warsaw, Poland | Structural and morphological features extracted by the model | F1-Score: 89.30% | Detection of patients with kidney diseases by identification of kidney boundaries on CT images |
| Li et al. [164] | 2022 | 3D U-Net model Res U-Net model SegNet model DeepLab-v3 model + UNETR model | 260 renal CT scans from the First Affiliated Hospital of Guangzhou Medical University, Guangzhou, China | Structural and morphological features extracted by the model | Accuracy (Res U-Net): 99.96% | Detection of patients with kidney stones through segmentation of CT images |
| Lu et al. [174] | 2022 | BiT-S model BiT-M model | 22,081 glomerular WSIs of 157 patients with kidney cancer from Vanderbilt University Pathology, Microbiology and Immunology, Nashville, TN, USA + 2340 glomerular images for external validation from an undefined center | Structural and morphological features extracted by the model | F1-Score (BiT-M model): 77.80% (internal validation) AUC-ROC (BiT-M model): 99.40% (external validation) | Detection and classification of patients with fine-grained Global GlomeruloSclerosis (GGS) using WSIs |
| Nan et al. [177] | 2022 | SegNet model + FISS loss function + UAAN model | 400 WSIs of IgA nephropathy patients from the National Clinical Research Center of Kidney Diseases, Jinling, China + 165 histological images of colon tissue for FISS loss function validation from an undefined center | Structural and morphological features extracted by the model | Accuracy: 95.17% | Automatic detection of IgA nephropathy patients with fine-grained glomerular lesion using WSIs |
| Onthoni et al. [154] | 2020 | SSD Inception-v2 model | 110 renal polycystic Contrast-enhanced Computed Tomography (CCT) images of 97 patients from the Picture Archiving and Communication System (PACS) of Linkou Chang Gung Memorial Hospital, Taoyuan, Taiwan | Structural and morphological features extracted by the model | mAP: 94% | Automatic detection and classification of patients affected by polycystic kidney disease |
| Parakh et al. [162] | 2019 | GrayNet-SB model ImageNet-SB model Random-SB model (transfer learning with pre-trained CNN for all three models) | 535 renal polycystic CT images from a quaternary referral hospital, released by General Electric Healthcare company, Erlangen, Germany; and from Siemens Healthcare company, Little Chalfont, Buckinghamshire, UK | Structural and morphological features extracted by the model | AUC-ROC (GrayNet-SB model): 95.40% Accuracy (GrayNet-SB model): 95% | Detection of patients with stones within the urinary tract using CT scans |
| Pesce et al. [175] | 2022 | ANN feature-based model WVR model | 2772 sclerotic and non-sclerotic glomeruli images of 26 biopsies from the Department of Emergency and Organ Transplantations (DETO) of Bari University Hospital, Bari, Italy | Textural and morphological features (150 extracted manually for ANN, extracted automatically by the model for WVR) | Accuracy (ANN feature-based model): 99% F1-Score (ANN feature-based model): 95.68% | Automatic detection of patients with glomerulosclerosis using histological images of renal biopsies |
| Pilia et al. [178] | 2019 | BNN model | 71 ECGs of CKD patients from the simulation results of a modified Himeno et al. model + artificial data augmentation | 5 (ECG features) | Generic test error (unspecified): 0.01 (for calcium), 0.25 (for potassium) | Estimation of extracellular calcium and potassium concentrations causing cardiovascular disease in CKD patients |
| Ram et al. [146] | 2019 | J48 DT model NB model SVM model LR model | Records (including CKD patients) from the ML repository of the University of California, Irvine, CA, USA | Demographic information, clinical variables, and laboratory data | Accuracy (J48 DT model): 99% (for CKD patients) | Detection of breast cancer, CKD patients, and dermatological diseases based on patients’ data |
| Sabanayagam et al. [181] | 2020 | CondenseNet model Risk Factors model CondenseNet model + Risk Factors model | 12,970 retinal images of 6485 CKD and non-CKD patients from Singapore Epidemiology of Eye Diseases (SEED) Study, Singapore + 7470 images of 3735 CKD and non-CKD patients from Singapore Prospective Study Program (SP2), Singapore + 3076 images from 1538 CKD and non-CKD patients of Beijing Eye Study (BES), Beijing, China | 5 (clinical variables, previous pathologies, demographic information) + structural and morphological features extracted by the model | AUC-ROC (CondenseNet model + Risk Factors model): 93.80% (SEED), 81% (SP2), 85.80% (BES) | Detection of CKD patients using patients’ retinal images and data |
| Senan et al. [145] | 2021 | SVM model kNN model DT model RF model | 400 records of South Indian patients, released by the ML repository of the University of California, Irvine, CA, USA | 24 (demographic information, clinical variables, and laboratory data) | F1-Score (RF model): ≃100% Accuracy (RF model): ≃100% | Diagnosis and classification of CKD patients based on their data |
| Subramanian et al. [166] | 2023 | CNN model Optimized CNN model | 12,446 renal stones CT images from PACS of multiple hospitals, Bangladesh | Structural and morphological features extracted by the model | Accuracy (Optimized CNN model): ≃100% | Classification and detection of patients with cysts, renal tumors, and kidney stones using CT images |
| Tang et al. [171] | 2022 | Mask R-CNN model + DPCNN model | 1727 US biopsy images of 251 patients with nephropathy from three hospitals affiliated with Taipei Medical University, Taipei, Taiwan + artificial data augmentation | Structural and morphological features extracted by the model | Dice coefficient: (Mask R-CNN): 94.90% F1-Score (DPCNN model): 81.90% | Detection of patients with IFTA and its severity using US images |
| Tsai et al. [156] | 2022 | ResNet model (pre-trained on the ImageNet database) | 1599 pediatric US images from Taichung Veterans General Hospital, Taichung, Taiwan | Structural and morphological features extracted by the model | Accuracy: 92.90% AUC-ROC: 95.90% | Detection of pediatric renal anomalies using US images |
| Vashisth et al. [150] | 2020 | MLP model SVM model NB model | 400 CKD patients, released by Apollo Hospitals, Tamil Nadu, India, released by the ML repository of the University of California, Irvine, CA, USA + online source Kaggle database, released by Google LLC, Mountain View, CA, USA | 25 (demographic information, clinical variables, laboratory data, and previous pathologies) | Accuracy (MLP model): 92.50% | Detection of CKD based on patients’ data |
| Weis et al. [172] | 2022 | AlexNet model VGG model ResNet model DenseNet model SqueezeNet model InceptionNet model | 23,575 renal biopsy images from the Institute of Pathology, Medical Faculty at Heidelberg University, Mannheim, Germany; and from the Institute of Pathology at Johannes Gutenberg University Mainz, Mainz, Germany | Structural and morphological features extracted by the model | Accuracy (ResNet model): 94.40% | Identification of CKD patients by recognition of glomerular morphologic patterns in renal biopsies |
| Yamaguchi et al. [157] | 2020 | ResNet model (pre-trained on the ImageNet database) | 10,102 glomerular images of 293 WSIs from the University of Tokyo Hospital (UTH), Tokyo, Japan; from Tazuke Kofukai Medical Research Institute, Kitano Hospital (KH), Osaka, Japan; and from the University of Tsukuba Hospital, Tsukuba, Japan | Structural and morphological features extracted by the model | AUC-ROC: 98% (capillary collapse), 91% (fibrous crescent) | Detection of patients with renal pathologies by classification of glomerular images |
| Yi et al. [170] | 2022 | U-Net model + Mask R-CNN model | 789 transplant biopsies of 616 patients from the Genomics of Chronic Allograft Rejection (GoCAR) Study, USA; and from the AUStralian Chronic Allograft Dysfunction (AUSCAD) Study, Australia | Structural and morphological features extracted by the model | Recall: 77% (mononuclear leukocyte infiltration), 85% (IFTA) | Detection of patients with IFTA, and mononuclear leukocyte infiltration in transplantation tissues |
| Yildirim et al. [163] | 2021 | ResNet model | 1799 Non-Contrast Computed Tomography (NCCT) images of 433 healthy and unhealthy patients from Elazig Fethi Sekin City Hospital, Elazig, Turkey | Structural and morphological features extracted by the model | Accuracy: 96.82% F1-Score: 97% | Detection of patients with kidney stones using NCCT images |
| Zhang et al. [173] | 2022 | U-Net model + MANet model | 1360 biopsy renal images from the Second Hospital of Shanxi Medical University, Taiyuan, China | Structural, fluorescent, and morphological features extracted by the model | Accuracy: 98% F1-Score: >95% | Detection of patients with glomerular diseases by segmentation and classification in immunofluorescence images |
| Zhang et al. [182] | 2021 | ResNet model (pre-trained on the ImageNet database) | 115,344 ocular fundus images of 57,672 patients from China Consortium of Fundus Image Investigation (CC-FII), China; and from several hospitals in Beijing, Guangzhou, Chongqing and Tangshan, China | 8 (clinical variables, previous pathologies, ad demographic information) + structural and morphological features extracted by the model | AUC-ROC: 93% | Detection of CKD patients using ocular fundus images and clinical data |
| Authors and Ref. | Year of Publication | Models | Dataset | Input Variables | Best Results | Aim |
|---|---|---|---|---|---|---|
| Balamuthusamy et al. [192] | 2023 | XGBoost model RF model Multiple non-linear regression model | 200 prevalent hemodialysis patients with an arteriovenous graft or AVF from the Plexus EHRs LLC platform, Dallas, TX, USA | 20 (clinical variables, access intervention, previous surgeries, laboratory data, and demographic information) | Accuracy (XGBoost model): 86% | Real time risk stratification and re-intervention risk prediction on arteriovenous access of dialysis patients |
| Barbieri et al. [195] | 2019 | ANN model | 766,000 dialysis sessions from the European Clinical Database (EuCliD) platform, released by NephroCare centers, Spain | Roughly 60 (demographic information, physiological variables, pre-dialysis data, and dialysis dose) | MAE: 0.23 kg (fluid volume removal), 7.3 bpm (heart rate), 9.3 mmHg (blood pressure), 0.13 (Kt/V) | Prediction of session-specific Kt/V, fluid volume removal, heart rate, and blood pressure of dialysis patients |
| Brito et al. [196] | 2022 | IBk model kStar model REPTree model RF model RandomTree model | 2489 medical examinations from the Hospital Information System (HIS), released by Centro Hospitalar do Porto, Porto, Portugal | 8 (demographic information, and dialysis dose) | Accuracy (RF model): 95.86% | Identification and classification of the serum creatinine values in patients undergoing peritoneal dialysis procedures |
| Cheng et al. [201] | 2023 | PD AI ChatBot on LINE Application | 440 ESKD patients from the PD center of National Taiwan University Hospital, Taipei, Taiwan | Demographic information, nutritional data, and clinical variables | Degree of satisfaction: 90% | Self-management of patients undergoing peritoneal dialysis during the COVID-19 pandemic |
| Cho et al. [198] | 2022 | Cleerly platform | 79 Coronary Computed Tomography Angiographies (CCTAs) of ESKD patients from two medical centers, Los Angeles, CA, USA | Structural and morphological features extracted by the model | Specificity: 91% | Identification of Atherosclerotic Plaque Characteristics (APC) in dialysis patients |
| Hong et al. [187] | 2023 | RF model GBM model Log. Reg. model (chosen among 18 pre-selected ML algorithms) | 314,534 HD sessions of 3906 patients from Sichuan Provincial People’s Hospital, Chengdu, China | 19 (demographic information, and clinical variables) | AUC-ROC (RF model): 81.20% F1-Score (RF model): 69.90% Accuracy (RF model): 74% | Identification of intradialytic hypotension in HD patients before initiating the treatment |
| Hong [194] | 2021 | CNN model | 300 angiography images of 100 Maintenance HemoDialysis (MHD) patients from the Department of Gastroenterology of Tonglu First People’s Hospital, Hangzhou, Zhejiang, China | Clinical variables, adverse events, and morphological features extracted by the model | MSE: 0.005 | Improvement of angiography images resolution performed on arteriovenous accesses of hemodialysis patients |
| Kanda et al. [199] | 2020 | Clustering model + SVM models Log. Reg. model DL model SVM model | 79,860 ESKD patients from the Japanese Society for Dialysis Therapy (JSDT) Renal Data Registry, released by hospitals and clinics in Japan | 20 (demographic information, previous pathologies, and clinical variables) | Accuracy (Clustering model + SVM models): 94.80% (1 year apart) | Early screening of hemodialysis patients at a high risk of death |
| Li et al. [184] | 2022 | bCOWOA-KELM model | 1239 HD sessions of 156 patients from the First Affiliated Hospital of Wenzhou Medical University, Zhejiang, China + 6 ICU datasets from the ML repository of the University of California, Irvine, CA, USA | Demographic information, and clinical variables (36 for Wenzhou’s dataset, n.a. for California’s dataset) | Accuracy: 92.41% F1-Score: 93.36% | Prediction of IDH in hemodialysis patients using indices of blood routine tests |
| Mendoza-Pitti et al. [185] | 2022 | Log. Reg. model RF model MLP model XGBoost model | 22,234 HD sessions of 299 patients from the Hospital Universitario Príncipe de Asturias, Madrid, Spain | 20 (demographic information, previous pathologies, and clinical variables) | AUC-ROC (XGBoost model): 96.90% F1-Score (XGBoost model): 86% AUC-PR (XGBoost model): 94.50% | Prediction of the occurrence of IDH or non-IDH in HD patients at the beginning of the treatment |
| Mohammed et al. [186] | 2023 | RDLCDC-IDH model | 1000 HD patients from undefined hospitals | Biometric data and clinical variables | F1-Score: 97.70% Accuracy: 97.70% | Diagnosis and classification of IDH in hemodialysis patients |
| Ota et al. [191] | 2020 | CNN model + LSTM model + GRU model | 3994 AVF sounds of 20 patients from Gamagori Municipal Hospital, Gamagori-shi, Aichi, Japan | Acoustic features extracted by the model | AUC-ROC: 75–92% Accuracy: 82% | Diagnosis of stenosis through evaluation of AVF sounds |
| Othman et al. [189] | 2022 | MLP model kNN model SVM model DT model GBM model Bagging technique Voting technique RF model | 6000 HD sessions of 215 adult patients from the Dialysis unit of El-Mowasah University Hospital, Alexandria, Egypt | 12 (clinical variables, environmental information, dialysis characteristics, machine parameters, and nutritional data) | Accuracy (RF model): 98% F1-Score (GBM model): 92% | Early prediction of the most frequent hemodialysis complications |
| Qarajeh et al. [200] | 2023 | ChatGPT 3.5 ChatGPT 4 Bard AI Bing Chat | 240 food items selected from the Mayo Clinic Renal Diet Handbook for CKD patients, USA | Nutritional data extracted by the model | Accuracy (ChatGPT 4): 81% (potassium) Precision: (Bard AI): ≃100% (phosphorus) | Categorization of foods into high or low potassium and high phosphorus content |
| Shih et al. [188] | 2020 | CNN model Transfer learning with a pre-trained VGG-16 + CNN model | 80 physiological measures of each of 30 HD patients from the Division of Nephrology of Taichung Veterans General Hospital, Taichung, Taiwan | 8 (clinical variables) | Accuracy (Transfer learning with a pre-trained VGG-16 + CNN model): 99% | Early warning of dialysis discomfort as hypotension, hypertension, and cramps in hemodialysis patients |
| Song et al. [190] | 2023 | ResNet model + ANN model | 153 AVF sounds of 40 patients with mature AVF from several hospitals, Taiwan | Combination of input features typology based on Fourier transform and sample entropy | F1-Score: >90% Accuracy: >90% | Home detection of AVF stenosis using audio recordings |
| Tan et al. [197] | 2022 | YOLACT model Mask R-CNN model | 1385 LUS images of 76 patients from the Division of Renal Medicine of Khoo Teck Puat Hospital, Singapore + Microsoft Common Objects in COntext (COCO) data for model pre-training | Demographic characteristics, vital signs, clinical variables, and bioimpedance + structural and morphological features extracted by the model | Accuracy: ≃69% Recall: 83.30% Precision: 65.30% | Identification of fluids overload in hemodialysis patients using US images |
| Zhang et al. [193] | 2021 | Transfer learning with a pre-trained model from Amazon SageMaker platform + CNN model | 1341 arteriovenous access images from 20 dialysis clinics across six States, USA | Structural and morphological features extracted by the model | AUC-ROC: 96% | Classification of arteriovenous access aneurysms in hemodialysis patients |
| Authors and Ref. | Year of Publication | Models | Dataset | Input Variables | Best Results | Aim |
|---|---|---|---|---|---|---|
| Díez-Sanmartín et al. [205] | 2023 | Clustering models + XGBoost model + FCDR algorithm | 44,663 adults awaiting transplantation from the Organ Procurement and Transplantation Network (OPTN) medical dataset, USA | 7 (sociodemographic information) | AUC-ROC: 99.08% | Prediction of survival time for dialyzed patients on the kidney transplant waiting list |
| Garbelli et al. [211] | 2022 | BINCM model CORN model REGM model | 46,292 blood flow measurements in AVFs of 5940 HD patients from Czech Republic, Portugal, Slovakia, and Spain | 49 (demographic information, clinical variables, and machine parameters) | MAE (BINCM model): 0.27 | Prediction of AVF flow level in hemodialysis patients during the treatment |
| Gotta et al. [208] | 2021 | RF model | 363 HD patients from several DaVita Kidney Care centers, USA | 12 (demographic information, laboratory data, and dialysis characteristics) | Accuracy: 81% | Identification of key predictors for 5-year mortality in pediatric and young adult patients undergoing hemodialysis |
| Kong et al. [215] | 2021 | SVM model + RF model + kNN model + Log. Reg. model | 23,992 PD patients from the Hospital Quality Monitoring System (HQMS), China | 15 (demographic information, clinical variables, reason for admission, and previous pathologies) | AUC-ROC: 75.70% Accuracy: 69.50% | Prediction of the p-LOS risk for peritoneal patients |
| Liao et al. [210] | 2023 | kNN model Gaussian NB model Log. Reg. model SVM model MLP model DT model RF model AdaBoost model GBM model LGBM model Vote classifiers with tests on all models | 242 MHD patients from Wenjiang Hemodialysis Center of the Department of Nephrology in West China Hospital, Sichuan University, Chengdu, China | Demographic information, body measurement results, and laboratory data (4 for women, 3 for men) | AUC-ROC: 87.40% (for men), 77.69% (for women) F1-Score: 77.32% (for men), 78.04% (for women) For men: vote classifier composed by Log. Reg. model + AdaBoost model + LGBM model For women: SVM model | Early identification of simple sarcopenia for MHD patients |
| Monaghan et al. [212] | 2021 | XGBoost model | 40,490 HD patients from a national network of dialysis clinics, MA, USA | 81 (laboratory data, and clinical variables) | AUC-ROC: 68% | Prediction of the risk of HD patients having a COVID-19 infection within three days |
| Noh et al. [206] | 2020 | DT model Bagging model RF model SVM model ANN model Log. Reg. model LSTM model + Autoencoder model Ridge model LASSO model Survival Tree model | 1730 PD patients from the Clinical Research Center for ESRD dataset, released by 36 general and teaching hospitals, Republic of Korea | 23 (demographic information, clinical variables, previous pathologies, and laboratory data) | AUC-ROC (LSTM model + Autoencoder model): 85.80% C-index (Survival Tree model): 76.90% | Prediction of the mortality risk in peritoneal dialysis patients |
| Ohara et al. [209] | 2021 | AISACS model | 298 HD sessions of 16 patients from Kobayashi Medical Clinic, Okayama, Japan + 7937 HD sessions of 211 patients from Shigei Medical Research Hospital, Okayama, Japan | 4 (blood parameters) | Accuracy: up to 87% | Management of patient anemia based on blood parameters of hemodialysis patients |
| Siga et al. [207] | 2020 | Optimized BNN model Log. Reg. model | 4915 HD patients from the prospective cohort study Photo-Graph-v3, released by a multicenter sample of nephrologists, France | 14 (demographic information, laboratory data, and dialysis characteristics) | AUC-ROC (Optimized BNN model): 78% | Prediction of all-cause mortality in hemodialysis patients |
| Tang et al. [213] | 2023 | LGBM model CatBoost model RF model XGBoost model | 433 HD patients from Taipei VGH, Taipei, Taiwan | 29 (demographic information, laboratory data, previous diseases, and vaccination information) | F1-Score (LGBM model): 95% | Prediction of the survival impact for partial COVID-19 vaccination in hemodialysis patients |
| Wu et al. [214] | 2020 | CART model RF model GBM model | 22,859 PD patients from the HQMS, China | 34 (demographic information, previous diseases, and clinical data) | AUC-ROC (RF model): 75.60% | Prediction of the p-LOS risk in peritoneal dialysis patients |
Disclaimer/Publisher’s Note: The statements, opinions and data contained in all publications are solely those of the individual author(s) and contributor(s) and not of MDPI and/or the editor(s). MDPI and/or the editor(s) disclaim responsibility for any injury to people or property resulting from any ideas, methods, instructions or products referred to in the content. |
© 2025 by the authors. Licensee MDPI, Basel, Switzerland. This article is an open access article distributed under the terms and conditions of the Creative Commons Attribution (CC BY) license (https://creativecommons.org/licenses/by/4.0/).
Share and Cite
Nicosia, A.; Cancilla, N.; Martín Guerrero, J.D.; Tinnirello, I.; Cipollina, A. Artificial Intelligence in Nephrology: From Early Detection to Clinical Management of Kidney Diseases. Bioengineering 2025, 12, 1069. https://doi.org/10.3390/bioengineering12101069
Nicosia A, Cancilla N, Martín Guerrero JD, Tinnirello I, Cipollina A. Artificial Intelligence in Nephrology: From Early Detection to Clinical Management of Kidney Diseases. Bioengineering. 2025; 12(10):1069. https://doi.org/10.3390/bioengineering12101069
Chicago/Turabian StyleNicosia, Alessia, Nunzio Cancilla, José David Martín Guerrero, Ilenia Tinnirello, and Andrea Cipollina. 2025. "Artificial Intelligence in Nephrology: From Early Detection to Clinical Management of Kidney Diseases" Bioengineering 12, no. 10: 1069. https://doi.org/10.3390/bioengineering12101069
APA StyleNicosia, A., Cancilla, N., Martín Guerrero, J. D., Tinnirello, I., & Cipollina, A. (2025). Artificial Intelligence in Nephrology: From Early Detection to Clinical Management of Kidney Diseases. Bioengineering, 12(10), 1069. https://doi.org/10.3390/bioengineering12101069