
Manipulating Intracellular Oxidative Conditions to Enhance Porphyrin Production in Escherichia coli


Abstract
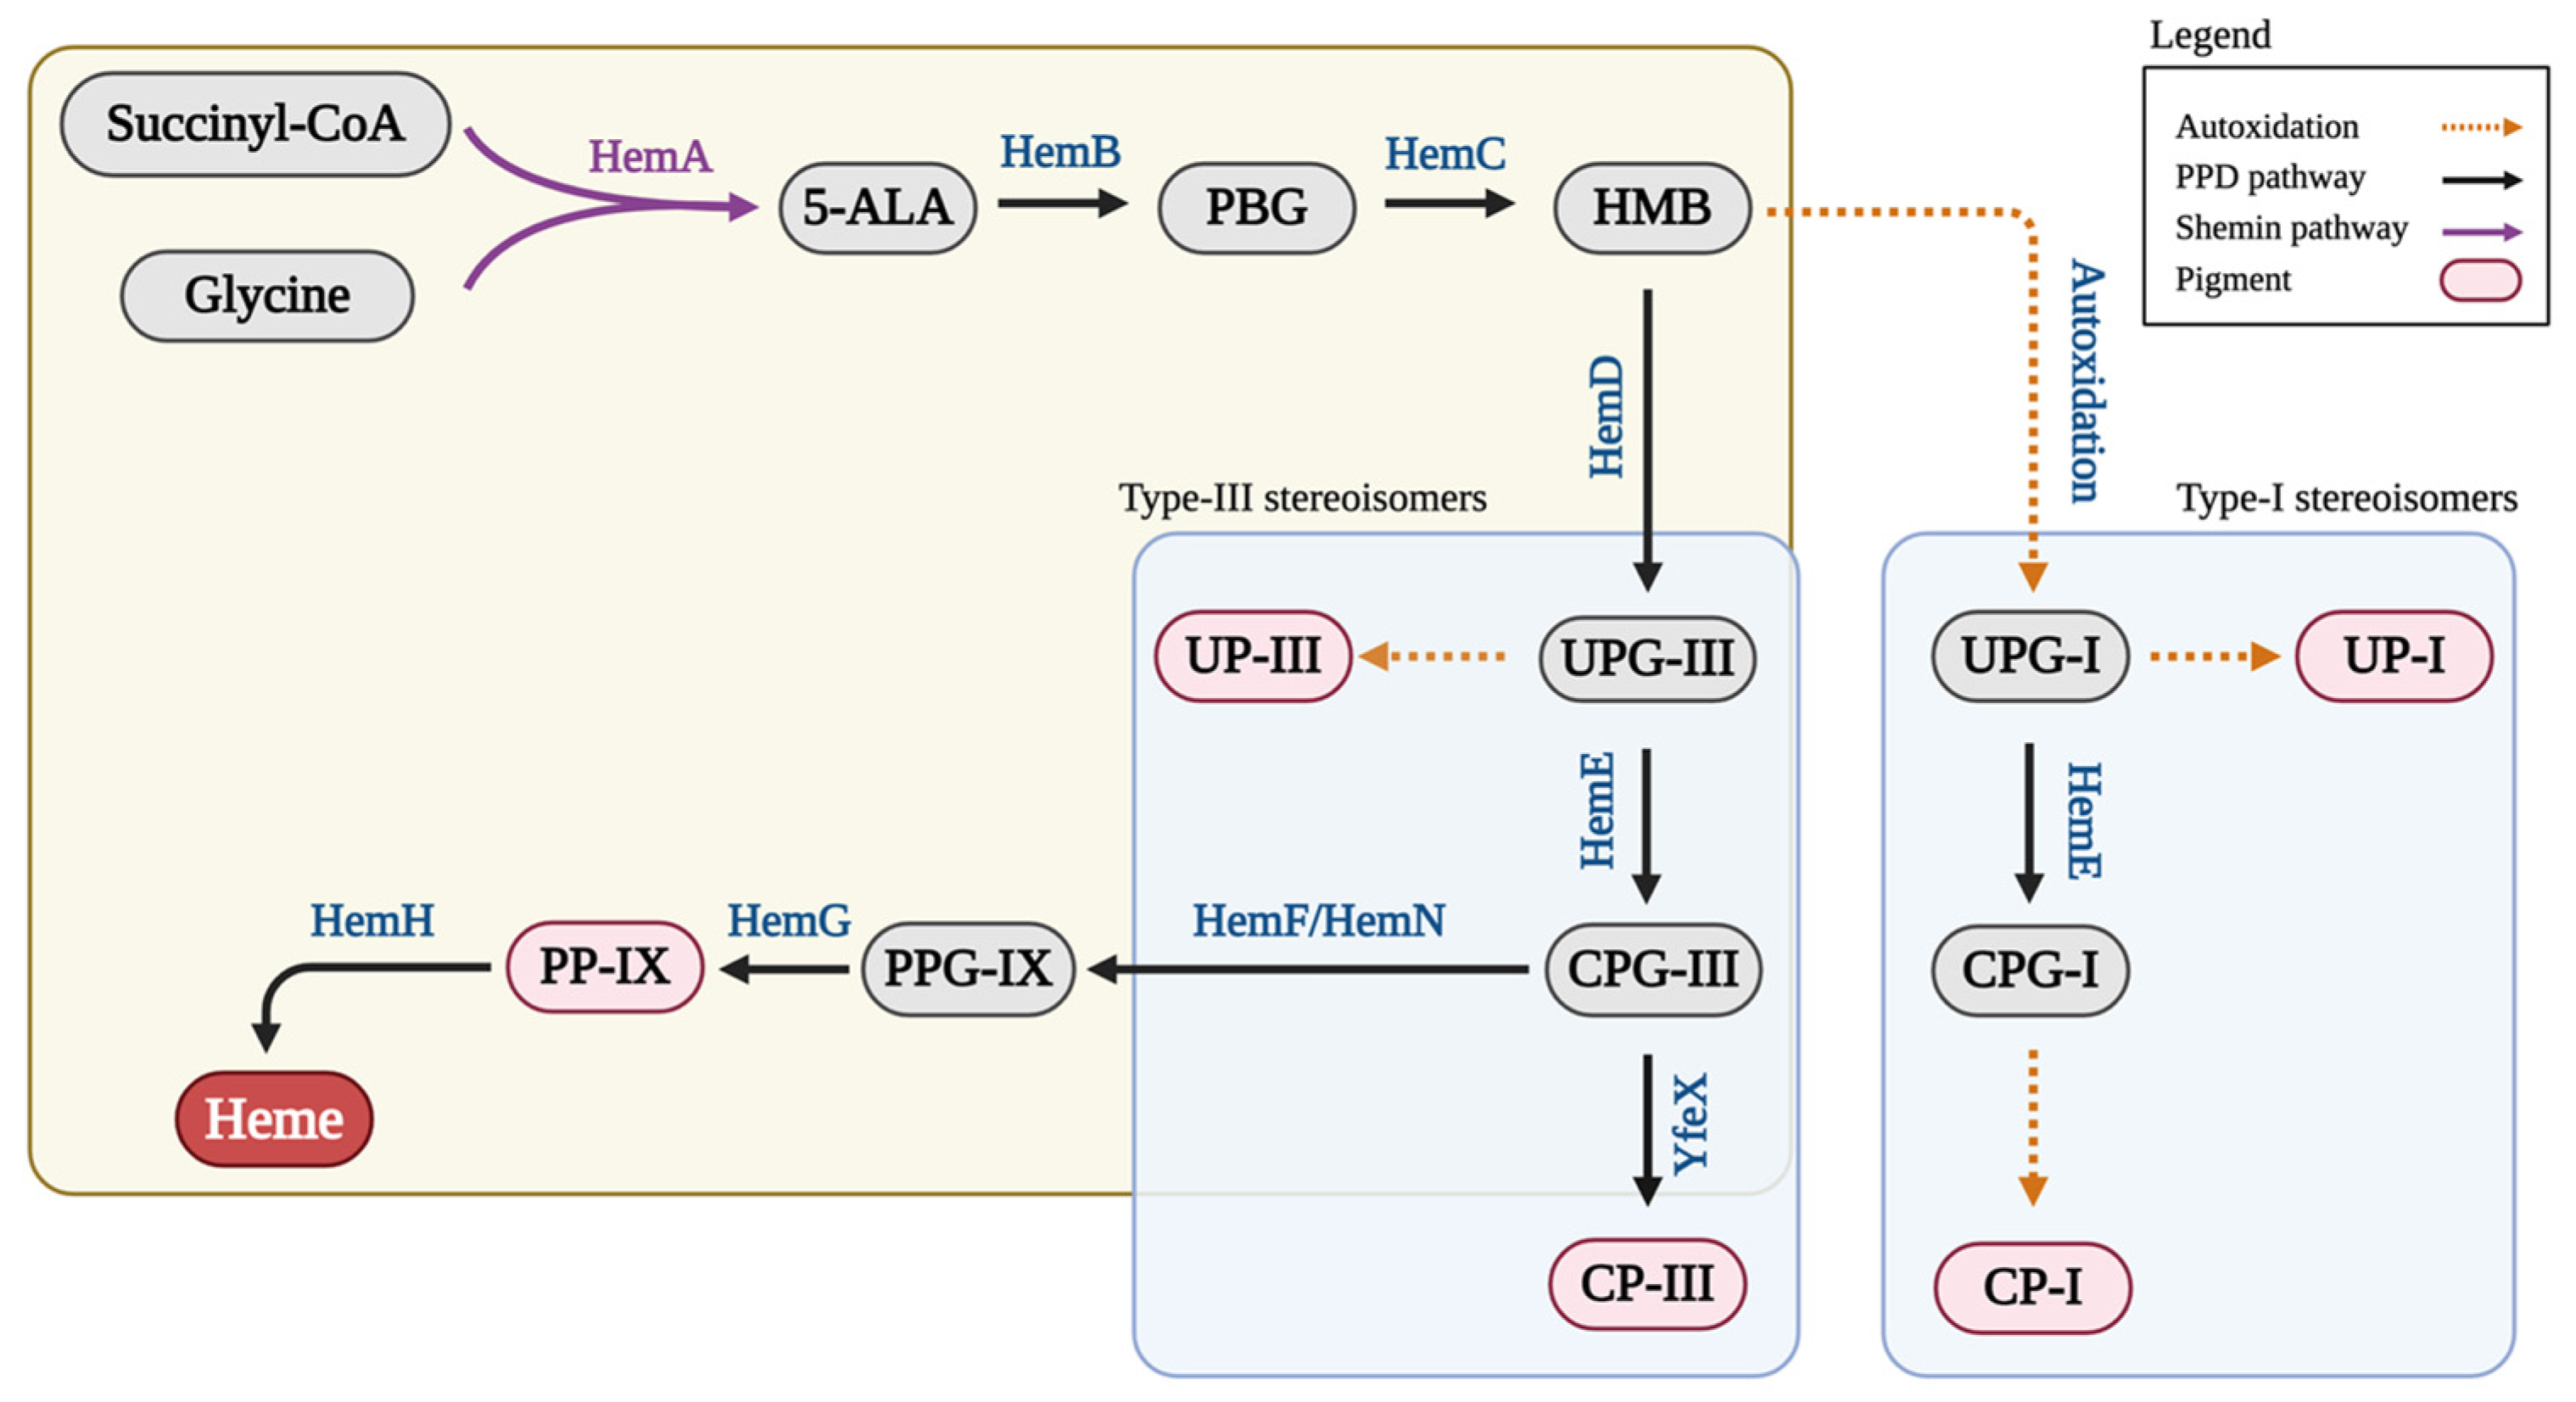
1. Introduction
2. Materials and Methods
2.1. Bacterial Strains and Plasmids
2.2. Media and Bacterial Cell Cultivation
2.3. Analysis
3. Results
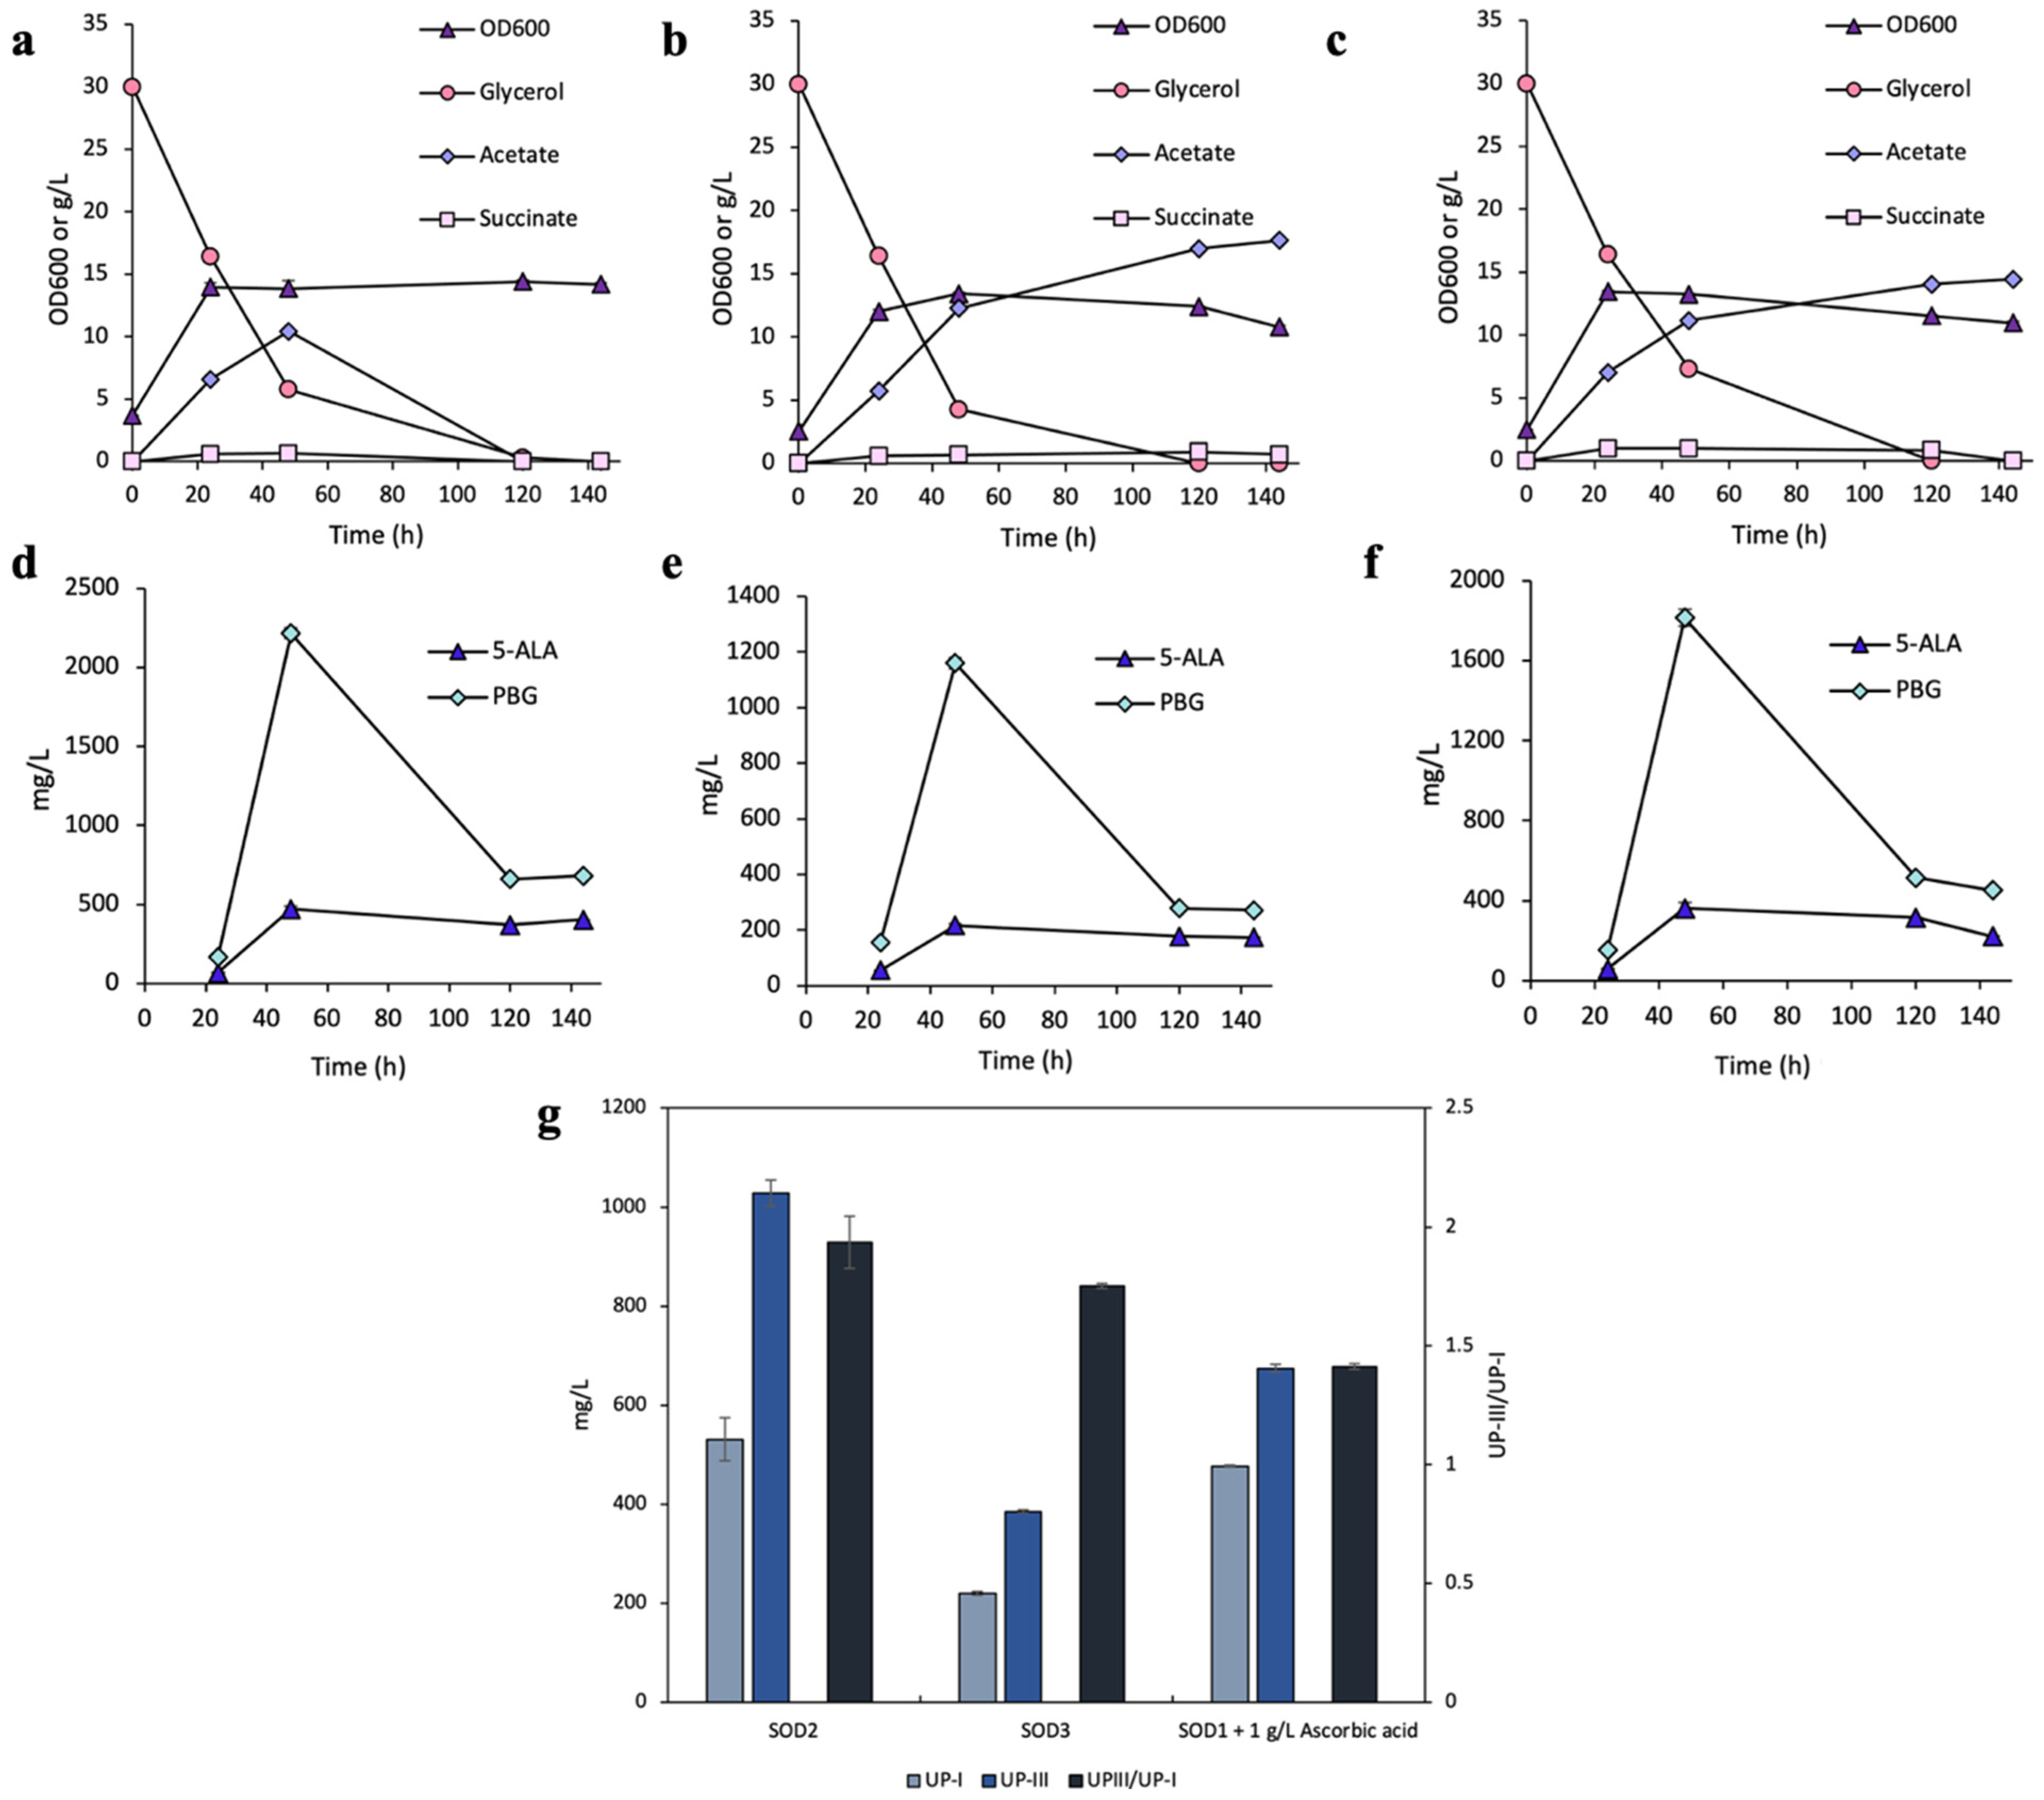
3.1. Effects of Ascorbic Acid Supplementation on UP Biosynthesis
3.2. Effects of SODs on UP Biosynthesis
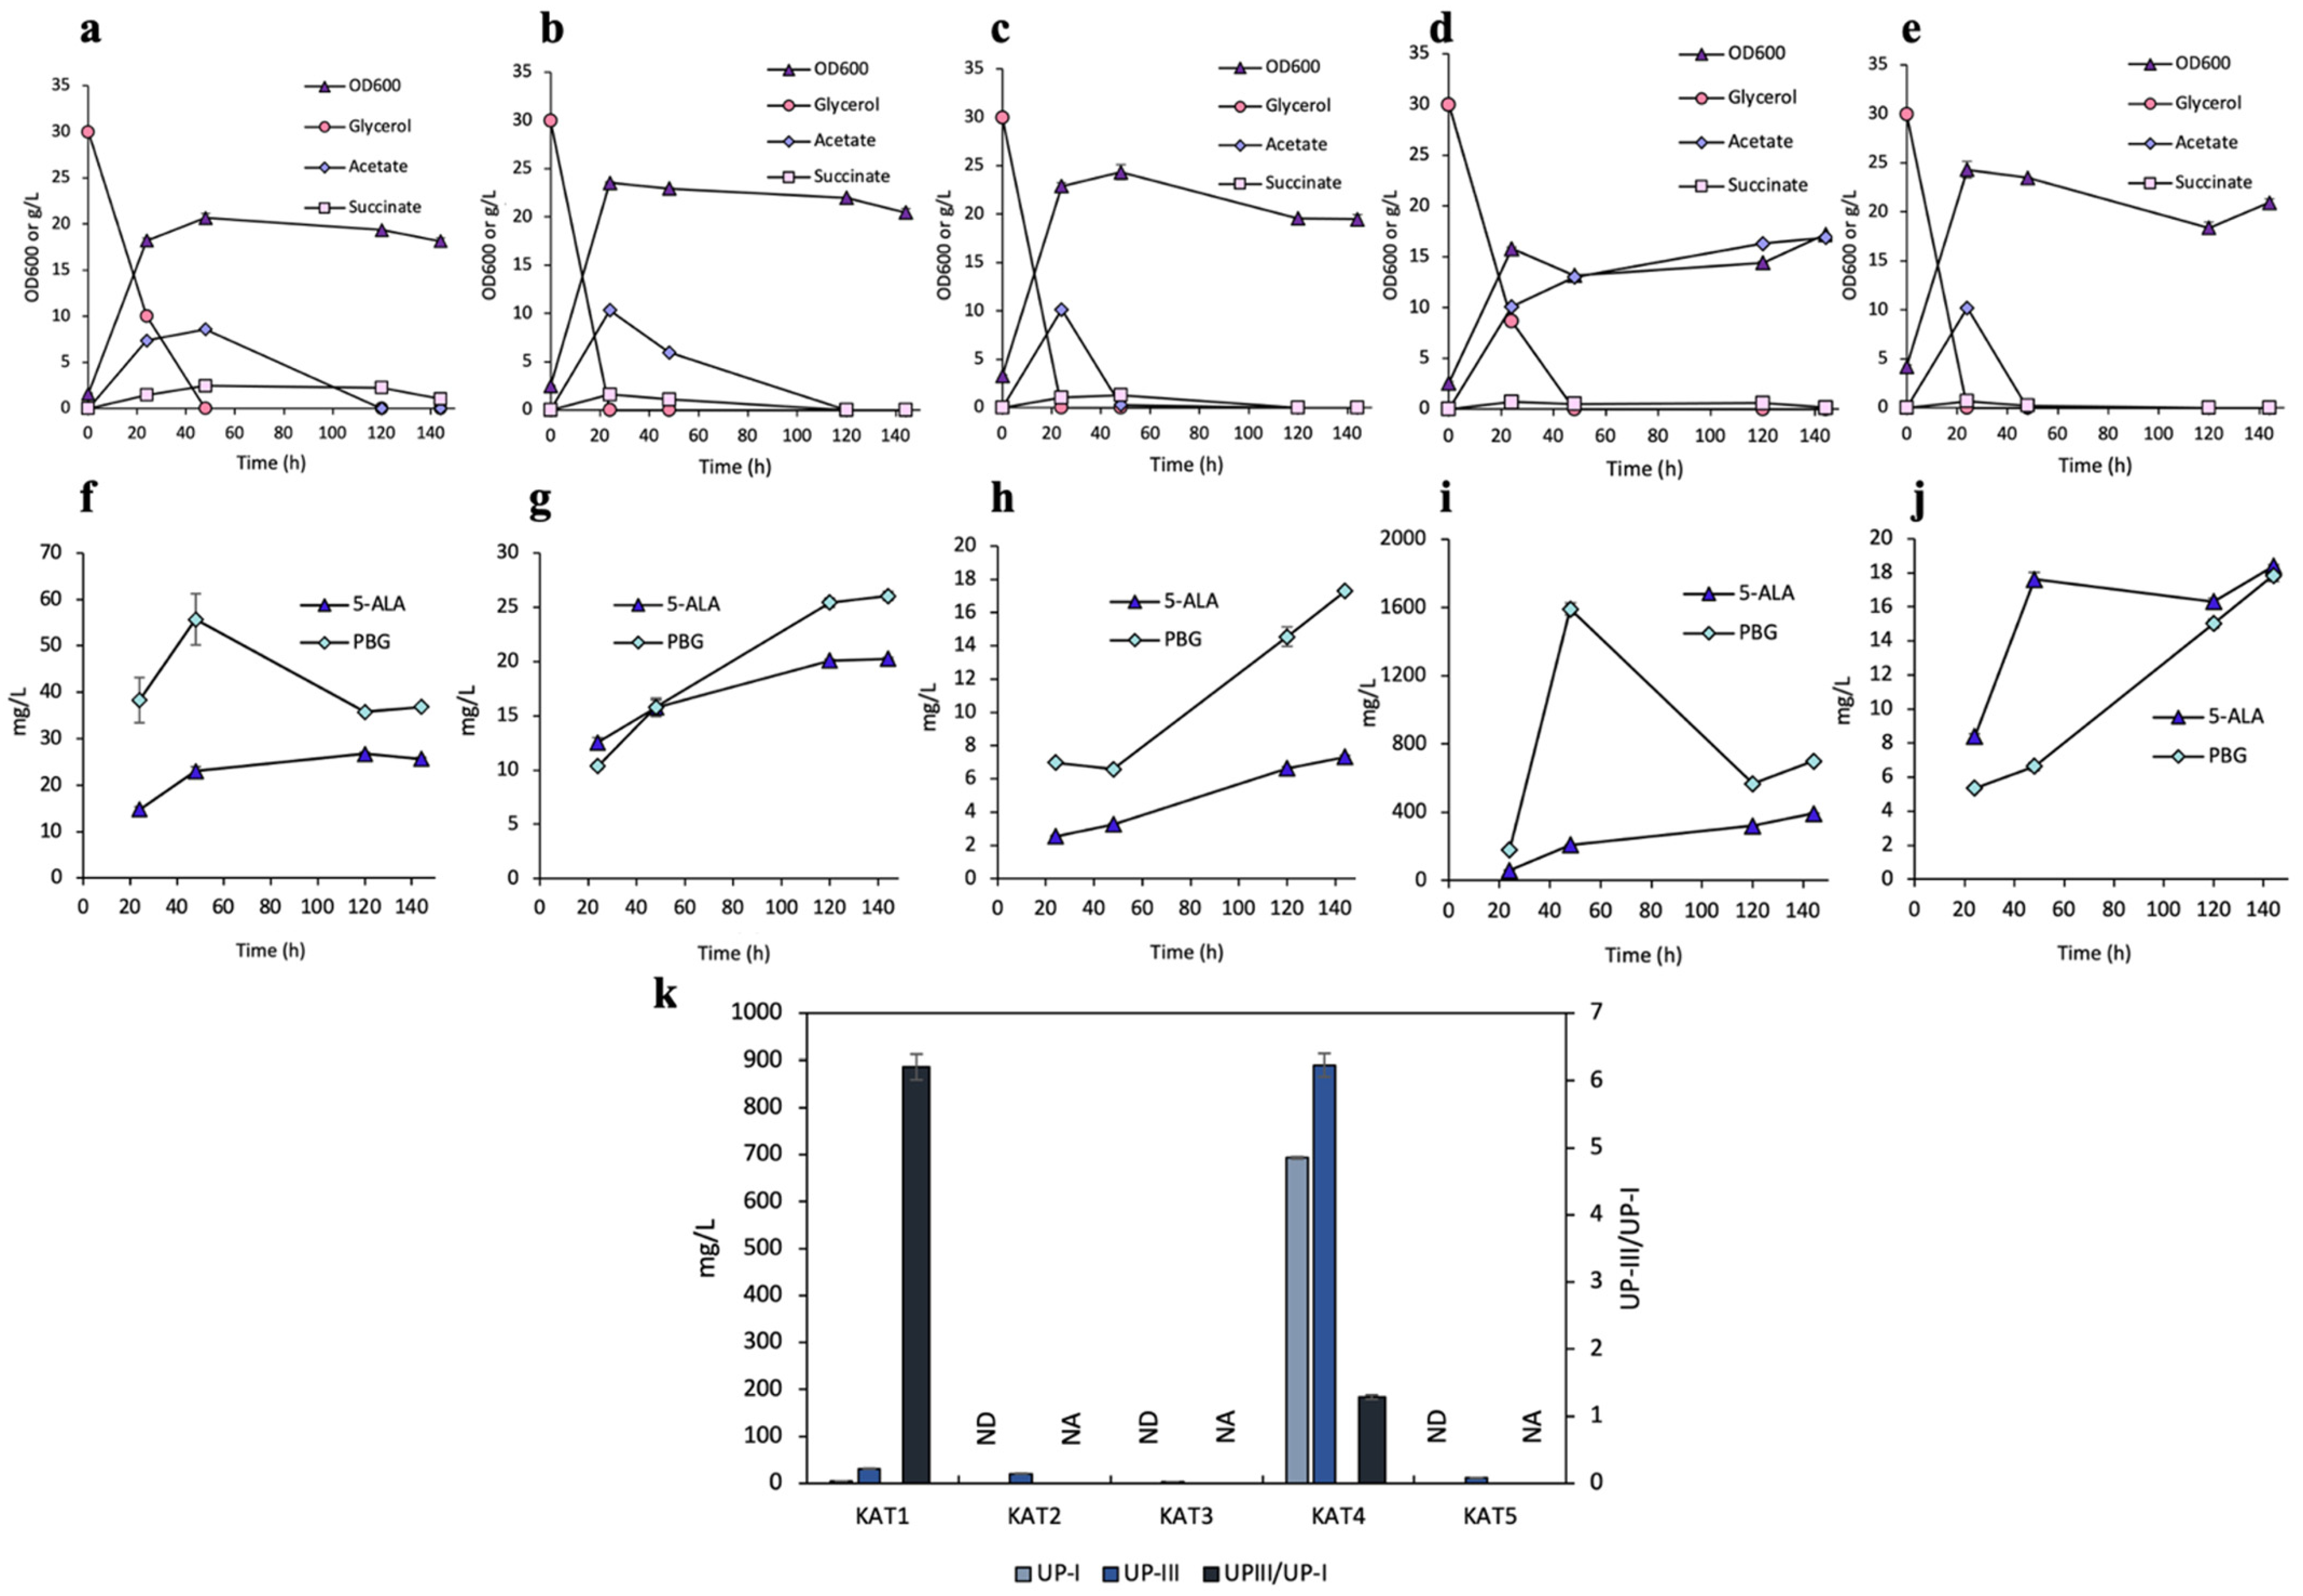
3.3. Effects of Catalases on UP Biosynthesis
4. Discussion
Supplementary Materials
Author Contributions
Funding
Data Availability Statement
Conflicts of Interest
References
- Shemin, D. Porphyrin synthesis: Some particular approaches. Ann. N. Y. Acad. Sci. 1975, 244, 348–355. [Google Scholar] [CrossRef] [PubMed]
- Mauzerall, D.C. Evolution of porphyrins. Clin. Dermatol. 1998, 16, 195–201. [Google Scholar] [CrossRef]
- Schlicke, H.; Richter, A.; Rothbart, M.; Brzezowski, P.; Hedtke, B.; Grimm, B. Function of tetrapyrroles, regulation of tetrapyrrole metabolism and methods for analyses of tetrapyrroles. Procedia Chem. 2015, 14, 171–175. [Google Scholar] [CrossRef]
- Beale, S.I. Biosynthesis of hemes. EcoSal Plus 2007, 2, 731–748. [Google Scholar] [CrossRef] [PubMed]
- Shemin, D. On the synthesis of heme. Naturwissenschaften 1970, 57, 185–190. [Google Scholar] [CrossRef]
- Kang, D.-K.; Kim, S.-S.; Chi, W.-J.; Hong, S.-K.; Kim, H.-K.; KIM, H.-U. Cloning and Expression of the Rhodobacter capsulatus hemA Gene in E. coli for the Production of S-Aminolevulinic Acid. J. Microbiol. Biotechnol. 2004, 14, 1327–1332. [Google Scholar]
- Jordan, P.M.; Shemin, D. 11 δ-Aminolevulinic Acid Synthetase. In The Enzymes; Elsevier: Amsterdam, The Netherlands, 1972; Volume 7, pp. 339–356. [Google Scholar]
- Layer, G.; Reichelt, J.; Jahn, D.; Heinz, D.W. Structure and function of enzymes in heme biosynthesis. Protein Sci. 2010, 19, 1137–1161. [Google Scholar] [CrossRef] [PubMed]
- Kwon, S.J.; De Boer, A.L.; Petri, R.; Schmidt-Dannert, C. High-Level Production of Porphyrins in Metabolically Engineered Escherichia coli: Systematic Extension of a Pathway Assembled from Overexpressed Genes Involved in Heme Biosynthesis. Appl. Environ. Microbiol. 2003, 69, 4875–4883. [Google Scholar] [CrossRef]
- Dailey, H.A.; Dailey, T.A.; Gerdes, S.; Jahn, D.; Jahn, M.; O’Brian, M.R.; Warren, M.J. Prokaryotic heme biosynthesis: Multiple pathways to a common essential product. Microbiol. Mol. Biol. Rev. 2017, 81, e00048-16. [Google Scholar] [CrossRef]
- Mathews, M.A.; Schubert, H.L.; Whitby, F.G.; Alexander, K.J.; Schadick, K.; Bergonia, H.A.; Phillips, J.D.; Hill, C.P. Crystal structure of human uroporphyrinogen III synthase. EMBO J. 2001, 20, 5832–5839. [Google Scholar] [CrossRef]
- Yang, Q.; Zhao, J.; Zheng, Y.; Chen, T.; Wang, Z. Microbial synthesis of heme b: Biosynthetic pathways, current strategies, detection, and future prospects. Molecules 2023, 28, 3633. [Google Scholar] [CrossRef] [PubMed]
- Medlock, A.E.; Dailey, H.A. Heme Biosynthesis. Met. Act. Site Assem. 2017, 299–313. [Google Scholar]
- Di Pierro, E.; Brancaleoni, V.; Granata, F. Advances in understanding the pathogenesis of congenital erythropoietic porphyria. Br. J. Haematol. 2016, 173, 365–379. [Google Scholar] [CrossRef] [PubMed]
- Elder, G.; Roberts, A. Uroporphyrinogen decarboxylase. J. Bioenerg. Biomembr. 1995, 27, 207–214. [Google Scholar] [CrossRef] [PubMed]
- Zámocký, M.; Hofbauer, S.; Gabler, T.; Furtmüller, P.G. The molecular evolution, structure, and function of coproporphyrinogen oxidase and protoporphyrinogen oxidase in prokaryotes. Biology 2023, 12, 1527. [Google Scholar] [CrossRef]
- Aftab, H.; Donegan, R.K. Regulation of heme biosynthesis via the coproporphyrin dependent pathway in bacteria. Front. Microbiol. 2024, 15, 1345389. [Google Scholar] [CrossRef] [PubMed]
- Arab, B.; Westbrook, A.W.; Moo-Young, M.; Liu, Y.; Chou, C.P. Bio-Based Production of Uroporphyrin in Escherichia coli. Synth. Biol. Eng. 2024, 2, 10002. [Google Scholar] [CrossRef]
- Arab, B.; Westbrook, A.; Moo-Young, M.; Liu, Y.; Chou, C.P. High-Level Bio-Based Production of Coproporphyrin in Escherichia coli. Fermentation 2024, 10, 250. [Google Scholar] [CrossRef]
- Dailey, H.A. Enzymes of heme biosynthesis. JBIC J. Biol. Inorg. Chem. 1997, 2, 411–417. [Google Scholar] [CrossRef]
- Lushchak, V.I. Free radicals, reactive oxygen species, oxidative stress and its classification. Chem. -Biol. Interact. 2014, 224, 164–175. [Google Scholar] [CrossRef] [PubMed]
- Ozougwu, J.C. The role of reactive oxygen species and antioxidants in oxidative stress. Int. J. Res. 2016, 1, 1–8. [Google Scholar]
- Lu, C.; Bentley, W.E.; Rao, G. Comparisons of oxidative stress response genes in aerobic Escherichia coli fermentations. Biotechnol. Bioeng. 2003, 83, 864–870. [Google Scholar] [CrossRef] [PubMed]
- Voronkova, Y.; Voronkova, O.; Gorban, V.; Holoborodko, K. Oxidative stress, reactive oxygen species, antioxidants: A review. Ecol. Noospherology 2018, 29, 52–55. [Google Scholar] [CrossRef]
- Gęgotek, A.; Skrzydlewska, E. Ascorbic acid as antioxidant. Vitam. Horm. 2023, 121, 247–270. [Google Scholar] [PubMed]
- Roginsky, V.A.; Stegmann, H.B. Ascorbyl radical as natural indicator of oxidative stress: Quantitative regularities. Free. Radic. Biol. Med. 1994, 17, 93–103. [Google Scholar] [CrossRef]
- Matsumura, Y.; Takagi, M.; Imanaka, T. Regulation of Escherichia coli superoxide dismutase genes (sodA and sodB) by oxygen. Biotechnol. Lett. 1993, 15, 229–234. [Google Scholar] [CrossRef]
- Fee, J. Regulation of sod genes in Escherichia coli: Relevance to superoxide dismutase function. Mol. Microbiol. 1991, 5, 2599–2610. [Google Scholar] [CrossRef] [PubMed]
- Doukyu, N.; Taguchi, K. Involvement of catalase and superoxide dismutase in hydrophobic organic solvent tolerance of Escherichia coli. Amb Express 2021, 11, 97. [Google Scholar] [CrossRef] [PubMed]
- Sakamoto, H.; Touati, D. Cloning of the iron superoxide dismutase gene (sodB) in Escherichia coli K-12. J. Bacteriol. 1984, 159, 418–420. [Google Scholar] [CrossRef]
- Touati, D. Cloning and mapping of the manganese superoxide dismutase gene (sodA) of Escherichia coli K-12. J. Bacteriol. 1983, 155, 1078–1087. [Google Scholar] [CrossRef]
- Imlay, K.; Imlay, J.A. Cloning and analysis of sodC, encoding the copper-zinc superoxide dismutase of Escherichia coli. J. Bacteriol. 1996, 178, 2564–2571. [Google Scholar] [CrossRef] [PubMed]
- Hopkin, K.A.; Papazian, M.A.; Steinman, H.M. Functional differences between manganese and iron superoxide dismutases in Escherichia coli K-12. J. Biol. Chem. 1992, 267, 24253–24258. [Google Scholar] [CrossRef]
- Schellhorn, H. Regulation of hydroperoxidase (catalase) expression in Escherichia coli. FEMS Microbiol. Lett. 1995, 131, 113–119. [Google Scholar] [CrossRef]
- von Ossowski, I.; Mulvey, M.R.; Leco, P.A.; Borys, A.; Loewen, P.C. Nucleotide sequence of Escherichia coli katE, which encodes catalase HPII. J. Bacteriol. 1991, 173, 514–520. [Google Scholar] [CrossRef] [PubMed]
- Brown, S.M.; Howell, M.L.; Vasil, M.L.; Anderson, A.J.; Hassett, D.J. Cloning and characterization of the katB gene of Pseudomonas aeruginosa encoding a hydrogen peroxide-inducible catalase: Purification of KatB, cellular localization, and demonstration that it is essential for optimal resistance to hydrogen peroxide. J. Bacteriol. 1995, 177, 6536–6544. [Google Scholar] [CrossRef]
- Hillar, A.; Van Caeseele, L.; Loewen, P.C. Intracellular location of catalase-peroxidase hydroperoxidase I of Escherichia coli. FEMS Microbiol. Lett. 1999, 170, 307–312. [Google Scholar] [CrossRef]
- Heimberger, A.; Eisenstark, A. Compartmentalization of catalases in Escherichia coli. Biochem. Biophys. Res. Commun. 1988, 154, 392–397. [Google Scholar] [CrossRef]
- Imlay, J.; Fridovich, I. Assay of metabolic superoxide production in Escherichia coli. J. Biol. Chem. 1991, 266, 6957–6965. [Google Scholar] [CrossRef] [PubMed]
- Imlay, J.A. Cellular defenses against superoxide and hydrogen peroxide. Annu. Rev. Biochem. 2008, 77, 755–776. [Google Scholar] [CrossRef]
- Miscevic, D.; Mao, J.Y.; Moo-Young, M.; Chou, C.H.P. High-level heterologous production of propionate in engineered Escherichia coli. Biotechnol. Bioeng. 2020, 117, 1304–1315. [Google Scholar] [CrossRef] [PubMed]
- Srirangan, K.; Liu, X.; Westbrook, A.; Akawi, L.; Pyne, M.E.; Moo-Young, M.; Chou, C.P. Biochemical, genetic, and metabolic engineering strategies to enhance coproduction of 1-propanol and ethanol in engineered Escherichia coli. Appl. Microbiol. Biotechnol. 2014, 98, 9499–9515. [Google Scholar] [CrossRef] [PubMed]
- Gibson, D.G.; Young, L.; Chuang, R.-Y.; Venter, J.C.; Hutchison, C.A.; Smith, H.O. Enzymatic assembly of DNA molecules up to several hundred kilobases. Nat. Methods 2009, 6, 343–345. [Google Scholar] [CrossRef]
- Neidhardt, F.C.; Bloch, P.L.; Smith, D.F. Culture medium for enterobacteria. J. Bacteriol. 1974, 119, 736–747. [Google Scholar] [CrossRef]
- Mauzerall, D.; Granick, S. The occurrence and determination of δ-aminolevulinic acid and porphobilinogen in urine. J. Biol. Chem. 1956, 219, 435–446. [Google Scholar] [CrossRef] [PubMed]
- Shivaprasad, D.; Taneja, N.K.; Lakra, A.; Sachdev, D. In vitro and in situ abrogation of biofilm formation in E. coli by vitamin C through ROS generation, disruption of quorum sensing and exopolysaccharide production. Food Chem. 2021, 341, 128171. [Google Scholar] [CrossRef] [PubMed]
- Tajkarimi, M.; Ibrahim, S.A. Antimicrobial activity of ascorbic acid alone or in combination with lactic acid on Escherichia coli O157: H7 in laboratory medium and carrot juice. Food Control 2011, 22, 801–804. [Google Scholar] [CrossRef]
- Tabak, M.; Armon, R.; Rosenblat, G.; Stermer, E.; Neeman, I. Diverse effects of ascorbic acid and palmitoyl ascorbate on Helicobacter pylori survival and growth. FEMS Microbiol. Lett. 2003, 224, 247–253. [Google Scholar] [CrossRef] [PubMed]
- Arrigoni, O.; De Tullio, M.C. Ascorbic acid: Much more than just an antioxidant. Biochim. Et Biophys. Acta (BBA)-Gen. Subj. 2002, 1569, 1–9. [Google Scholar] [CrossRef]
- Pu, W.; Chen, J.; Zhou, Y.; Qiu, H.; Shi, T.; Zhou, W.; Guo, X.; Cai, N.; Tan, Z.; Liu, J. Systems metabolic engineering of Escherichia coli for hyper-production of 5-aminolevulinic acid. Biotechnol. Biofuels Bioprod. 2023, 16, 31. [Google Scholar]
- Couto, M.R.; Rodrigues, J.L.; Braga, A.; Dias, O.; Rodrigues, L.R. Optimization of chondroitin production in E. coli using genome scale models. Mol. Syst. Des. Eng. 2024, 9, 597–611. [Google Scholar] [CrossRef]
- Zhang, S.; He, Y.; Sen, B.; Chen, X.; Xie, Y.; Keasling, J.D.; Wang, G. Alleviation of reactive oxygen species enhances PUFA accumulation in Schizochytrium sp. through regulating genes involved in lipid metabolism. Metab. Eng. Commun. 2018, 6, 39–48. [Google Scholar] [CrossRef]
- Esteve-Gassent, M.D.; Smith, T.C.; Small, C.M.; Thomas, D.P.; Seshu, J. Absence of sodA increases the levels of oxidation of key metabolic determinants of Borrelia burgdorferi. PLoS ONE 2015, 10, e0136707. [Google Scholar] [CrossRef]
- Gort, A.S.; Ferber, D.M.; Imlay, J.A. The regulation and role of the periplasmic copper, zinc superoxide dismutase of Escherichia coli. Mol. Microbiol. 1999, 32, 179–191. [Google Scholar] [CrossRef] [PubMed]
- Mohandass, S.; Ragavan, M.; Gnanasekaran, D.; Lakshmanan, U.; Dharmar, P.; Saha, S.K. Overexpression of Cu/Zn superoxide dismutase (Cu/Zn SOD) in Synechococcus elongatus PCC 7942 for enhanced azo dye removal through hydrogen peroxide accumulation. Biology 2021, 10, 1313. [Google Scholar] [CrossRef]
- Panek, H.R.; O’Brian, M.R. KatG is the primary detoxifier of hydrogen peroxide produced by aerobic metabolism in Bradyrhizobium japonicum. J. Bacteriol. 2004, 186, 7874–7880. [Google Scholar] [CrossRef]
- Beas, J.Z.; Videira, M.A.; Saraiva, L.M. Regulation of bacterial haem biosynthesis. Coord. Chem. Rev. 2022, 452, 214286. [Google Scholar] [CrossRef]
- Benov, L.; Sequeira, F. Escherichia coli ∆ fur mutant displays low HPII catalase activity in stationary phase. Redox Rep. 2003, 8, 379–383. [Google Scholar] [CrossRef]
- Mishra, S.; Imlay, J. Why do bacteria use so many enzymes to scavenge hydrogen peroxide? Arch. Biochem. Biophys. 2012, 525, 145–160. [Google Scholar] [CrossRef]
- Mancini, S.; Imlay, J.A. The induction of two biosynthetic enzymes helps E scherichia coli sustain heme synthesis and activate catalase during hydrogen peroxide stress. Mol. Microbiol. 2015, 96, 744–763. [Google Scholar] [CrossRef]
- Geng, Z.; Ge, J.; Cui, W.; Zhou, H.; Deng, J.; Xu, B. Efficient de novo biosynthesis of heme by membrane engineering in Escherichia coli. Int. J. Mol. Sci. 2022, 23, 15524. [Google Scholar] [CrossRef]
- Yang, S.; Guo, Z.; Sun, J.; Wei, J.; Ma, Q.; Gao, X. Recent advances in microbial synthesis of free heme. Appl. Microbiol. Biotechnol. 2024, 108, 68. [Google Scholar] [CrossRef]
- Chen, H.; Wang, Y.; Wang, W.; Cao, T.; Zhang, L.; Wang, Z.; Chi, X.; Shi, T.; Wang, H.; He, X. High-yield porphyrin production through metabolic engineering and biocatalysis. Nat. Biotechnol. 2024, 1–11. Available online: https://www.nature.com/articles/s41587-024-02267-3 (accessed on 13 January 2025). [CrossRef] [PubMed]


| Name | Description or Relevant Genotype | Source |
|---|---|---|
| Host strains | ||
| HI-Control 10G | mcrA, ∆(mrr-hsdRMS-mcrBC), endA1, recA1, ϕ80dlacZ∆M15, ∆lacX74, araD139, ∆(ara leu)7697, galU, galK, rpsL (StrR), nupG, λ−, tonA, Mini-F lacIq1 (GentR) | Lucigen |
| MG1655 | K-12; F−, λ−, rph-1 | Lab stock |
| CPC-Sbm∆iclR∆sdhA | F−, ∆(araD-araB)567, ∆lacZ4787(::rrnB-3), λ−, rph-1, ∆(rhaD-rhaB)568, hsdR514, ∆ldhA, Ptrc::sbm (i.e., with the FRT-Ptrccassette replacing the 204-bp upstream of the Sbm operon), ∆iclR, ∆sdhA | [41] |
| DMB | CPC-Sbm∆iclR∆sdhA/pK-hemAB | [18] |
| SOD1 | CPC-Sbm∆iclR∆sdhA/pK-hemABsodABC | This study |
| SOD2 | CPC-Sbm∆iclR∆sdhA/pK-hemABsodA | This study |
| SOD3 | CPC-Sbm∆iclR∆sdhA/pK-hemABsodB | This study |
| SOD4 | CPC-Sbm∆iclR∆sdhA/pK-hemABsodC | This study |
| KAT1 | CPC-Sbm∆iclR∆sdhA/pK-hemABsodABC-katEG | This study |
| KAT2 | CPC-Sbm∆iclR∆sdhA/pK-hemAB-katE | This study |
| KAT3 | CPC-Sbm∆iclR∆sdhA/pK-hemAB-katG | This study |
| KAT4 | CPC-Sbm∆iclR∆sdhA/pK-hemABsodA-katE | This study |
| KAT5 | CPC-Sbm∆iclR∆sdhA/pK-hemABsodA-katG | This study |
| Plasmids | ||
| pK-hemA | p15A ori, KmR, Ptrc::hemA | [18] |
| pK-hemAB | p15A ori, KmR, Ptrc::hemAB | [18] |
| pK-hemABC | p15A ori, KmR, Ptrc::hemABC | [18] |
| pK-hemAB-E | p15A ori, KmR, Ptrc:: hemAB -Pgracmax::hemE | [19] |
| pK-hemABsodABC | p15A ori, KmR, Ptrc::hemABsodABC | This study |
| pK-hemABsodA | p15A ori, KmR, Ptrc::hemABsodA | This study |
| pK-hemABsodB | p15A ori, KmR, Ptrc::hemABsodB | This study |
| pK-hemABsodC | p15A ori, KmR, Ptrc::hemABsodC | This study |
| pK-hemABsodABC-katEG | p15A ori, KmR, Ptrc:: hemABsodABC-Pgracmax::katEG | This study |
| pK-hemAB-katE | p15A ori, KmR, Ptrc:: hemAB-Pgracmax::katE | This study |
| pK-hemAB-katG | p15A ori, KmR, Ptrc:: hemAB-Pgracmax::katG | This study |
| pK-hemABsodA-katE | p15A ori, KmR, Ptrc:: hemABsodA-Pgracmax::katE | This study |
| pK-hemABsodA-katG | p15A ori, KmR, Ptrc:: hemABsodA-Pgracmax::katG | This study |
Disclaimer/Publisher’s Note: The statements, opinions and data contained in all publications are solely those of the individual author(s) and contributor(s) and not of MDPI and/or the editor(s). MDPI and/or the editor(s) disclaim responsibility for any injury to people or property resulting from any ideas, methods, instructions or products referred to in the content. |
© 2025 by the authors. Licensee MDPI, Basel, Switzerland. This article is an open access article distributed under the terms and conditions of the Creative Commons Attribution (CC BY) license (https://creativecommons.org/licenses/by/4.0/).
Share and Cite
Arab, B.; Moo-Young, M.; Liu, Y.; Chou, C.P. Manipulating Intracellular Oxidative Conditions to Enhance Porphyrin Production in Escherichia coli. Bioengineering 2025, 12, 83. https://doi.org/10.3390/bioengineering12010083
Arab B, Moo-Young M, Liu Y, Chou CP. Manipulating Intracellular Oxidative Conditions to Enhance Porphyrin Production in Escherichia coli. Bioengineering. 2025; 12(1):83. https://doi.org/10.3390/bioengineering12010083
Chicago/Turabian StyleArab, Bahareh, Murray Moo-Young, Yilan Liu, and C. Perry Chou. 2025. "Manipulating Intracellular Oxidative Conditions to Enhance Porphyrin Production in Escherichia coli" Bioengineering 12, no. 1: 83. https://doi.org/10.3390/bioengineering12010083
APA StyleArab, B., Moo-Young, M., Liu, Y., & Chou, C. P. (2025). Manipulating Intracellular Oxidative Conditions to Enhance Porphyrin Production in Escherichia coli. Bioengineering, 12(1), 83. https://doi.org/10.3390/bioengineering12010083