
Application of Artificial Intelligence Methods on Osteoporosis Classification with Radiographs—A Systematic Review

 , , ,
, , ,
Abstract
Simple Summary
Abstract

1. Introduction
1.1. Osteoporosis—A Global Health Challenge
1.2. Current Diagnostic Methods and Challenges
1.3. Potential of Machine Learning for Osteoporosis Classification
1.4. Research Questions
- How effective are AI methods in accurately classifying osteoporosis using radiographic data?
- What are the current technical challenges and practical limitations in osteoporosis diagnosis and classification?
- What are potential future directions for the use of AI-based classification in osteoporosis management?
2. Materials and Methods
2.1. Literature Review
2.2. Screening of Studies and Criteria for Selection
2.3. Extraction of Data and Reporting
- Main clinical use: Classify osteoporosis through the application of machine learning tools (e.g., BMD estimation or bi-variate/tri-variate classification, i.e., normal, osteopenic, and osteoporotic);
- Research article characteristics: Comprehensive authorship, publication date, and journal or publication name, all written in the English language;
- Research protocol: Study design, anatomical region, imaging modality, patient demographics, and healthcare context;
- Machine Learning: Type of machine learning architecture or technique used, need for human supervision or pre-processing.
3. Results
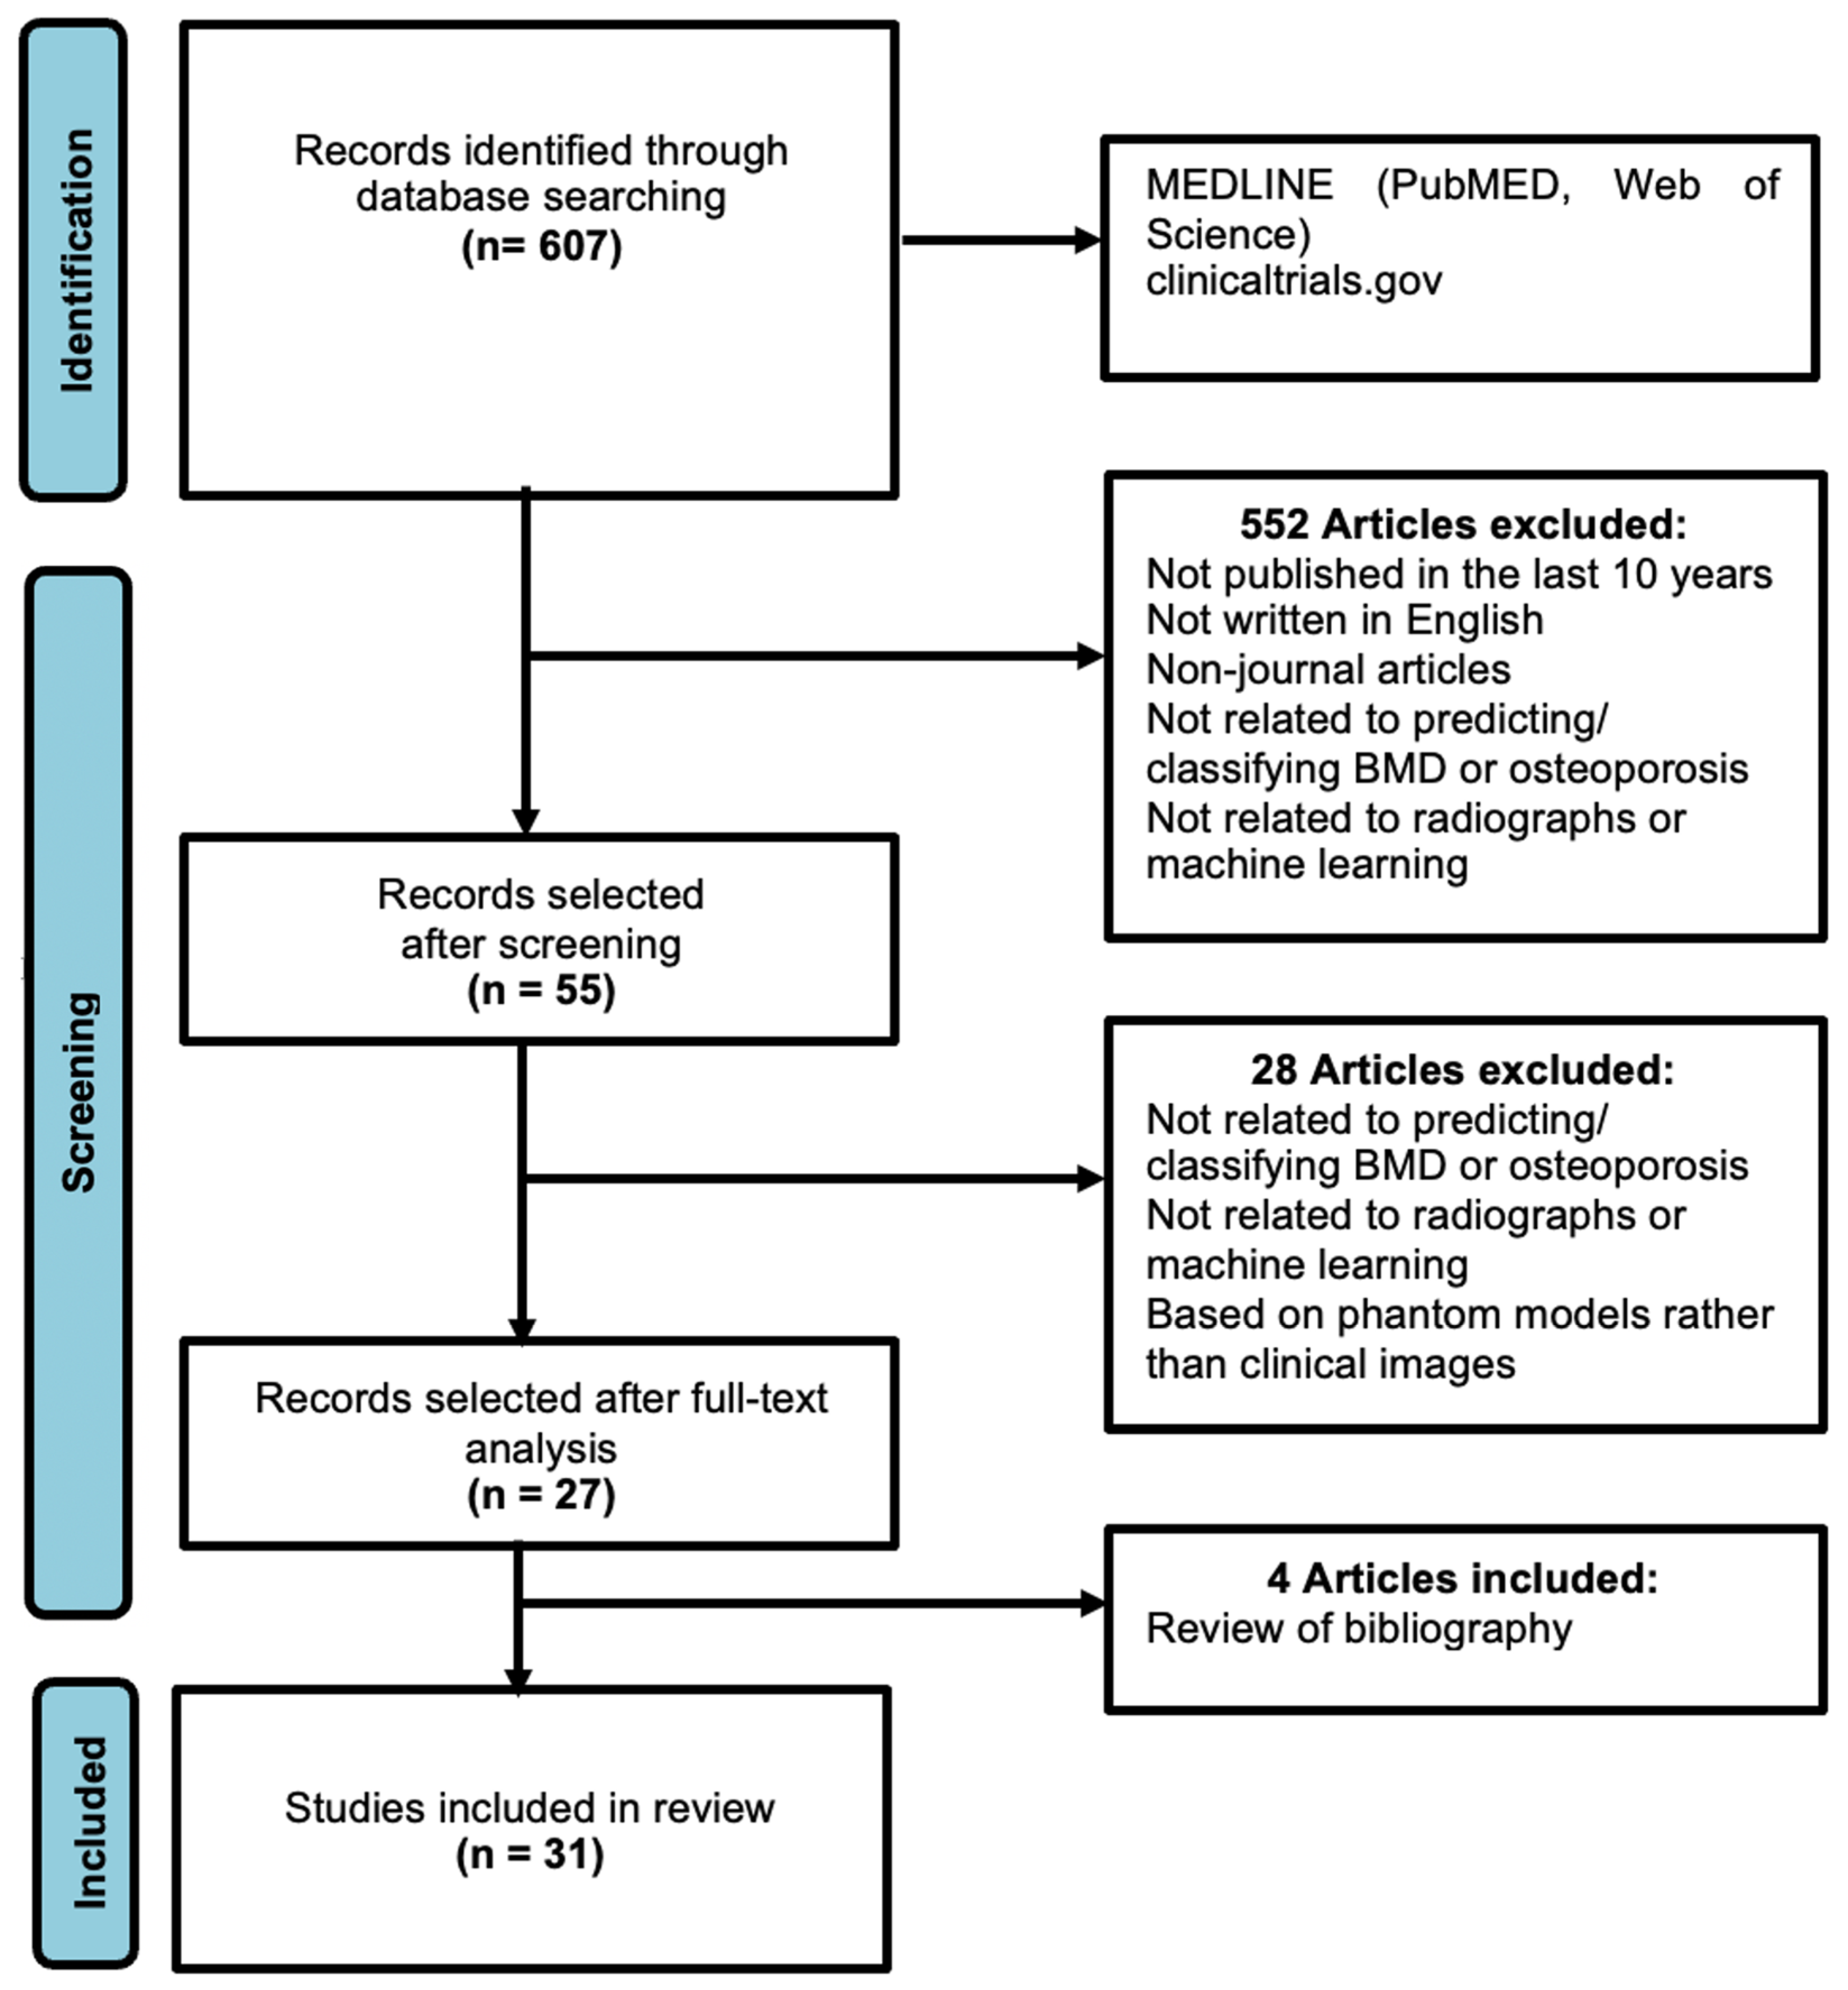
3.1. Search Results
3.2. Model Accuracy in Classification of Osteoporosis
3.3. Study Protocol and Performance Metrics
- Accuracy: Accuracy represents the proportion of correctly classified instances among all instances examined. It provides a general measure of model performance but may not be suitable for imbalanced datasets;
- Sensitivity and Specificity: Sensitivity (true positive rate) measures the proportion of actual positives that are correctly identified by the model, while specificity (true negative rate) measures the proportion of actual negatives that are correctly identified by the model;
- Area Under the Curve (AUC): AUC refers to the area under the receiver operating characteristic (ROC) curve, which illustrates the trade-off between sensitivity and specificity across various threshold settings. A higher AUC value indicates better discrimination ability of the model;
- F1 Score: The F1 score is the harmonic mean of precision and recall (sensitivity). It provides a balance between precision (the proportion of true positive predictions among all positive predictions) and recall, making it suitable for imbalanced datasets;
- Correlation Coefficient (R): The correlation coefficient measures the strength and direction of the linear relationship between two variables. In the context of osteoporosis classification, it reflects the agreement between predicted bone mineral density values (a scalar numerical value) and gold standard measurements obtained from DEXA scans.
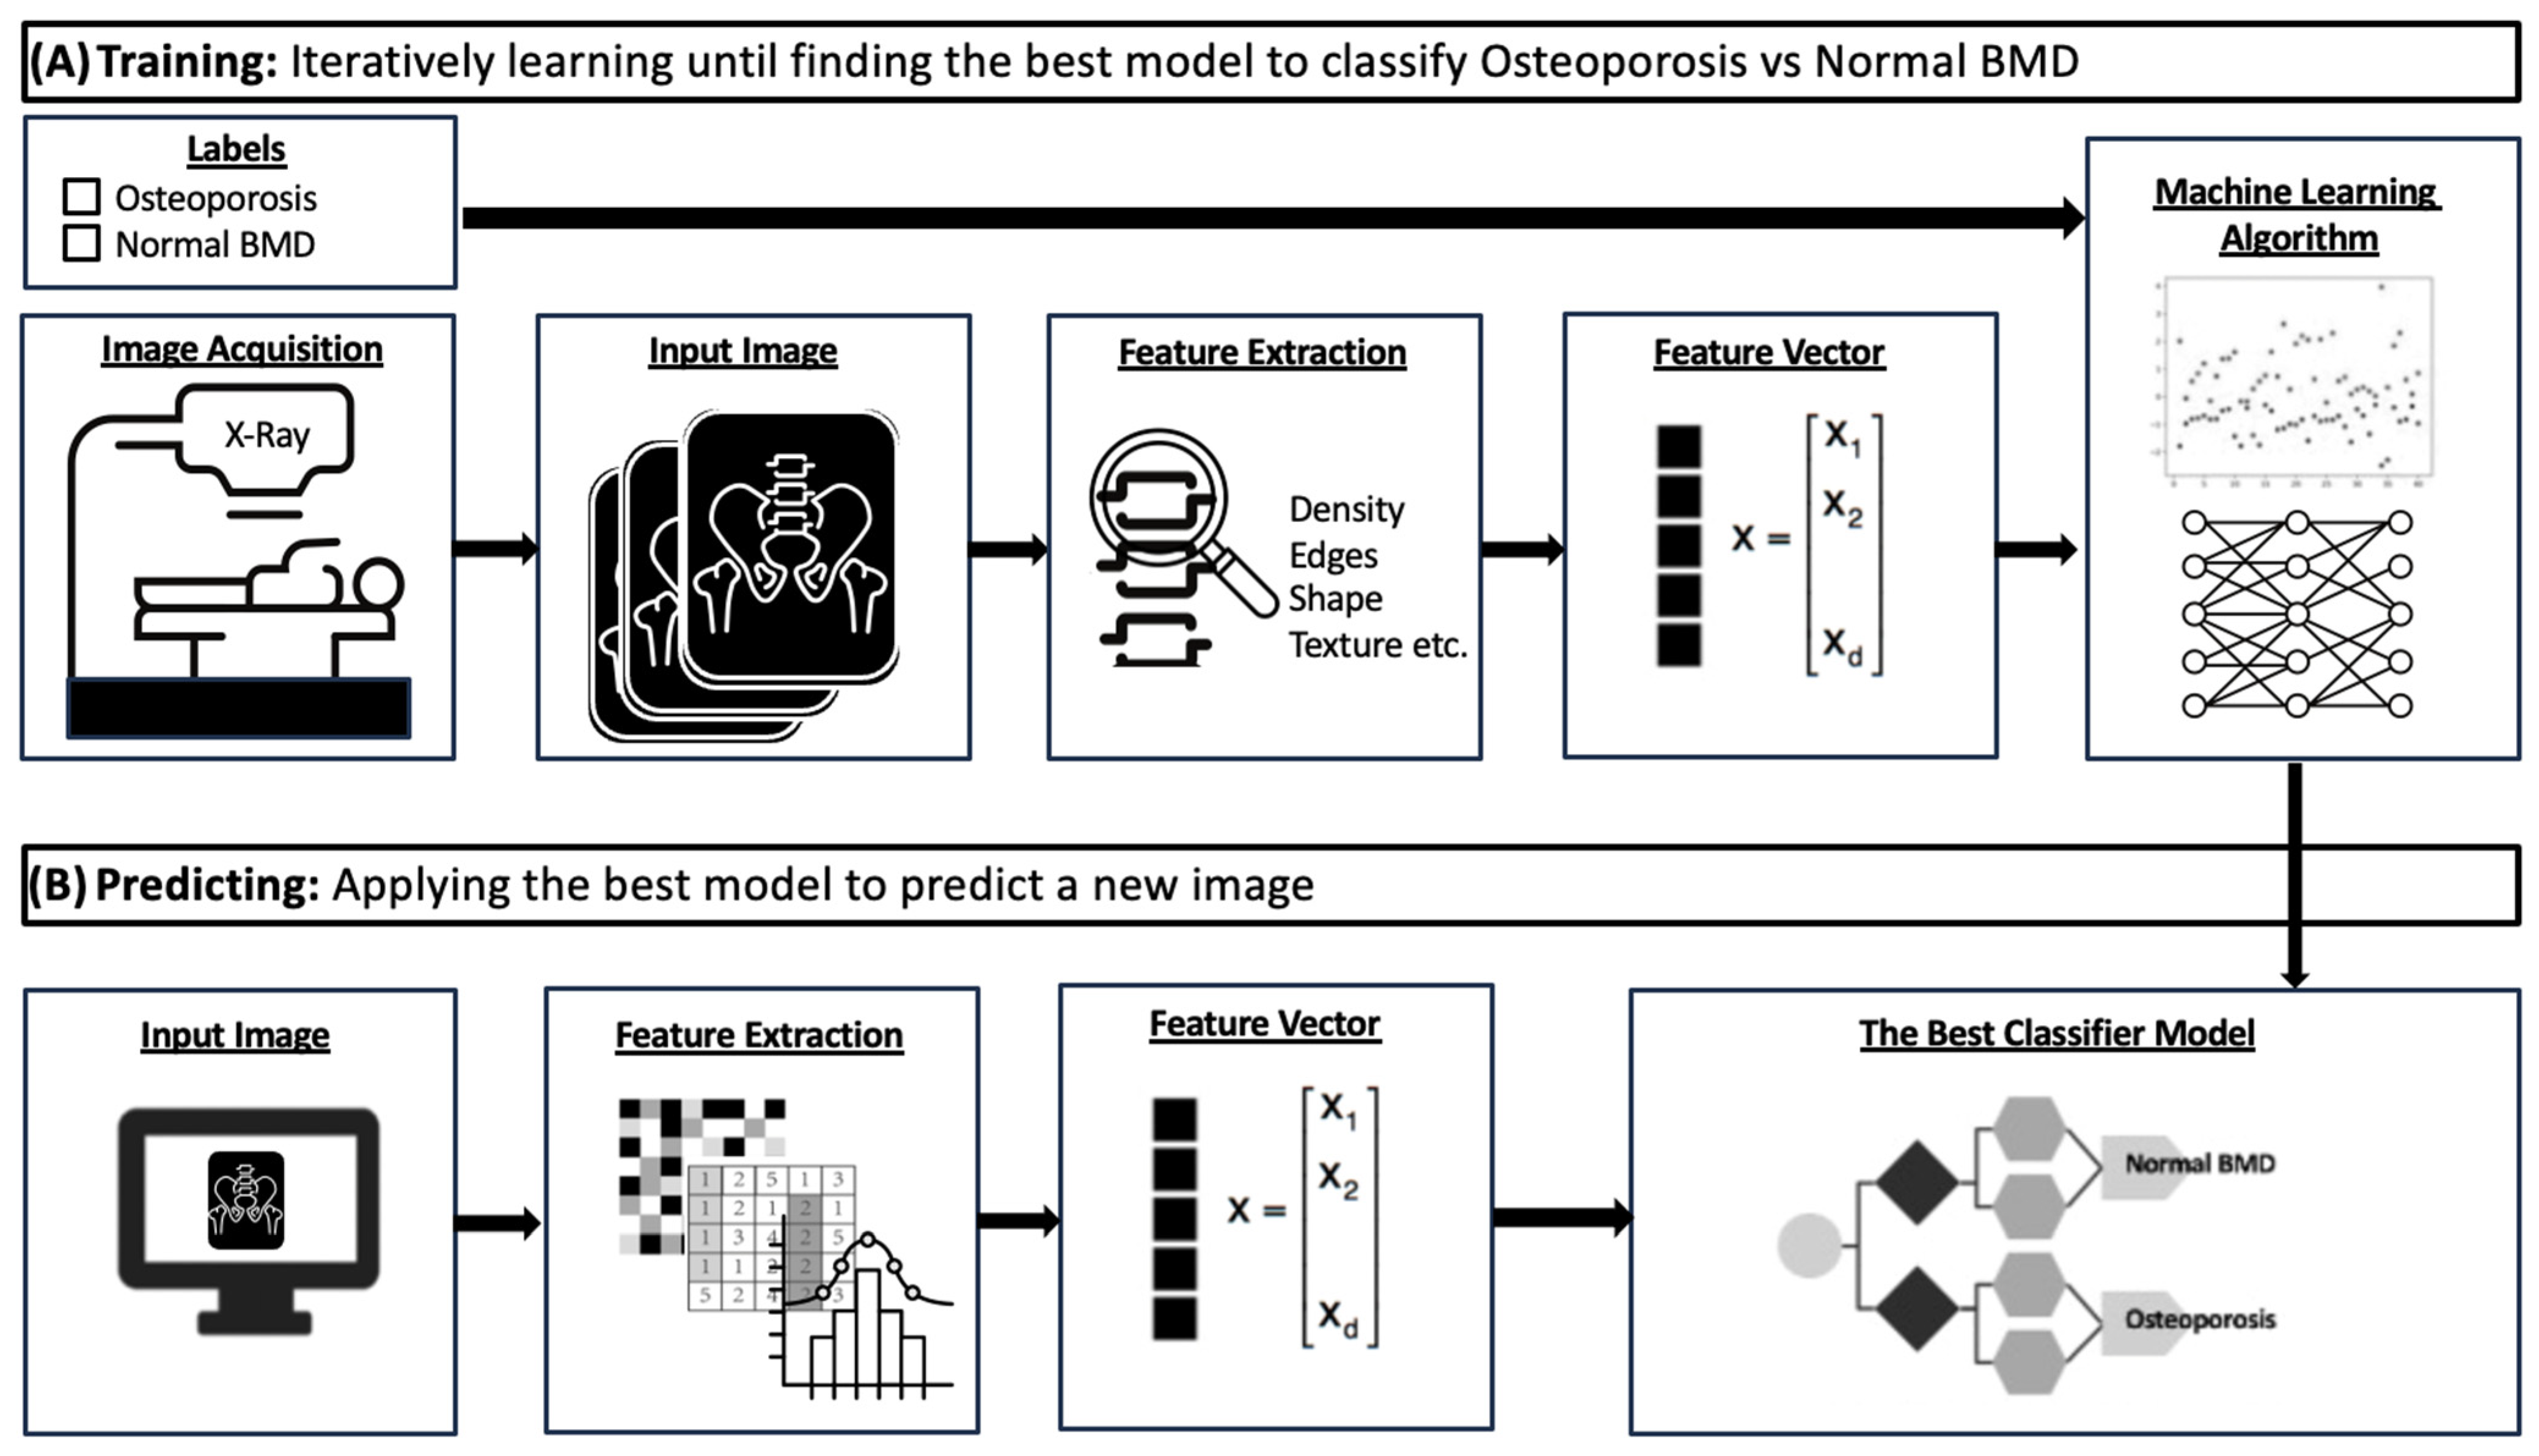
3.4. Machine Learning in Medical Imaging
- Data Collection: Usually, approval from an ethics committee is necessary before utilizing medical data for the development of a commercial or research AI algorithm. In the case of a prospective study, explicit informed consent is necessary. Medical imaging data are usually collated from a picture archiving and communication system (PACS) environment, requiring collaboration between AI developers and healthcare professionals [48]. Accessing relevant data involves querying, appropriately de-identifying, and securely storing the information. Protected health information must be removed from both the Digital Imaging and Communications in Medicine (DICOM) metadata and the images themselves [49];
- Image Processing and Segmentation: Segmentation is the process of delineating structures within a medical image, thereby creating structured visual representations from unstructured raw data [47,50]. For example, in tumor segmentation, this could be the process of defining the margins of a tumor [45]. For osteoporosis classification, this could refer to the separation of bone and non-bone structures [51,52];
- Training and Validation: An appropriate model is selected and trained using a portion of the dataset. Supervised machine learning models are provided with data inputs labeled by human experts, whereas unsupervised models extract salient features from unlabeled data to uncover meaningful relationships within datasets. Models determine how to perform meaningful feature extraction and computation, which involves the evaluation of the image factors that allow a prediction to be made. Image features should be independent of technical factors such as noise, signal, and rotation, as these are common issues in medical images. Machine learning models typically iterate to improve performance with each exposure to the validation set;
- Testing: The model is then tested on a set of examples to evaluate its diagnostic accuracy and performance [45]. Testing can be performed with internal and external test sets; the former refers to data that come from the same pool as the training set whereas the latter refers to data that have been collected from a different source. Good model performance on external testing sets bolsters confidence in model accuracy, whereas poor performance on external datasets may suggest overfitting [44,53].

| Authors | Artificial Intelligence Method | Publication Year | Main Objectives | Title of Journal | Type of Radiographs | Performance |
|---|---|---|---|---|---|---|
| Ho, C.S. et al. [56] | CNN | 2021 | Classify osteoporosis | Arch. Osteoporos. | Pelvis and femur | r = 0.850; Accuracy 88.0% |
| Fathima, S.M.N. et al. [57] | CNN (U-Net) | 2020 | Classify osteoporosis | J Xray Sci Technol. | Various | Accuracy 88.0%; Sensitivity 95.2–95.8%; Specificity 96.7–97.5% |
| Hsieh, C.I. et al. [58] | CNN (VGG-16 and ResNet-34) | 2021 | Classify osteoporosis | Nat. Commun. | Lumbar spine, pelvis | AUC 0.890; Accuracy 86.2–91.7%; Sensitivity 80.2%–83.5%; Specificity 88.3%–94.9% |
| Sukegawa, S. et al. [59] | CNN (EfficientNet-b0, -b3, and -b7 and ResNet-18, -50, and -152) | 2022 | Classify osteoporosis | Sci. Rep. | Dental panoramic | AUC 0.911–0.921; Accuracy 84.0–84.5%; Specificity 88.8–90.6%; F1 score 0.720–0.740 |
| Yamamoto, N. et al. [60] | CNN (ResNet18, ResNet34, GoogleNet, EfficientNet b3, EfficientNetb4) | 2020 | Classify osteoporosis | Biomolecules | Hip | Accuracy 88.5%; Specificity 92.2%; Recall 0.887; F1 score 0.894; AUC 0.922–0.937 |
| Wani, I. et al. [30] | CNN (AlexNet, VggNet-16, ResNet, VggNet-19) | 2022 | Classify osteoporosis | Multimed. Tools Appl. | Knee | Accuracy 90.9%; Error rate 9.0%; Validation loss 54% |
| Lee, K.S. et al. [61] | CNN (CNN3, VGG-16, VGG-16_TF, VGG-16_TF_FT) | 2020 | Predict osteoporosis | J Clin Med. | Dental panoramic | AUC 0.858; Sensitivity 90.0%; Specificity 81.5%; Accuracy 84.0% |
| Zhang, B. et al. [62] | CNN | 2020 | Classify osteoporosis | Bone | Lumbar spine | AUC 0.767–0.810; Sensitivity 68.4–85.3% |
| Singh, A. et al. [32] | SVM, GNB, k-NN, ANN | 2017 | Predict osteoporosis | Comput Biol Med. | Calcaneum | AUC 0.982; Accuracy 97.9%; Sensitivity 100.0%; Specificity 95.7% |
| Tecle, N. et al. [31] | CNN (FSN-8) | 2020 | Predict osteoporosis | J Hand Surg Am. | Hand | Sensitivity 82.4%; Specificity 94.3% |
| Areeckal, A. S. et al. [63] | k-NN | 2017 | Predict osteoporosis | Osteoporos Int. | Hand and wrist | Accuracy 93.2%; Sensitivity 91.2%; Specificity 95.0% |
| Kavitha, M.S. et al. [64] | naive Bayes, k-NN, SVM | 2015 | Predict osteoporosis | Oral Surg Oral Med Oral Pathol Oral Radiol. | Dental panoramic | Accuracy 89.5–96.8% |
| Kavitha, M.S. et al. [65] | hybrid GSF | 2016 | Classify osteoporosis | Dentomaxillofac Radiol. | Dental panoramic | AUC 0.986; Sensitivity 99.1%; Specificity 98.4%; Accuracy 98.9% (femoral neck); AUC 0.962; Sensitivity 95.3%; Specificity 94.7%; Accuracy 96.0% (lumbar spine) |
| Chu, P. et al. [66] | CNN (OSN; AlexNet) | 2018 | Predict osteoporosis | Annu Int Conf IEEE Eng Med Biol Soc | Dental panoramic | Accuracy 89.8% |
| Hwang, J.J. et al. [67] | decision tree, SVM | 2017 | Predict osteoporosis | Dentomaxillofac Radiol | Dental panoramic | Accuracy 96.2–96.3%; Sensitivity 97.1–97.2%; Specificity 96.3–97.1 |
| Lee, J.S. et al. [68] | SC-DCNN, SC DNN Augment, MC-DCNN | 2019 | Predict osteoporosis | Dentomaxillofac Radiol | Dental panoramic | AUC 0.973–0.999; Accuracy 93.0–98.5% |
| Oulhaj. H. et al. [69] | SVM | 2017 | Predict osteoporosis | IEEE Trans Med Imaging | Calcaneum | AUC 0.930; Accuracy 91.3%; Sensitivity 92.0%; Specificity 91.0% |
| Zheng, K. et al. [70] | CNN (Alexnet, Googlenet, Resnet18, Inceptionv3) | 2020 | Predict osteoporosis | Artif Intell Med | Calcaneum | AUC 0.944; Accuracy 90.8% |
| Nasser, Y. et al. [71] | SVM | 2017 | Predict osteoporosis | New York: IEEE | Calcaneum | Accuracy 95.5% |
| Jang, M. et al. [34] | Deep learning model (OsPor-screen) | 2022 | Classify osteoporosis | J. Bone Miner. Res. | Chest | AUC 0.880–0.910; Accuracy 77.7–84.2%; Sensitivity 84.3–86.2%; Specificity 74.2–81.5% |
| Bhattacharya, S. et al. [72] | SVM, NN | 2019 | Classify osteoporosis | IEEE Xplore | Calcaneum | Accuracy 95.6% |
| Jang, R. et al. [73] | CNN (VGG16) | 2021 | Classify osteoporosis | Sci. Rep. | Hip | AUC 0.700; Accuracy 81.2%; Sensitivity 91.1%; Specificity 68.9%, |
| Nguyen, T. et al. [74] | CNN | 2021 | Classify osteoporosis | Comput. Biol. Med. | Hip | r = 0.808 |
| Singh, Y. et al. [75] | CNN | 2021 | Classify osteoporosis | 43rd Conf Proc IEEE Eng Med Biol Soc | Dental panoramic | Accuracy: 87.9% |
| Sato, Y. et al. [35] | CNN | 2022 | Classify osteoporosis | Biomedicines. | Chest | AUC 0.700–0.890; Accuracy 66.1–78.5%; Sensitivity 71.3–90.1%; Specificity 62.4–73.7% |
| Hong, N. et al. [76] | CNN | 2023 | Classify osteoporosis | J Bone Miner Res. | Lateral spine | AUC 0.830–0.850; Sensitivity 75.0–76.0% |
| Nakamoto, T. et al. [77] | CNN | 2022 | Classify osteoporosis | Dentomaxillofac Radiol | Dental panoramic | Sensitivity 78.3–82.6%; Specificity 71.4–79.2%; Accuracy 74.0–79.0% (Lumbar spine DEXA); Sensitivity 80.0–86.7%; Specificity 67.1–74.1%; Accuracy 70.0–75.0% (Femoral Neck) |
| Widyaningrum, R. et al. [51] | DT, GNB, MLP | 2023 | Classify osteoporosis | Int. J. Dent. | Dental panaromic | Accuracy 90.5%; Specificity 90.9%; Sensitivity 90.0% |
| Lee, S.W. et al. [78] | CNN | 2020 | Classify osteoporosis | Skeletal Radiol. | Spine | AUC 0.740; Accuracy 71.0%; Sensitivity 81.0%; Specificity 60.0%; F1-score 0.73 |
| Mohammadi, F. G. et al. [79] | CNN | 2023 | Classify osteoporosis | Stud Health Technol Inform | Hand | AUC 0.740; Accuracy 82.0%; Sensitivity 87.0%; Specificity 61.0% |
| Mao, L. et al. [80] | CNN | 2022 | Classify osteoporosis | Front. Endocrinol. | Lumbar spine | AUC 0.937; Sensitivity 84.8%; Specificity 86.6% |
| Areas Sampled | No. of Studies | AUC | Accuracy (%) | Sensitivity (%) | Specificity (%) |
|---|---|---|---|---|---|
| Dental | 10 | 0.858–0.999 | 74.0–96.9 | 78.3–97.2 | 67.1–97.1 |
| Hip | 5 | 0.700–0.937 | 81.2–88.5 | 80.2–91.1 | 68.9–94.9 |
| Spine | 5 | 0.726–0.937 | 71.0–86.2 | 68.4–84.8 | 60.0–88.3 |
| Calcaneum | 5 | 0.930–0.982 | 90.8–97.9 | 92.0–100.0 | 91.0–95.7 |
| Hand or Wrist | 3 | 0.740 | 82.0–93.2 | 82.4–91.2 | 61.0–95.7 |
| Chest | 2 | 0.700–0.910 | 66.1–84.2 | 71.3–90.1 | 62.4–81.5 |
| Various * | 1 | - | 88.0 | 95.2–95.8 | 96.7–97.5 |
| Knee | 1 | - | 90.9 | - | - |
| Overall | 32 | 0.700–0.999 | 66.1–97.9 | 67.4–100.0 | 60.0–97.5 |
4. Discussion
4.1. Advantages and Efficacy
4.2. Challenges: Dataset Collection
4.3. Challenges: Radiograph Quality and Confounding Pathologies
4.4. Challenges: Study Protocol Heterogeneity
4.5. Challenges: Clinical Integration
4.6. Future Directions in the Use of AI in Osteoporosis
5. Conclusions
Author Contributions
Funding
Institutional Review Board Statement
Informed Consent Statement
Data Availability Statement
Conflicts of Interest
References
- Föger-Samwald, U.; Dovjak, P.; Azizi-Semrad, U.; Kerschan-Schindl, K.; Pietschmann, P. Osteoporosis: Pathophysiology and therapeutic options. EXCLI J. 2020, 19, 1017–1037. [Google Scholar] [CrossRef] [PubMed]
- Sheik Ali, A. Osteoporosis: A Narrative Review. Cureus 2023, 15, e43031. [Google Scholar] [CrossRef] [PubMed]
- Curry, S.J.; Krist, A.H.; Owens, D.K.; Barry, M.J.; Caughey, A.B.; Davidson, K.W.; Doubeni, C.A.; Epling, J.W.; Kemper, A.R.; Kubik, M.; et al. Screening for Osteoporosis to Prevent Fractures. JAMA 2018, 319, 2521. [Google Scholar] [CrossRef] [PubMed]
- Brooke-Wavell, K.; Skelton, D.A.; Barker, K.L.; Clark, E.M.; De Biase, S.; Arnold, S.; Paskins, Z.; Robinson, K.R.; Lewis, R.M.; Tobias, J.H.; et al. Strong, steady and straight: UK consensus statement on physical activity and exercise for osteoporosis. Br. J. Sports Med. 2022, 56, 837–846. [Google Scholar] [CrossRef] [PubMed]
- Keen, M.U.; Reddivari, A.K.R. Osteoporosis in Females; StatPearls: St. Petersburg, FL, USA, 2024. [Google Scholar]
- Björnsdottir, S.; Clarke, B.L.; Mannstadt, M.; Langdahl, B.L. Male osteoporosis-what are the causes, diagnostic challenges, and management. Best Pract. Res. Clin. Rheumatol. 2022, 36, 101766. [Google Scholar] [CrossRef] [PubMed]
- Kanis, J.A.; Johnell, O.; Oden, A.; Sernbo, I.; Redlund-Johnell, I.; Dawson, A.; De Laet, C.; Jonsson, B. Long-Term Risk of Osteoporotic Fracture in Malmö. Osteoporos. Int. 2000, 11, 669–674. [Google Scholar] [CrossRef] [PubMed]
- Kanis, J. Assessment of osteoporosis at the primary health-care level. In WHO Scientific Group Technical Report. 2007; WHO Collaborating Centre for Metabolic Bone Diseases, University of Sheffield: Sheffield, UK, 2007. [Google Scholar]
- Leibson, C.L.; Tosteson, A.N.A.; Gabriel, S.E.; Ransom, J.E.; Melton, L.J. Mortality, Disability, and Nursing Home Use for Persons with and without Hip Fracture: A Population-Based Study. J. Am. Geriatr. Soc. 2002, 50, 1644–1650. [Google Scholar] [CrossRef] [PubMed]
- Clynes, M.A.; Harvey, N.C.; Curtis, E.M.; Fuggle, N.R.; Dennison, E.M.; Cooper, C. The epidemiology of osteoporosis. Br. Med. Bull. 2020, 133, 105–117. [Google Scholar] [CrossRef] [PubMed]
- Wáng, Y.X.J.; Lentle, B.C. Radiographic osteoporotic vertebral fractures in elderly men: A brief review focusing on differences between the sexes. Quant. Imaging Med. Surg. 2020, 10, 1863–1876. [Google Scholar] [CrossRef] [PubMed]
- Office of the Surgeon General (US). Bone Health and Osteoporosis: A Report of the Surgeon General; Office of the Surgeon General (US): Rockville, MD, USA, 2004. [Google Scholar]
- Burge, R.; Dawson-Hughes, B.; Solomon, D.H.; Wong, J.B.; King, A.; Tosteson, A. Incidence and Economic Burden of Osteoporosis-Related Fractures in the United States, 2005–2025. J. Bone Miner. Res. 2007, 22, 465–475. [Google Scholar] [CrossRef]
- Hernlund, E.; Svedbom, A.; Ivergård, M.; Compston, J.; Cooper, C.; Stenmark, J.; McCloskey, E.V.; Jonsson, B.; Kanis, J.A. Osteoporosis in the European Union: Medical management, epidemiology and economic burden. Arch. Osteoporos. 2013, 8, 136. [Google Scholar] [CrossRef] [PubMed]
- Barr, R.J.; Stewart, A.; Torgerson, D.J.; Reid, D.M. Population screening for osteoporosis risk: A randomised control trial of medication use and fracture risk. Osteoporos. Int. 2010, 21, 561–568. [Google Scholar] [CrossRef] [PubMed]
- Miller, P.D. Underdiagnoses and Undertreatment of Osteoporosis: The Battle to Be Won. J. Clin. Endocrinol. Metab. 2016, 101, 852–859. [Google Scholar] [CrossRef] [PubMed]
- Lulla, D.; Teo, C.; Shen, X.; Loi, Z.; Quek, K.; Lis, H.; Koh, S.; Chan, E.; Lim, S.; Low, L. Assessing the knowledge, attitude and practice of osteoporosis among Singaporean women aged 65 years and above at two SingHealth polyclinics. Singap. Med. J. 2021, 62, 190–194. [Google Scholar] [CrossRef] [PubMed]
- Singer, A.; McClung, M.R.; Tran, O.; Morrow, C.D.; Goldstein, S.; Kagan, R.; McDermott, M.; Yehoshua, A. Treatment rates and healthcare costs of patients with fragility fracture by site of care: A real-world data analysis. Arch. Osteoporos. 2023, 18, 42. [Google Scholar] [CrossRef] [PubMed]
- Cummings, S.R.; Bates, D.; Black, D.M. Clinical Use of Bone Densitometry. JAMA 2002, 288, 1889. [Google Scholar] [CrossRef] [PubMed]
- Lewiecki, E.M.; Compston, J.E.; Miller, P.D.; Adachi, J.D.; Adams, J.E.; Leslie, W.D.; Kanis, J.A.; Moayyeri, A.; Adler, R.A.; Hans, D.B.; et al. Official Positions for FRAX® Bone Mineral Density and FRAX® Simplification. J. Clin. Densitom. 2011, 14, 226–236. [Google Scholar] [CrossRef] [PubMed]
- Kanis, J.A.; Johnell, O. Requirements for DXA for the management of osteoporosis in Europe. Osteoporos. Int. 2005, 16, 229–238. [Google Scholar] [CrossRef] [PubMed]
- Engelke, K. Quantitative Computed Tomography—Current Status and New Developments. J. Clin. Densitom. 2017, 20, 309–321. [Google Scholar] [CrossRef] [PubMed]
- Schousboe, J.T.; Riekkinen, O.; Karjalainen, J. Prediction of hip osteoporosis by DXA using a novel pulse-echo ultrasound device. Osteoporos. Int. 2017, 28, 85–93. [Google Scholar] [CrossRef] [PubMed]
- Sung, K.H.; Choi, Y.; Cho, G.H.; Chung, C.Y.; Park, M.S.; Lee, K.M. Peripheral DXA measurement around ankle joint to diagnose osteoporosis as assessed by central DXA measurement. Skelet. Radiol. 2018, 47, 1111–1117. [Google Scholar] [CrossRef] [PubMed]
- Barnett, E.; Nordin, B.E.C. The radiological diagnosis of osteoporosis: A new approach. Clin. Radiol. 1960, 11, 166–174. [Google Scholar] [CrossRef] [PubMed]
- Exton-Smith, A.N.; Millard, P.H.; Payne Erica, P.R.; Wheeler, F. Method for Measuring Quantity of Bone. Lancet 1969, 294, 1153–1154. [Google Scholar] [CrossRef] [PubMed]
- Garn, S.M. An Annotated Bibliography on Bone Densitometry. Am. J. Clin. Nutr. 1962, 10, 59–67. [Google Scholar] [CrossRef] [PubMed]
- Engstrom, A.; Welin, S. A method for the quantitative roentgenological determination of the amount of calcium salts in bone tissue. Acta Radiol. 1949, 31, 483–502. [Google Scholar] [CrossRef] [PubMed]
- Bywaters, E.G.L. The measurement of bone opacity. Clin. Sci. 1948, 6, 281–287. [Google Scholar] [PubMed]
- Wani, I.M.; Arora, S. Osteoporosis diagnosis in knee X-rays by transfer learning based on convolution neural network. Multimed. Tools Appl. 2023, 82, 14193–14217. [Google Scholar] [CrossRef] [PubMed]
- Tecle, N.; Teitel, J.; Morris, M.R.; Sani, N.; Mitten, D.; Hammert, W.C. Convolutional Neural Network for Second Metacarpal Radiographic Osteoporosis Screening. J. Hand Surg. 2020, 45, 175–181. [Google Scholar] [CrossRef] [PubMed]
- Singh, A.; Dutta, M.K.; Jennane, R.; Lespessailles, E. Classification of the trabecular bone structure of osteoporotic patients using machine vision. Comput. Biol. Med. 2017, 91, 148–158. [Google Scholar] [CrossRef] [PubMed]
- Cui, J.; Liu, C.L.; Jennane, R.; Ai, S.; Dai, K.; Tsai, T.-Y. A highly generalized classifier for osteoporosis radiography based on multiscale fractal, lacunarity, and entropy distributions. Front. Bioeng. Biotechnol. 2023, 11, 1054991. [Google Scholar] [CrossRef] [PubMed]
- Jang, M.; Kim, M.; Bae, S.J.; Lee, S.H.; Koh, J.-M.; Kim, N. Opportunistic Osteoporosis Screening Using Chest Radiographs with Deep Learning: Development and External Validation with a Cohort Dataset. J. Bone Miner. Res. 2022, 37, 369–377. [Google Scholar] [CrossRef] [PubMed]
- Sato, Y.; Yamamoto, N.; Inagaki, N.; Iesaki, Y.; Asamoto, T.; Suzuki, T. Deep Learning for Bone Mineral Density and T-Score Prediction from Chest X-rays: A Multicenter Study. Biomedicines 2022, 10, 2323. [Google Scholar] [CrossRef] [PubMed]
- Liu, X.; Faes, L.; Kale, A.U.; Wagner, S.K.; Fu, D.J.; Bruynseels, A.; Mahendiran, T.; Moraes, G.; Shamdas, M.; Kern, C.; et al. A comparison of deep learning performance against health-care professionals in detecting diseases from medical imaging: A systematic review and meta-analysis. Lancet Digit. Health 2019, 1, e271–e297. [Google Scholar] [CrossRef] [PubMed]
- Sendak, M.P.; D’Arcy, J.; Kashyap, S.; Gao, M.; Nichols, M.; Corey, K.; Ratliff, W.; Balu, S. A Path for Translation of Machine Learning Products into Healthcare Delivery. EMJ Innov. 2020, 10, 19–00172. [Google Scholar] [CrossRef]
- Topol, E.J. High-performance medicine: The convergence of human and artificial intelligence. Nat. Med. 2019, 25, 44–56. [Google Scholar] [CrossRef] [PubMed]
- Lind Plesner, L.; Müller, F.C.; Brejnebøl, M.W.; Laustrup, L.C.; Rasmussen, F.; Nielsen, O.W.; Boesen, M.; Andersen, M.B. Commercially Available Chest Radiograph AI Tools for Detecting Airspace Disease, Pneumothorax, and Pleural Effusion. Radiology 2023, 308, e231236. [Google Scholar] [CrossRef] [PubMed]
- Dembrower, K.; Crippa, A.; Colón, E.; Eklund, M.; Strand, F.; ScreenTrustCAD Trial Consortium. Artificial intelligence for breast cancer detection in screening mammography in Sweden: A prospective, population-based, paired-reader, non-inferiority study. Lancet. Digit. Health 2023, 5, e703–e711. [Google Scholar] [CrossRef] [PubMed]
- Hallinan, J.T.P.D.; Zhu, L.; Yang, K.; Makmur, A.; Algazwi, D.A.R.; Thian, Y.L.; Lau, S.; Choo, Y.S.; Eide, S.E.; Yap, Q.V.; et al. Deep Learning Model for Automated Detection and Classification of Central Canal, Lateral Recess, and Neural Foraminal Stenosis at Lumbar Spine MRI. Radiology 2021, 300, 130–138. [Google Scholar] [CrossRef] [PubMed]
- Lim, D.S.W.; Makmur, A.; Zhu, L.; Zhang, W.; Cheng, A.J.L.; Sia, D.S.Y.; Eide, S.E.; Ong, H.Y.; Jagmohan, P.; Tan, W.C.; et al. Improved Productivity Using Deep Learning-assisted Reporting for Lumbar Spine MRI. Radiology 2022, 305, 160–166. [Google Scholar] [CrossRef] [PubMed]
- Dercle, L.; McGale, J.; Sun, S.; Marabelle, A.; Yeh, R.; Deutsch, E.; Mokrane, F.-Z.; Farwell, M.; Ammari, S.; Schoder, H.; et al. Artificial intelligence and radiomics: Fundamentals, applications, and challenges in immunotherapy. J. ImmunoTher. Cancer 2022, 10, e005292. [Google Scholar] [CrossRef]
- Kocak, B.; Durmaz, E.S.; Ates, E.; Kilickesmez, O. Radiomics with artificial intelligence: A practical guide for beginners. Diagn. Interv. Radiol. 2019, 25, 485–495. [Google Scholar] [CrossRef] [PubMed]
- Erickson, B.J.; Korfiatis, P.; Akkus, Z.; Kline, T.L. Machine Learning for Medical Imaging. RadioGraphics 2017, 37, 505–515. [Google Scholar] [CrossRef] [PubMed]
- Sarker, I.H. Machine Learning: Algorithms, Real-World Applications and Research Directions. SN Comput. Sci. 2021, 2, 160. [Google Scholar] [CrossRef] [PubMed]
- Montagnon, E.; Cerny, M.; Cadrin-Chênevert, A.; Hamilton, V.; Derennes, T.; Ilinca, A.; Vandenbroucke-Menu, F.; Turcotte, S.; Kadoury, S.; Tang, A. Deep learning workflow in radiology: A primer. Insights Into Imaging 2020, 11, 22. [Google Scholar] [CrossRef] [PubMed]
- Willemink, M.J.; Koszek, W.A.; Hardell, C.; Wu, J.; Fleischmann, D.; Harvey, H.; Folio, L.R.; Summers, R.M.; Rubin, D.L.; Lungren, M.P. Preparing Medical Imaging Data for Machine Learning. Radiology 2020, 295, 4–15. [Google Scholar] [CrossRef] [PubMed]
- Erickson, B.J.; Fajnwaks, P.; Langer, S.G.; Perry, J. Multisite Image Data Collection and Management Using the RSNA Image Sharing Network. Transl. Oncol. 2014, 7, 36–39. [Google Scholar] [CrossRef] [PubMed]
- Hesamian, M.H.; Jia, W.; He, X.; Kennedy, P. Deep Learning Techniques for Medical Image Segmentation: Achievements and Challenges. J. Digit. Imaging 2019, 32, 582–596. [Google Scholar] [CrossRef] [PubMed]
- Widyaningrum, R.; Sela, E.I.; Pulungan, R.; Septiarini, A. Automatic Segmentation of Periapical Radiograph Using Color Histogram and Machine Learning for Osteoporosis Detection. Int. J. Dent. 2023, 2023, 6662911. [Google Scholar] [CrossRef] [PubMed]
- Doctorant, G.G.; Lebrahim, E.H.A.; Hind, K.; Olivier, L.; Rodriguez, E.G.; Beaugé, L.; Hans, D. Evaluation of AI-based spine segmentation (SpS) for the analysis of lumbar spine dual energy X-ray absorptiometry scans. J. Clin. Densitom. 2023, 26, 101410. [Google Scholar] [CrossRef]
- Kocak, B. Key concepts, common pitfalls, and best practices in artificial intelligence and machine learning: Focus on radiomics. Diagn. Interv. Radiol. 2022, 28, 450–462. [Google Scholar] [CrossRef] [PubMed]
- Sarvamangala, D.R.; Kulkarni, R.V. Convolutional neural networks in medical image understanding: A survey. Evol. Intell. 2022, 15, 1–22. [Google Scholar] [CrossRef] [PubMed]
- Yadav, S.S.; Jadhav, S.M. Deep convolutional neural network based medical image classification for disease diagnosis. J. Big Data 2019, 6, 113. [Google Scholar] [CrossRef]
- Ho, C.S.; Chen, Y.P.; Fan, T.Y.; Kuo, C.F.; Yen, T.Y.; Liu, Y.C.; Pei, Y.C. Application of deep learning neural network in predicting bone mineral density from plain X-ray radiography. Arch Osteoporos 2021, 16, 1–12. [Google Scholar] [CrossRef] [PubMed]
- Nazia Fathima, S.M.; Tamilselvi, R.; Parisa Beham, M.; Sabarinathan, D. Diagnosis of Osteoporosis using modified U-net architecture with attention unit in DEXA and X-ray images. J. X-ray Sci. Technol. 2020, 28, 953–973. [Google Scholar] [CrossRef] [PubMed]
- Hsieh, C.I.; Zheng, K.; Lin, C.; Mei, L.; Lu, L.; Li, W. Automated bone mineral density prediction and fracture risk assessment using plain radiographs via deep learning. Nat. Commun. 2021, 12, 5472. [Google Scholar] [CrossRef]
- Sukegawa, S.; Fujimura, A.; Taguchi, A.; Yamamoto, N.; Kitamura, A.; Goto, R. Identification of osteoporosis using ensemble deep learning model with panoramic radiographs and clinical covariates. Sci. Rep. 2022, 12, 6088. [Google Scholar] [CrossRef] [PubMed]
- Yamamoto, N.; Sukegawa, S.; Kitamura, A.; Goto, R.; Noda, T.; Nakano, K. Deep Learning for Osteoporosis Classification Using Hip Radiographs and Patient Clinical Covariates. Biomolecules 2020, 10, 1534. [Google Scholar] [CrossRef] [PubMed]
- Lee, K.S.; Jung, S.K.; Ryu, J.J.; Shin, S.W.; Choi, J. Evaluation of Transfer Learning with Deep Convolutional Neural Networks for Screening Osteoporosis in Dental Panoramic Radiographs. J. Clin. Med. 2020, 9, 392. [Google Scholar] [CrossRef] [PubMed]
- Zhang, B.; Yu, K.; Ning, Z.; Wang, K.; Dong, Y.; Liu, X. Deep learning of lumbar spine X-ray for osteopenia and osteoporosis screening: A multicenter retrospective cohort study. Bone 2020, 140, 115561. [Google Scholar] [CrossRef] [PubMed]
- Areeckal, A.S.; Jayasheelan, N.; Kamath, J.; Zawadynski, S.; Kocher, M.; David, S.S. Early diagnosis of osteoporosis using radiogrammetry and texture analysis from hand and wrist radiographs in Indian population. Osteoporos. Int. 2018, 29, 665–673. [Google Scholar] [CrossRef]
- Kavitha, M.S.; An, S.Y.; An, C.H.; Huh, K.H.; Yi, W.J.; Heo, M.S. Texture analysis of mandibular cortical bone on digital dental panoramic radiographs for the diagnosis of osteoporosis in Korean women. Oral Surg. Oral Med. Oral Pathol. Oral Radiol. 2015, 119, 346–356. [Google Scholar] [CrossRef] [PubMed]
- Kavitha, M.S.; Ganesh Kumar, P.; Park, S.Y.; Huh, K.H.; Heo, M.S.; Kurita, T. Automatic detection of osteoporosis based on hybrid genetic swarm fuzzy classifier approaches. Dentomaxillofac. Radiol. 2016, 45, 20160076. [Google Scholar] [CrossRef] [PubMed]
- Chu, P.; Bo, C.; Liang, X.; Yang, J.; Megalooikonomou, V.; Yang, F. Using Octuplet Siamese Network For Osteoporosis Analysis On Dental Panoramic Radiographs. In Proceedings of the 2018 40th Annual International Conference of the IEEE Engineering in Medicine and Biology Society (EMBC), Honolulu, HI, USA, 18–21 July 2018; Volume 2018, pp. 2579–2582. [Google Scholar]
- Hwang, J.J.; Lee, J.H.; Han, S.S.; Kim, Y.H.; Jeong, H.G.; Choi, Y.J. Strut analysis for osteoporosis detection model using dental panoramic radiography. Dentomaxillofac. Radiol. 2017, 46, 20170006. [Google Scholar] [CrossRef] [PubMed]
- Lee, J.S.; Adhikari, S.; Liu, L.; Jeong, H.G.; Kim, H.; Yoon, S.J. Osteoporosis detection in panoramic radiographs using a deep convolutional neural network-based computer-assisted diagnosis system: A preliminary study. Dentomaxillofac. Radiol. 2019, 48, 20170344. [Google Scholar] [CrossRef] [PubMed]
- Oulhaj, H.; Rziza, M.; Amine, A.; Toumi, H.; Lespessailles, E.; Hassouni, M.E. Anisotropic Discrete Dual-Tree Wavelet Transform for Improved Classification of Trabecular Bone. IEEE Trans. Med. Imaging 2017, 36, 2077–2086. [Google Scholar] [CrossRef] [PubMed]
- Zheng, K.; Harris, C.E.; Jennane, R.; Makrogiannis, S. Integrative blockwise sparse analysis for tissue characterization and classification. Artif. Intell. Med. 2020, 107, 101885. [Google Scholar] [CrossRef] [PubMed]
- Nasser, Y.; Hassouni, M.E.; Brahim, A.; Toumi, H.; Lespessailles, E. Diagnosis of osteoporosis disease from bone X-ray images with stacked sparse autoencoder and SVM classifier. In 2017 International Conference on Advanced Technologies for Signal and Image Processing (ATSIP), Fez, Morocco, 22–24 May 2017; Jennane, R., Ed.; IEEE Xplore: Piscataway, NJ, USA, 2017. [Google Scholar]
- Bhattacharya, S.; Nair, D.; Bhan, A.; Goyal, A. Computer Based Automatic Detection and Classification of Osteoporosis in Bone Radiographs. In Proceedings of the 2019 6th International Conference on Signal Processing and Integrated Networks (SPIN), Noida, India, 7–8 March 2019; IEEE: New York, NY, USA, 2019; pp. 1047–1052. [Google Scholar] [CrossRef]
- Jang, R.; Choi, J.H.; Kim, N.; Chang, J.S.; Yoon, P.W.; Kim, C.-H. Prediction of osteoporosis from simple hip radiography using deep learning algorithm. Sci. Rep. 2021, 11, 19997. [Google Scholar] [CrossRef] [PubMed]
- Nguyen, T.P.; Chae, D.-S.; Park, S.-J.; Yoon, J. A novel approach for evaluating bone mineral density of hips based on Sobel gradient-based map of radiographs utilizing convolutional neural network. Comput. Biol. Med. 2021, 132, 104298. [Google Scholar] [CrossRef] [PubMed]
- Singh, Y.; Atulkar, V.; Ren, J.; Yang, J.; Fan, H.; Latecki, L.J.; Ling, H. Osteoporosis Prescreening and Bone Mineral Density Prediction using Dental Panoramic Radiographs. In Proceedings of the 2021 43rd Annual International Conference of the IEEE Engineering in Medicine & Biology Society (EMBC), Mexico City, Mexico, 1–5 November 2021; IEEE: New York, NY, USA, 2021; pp. 2700–2703. [Google Scholar] [CrossRef]
- Hong, N.; Cho, S.W.; Shin, S.; Lee, S.; Jang, S.A.; Roh, S. Deep-Learning-Based Detection of Vertebral Fracture and Osteoporosis Using Lateral Spine X-ray Radiography. J. Bone Miner. Res. 2023, 38, 887–895. [Google Scholar] [CrossRef] [PubMed]
- Nakamoto, T.; Taguchi, A.; Kakimoto, N. Osteoporosis screening support system from panoramic radiographs using deep learning by convolutional neural network. Dentomaxillofac. Radiol. 2022, 51, 20220135. [Google Scholar] [CrossRef] [PubMed]
- Lee, S.; Choe, E.K.; Kang, H.Y.; Yoon, J.W.; Kim, H.S. The exploration of feature extraction and machine learning for predicting bone density from simple spine X-ray images in a Korean population. Skelet. Radiol. 2020, 49, 613–618. [Google Scholar] [CrossRef] [PubMed]
- Mohammadi, F.G.; Sebro, R. Opportunistic Screening for Osteoporosis Using Hand Radiographs: A Preliminary Study. Stud. Health Technol. Inf. 2023, 302, 911–912. [Google Scholar]
- Mao, L.; Xia, Z.; Pan, L.; Chen, J.; Liu, X.; Li, Z. Deep learning for screening primary osteopenia and osteoporosis using spine radiographs and patient clinical covariates in a Chinese population. Front. Endocrinol. 2022, 13, 971877. [Google Scholar] [CrossRef] [PubMed]
- Nayak, S.; Olkin, I.; Liu, H.; Grabe, M.; Gould, M.K.; Allen, I.E.; Owens, D.K.; Bravata, D.M. Meta-Analysis: Accuracy of Quantitative Ultrasound for Identifying Patients with Osteoporosis. Ann. Intern. Med. 2006, 144, 832. [Google Scholar] [CrossRef] [PubMed]
- Moayyeri, A.; Adams, J.E.; Adler, R.A.; Krieg, M.-A.; Hans, D.; Compston, J.; Lewiecki, E.M. Quantitative ultrasound of the heel and fracture risk assessment: An updated meta-analysis. Osteoporos. Int. 2012, 23, 143–153. [Google Scholar] [CrossRef] [PubMed]
- Varoquaux, G.; Cheplygina, V. Machine learning for medical imaging: Methodological failures and recommendations for the future. NPJ Digit. Med. 2022, 5, 48. [Google Scholar] [CrossRef] [PubMed]
- Chlap, P.; Min, H.; Vandenberg, N.; Dowling, J.; Holloway, L.; Haworth, A. A review of medical image data augmentation techniques for deep learning applications. J. Med. Imaging Radiat. Oncol. 2021, 65, 545–563. [Google Scholar] [CrossRef] [PubMed]
- Torrey, L.; Shavlik, J. Transfer Learning. In Handbook of Research on Machine Learning Applications and Trends; IGI Global: Hershey, PA, USA, 2010; pp. 242–264. [Google Scholar] [CrossRef]
- Ricci Lara, M.A.; Echeveste, R.; Ferrante, E. Addressing fairness in artificial intelligence for medical imaging. Nat. Commun. 2022, 13, 4581. [Google Scholar] [CrossRef] [PubMed]
- Banerjee, I.; Bhattacharjee, K.; Burns, J.L.; Trivedi, H.; Purkayastha, S.; Seyyed-Kalantari, L.; Patel, B.N.; Shiradkar, R.; Gichoya, J. “Shortcuts” Causing Bias in Radiology Artificial Intelligence: Causes, Evaluation, and Mitigation. J. Am. Coll. Radiol. 2023, 20, 842–851. [Google Scholar] [CrossRef]
- Martins, M.V.; Baptista, L.; Luís, H.; Assunção, V.; Araújo, M.-R.; Realinho, V. Machine Learning in X-ray Diagnosis for Oral Health: A Review of Recent Progress. Computation 2023, 11, 115. [Google Scholar] [CrossRef]
- Albuquerque, G.A.; Carvalho, D.D.A.; Cruz, A.S.; Santos, J.P.Q.; Machado, G.M.; Gendriz, I.S.; Fernandes, F.R.S.; Barbalho, I.M.P.; Santos, M.M.; Teixeira, C.A.D.; et al. Osteoporosis screening using machine learning and electromagnetic waves. Sci. Rep. 2023, 13, 12865. [Google Scholar] [CrossRef] [PubMed]
- Socha, M.; Prażuch, W.; Suwalska, A.; Foszner, P.; Tobiasz, J.; Jaroszewicz, J.; Gruszczynska, K.; Sliwinska, M.; Nowak, M.; Gizycka, B.; et al. Pathological changes or technical artefacts? The problem of the heterogenous databases in COVID-19 CXR image analysis. Comput. Methods Programs Biomed. 2023, 240, 107684. [Google Scholar] [CrossRef] [PubMed]
- Kotter, E.; Ranschaert, E. Challenges and solutions for introducing artificial intelligence (AI) in daily clinical workflow. Eur. Radiol. 2021, 31, 5–7. [Google Scholar] [CrossRef] [PubMed]
- Recht, M.P.; Dewey, M.; Dreyer, K.; Langlotz, C.; Niessen, W.; Prainsack, B.; Smith, J.J. Integrating artificial intelligence into the clinical practice of radiology: Challenges and recommendations. Eur. Radiol. 2020, 30, 3576–3584. [Google Scholar] [CrossRef] [PubMed]
- Daye, D.; Wiggins, W.F.; Lungren, M.P.; Alkasab, T.; Kottler, N.; Allen, B.; Roth, C.J.; Bizzo, B.C.; Durniak, K.; Brink, J.A.; et al. Implementation of Clinical Artificial Intelligence in Radiology: Who Decides and How? Radiology 2022, 305, 555–563. [Google Scholar] [CrossRef] [PubMed]
- Pesapane, F.; Suter, M.B.; Codari, M.; Patella, F.; Volonté, C.; Sardanelli, F. Regulatory issues for artificial intelligence in radiology. In Precision Medicine for Investigators, Practitioners and Providers; Elsevier: Amsterdam, The Netherlands, 2020; pp. 533–543. [Google Scholar] [CrossRef]
- Petrick, N.; Chen, W.; Delfino, J.G.; Gallas, B.D.; Kang, Y.; Krainak, D.; Sahiner, B.; Samala, R.K. Regulatory considerations for medical imaging AI/ML devices in the United States: Concepts and challenges. J. Med. Imaging 2023, 10, 051804. [Google Scholar] [CrossRef] [PubMed]
- Selvaraju, R.R.; Cogswell, M.; Das, A.; Vedantam, R.; Parikh, D.; Batra, D. Grad-CAM: Visual Explanations from Deep Networks via Gradient-Based Localization. Int. J. Comput. Vis. 2020, 128, 336–359. [Google Scholar] [CrossRef]
- Springenberg, J.T.; Dosovitskiy, A.; Brox, T.; Riedmiller, M. Striving for Simplicity: The All Convolutional Net. arxiv 2014, arXiv:1412.6806. [Google Scholar]
- Rahim, F.; Zaki Zadeh, A.; Javanmardi, P.; Emmanuel Komolafe, T.; Khalafi, M.; Arjomandi, A.; Ghofrani, H.A.; Shirbandi, K. Machine learning algorithms for diagnosis of hip bone osteoporosis: A systematic review and meta-analysis study. BioMed. Eng. OnLine 2023, 22, 68. [Google Scholar] [CrossRef] [PubMed]
- Pickhardt, P.J.; Nguyen, T.; Perez, A.A.; Graffy, P.M.; Jang, S.; Summers, R.M.; Garrett, J.W. Improved CT-based Osteoporosis Assessment with a Fully Automated Deep Learning Tool. Radiol. Artif. Intell. 2022, 4, e220042. [Google Scholar] [CrossRef] [PubMed]
- Zhao, Y.; Zhao, T.; Chen, S.; Zhang, X.; Sosa, M.S.; Liu, J.; Mo, X.; Chen, X.; Huang, M.; Li, S.; et al. Fully automated radiomic screening pipeline for osteoporosis and abnormal bone density with a deep learning-based segmentation using a short lumbar mDixon sequence. Quant. Imaging Med. Surg. 2022, 12, 1198–1213. [Google Scholar] [CrossRef] [PubMed]
- Hans, D.; Shevroja, E.; Leslie, W.D. Evolution in fracture risk assessment: Artificial versus augmented intelligence. Osteoporos. Int. 2021, 32, 209–212. [Google Scholar] [CrossRef] [PubMed]
- Yosibash, Z.; Trabelsi, N.; Buchnik, I.; Myers, K.W.; Salai, M.; Eshed, I.; Barash, Y.; Klang, E.; Tripto-Shkolnik, L. Hip Fracture Risk Assessment in Elderly and Diabetic Patients: Combining Autonomous Finite Element Analysis and Machine Learning. J. Bone Miner. Res. 2023, 38, 876–886. [Google Scholar] [CrossRef] [PubMed]

Disclaimer/Publisher’s Note: The statements, opinions and data contained in all publications are solely those of the individual author(s) and contributor(s) and not of MDPI and/or the editor(s). MDPI and/or the editor(s) disclaim responsibility for any injury to people or property resulting from any ideas, methods, instructions or products referred to in the content. |
© 2024 by the authors. Licensee MDPI, Basel, Switzerland. This article is an open access article distributed under the terms and conditions of the Creative Commons Attribution (CC BY) license (https://creativecommons.org/licenses/by/4.0/).
Share and Cite
Liu, R.W.; Ong, W.; Makmur, A.; Kumar, N.; Low, X.Z.; Shuliang, G.; Liang, T.Y.; Ting, D.F.K.; Tan, J.H.; Hallinan, J.T.P.D. Application of Artificial Intelligence Methods on Osteoporosis Classification with Radiographs—A Systematic Review. Bioengineering 2024, 11, 484. https://doi.org/10.3390/bioengineering11050484
Liu RW, Ong W, Makmur A, Kumar N, Low XZ, Shuliang G, Liang TY, Ting DFK, Tan JH, Hallinan JTPD. Application of Artificial Intelligence Methods on Osteoporosis Classification with Radiographs—A Systematic Review. Bioengineering. 2024; 11(5):484. https://doi.org/10.3390/bioengineering11050484
Chicago/Turabian StyleLiu, Ren Wei, Wilson Ong, Andrew Makmur, Naresh Kumar, Xi Zhen Low, Ge Shuliang, Tan Yi Liang, Dominic Fong Kuan Ting, Jiong Hao Tan, and James Thomas Patrick Decourcy Hallinan. 2024. "Application of Artificial Intelligence Methods on Osteoporosis Classification with Radiographs—A Systematic Review" Bioengineering 11, no. 5: 484. https://doi.org/10.3390/bioengineering11050484
APA StyleLiu, R. W., Ong, W., Makmur, A., Kumar, N., Low, X. Z., Shuliang, G., Liang, T. Y., Ting, D. F. K., Tan, J. H., & Hallinan, J. T. P. D. (2024). Application of Artificial Intelligence Methods on Osteoporosis Classification with Radiographs—A Systematic Review. Bioengineering, 11(5), 484. https://doi.org/10.3390/bioengineering11050484