
Gait Recognition and Assistance Parameter Prediction Determination Based on Kinematic Information Measured by Inertial Measurement Units


Abstract
1. Introduction
2. Related Works
3. Materials and Methods
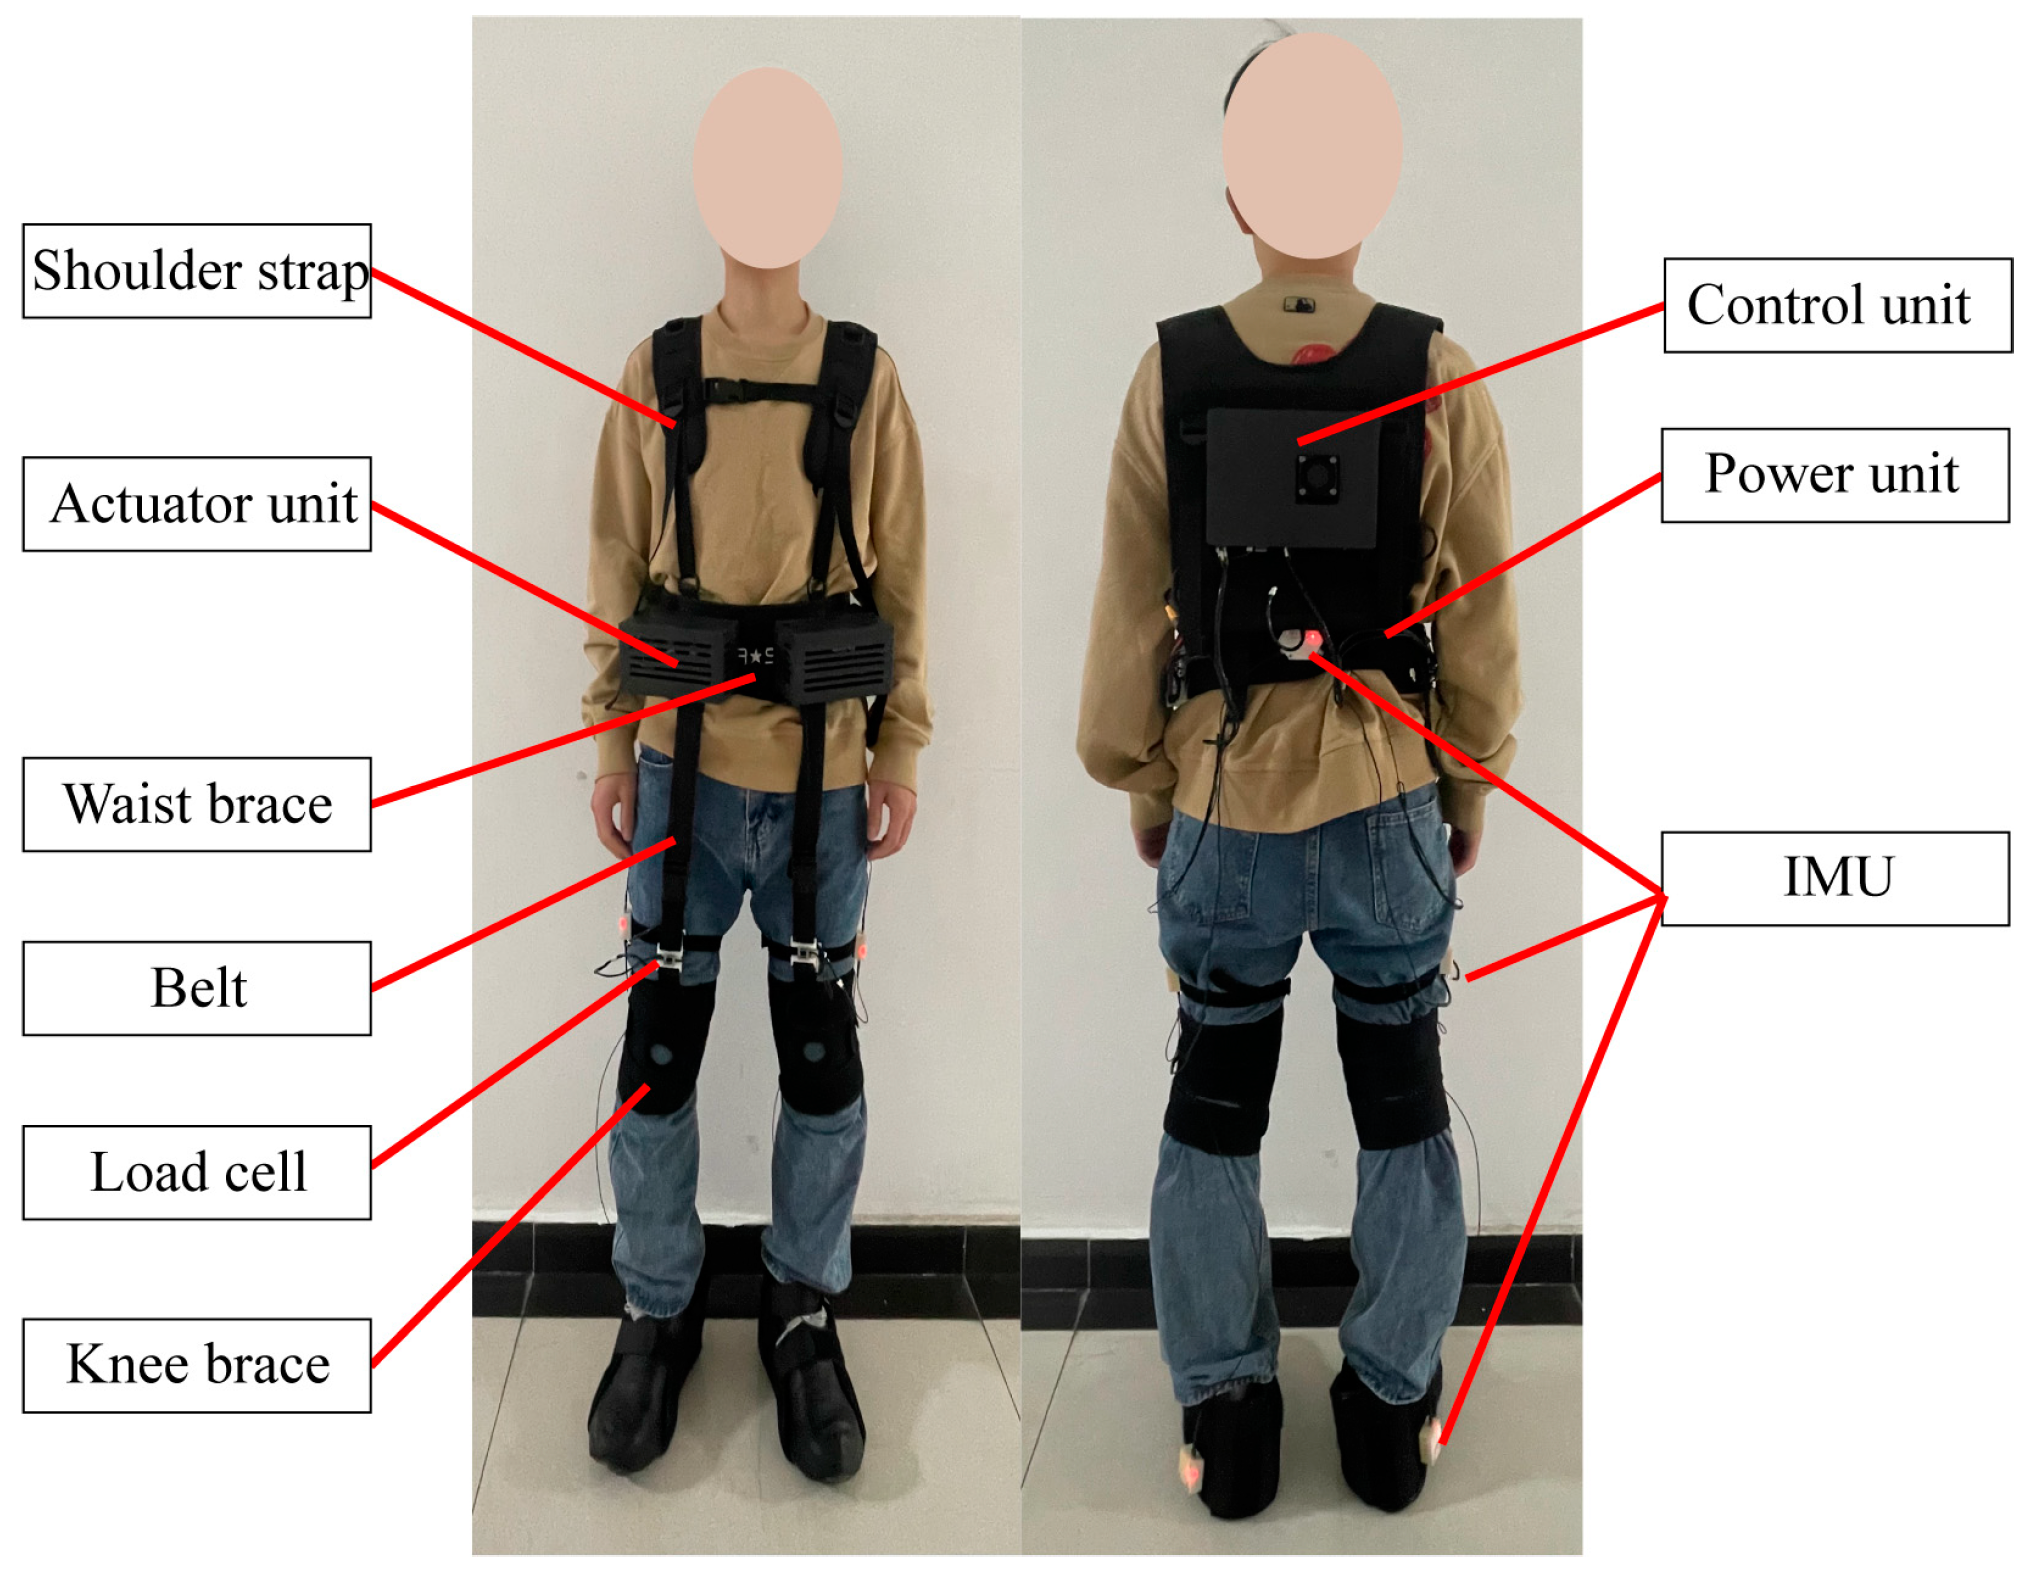
3.1. The Soft Lower-Limb Exoskeleton Platform
3.2. Data Collection and Preprocessing
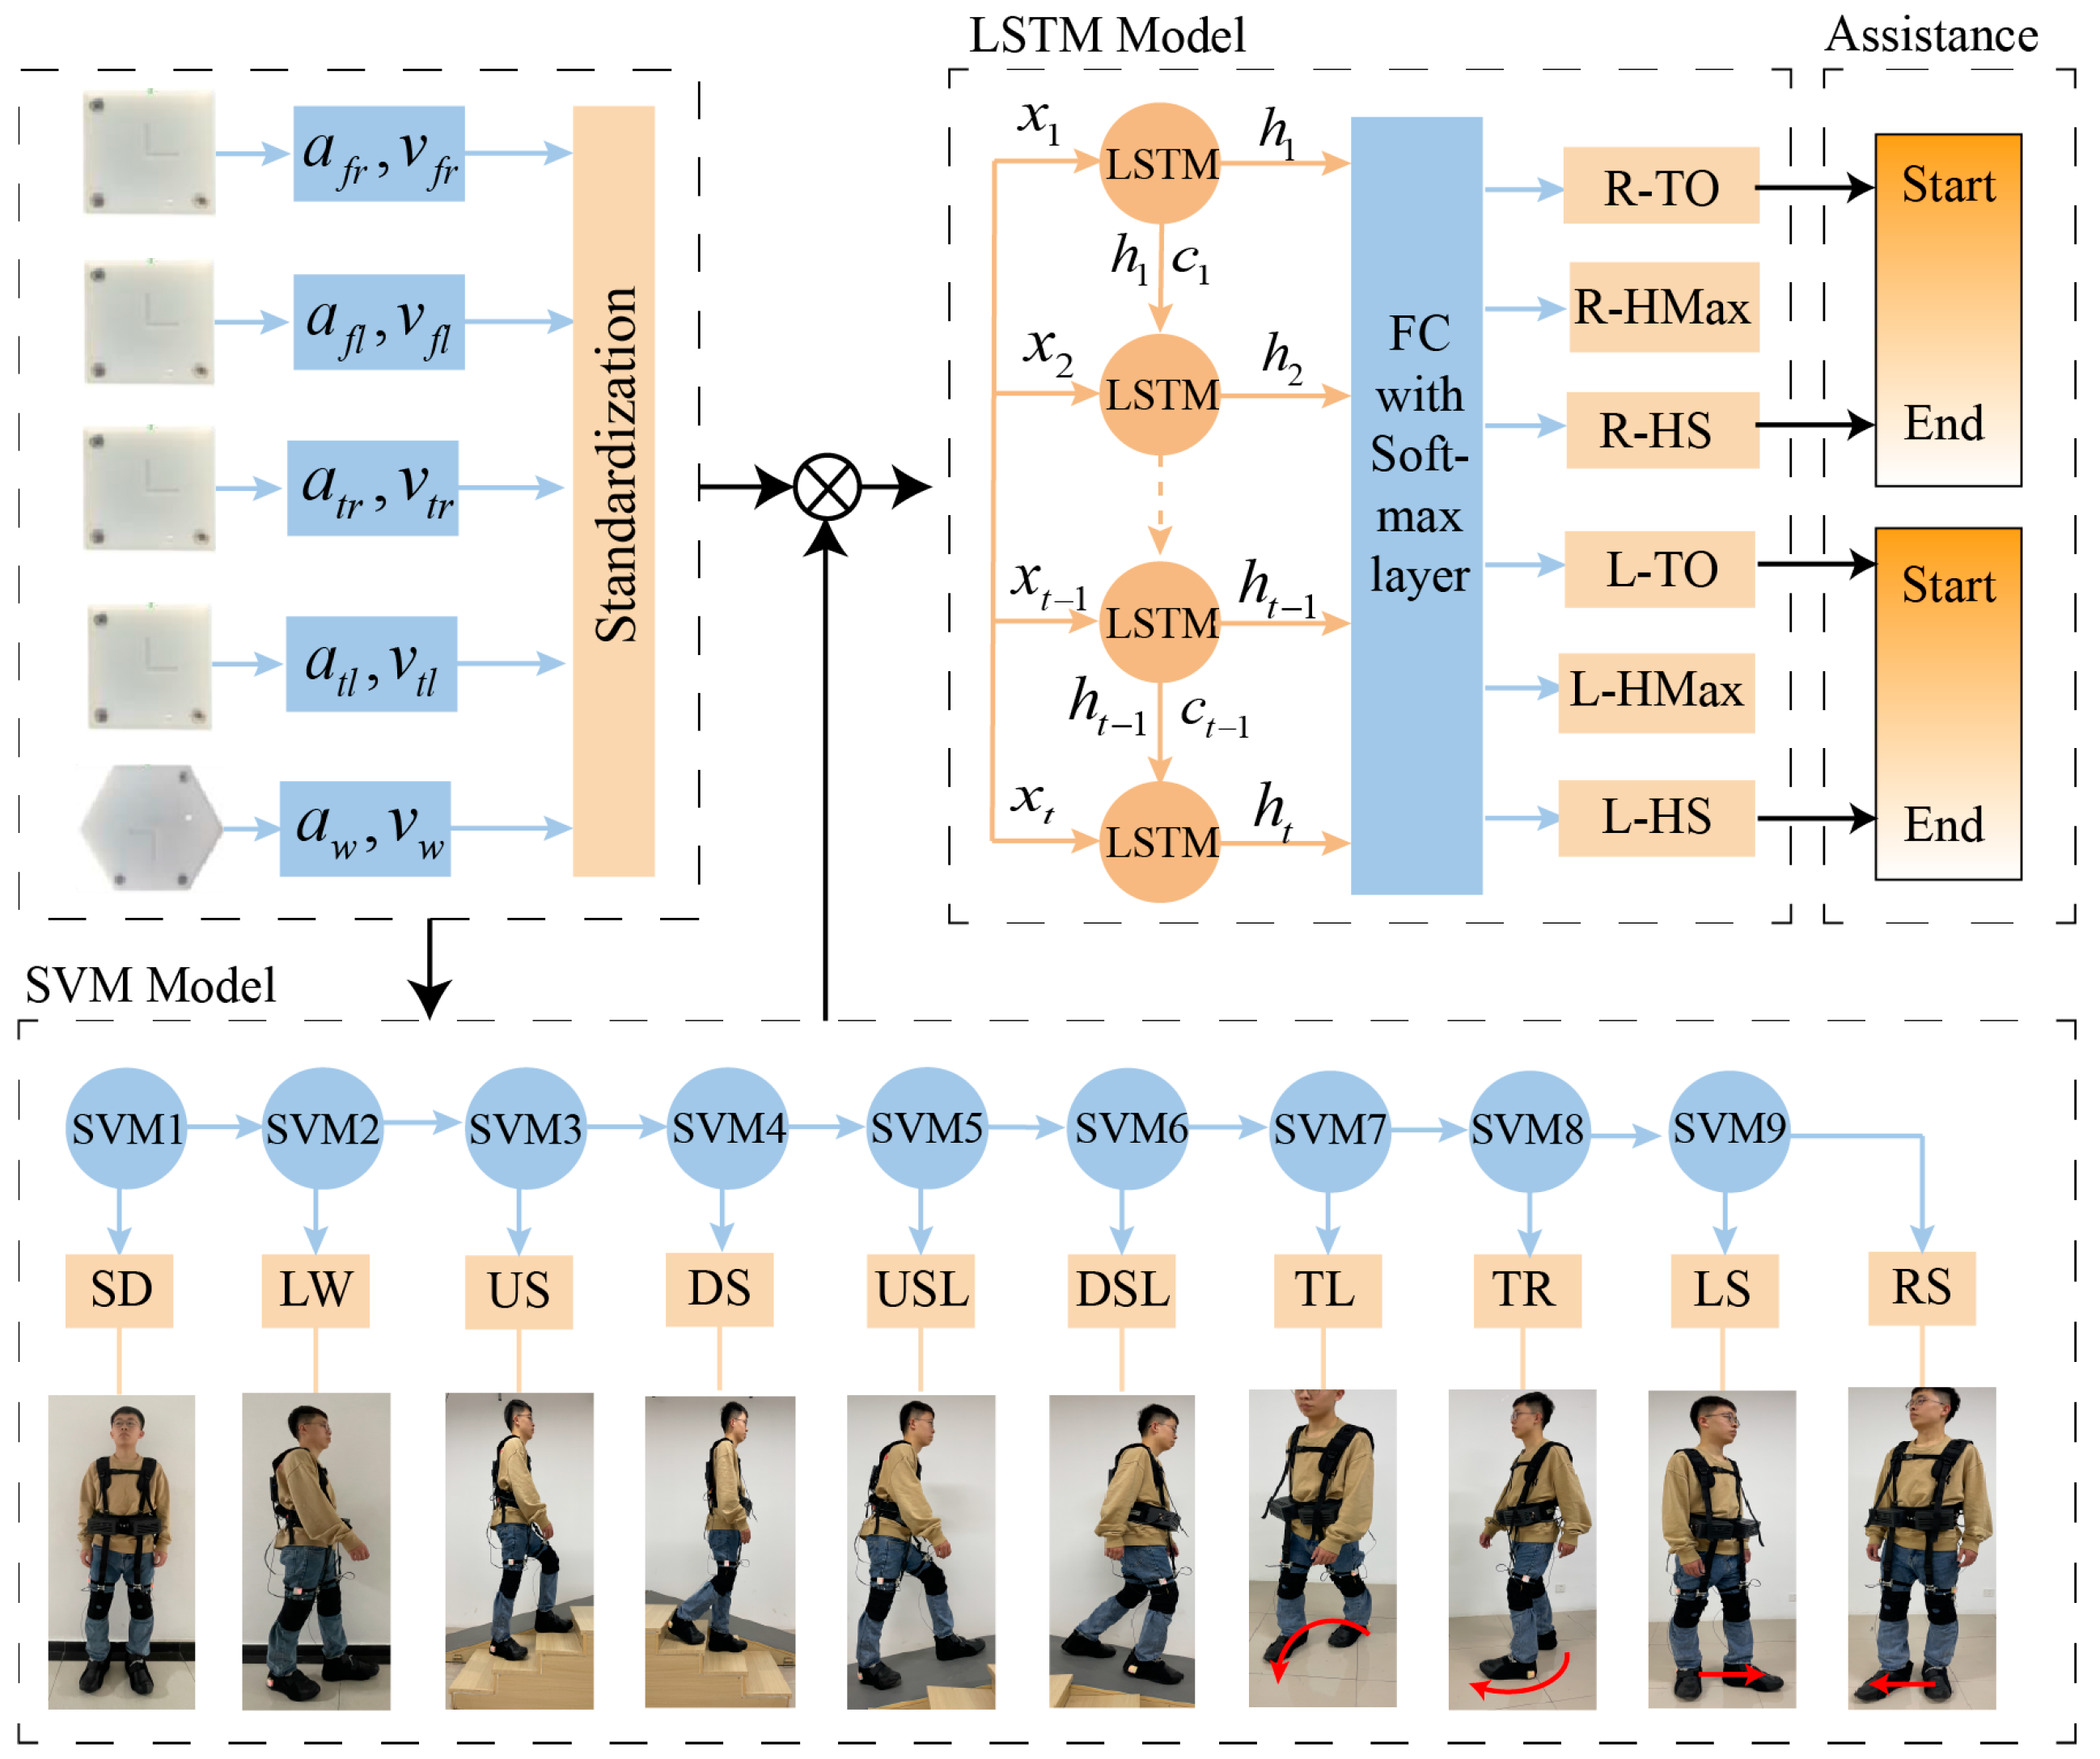
3.3. Feature Extraction
3.4. Gait Recognition Model
4. Experiment
4.1. Subjects
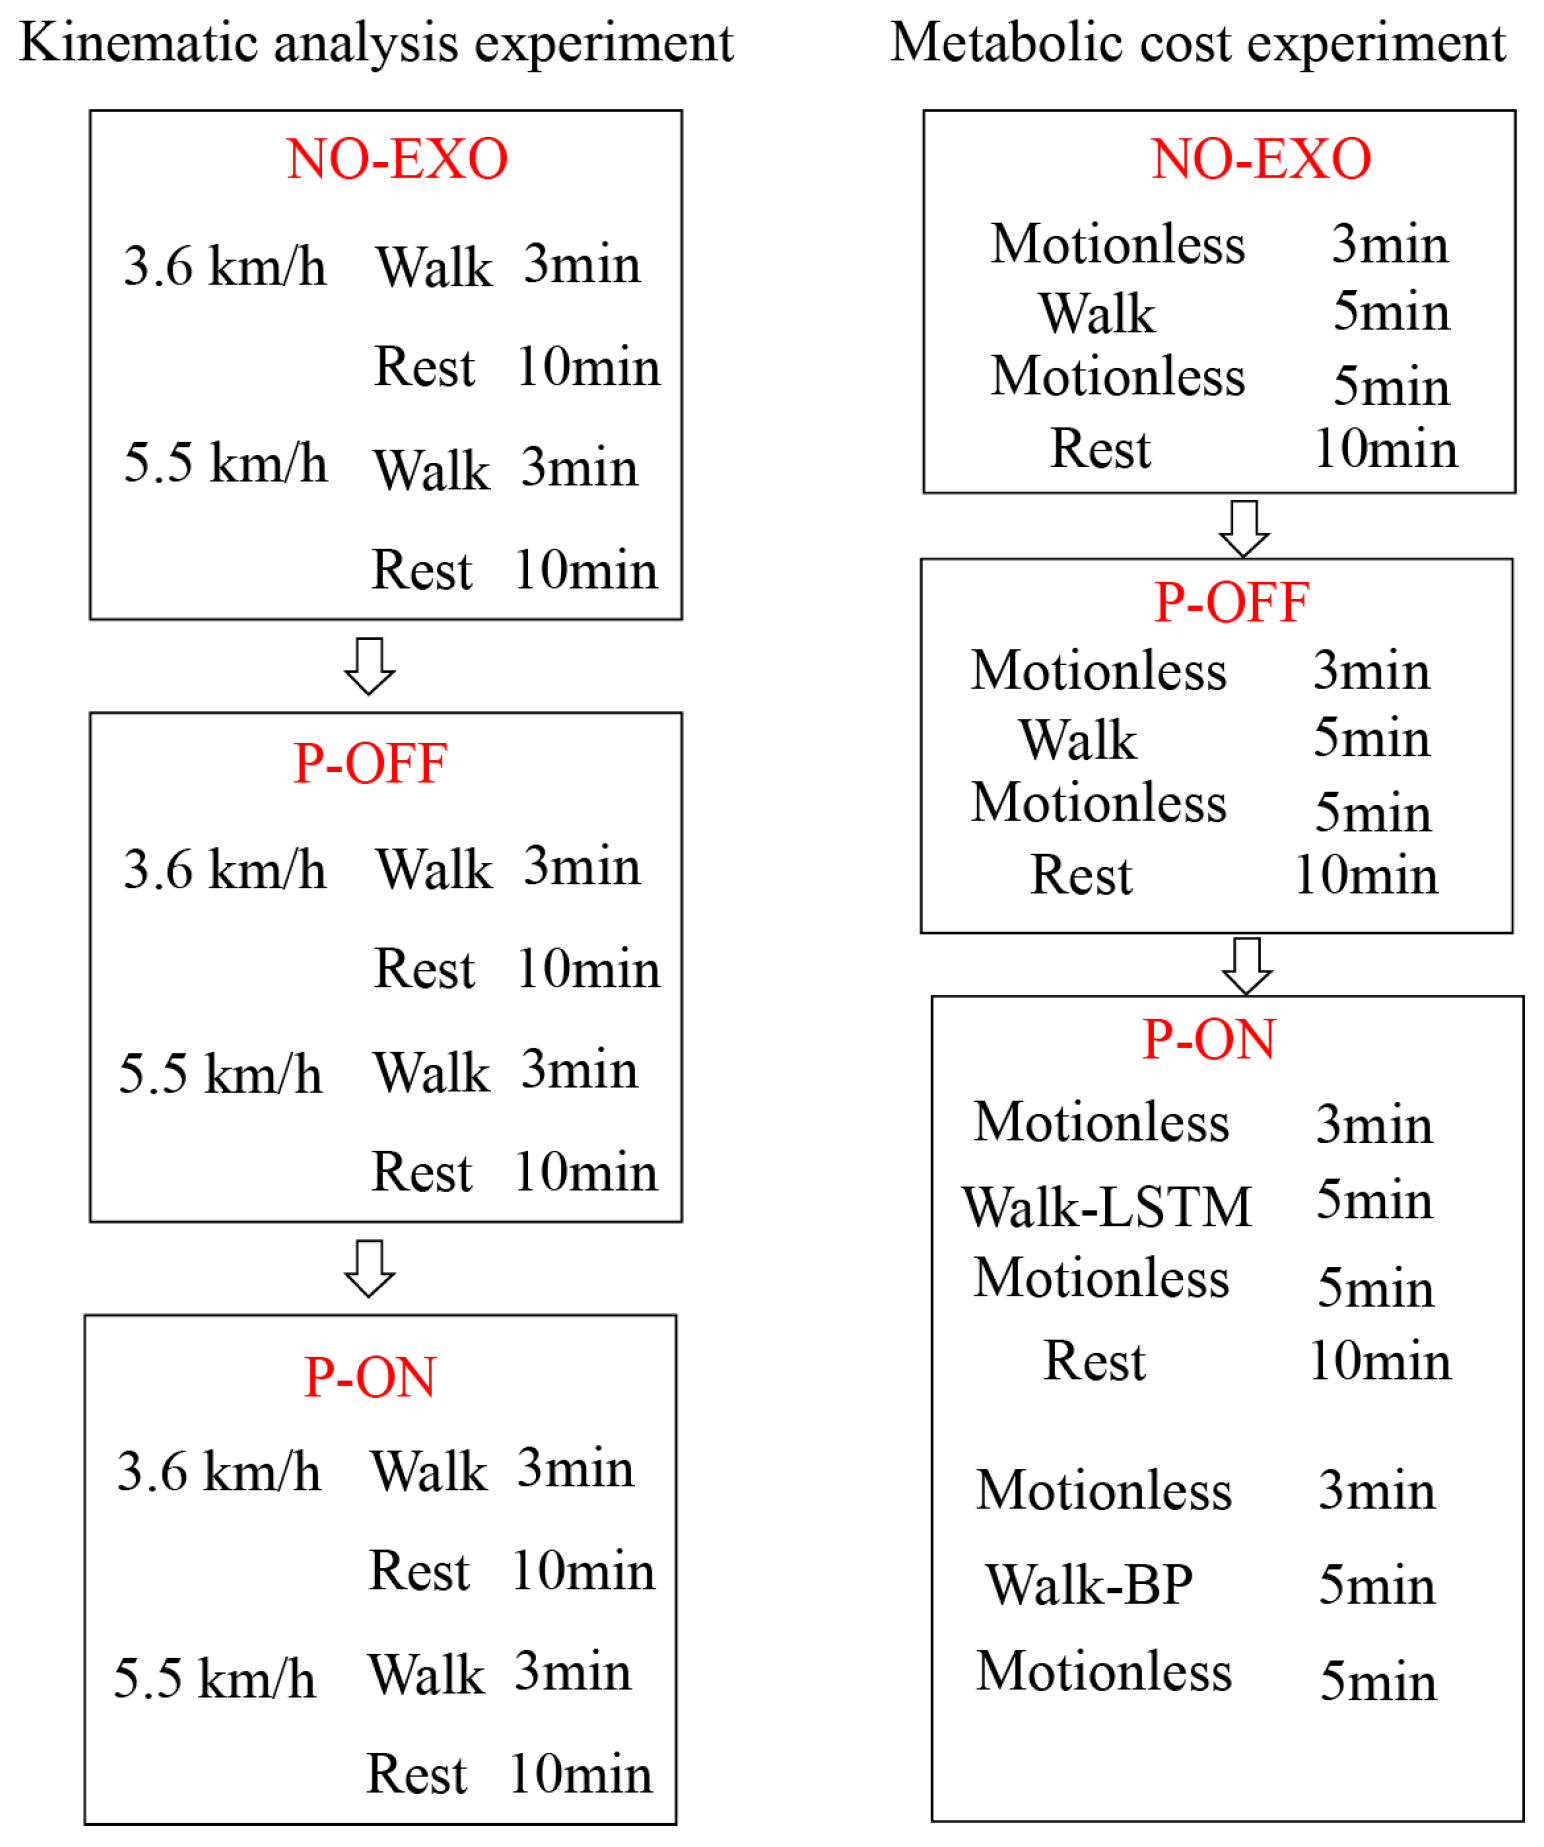
4.2. Protocol
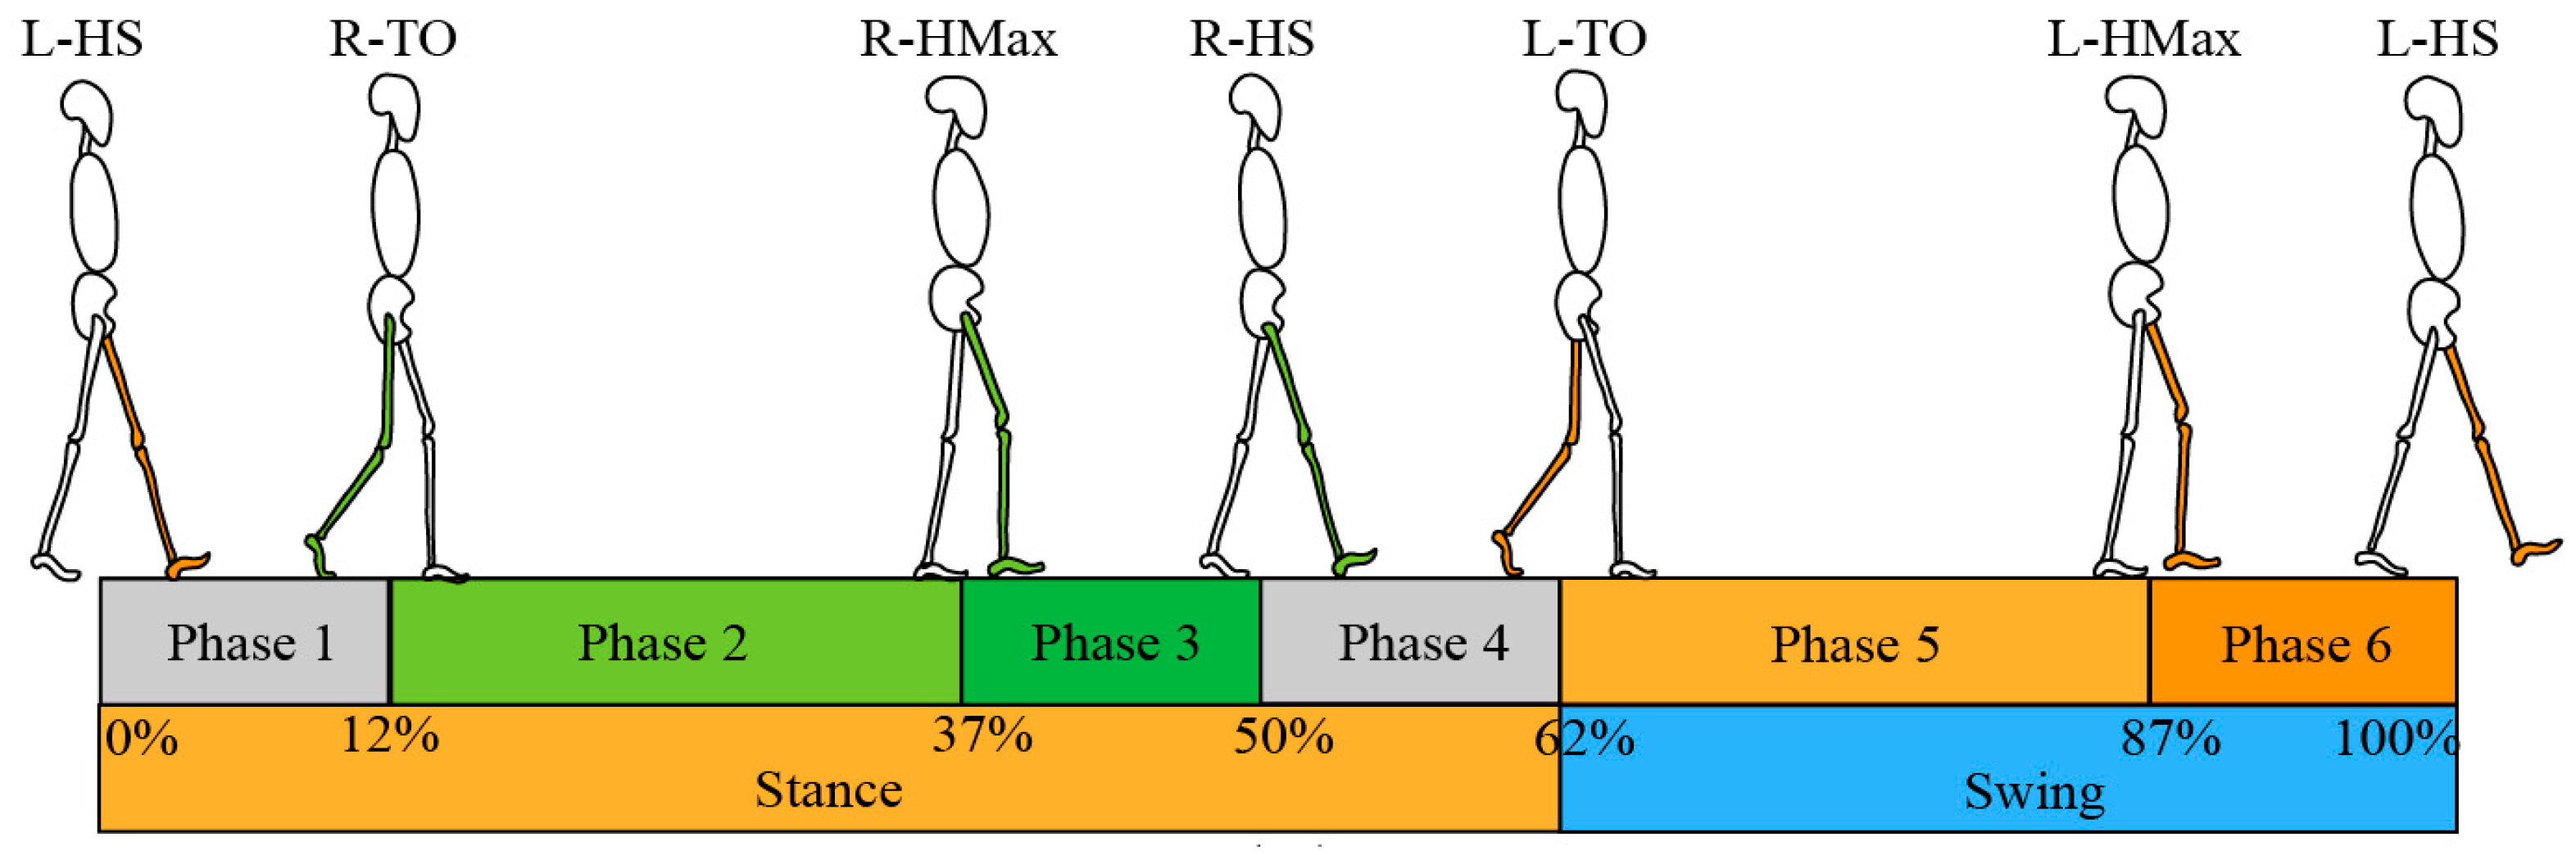
4.2.1. Gait Classification and Gait Phase Recognition
4.2.2. Assistance Effect Experiment
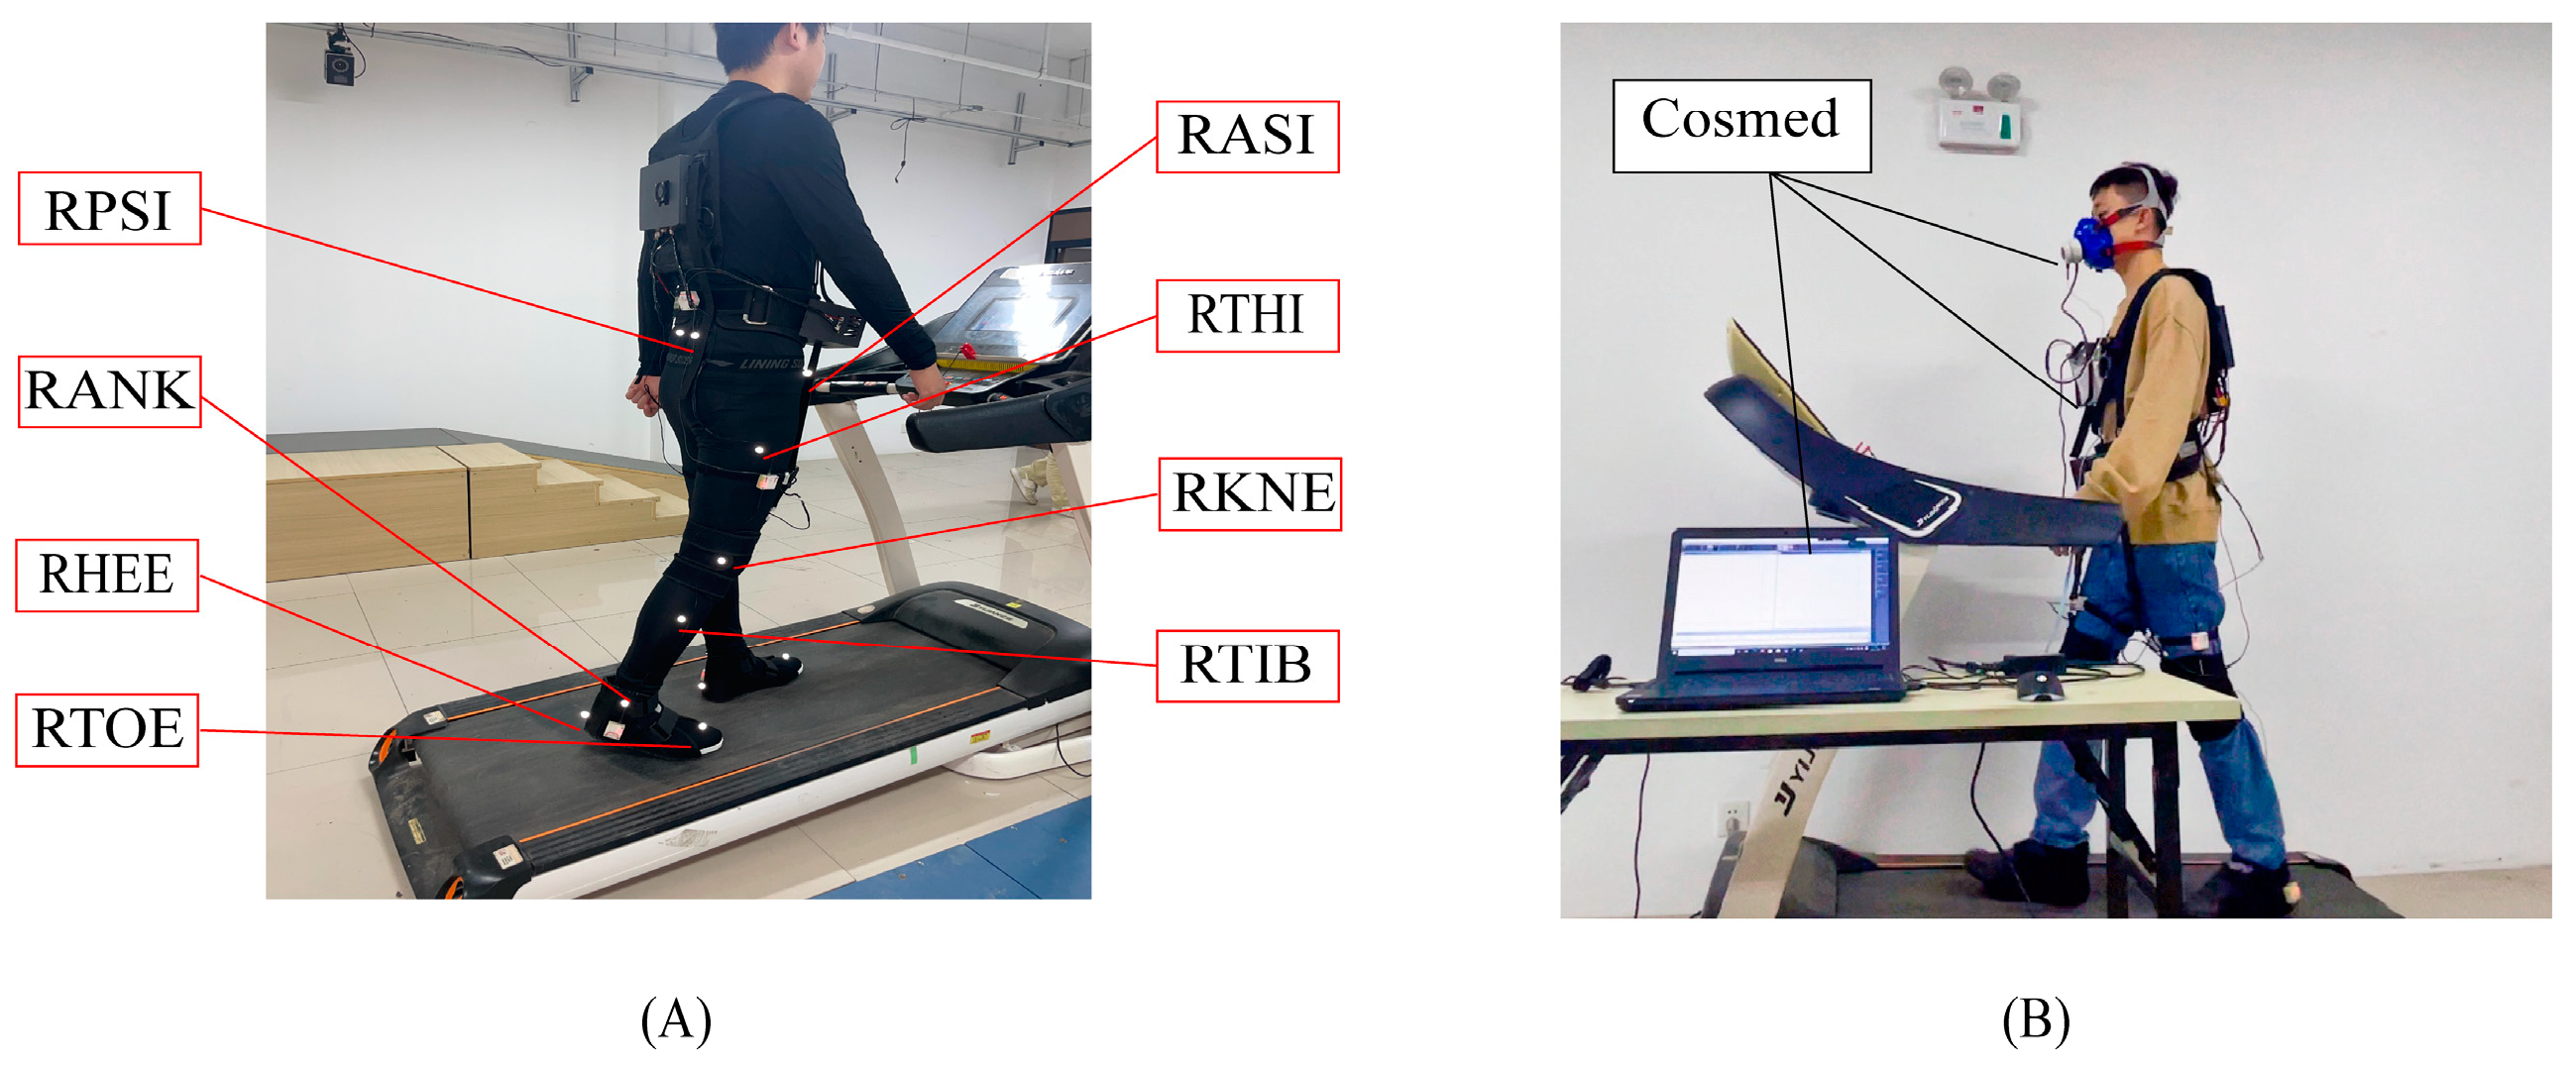
4.3. Data Collection
4.4. Statistical Analysis
5. Results
5.1. Accuracy of Motion State Recognition
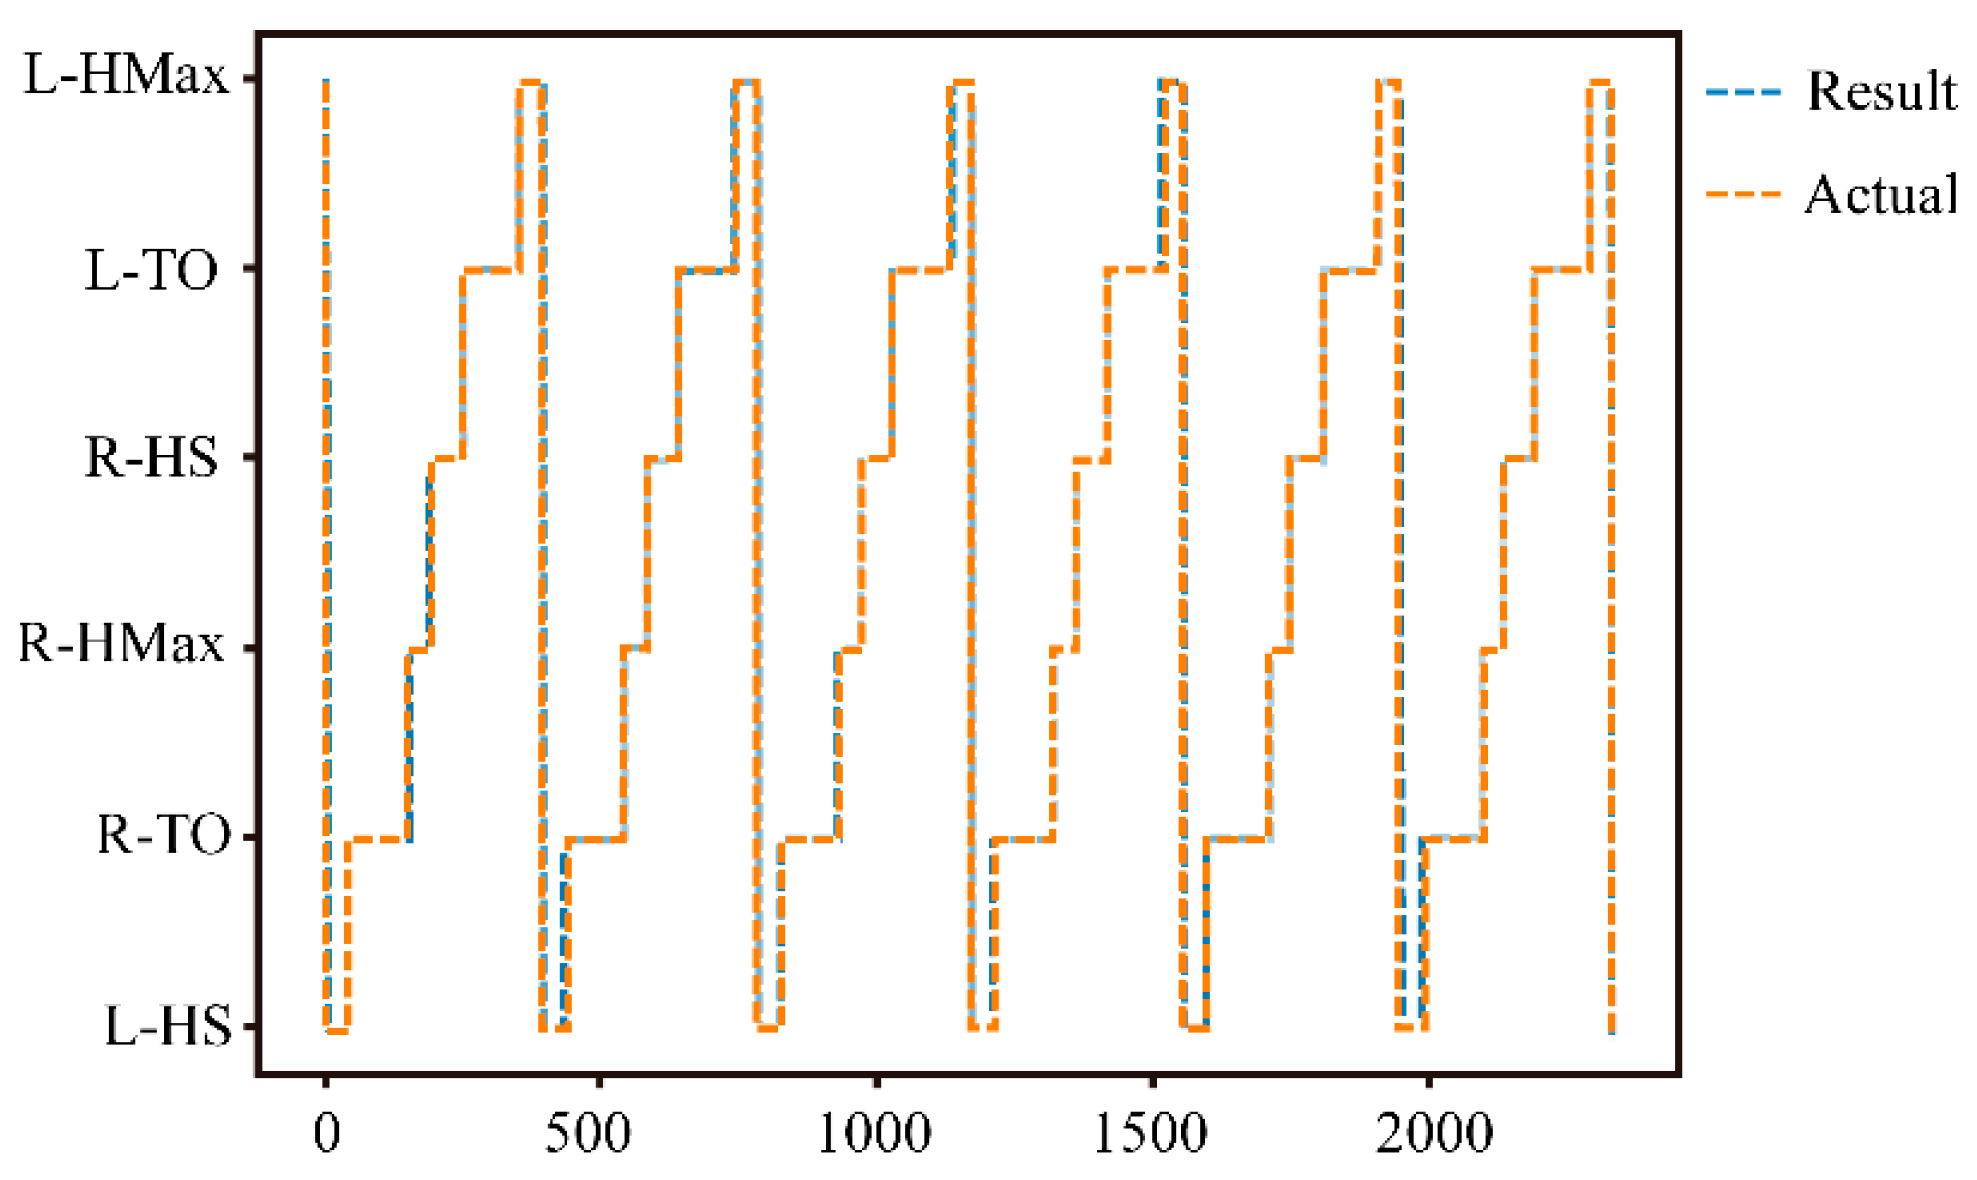
5.2. Accuracy of Gait Phase Recognition
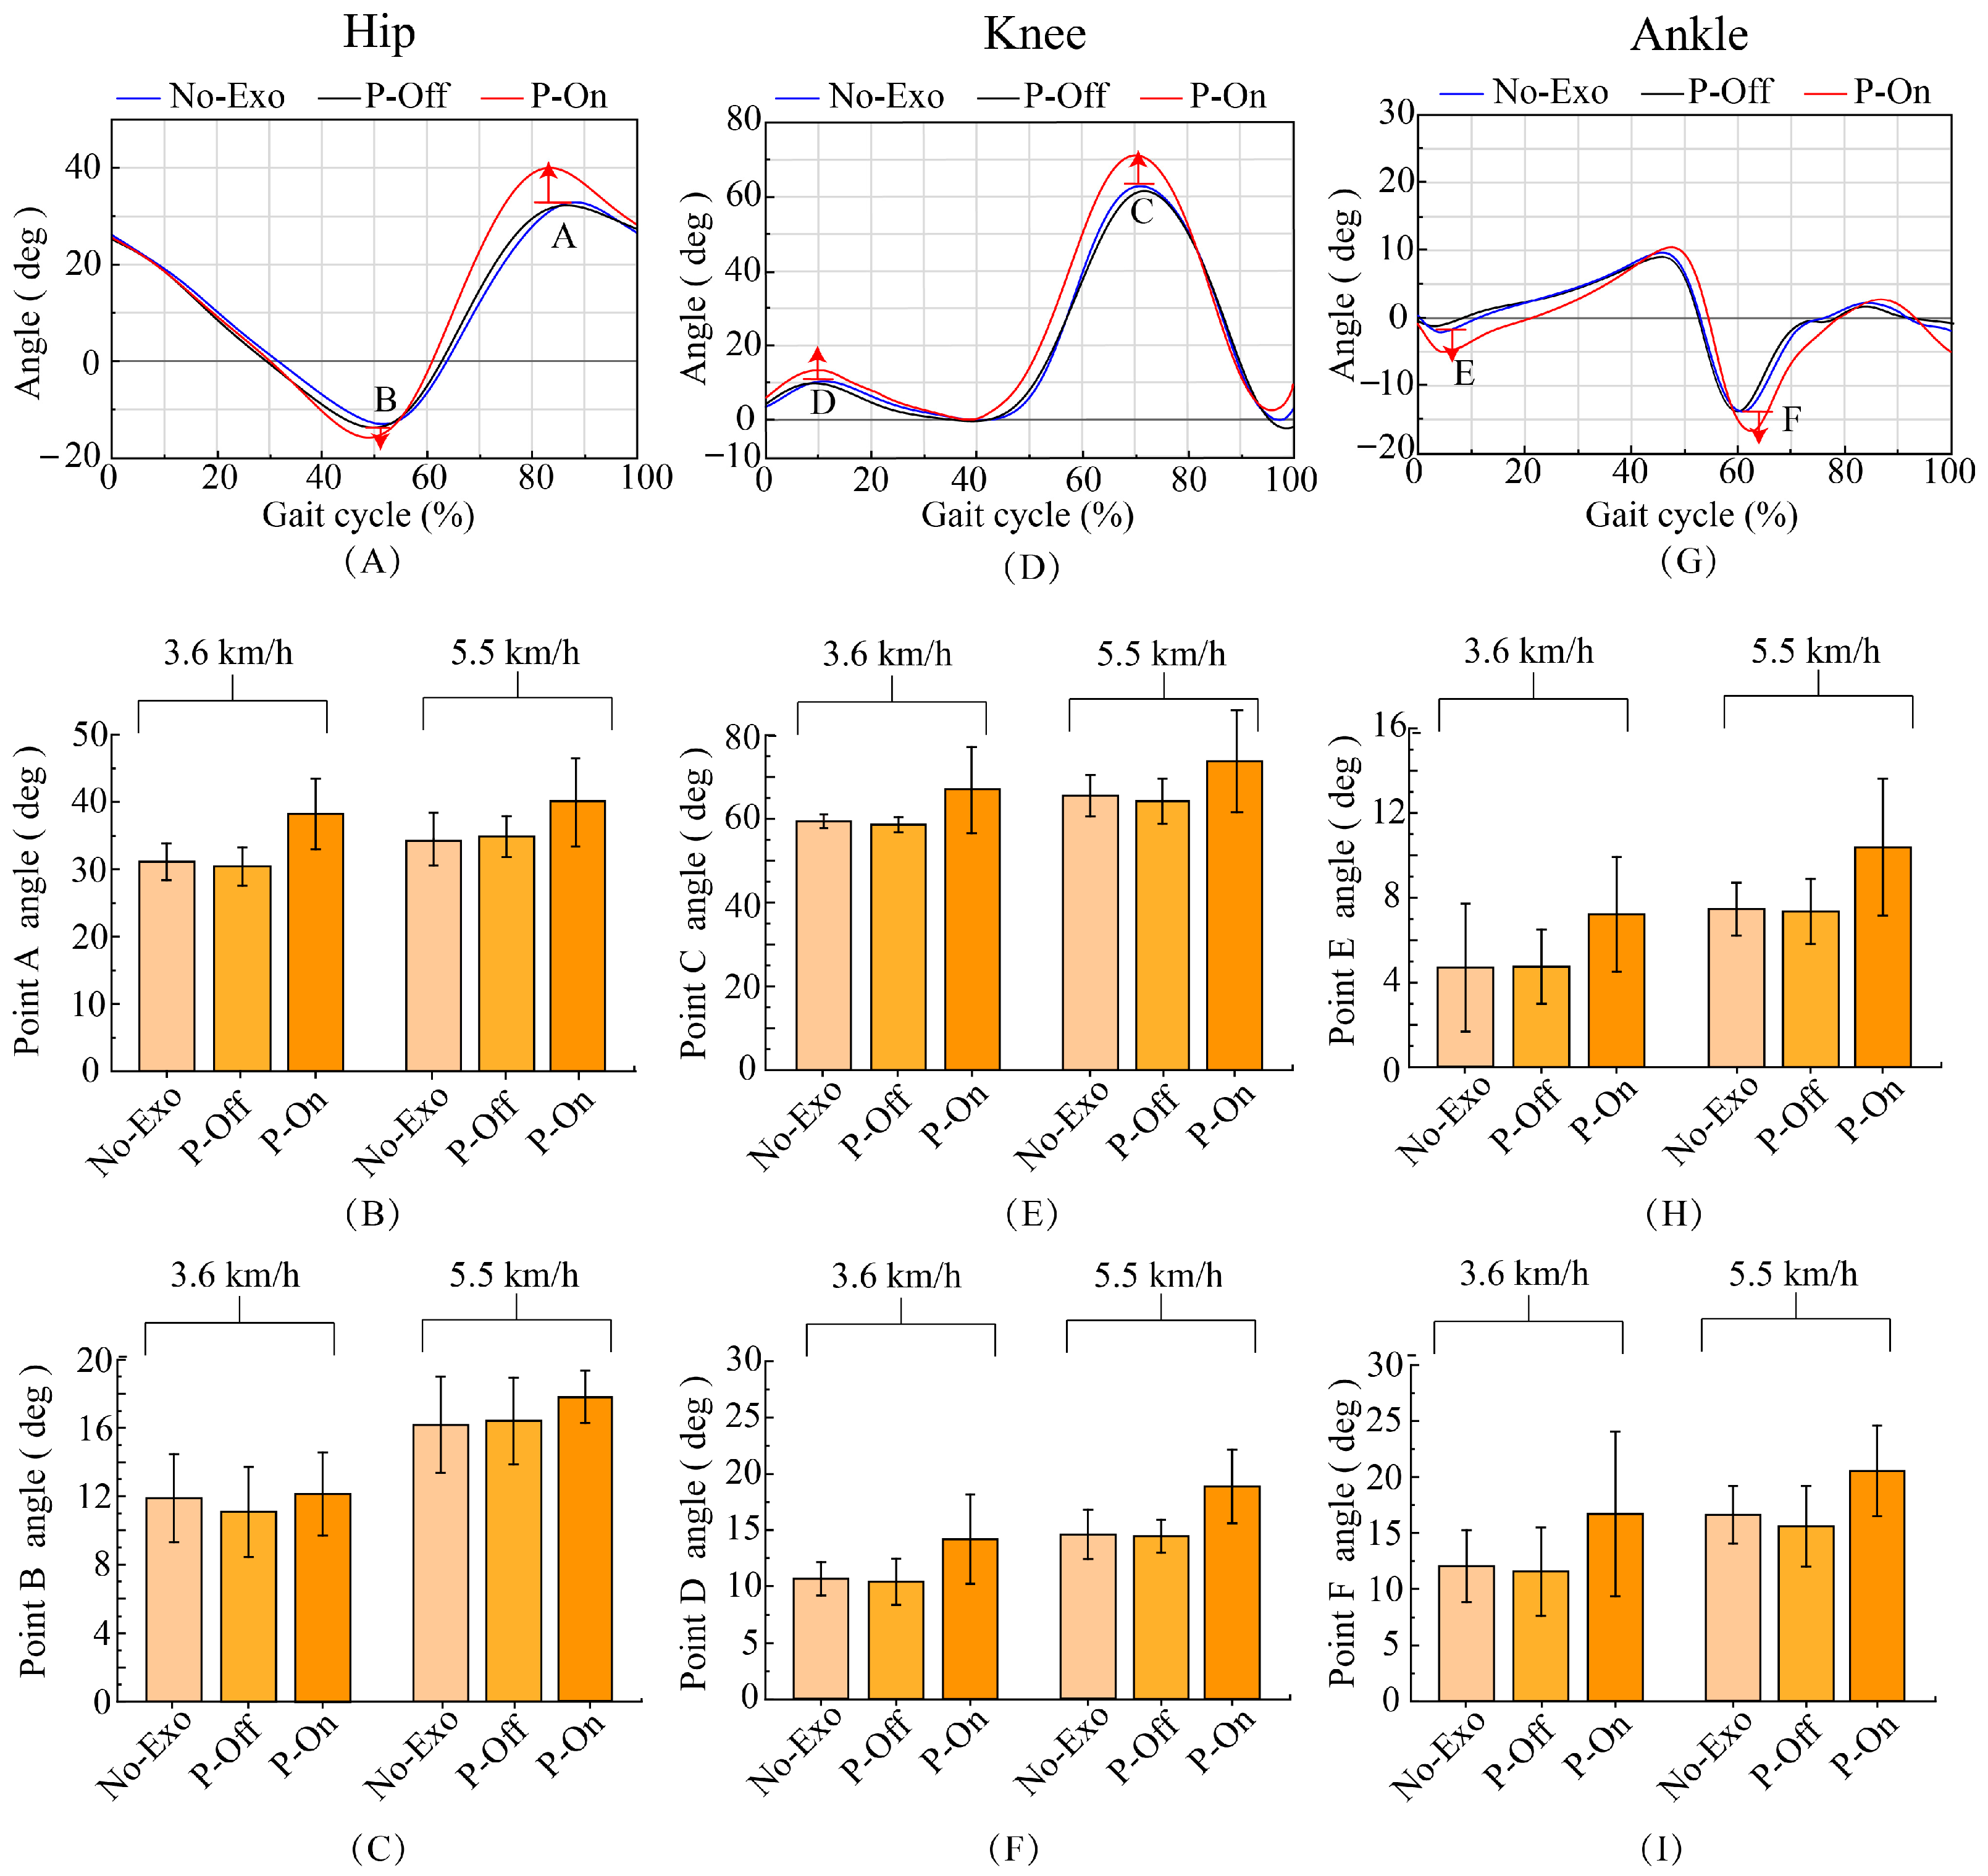
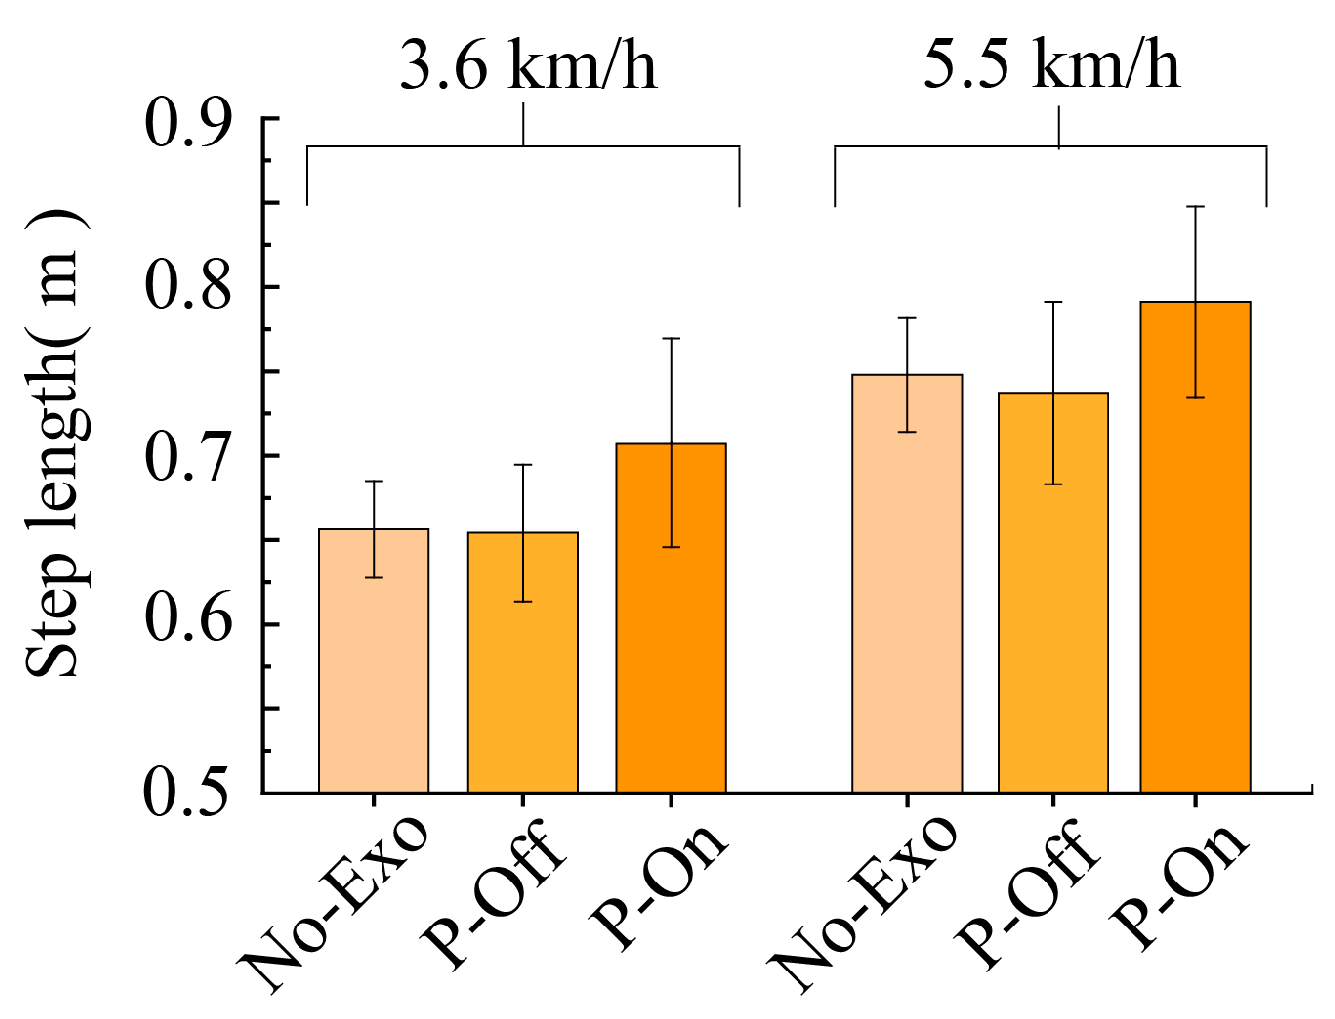
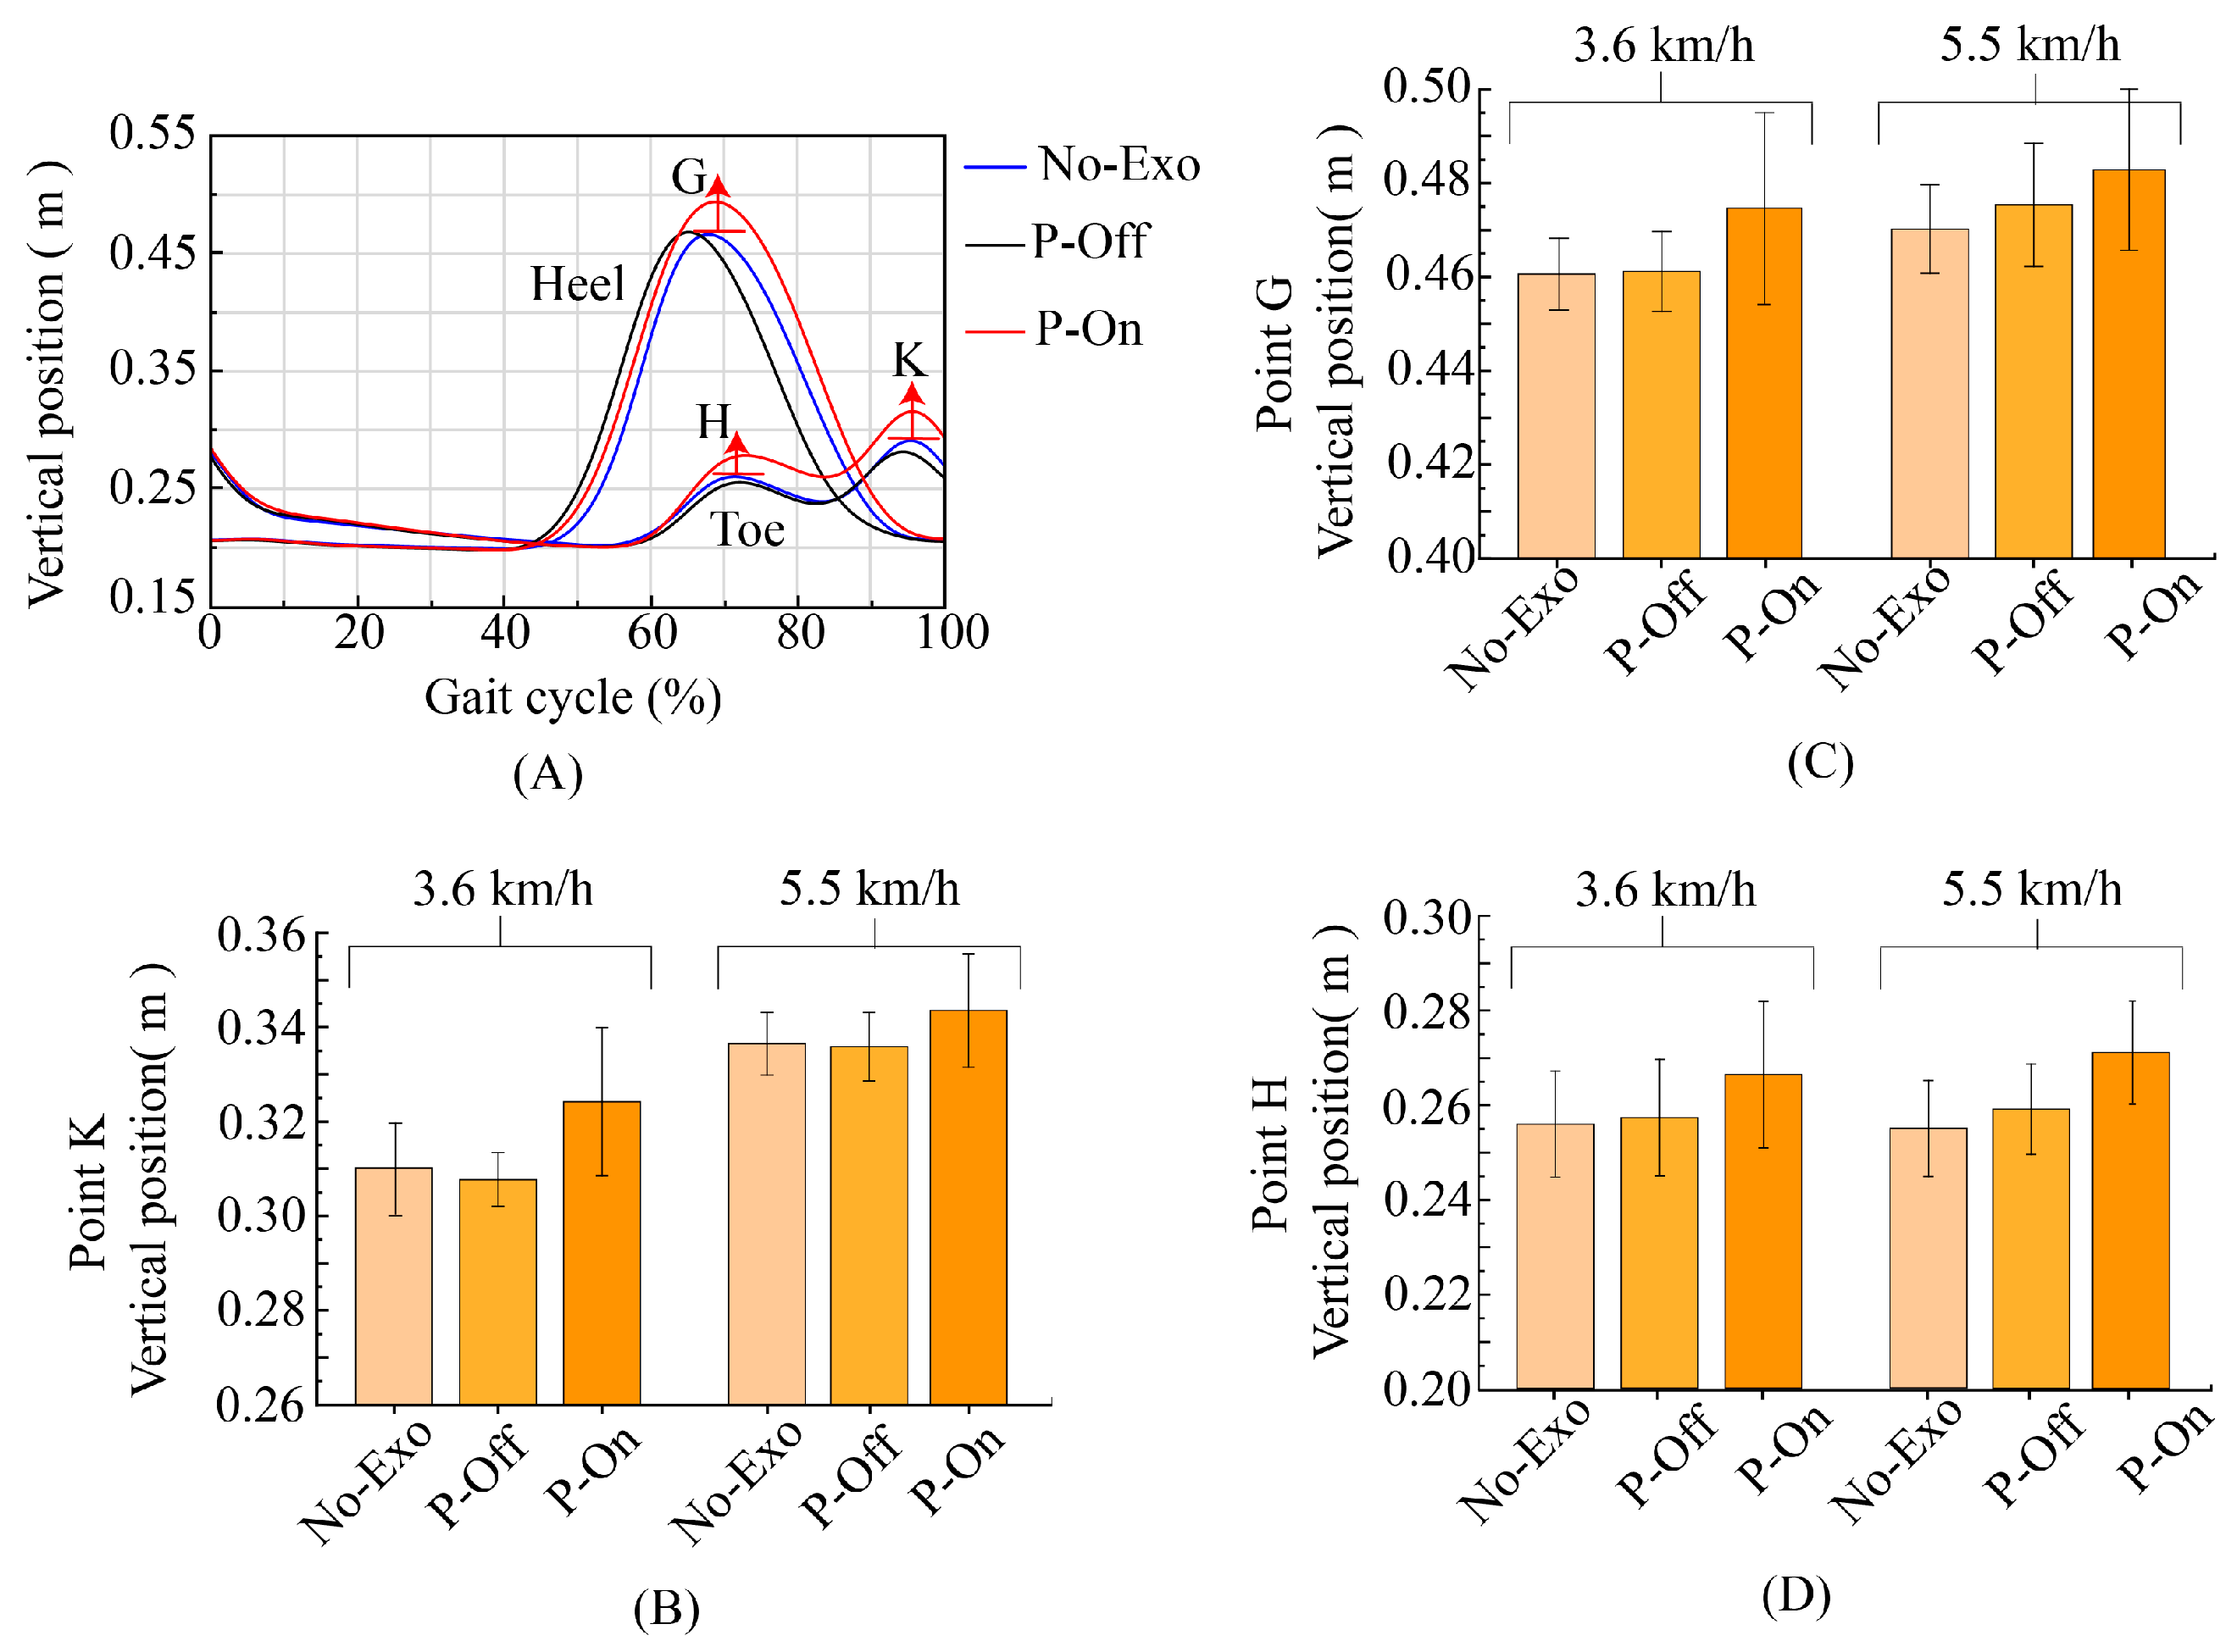
5.3. Kinematic Effect of the Assistance
5.4. Metabolic Effect of Assistance
6. Discussion
7. Conclusions
Author Contributions
Funding
Institutional Review Board Statement
Informed Consent Statement
Data Availability Statement
Acknowledgments
Conflicts of Interest
References
- Xing, L.Y.; Wang, M.L.; Zhang, J.; Chen, X.Y.; Ye, X.D. A Survey on Flexible Exoskeleton Robot. In Proceedings of the 4th IEEE Information Technology, Networking, Electronic and Automation Control Conference (ITNEC), Electr Network, Chongqing, China, 12–14 June 2020; IEEE: Piscataway, NJ, USA, 2020; pp. 170–174. [Google Scholar]
- Asbeck, A.T.; Schmidt, K.; Walsh, C.J. Soft exosuit for hip assistance. Robot. Auton. Syst. 2015, 73, 102–110. [Google Scholar] [CrossRef]
- McCabe, M.V.; Van Citters, D.W.; Chapman, R.M. Hip Joint Angles and Moments during Stair Ascent Using Neural Networks and Wearable Sensors. Bioengineering 2023, 10, 784. [Google Scholar] [CrossRef]
- Dasgupta, A.; Sharma, R.; Mishra, C.; Nagaraja, V.H. Machine Learning for Optical Motion Capture-Driven Musculoskeletal Modelling from Inertial Motion Capture Data. Bioengineering 2023, 10, 510. [Google Scholar] [CrossRef]
- Zhang, M.Y.; Wang, Q.S.; Liu, D.; Zhao, B.Q.; Tang, J.Z.; Sun, J.W. Real-Time Gait Phase Recognition Based on Time Domain Features of Multi-MEMS Inertial Sensors. IEEE Trans. Instrum. Meas. 2021, 70, 12. [Google Scholar] [CrossRef]
- Huang, C.H.; Fukushi, K.; Wang, Z.W.; Kajitani, H.; Nihey, F.; Pokka, H.; Narasaki, H.; Nakano, H.; Nakahara, K. Foot-Healthcare Application Using Inertial Sensor: Estimating First Metatarsophalangeal Angle from Foot Motion during Walking. IEEE Sens. J. 2022, 22, 2835–2844. [Google Scholar] [CrossRef]
- Lee, S.W.; Yi, T.; Jung, J.W.; Bien, Z. Design of a Gait Phase Recognition System That Can Cope with EMG Electrode Location Variation. IEEE Trans. Autom. Sci. Eng. 2017, 14, 1429–1439. [Google Scholar] [CrossRef]
- Rani, G.J.; Hashmi, M.F.; Gupta, A. Surface electromyography and artificial intelligence for human activity recognition-A systematic review on methods, emerging trends applications, challenges, and future implementation. IEEE Access 2023, 8, 105140–105169. [Google Scholar] [CrossRef]
- Tortora, S.; Ghidoni, S.; Chisari, C.; Micera, S.; Artoni, F. Deep learning-based BCI for gait decoding from EEG with LSTM recurrent neural network. J. Neural Eng. 2020, 17, 19. [Google Scholar] [CrossRef] [PubMed]
- Gravina, R.; Alinia, P.; Ghasemzadeh, H.; Fortino, G. Multi-sensor fusion in body sensor networks: State-of-the-art and research challenges. Inf. Fusion 2017, 35, 68–80. [Google Scholar] [CrossRef]
- Fortino, G.; Galzarano, S.; Gravina, R.; Li, W.F. A framework for collaborative computing and multi-sensor data fusion in body sensor networks. Inf. Fusion 2015, 22, 50–70. [Google Scholar] [CrossRef]
- Ghasemzadeh, H.; Panuccio, P.; Trovato, S.; Fortino, G.; Jafari, R. Power-Aware Activity Monitoring Using Distributed Wearable Sensors. IEEE Trans. Hum.-Mach. Syst. 2014, 44, 537–544. [Google Scholar] [CrossRef]
- Fortino, G.; Di Fatta, G.; Pathan, M.; Vasilakos, A.V. Cloud-assisted body area networks: State-of-the-art and future challenges. Wirel. Netw. 2014, 20, 1925–1938. [Google Scholar] [CrossRef]
- Fortino, G.; Giannantonio, R.; Gravina, R.; Kuryloski, P.; Jafari, R. Enabling effective programming and flexible management of efficient body sensor network applications. IEEE Trans. Hum.-Mach. Syst. 2012, 43, 115–133. [Google Scholar] [CrossRef]
- Tucker, M.; Novoseller, E.; Kann, C.; Sui, Y.; Yue, Y.; Burdick, J.W.; Ames, A.D. Preference-based learning for exoskeleton gait optimization. In Proceedings of the 2020 IEEE International Conference on Robotics and Automation (ICRA), Paris, France, 31 May–31 August 2020; IEEE: Piscataway, NJ, USA, 2000; pp. 2351–2357. [Google Scholar]
- Tu, Y.; Zhu, A.; Song, J.; Zhang, X.; Cao, G. Design and experimental evaluation of a lower-limb exoskeleton for assisting workers with motorized tuning of squat heights. IEEE Trans. Neural Syst. Rehabil. Eng. 2022, 30, 184–193. [Google Scholar] [CrossRef] [PubMed]
- Stroppa, F. Design optimizer for planar soft-growing robot manipulators. Eng. Appl. Artif. Intell. 2024, 130, 107693. [Google Scholar] [CrossRef]
- Han, Y.; Liu, C.; Xiu, H.; Li, Z.; Shan, S.; Wang, X.; Ren, L.; Ren, L. Trajectory Control of an Active and Passive Hybrid Hydraulic Ankle Prosthesis Using an Improved PSO-PID Controller. J. Intell. Robot. Syst. 2022, 105, 48. [Google Scholar] [CrossRef]
- Zhang, J.; Fiers, P.; Witte, K.A.; Jackson, R.W.; Poggensee, K.L.; Atkeson, C.G.; Collins, S.H. Human-in-the-loop optimization of exoskeleton assistance during walking. Science 2017, 356, 1280–1284. [Google Scholar] [CrossRef]
- Kim, M.; Ding, Y.; Malcolm, P.; Speeckaert, J.; Siviy, C.J.; Walsh, C.J.; Kuindersma, S. Human-in-the-loop Bayesian optimization of wearable device parameters. PLoS ONE 2017, 12, e0184054. [Google Scholar] [CrossRef]
- Witte, K.; Fiers, P.; Sheets-Singer, A.; Collins, S. Improving the energy economy of human running with powered and unpowered ankle exoskeleton assistance. Sci. Robot. 2020, 5, eaay9108. [Google Scholar] [CrossRef]
- Grimmer, M.; Zeiss, J.; Weigand, F.; Zhao, G. Exploring surface electromyography (EMG) as a feedback variable for the human-in-the-loop optimization of lower limb wearable robotics. Front. Neurorobot. 2022, 16, 948093. [Google Scholar] [CrossRef]
- Ding, Y.; Kim, M.; Kuindersma, S.; Walsh, C.J. Human-in-the-loop optimization of hip assistance with a soft exosuit during walking. Sci. Robot. 2018, 3, eaar5438. [Google Scholar] [CrossRef]
- Kim, S.-K.; Hong, S.; Kim, D. A walking motion imitation framework of a humanoid robot by human walking recognition from IMU motion data. In Proceedings of the 2009 9th IEEE-RAS International Conference on Humanoid Robots, Paris, France, 7–10 December 2009; IEEE: Piscataway, NJ, USA, 2009; pp. 343–348. [Google Scholar]
- Wang, Y.S.; Cheng, X.; Jabban, L.; Sui, X.H.; Zhang, D.G. Motion Intention Prediction and Joint Trajectories Generation toward Lower Limb Prostheses Using EMG and IMU Signals. IEEE Sens. J. 2022, 22, 10719–10729. [Google Scholar] [CrossRef]
- Semwal, V.B.; Gaud, N.; Lalwani, P.; Bijalwan, V.; Alok, A.K. Pattern identification of different human joints for different human walking styles using inertial measurement unit (IMU) sensor. Artif. Intell. Rev. 2022, 55, 1149–1169. [Google Scholar] [CrossRef]
- Weigand, F.; Höhl, A.; Zeiss, J.; Konigorski, U.; Grimmer, M. Continuous locomotion mode recognition and gait phase estimation based on a shank-mounted IMU with artificial neural networks. In Proceedings of the IEEE/RSJ International Conference on Intelligent Robots and Systems (IROS), Kyoto, Japan, 23–27 October 2022; IEEE: Kyoto, Japan, 2022; pp. 12744–12751. [Google Scholar]
- Liu, X.H.; Zhou, Z.H.; Wang, Q.N. Real-Time Onboard Recognition of Gait Transitions for A Bionic Knee Exoskeleton in Transparent Mode. In Proceedings of the 40th Annual International Conference of the IEEE-Engineering-in-Medicine-and-Biology-Society (EMBC), Honolulu, HI, USA, 18–21 July 2018; IEEE: Honolulu, HI, USA, 2018; pp. 3202–3205. [Google Scholar]
- Attal, F.; Amirat, Y.; Chibani, A.; Mohammed, S. Automatic Recognition of Gait Phases Using a Multiple-Regression Hidden Markov Model. IEEE-ASME Trans. Mechatron. 2018, 23, 1597–1607. [Google Scholar] [CrossRef]
- Zhang, X.X.; Zhang, H.J.; Hu, J.H.; Zheng, J.; Wang, X.B.; Deng, J.R.; Wan, Z.H.; Wang, H.T.; Wang, Y.K. Gait Pattern Identification and Phase Estimation in Continuous Multilocomotion Mode Based on Inertial Measurement Units. IEEE Sens. J. 2022, 22, 16952–16962. [Google Scholar] [CrossRef]
- Lou, Y.; Wang, R.L.; Mai, J.G.; Wang, N.H.; Wang, Q.N. IMU-Based Gait Phase Recognition for Stroke Survivors: Preliminary Results. In Proceedings of the 8th IEEE Annual International Conference on Cyber Technology in Automation, Control, and Intelligent Systems (IEEE-CYBER), Tianjin, China, 19–23 July 2018; IEEE: Tianjin, China, 2018; pp. 802–806. [Google Scholar]
- Pazar, A.; Khalilbayli, F.; Ozlem, K.; Yilmaz, A.F.; Atalay, A.T.; Atalay, O.; İnce, G. Gait Phase Recognition using Textile-based Sensor. In Proceedings of the 2022 7th International Conference on Computer Science and Engineering (UBMK), Diyarbakir, Turkey, 14–16 September 2022; IEEE: Piscataway, NJ, USA, 2022; pp. 1–6. [Google Scholar]
- Koller, J.R.; Gates, D.H.; Ferris, D.P.; Remy, C.D. ‘Body-in-the-Loop’ Optimization of Assistive Robotic Devices: A Validation Study. In Proceedings of the Robotics: Science and Systems, Ann Arbor, MI, USA, 18–22 June 2016; pp. 1–10. [Google Scholar]
- Kim, J.; Quinlivan, B.T.; Deprey, L.-A.; Arumukhom Revi, D.; Eckert-Erdheim, A.; Murphy, P.; Orzel, D.; Walsh, C.J. Reducing the energy cost of walking with low assistance levels through optimized hip flexion assistance from a soft exosuit. Sci. Rep. 2022, 12, 11004. [Google Scholar] [CrossRef] [PubMed]
- Perry, J.; Burnfield, J.M. Gait Analysis: Normal and Pathological Function, 2nd ed.; SLACK Incorporated: Thorofare, NJ, USA, 2010. [Google Scholar]
- Chandra, M.A.; Bedi, S. Survey on SVM and their application in image classification. Int. J. Inf. Technol. 2021, 13, 1–11. [Google Scholar] [CrossRef]
- Lu, L.J.; Liu, S.Y.; Zhou, Z.Y.; Sun, J.T.; Melendez-Calderon, A.; Guo, Z. Continuous Gait Phase Recognition and Prediction Using LSTM Network across Walking Speeds and Inclinations. In Proceedings of the 7th IEEE International Conference on Advanced Robotics and Mechatronics, Guilin, China, 9–11 July 2022; IEEE: Guilin, China, 2022; pp. 101–106. [Google Scholar]
- Kolaghassi, R.; Al-Hares, M.K.; Sirlantzis, K. Systematic Review of Intelligent Algorithms in Gait Analysis and Prediction for Lower Limb Robotic Systems. IEEE Access 2021, 9, 113788–113812. [Google Scholar] [CrossRef]
- Vicon Documentation. Available online: https://docs.vicon.com/display/Nexus25/Plug-in+Gait+kinematic+variables (accessed on 20 March 2020).
- Pfister, A.; West, A.M.; Bronner, S. Comparative Abilities of Microsoft Kinect and Vicon 3D Motion Capture for Gait Analysis. J. Med. Eng. Technol. 2014, 38, 274–280. [Google Scholar] [CrossRef]
- Van, D.B.T. Practical Guide to Data Smoothing and Filtering. Study Mater. 1996, pp. 1–6. Available online: http://isbweb.org/software/sigproc/bogert/filter.pdf (accessed on 31 October 1996).
- Schwartz, M.H.; Trost, J.P.; Wervey, R.A. Measurement and Management of Errors in Quantitative Gait Data. Gait Posture 2004, 20, 196–203. [Google Scholar] [CrossRef]
- Wright, C.; Seitz, A.L.; Arnold, B.L. Repeatability of Ankle Joint Kinematic Data at Heel Strike Using the Vicon Plug-In Gait Model. Available online: https://www.researchgate.net/publication/268380486 (accessed on 16 January 2011).
- Webber, J.T.; Raichlen, D.A. The Role of Plantigrady and Heel-Strike in the Mechanics and Energetics of Human Walking with Implications for the Evolution of the Human Foot. J. Exp. Biol. 2016, 219, 3729–3737. [Google Scholar] [CrossRef] [PubMed]
- Murakami, R.; Otaka, Y. Estimated lower speed boundary at which the walk ratio constancy is broken in healthy adults. J. Phys. Ther. Sci. 2017, 29, 722–725. [Google Scholar] [CrossRef] [PubMed]
- Rota, V.; Perucca, L.; Simone, A.; Tesio, L. Walk ratio (step length/cadence) as a summary index of neuromotor control of gait: Application to multiple sclerosis. Int. J. Rehabil. Res. 2011, 34, 265–269. [Google Scholar] [CrossRef] [PubMed]


| Trials | SD | LW | US | DS | USL | DSL | TL | TR | LS | RS |
|---|---|---|---|---|---|---|---|---|---|---|
| 1 | 12,000 | 19,850 | 23,768 | 23,819 | 11,685 | 11,625 | 23,584 | 22,926 | 13,835 | 12,244 |
| 2 | 12,000 | 19,760 | 23,818 | 23,862 | 11,323 | 11,347 | 23,691 | 23,768 | 12,847 | 13,745 |
| 3 | 11,998 | 19,863 | 23,633 | 23,784 | 11,569 | 11,572 | 23,396 | 23,294 | 14,354 | 12,961 |
| 4 | 11,999 | 19,968 | 23,897 | 23,990 | 11,353 | 11,190 | 23,281 | 22,543 | 14,242 | 14,485 |
| 5 | 12,000 | 19,852 | 23,778 | 23,778 | 11,992 | 11,670 | 23,030 | 23,849 | 13,372 | 13,656 |
| 6 | 11,994 | 19,931 | 23,895 | 23,692 | 11,509 | 11,309 | 23,577 | 22,741 | 14,561 | 13,304 |
| 7 | 12,000 | 19,931 | 23,951 | 23,586 | 11,776 | 11,740 | 23,888 | 23,645 | 13,112 | 14,472 |
| 8 | 12,002 | 19,803 | 23,743 | 23,541 | 11,456 | 11,466 | 23,132 | 23,560 | 12,997 | 14,447 |
| 9 | 12,000 | 19,984 | 23,953 | 23,900 | 11,187 | 11,270 | 23,503 | 23,865 | 12,783 | 12,652 |
| 10 | 11,986 | 19,818 | 23,845 | 23,596 | 11,178 | 11,859 | 23,701 | 22,740 | 14,815 | 14,413 |
| 11 | 12,000 | 19,872 | 23,788 | 23,898 | 11,912 | 11,620 | 23,942 | 23,899 | 12,435 | 12,133 |
| 12 | 11,985 | 19,900 | 23,934 | 23,733 | 11,238 | 11,552 | 23,852 | 23,308 | 14,132 | 14,659 |
| 13 | 12,000 | 19,914 | 23,869 | 23,671 | 11,123 | 11,392 | 22,737 | 22,588 | 12,579 | 13,929 |
| 14 | 11,995 | 19,940 | 23,793 | 23,835 | 11,607 | 11,929 | 23,176 | 22,976 | 13,502 | 12,503 |
| 15 | 11,998 | 19,807 | 23,811 | 23,889 | 11,255 | 11,973 | 23,062 | 23,569 | 14,577 | 14,488 |
| 16 | 12,000 | 19,863 | 23,591 | 23,760 | 11,928 | 11,356 | 23,924 | 22,872 | 13,954 | 14,751 |
| 17 | 12,000 | 19,945 | 23,851 | 23,579 | 11,689 | 11,244 | 23,040 | 23,845 | 12,975 | 13,747 |
| 18 | 11,997 | 19,948 | 23,916 | 23,851 | 11,524 | 11,278 | 23,060 | 23,926 | 12,986 | 12,885 |
| 19 | 12,002 | 19,894 | 23,655 | 23,951 | 11,279 | 11,721 | 23,052 | 22,989 | 13,762 | 14,419 |
| 20 | 12,000 | 19,937 | 23,889 | 23,916 | 11,807 | 11,199 | 22,793 | 23,953 | 14,409 | 12,288 |
| 21 | 11,986 | 19,889 | 23,500 | 23,553 | 11,113 | 11,823 | 23,767 | 23,397 | 13,892 | 13,534 |
| 22 | 12,000 | 19,975 | 23,982 | 23,678 | 11,873 | 11,216 | 23,679 | 23,269 | 13,458 | 14,566 |
| 23 | 11,985 | 19,889 | 23,693 | 23,799 | 11,595 | 11,769 | 22,976 | 23,759 | 14,776 | 13,311 |
| 24 | 12,000 | 19,971 | 24,012 | 23,701 | 11,224 | 11,435 | 22,951 | 22,834 | 14,380 | 13,768 |
| 25 | 11,995 | 19,869 | 23,927 | 23,980 | 11,389 | 11,834 | 23,976 | 23,456 | 14,392 | 12,697 |
| Total | 299,922 | 497,373 | 595,492 | 594,342 | 287,584 | 288,389 | 584,770 | 583,571 | 343,127 | 340,057 |
| Trials | LW | L-HS | R-TO | R-HMax | R-HS | L-TO | L-HMax |
|---|---|---|---|---|---|---|---|
| 1 | 19,850 | 2504 | 4817 | 2981 | 2202 | 4615 | 2731 |
| 2 | 19,760 | 2129 | 4702 | 2769 | 2358 | 4876 | 2926 |
| 3 | 19,863 | 2391 | 4676 | 2783 | 2091 | 4895 | 3027 |
| 4 | 19,968 | 2213 | 4956 | 2796 | 2315 | 4983 | 2705 |
| 5 | 19,852 | 2318 | 4484 | 2980 | 2250 | 4640 | 3180 |
| 6 | 19,931 | 2242 | 4465 | 2791 | 2380 | 5054 | 2999 |
| 7 | 19,931 | 2457 | 5060 | 2791 | 2271 | 4952 | 2400 |
| 8 | 19,803 | 2220 | 4453 | 2874 | 2219 | 4951 | 3086 |
| 9 | 19,984 | 2188 | 4599 | 2997 | 2166 | 4953 | 3081 |
| 10 | 19,818 | 2367 | 4527 | 2776 | 2444 | 5059 | 2645 |
| 11 | 19,872 | 2466 | 5084 | 2783 | 2208 | 4578 | 2753 |
| 12 | 19,900 | 2044 | 4756 | 2787 | 2387 | 4898 | 3028 |
| 13 | 19,914 | 2117 | 4798 | 3088 | 2258 | 4634 | 3019 |
| 14 | 19,940 | 2440 | 4502 | 2892 | 2515 | 4657 | 2934 |
| 15 | 19,807 | 2355 | 4572 | 2874 | 2202 | 4976 | 2828 |
| 16 | 19,863 | 2048 | 4592 | 2782 | 2377 | 4873 | 3191 |
| 17 | 19,945 | 2311 | 4644 | 2792 | 2113 | 4854 | 3231 |
| 18 | 19,948 | 2199 | 5023 | 2793 | 2156 | 4603 | 3174 |
| 19 | 19,894 | 2597 | 4627 | 2786 | 2299 | 4863 | 2722 |
| 20 | 19,937 | 2290 | 4622 | 3091 | 2142 | 4664 | 3128 |
| 21 | 19,889 | 2082 | 4790 | 2785 | 2367 | 4592 | 3273 |
| 22 | 19,975 | 2459 | 5077 | 2696 | 2155 | 4618 | 2970 |
| 23 | 19,889 | 2043 | 4439 | 2785 | 2211 | 4637 | 3774 |
| 24 | 19,971 | 2280 | 5067 | 2896 | 2321 | 4586 | 2821 |
| 25 | 19,869 | 2454 | 4508 | 2882 | 2383 | 4579 | 3063 |
| Total | 497,373 | 57,214 | 117,840 | 71,250 | 56,790 | 119,590 | 74,689 |
| Method Model | ACC 1 (%) | Score | MCC |
|---|---|---|---|
| KNN | 98.72 | 0.9878 | 0.9880 |
| Random Forest | 99.31 | 0.9942 | 0.9935 |
| Decision Tree | 98.95 | 0.9894 | 0.9901 |
| SVM | 99.98 | 0.9985 | 0.9987 |
| SD | LW | US | DS | USL | DSL | TL | TR | LS | RS | |
|---|---|---|---|---|---|---|---|---|---|---|
| SD | 0.99 | 0 | 0 | 0 | 0 | 0 | 0 | 0 | 0 | 0 |
| LW | 0 | 1.00 | 0 | 0 | 0 | 0 | 0 | 0 | 0 | 0 |
| US | 0 | 0 | 1.00 | 0 | 0 | 0 | 0 | 0 | 0 | 0 |
| DS | 0 | 0 | 0 | 1.00 | 0 | 0 | 0 | 0 | 0 | 0 |
| USL | 0 | 0 | 0 | 0 | 1.00 | 0 | 0 | 0 | 0 | 0 |
| DSL | 0 | 0 | 0 | 0 | 0 | 1.00 | 0 | 0 | 0 | 0 |
| TL | 0 | 0 | 0 | 0 | 0 | 0 | 1.00 | 0 | 0 | 0 |
| TR | 0 | 0 | 0 | 0 | 0 | 0 | 0 | 1.00 | 0 | 0 |
| LS | 0.01 | 0 | 0 | 0 | 0 | 0 | 0 | 0 | 0.99 | 0 |
| RS | 0 | 0 | 0 | 0 | 0 | 0 | 0 | 0 | 0.01 | 1.00 |
| Method Model | ACC 1 (%) | Score | MCC |
|---|---|---|---|
| NN | 96.36 | 0.9635 | 0.9612 |
| RBF | 96.78 | 0.9675 | 0.9680 |
| BP | 97.55 | 0.9752 | 0.9748 |
| LSTM | 98.26 | 0.9821 | 0.9825 |
| L-HS | R-TO | R-HMax | R-HS | L-TO | L-HMax | |
|---|---|---|---|---|---|---|
| L-HS | 0.975 | 0 | 0 | 0 | 0 | 0.017 |
| R-TO | 0.010 | 0.995 | 0 | 0 | 0 | 0 |
| R-HMax | 0 | 0.005 | 0.991 | 0.010 | 0 | 0 |
| R-HS | 0 | 0 | 0.009 | 0.970 | 0 | 0 |
| L-TO | 0 | 0 | 0 | 0.020 | 0.991 | 0 |
| L-HMax | 0.015 | 0 | 0 | 0 | 0.009 | 0.983 |
Disclaimer/Publisher’s Note: The statements, opinions and data contained in all publications are solely those of the individual author(s) and contributor(s) and not of MDPI and/or the editor(s). MDPI and/or the editor(s) disclaim responsibility for any injury to people or property resulting from any ideas, methods, instructions or products referred to in the content. |
© 2024 by the authors. Licensee MDPI, Basel, Switzerland. This article is an open access article distributed under the terms and conditions of the Creative Commons Attribution (CC BY) license (https://creativecommons.org/licenses/by/4.0/).
Share and Cite
Xiang, Q.; Wang, J.; Liu, Y.; Guo, S.; Liu, L. Gait Recognition and Assistance Parameter Prediction Determination Based on Kinematic Information Measured by Inertial Measurement Units. Bioengineering 2024, 11, 275. https://doi.org/10.3390/bioengineering11030275
Xiang Q, Wang J, Liu Y, Guo S, Liu L. Gait Recognition and Assistance Parameter Prediction Determination Based on Kinematic Information Measured by Inertial Measurement Units. Bioengineering. 2024; 11(3):275. https://doi.org/10.3390/bioengineering11030275
Chicago/Turabian StyleXiang, Qian, Jiaxin Wang, Yong Liu, Shijie Guo, and Lei Liu. 2024. "Gait Recognition and Assistance Parameter Prediction Determination Based on Kinematic Information Measured by Inertial Measurement Units" Bioengineering 11, no. 3: 275. https://doi.org/10.3390/bioengineering11030275
APA StyleXiang, Q., Wang, J., Liu, Y., Guo, S., & Liu, L. (2024). Gait Recognition and Assistance Parameter Prediction Determination Based on Kinematic Information Measured by Inertial Measurement Units. Bioengineering, 11(3), 275. https://doi.org/10.3390/bioengineering11030275