
Analyzing Blood Cells of High-Risk Myelodysplastic Syndrome Patients Using Interferometric Phase Microscopy and Fluorescent Flow Cytometry

 , , ,
, , , 
Abstract
1. Introduction
2. Materials and Methods
2.1. Blood Acquisition
2.2. Neutrophil Isolation
2.3. Flow Cytometry
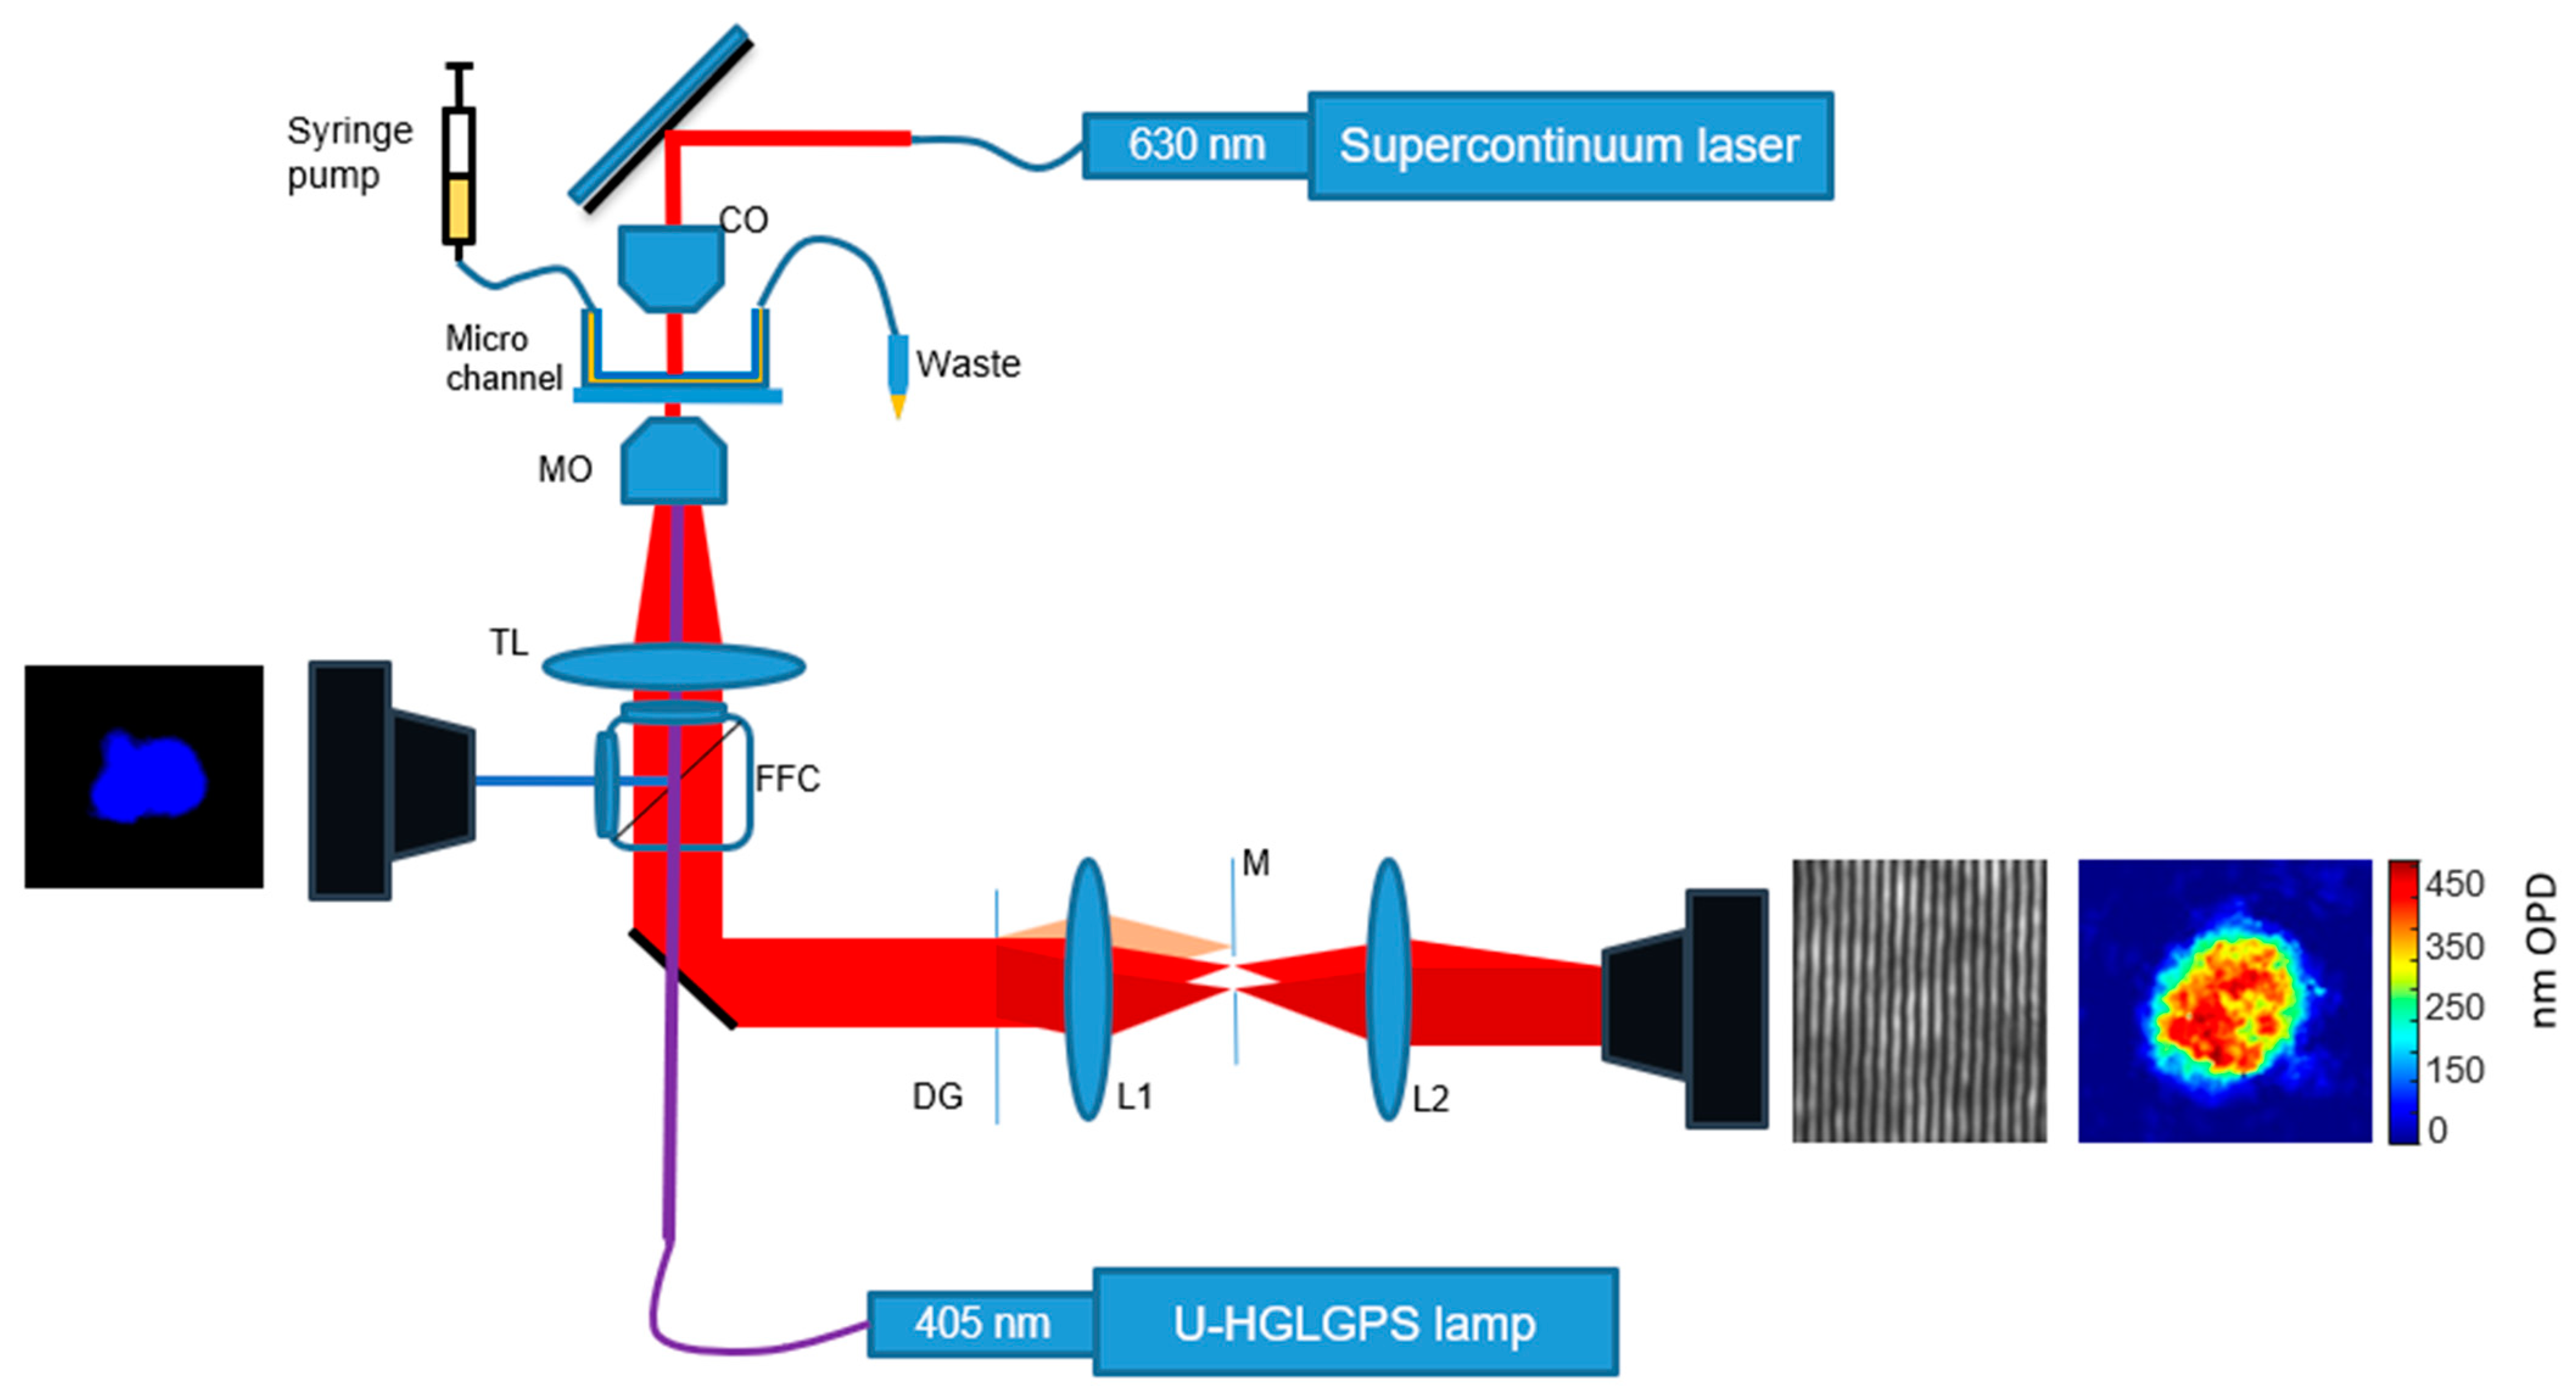
2.4. Optical System
2.5. Statistical Analysis
3. Results
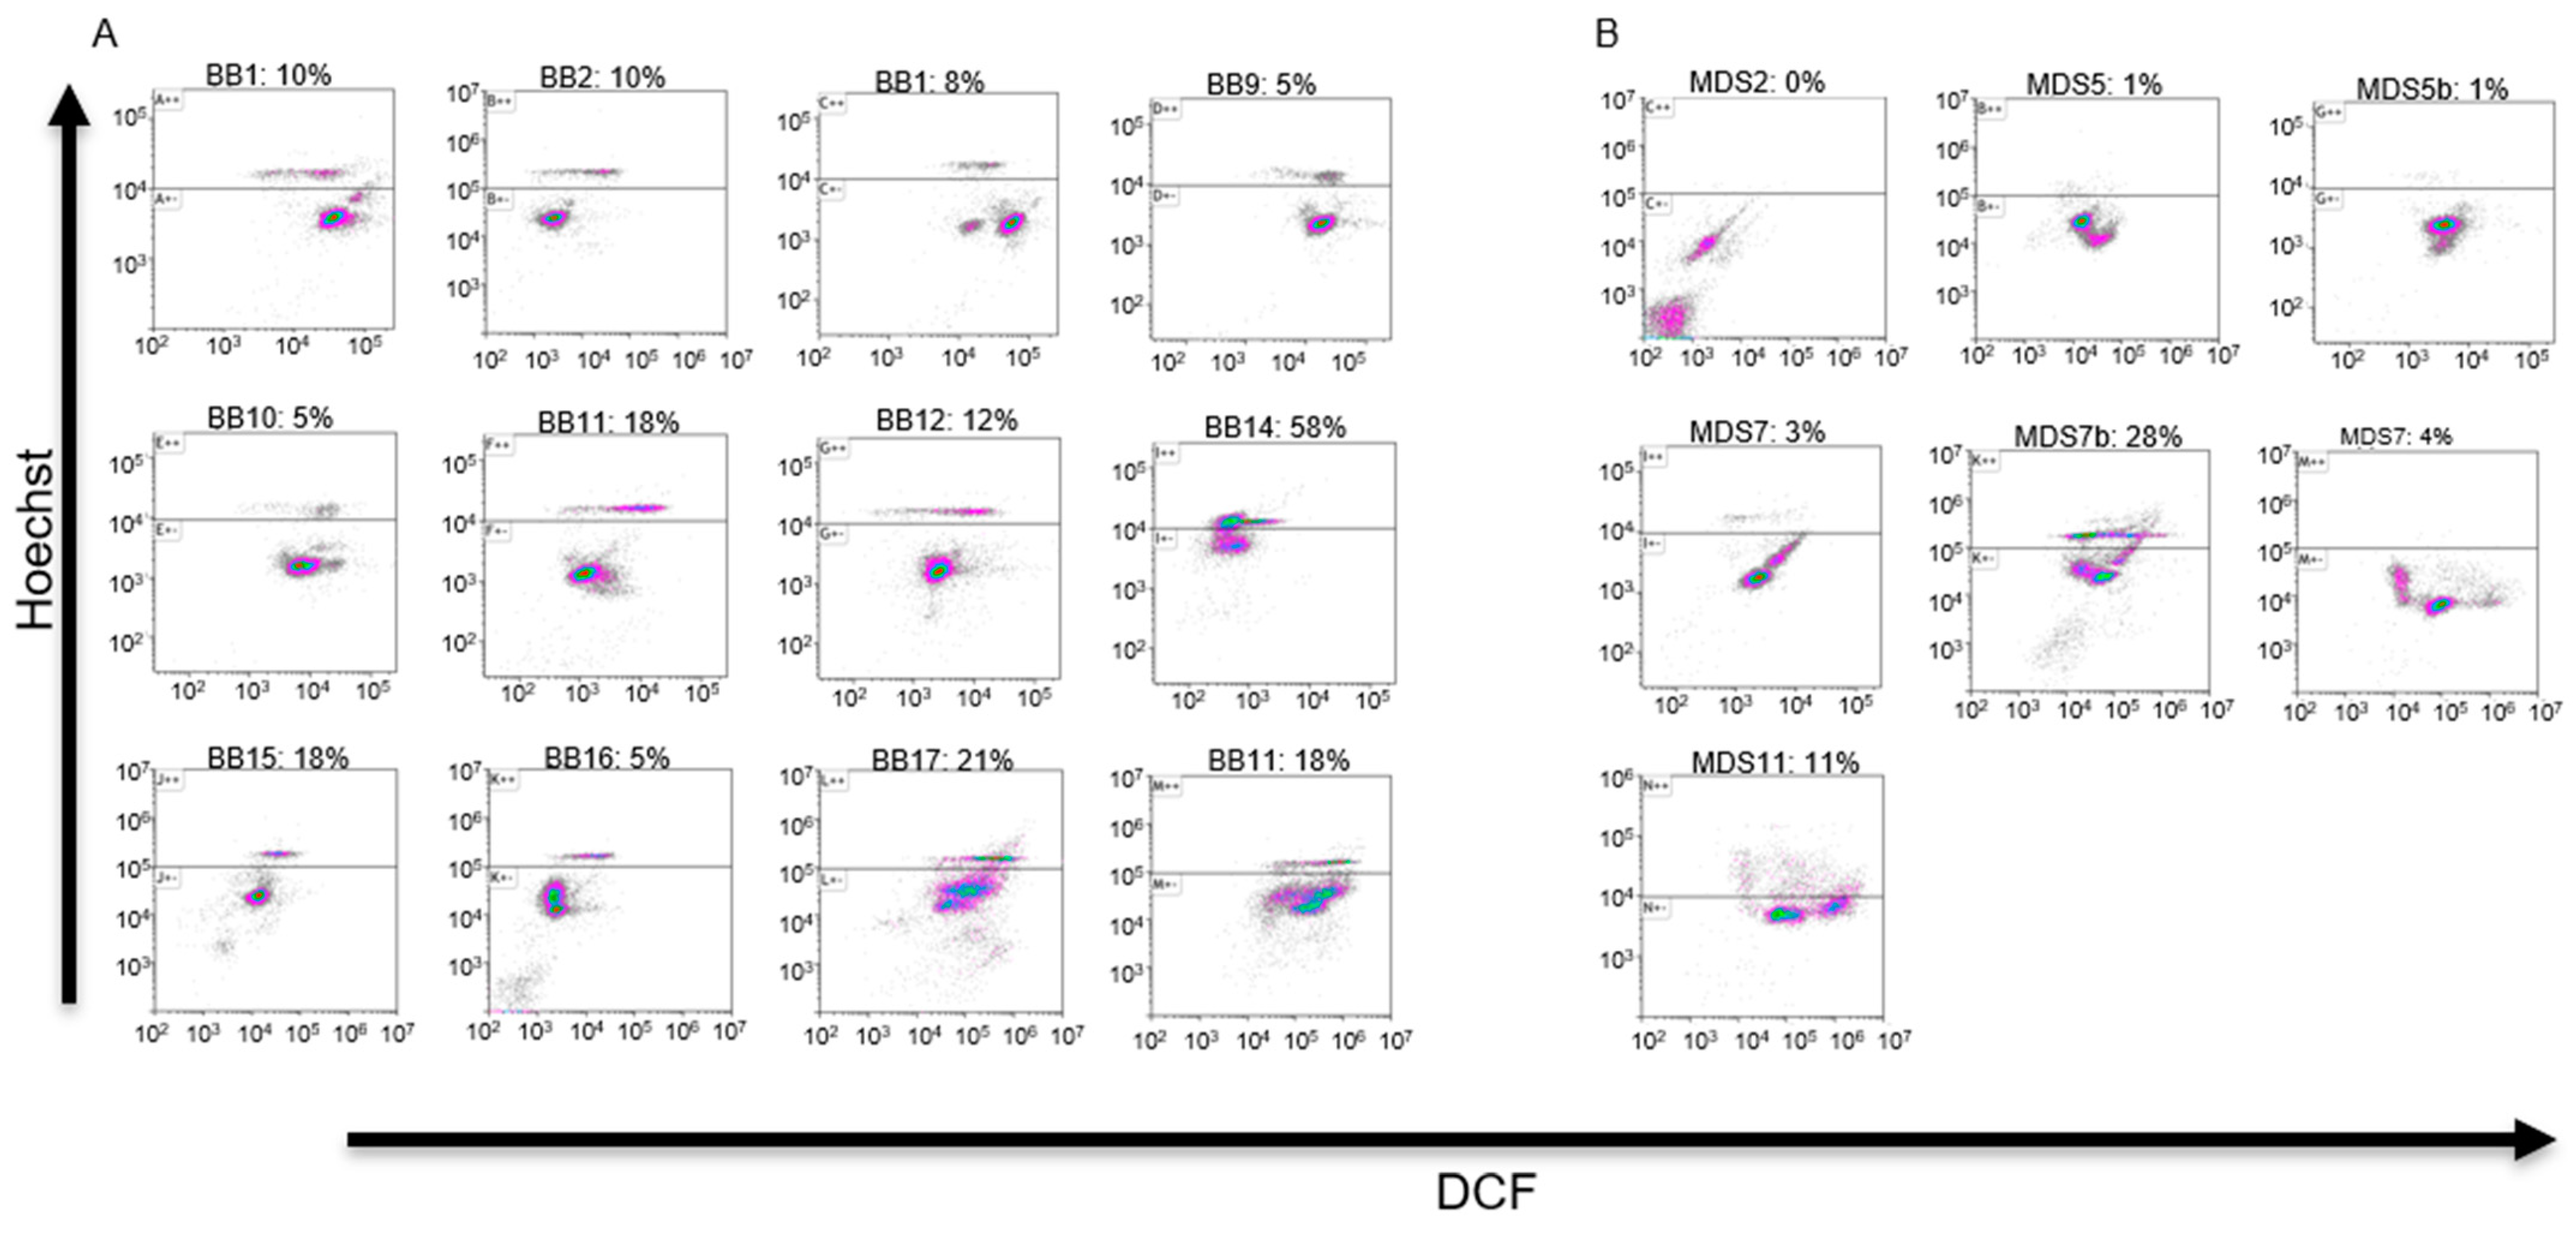
3.1. Analytical Flow Cytometry
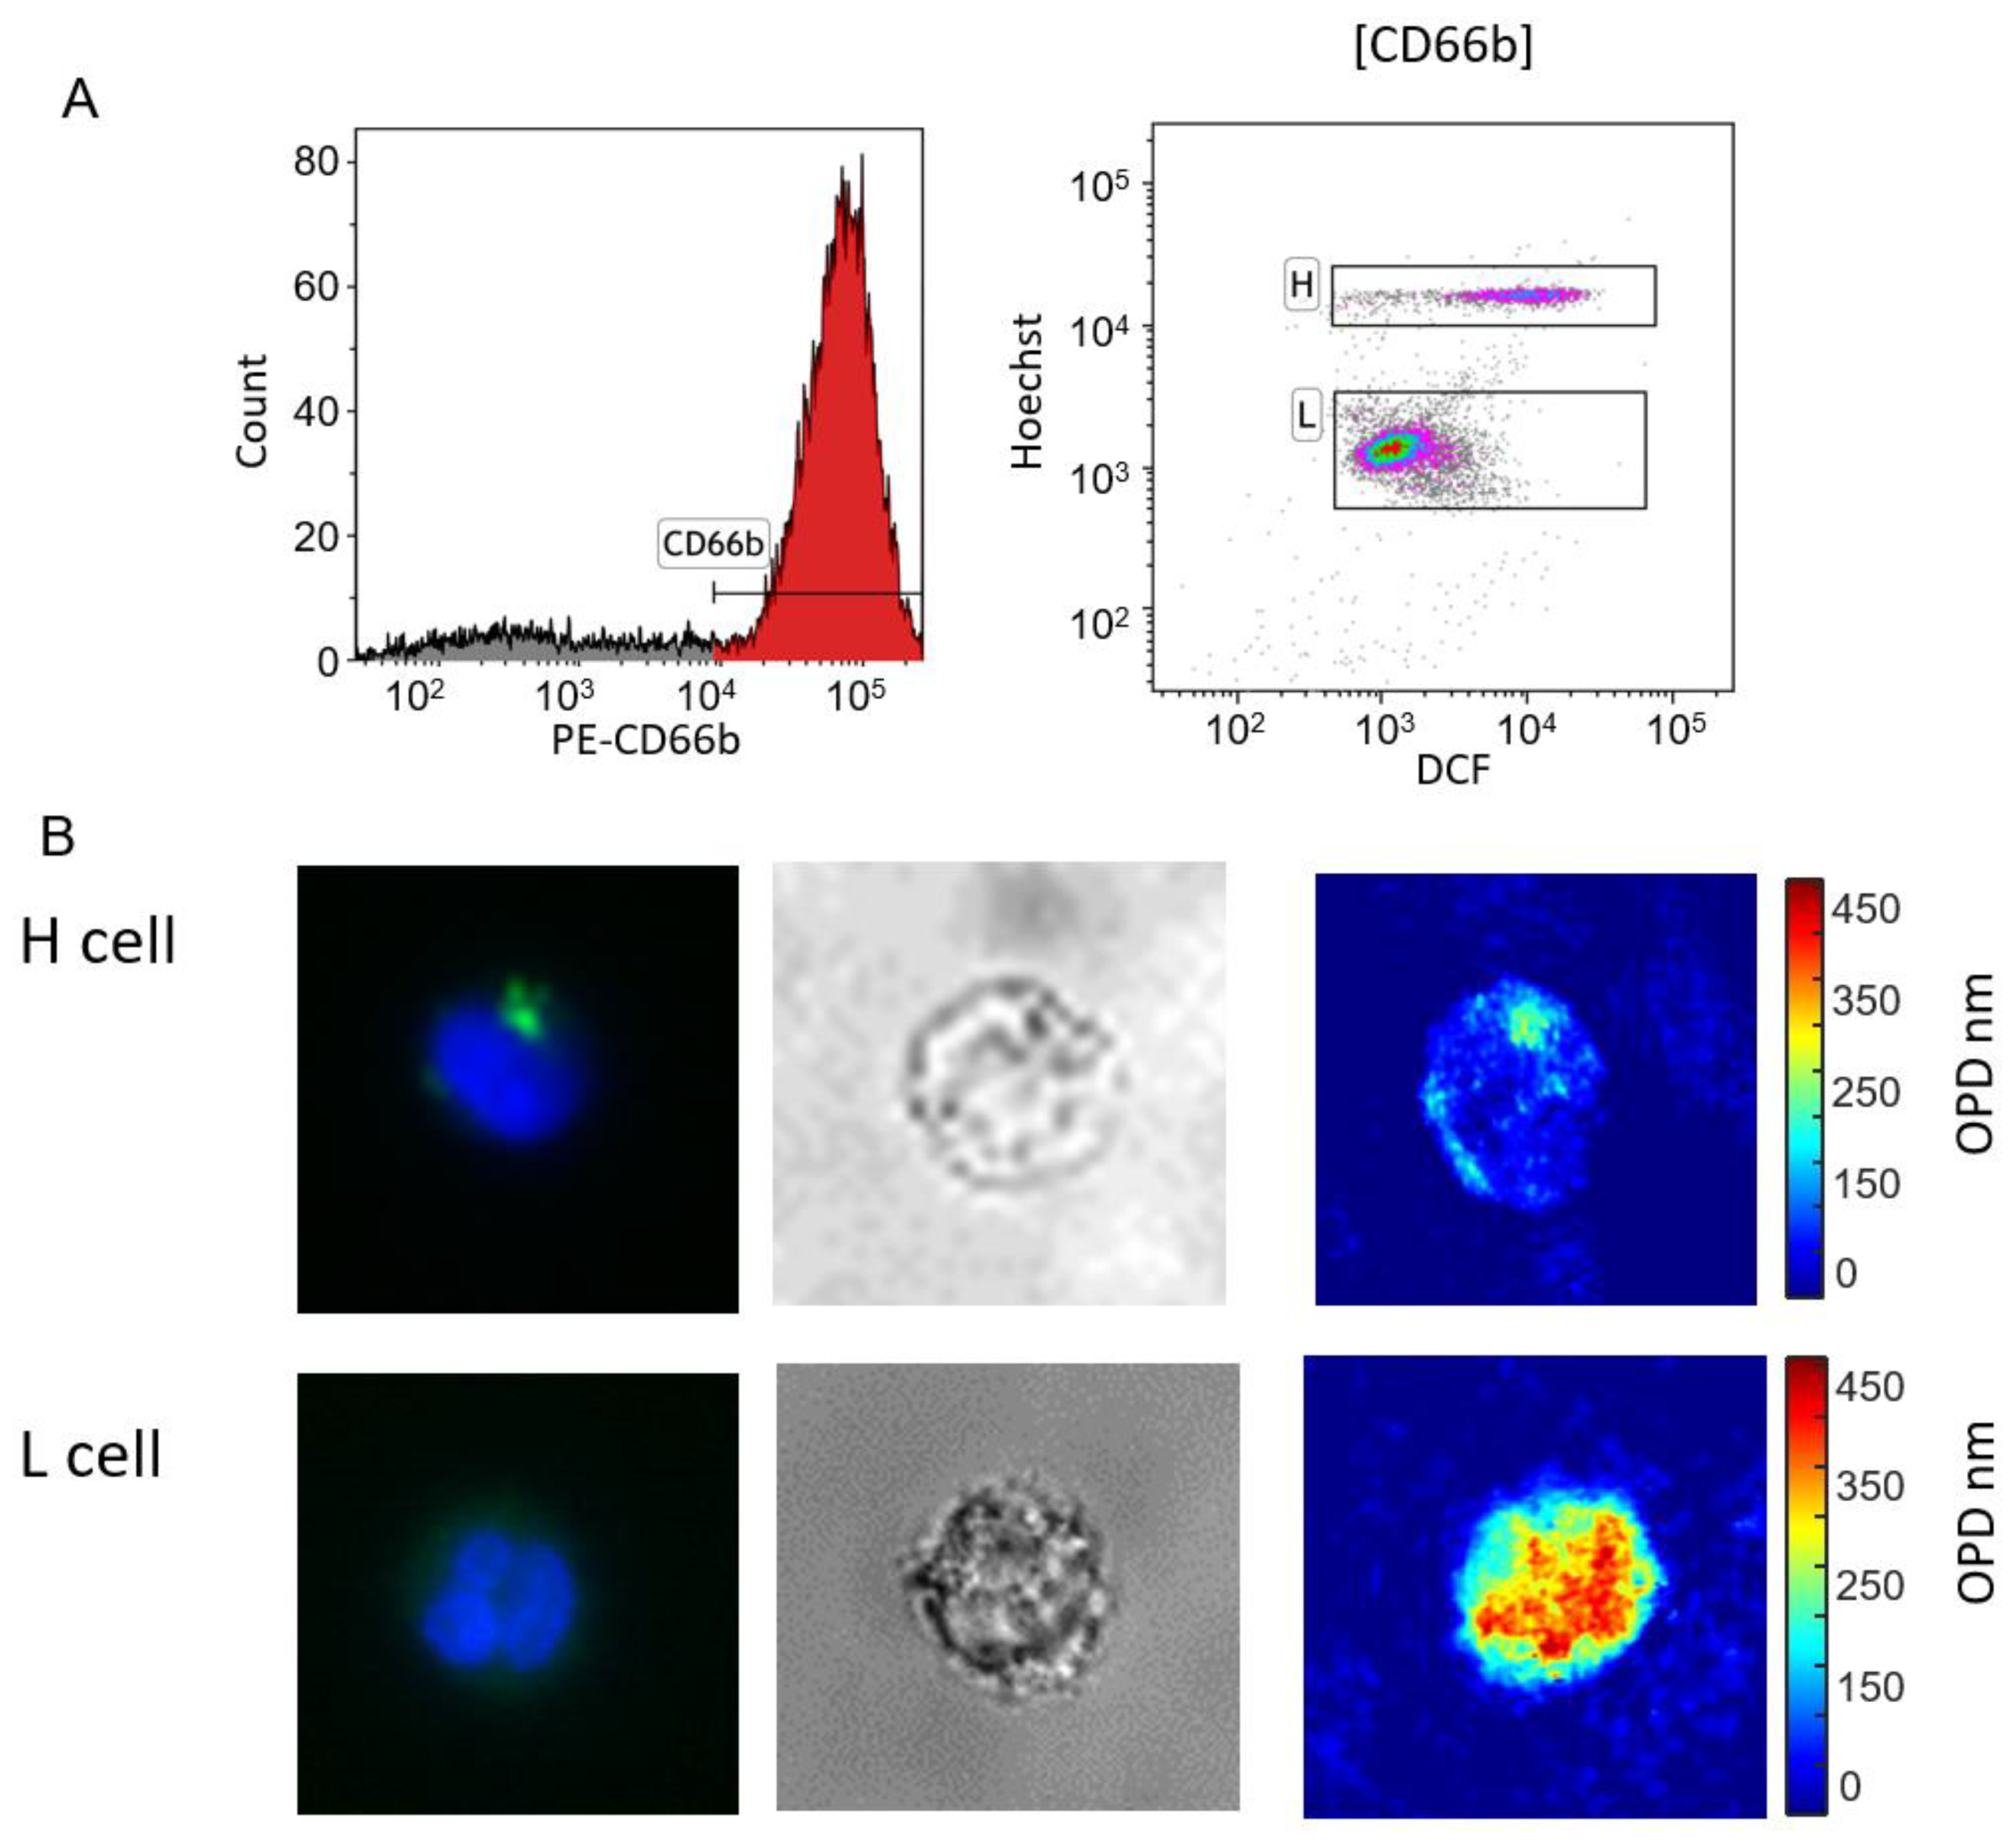
3.2. Cell Sorting
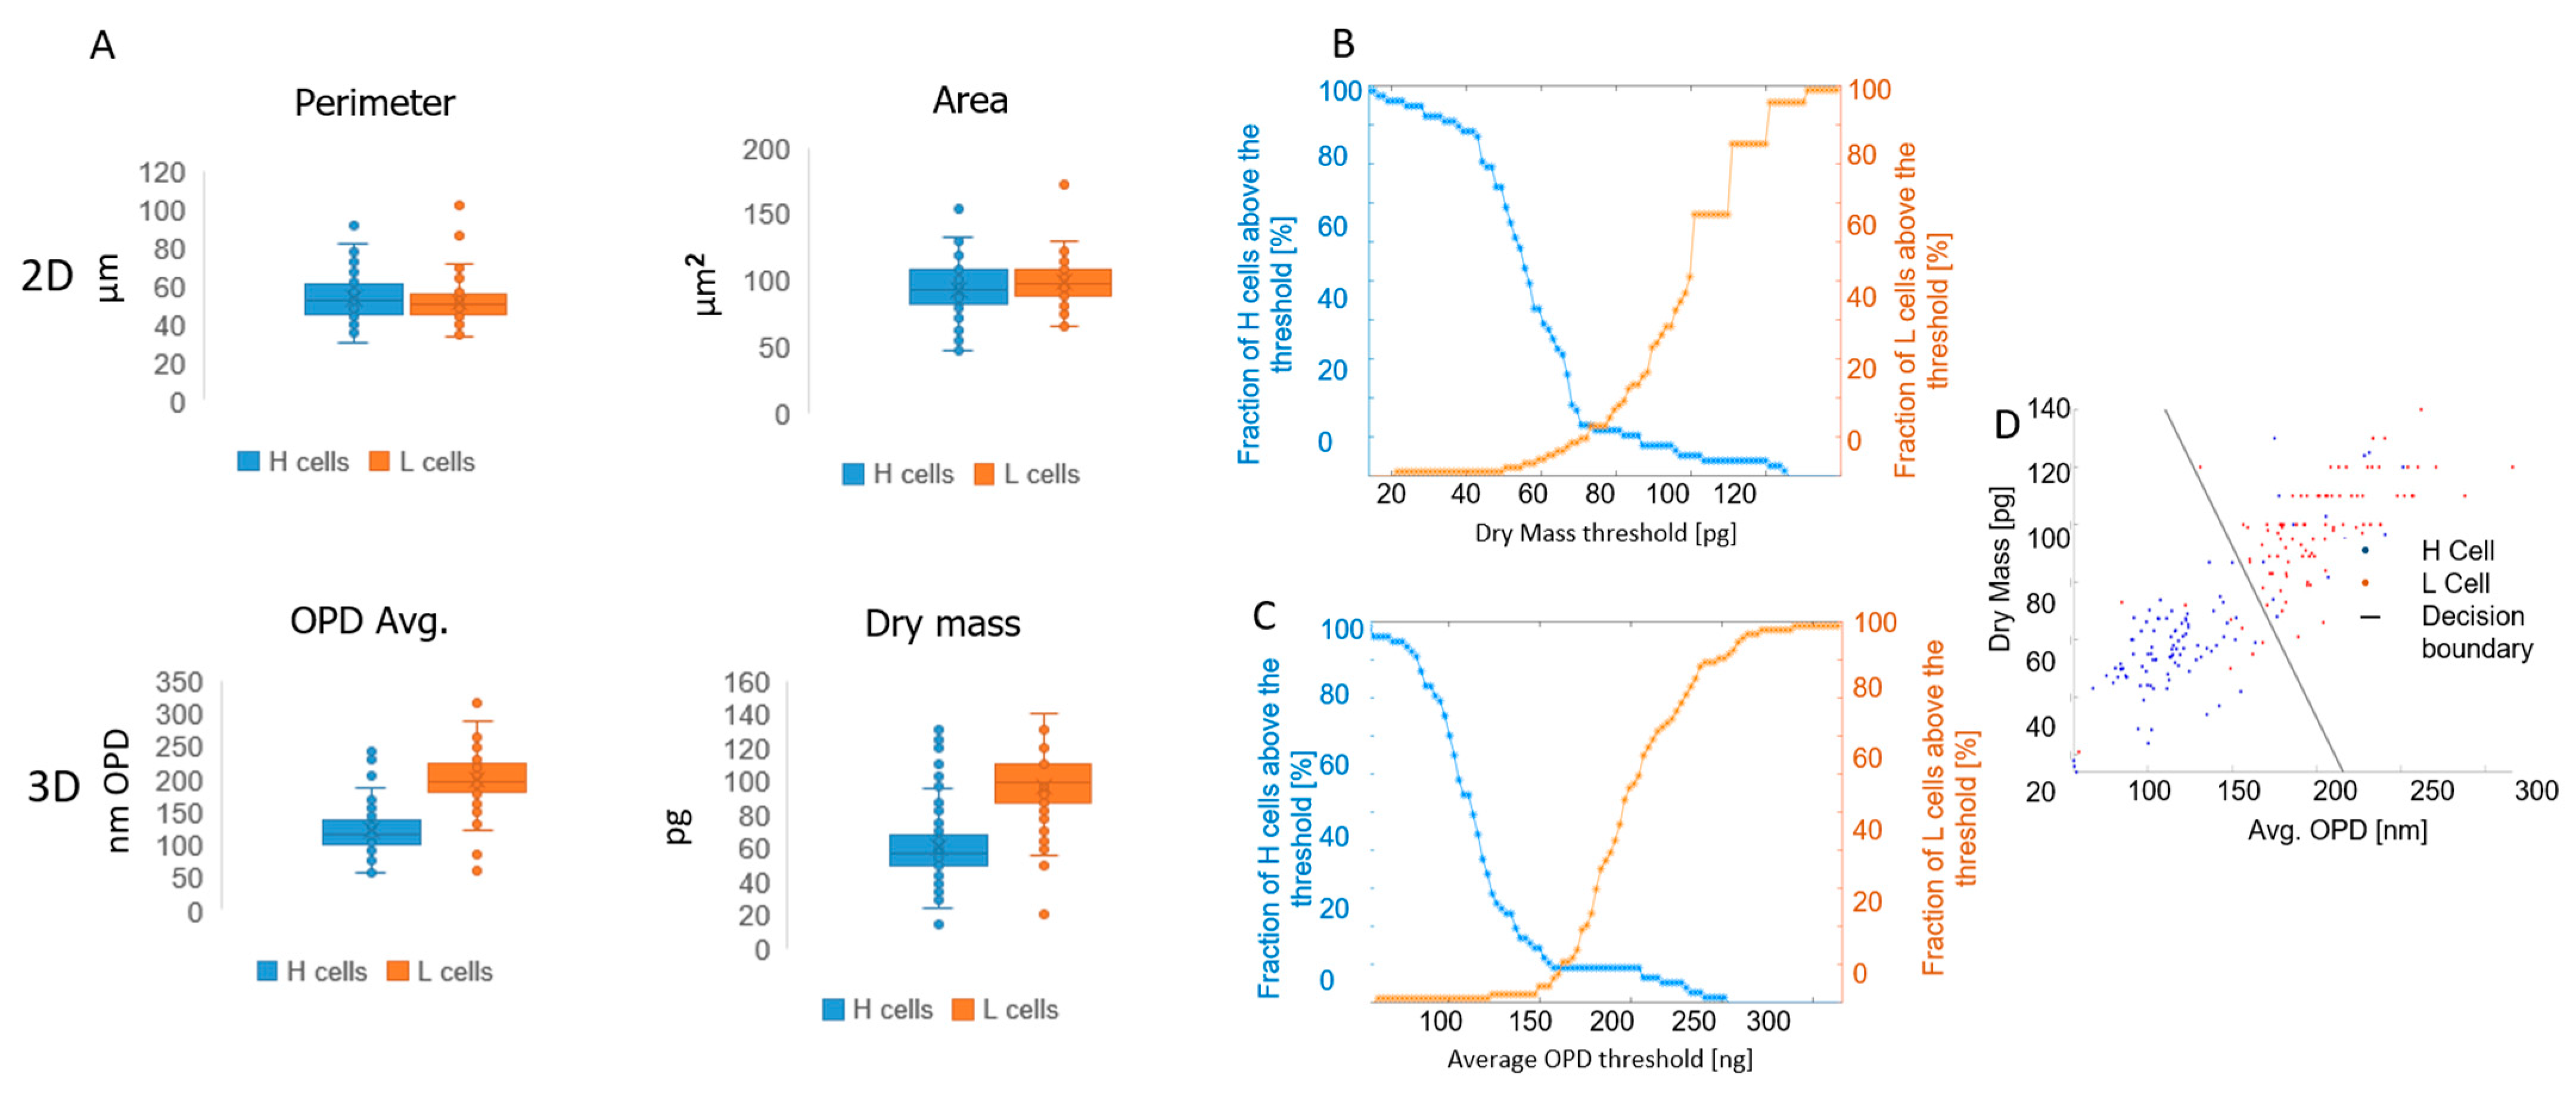
3.3. Capturing Neutrophils from Healthy BBDs and MDS Patients
4. Discussion
5. Conclusions
Author Contributions
Funding
Institutional Review Board Statement
Informed Consent Statement
Data Availability Statement
Conflicts of Interest
References
- Sekeres, M.A.; Taylor, J. Diagnosis and Treatment of Myelodysplastic Syndromes: A Review. JAMA 2022, 328, 872–880. [Google Scholar] [CrossRef] [PubMed]
- Arber, D.A.; Orazi, A.; Hasserjian, R.; Thiele, J.; Borowitz, M.J.; Le Beau, M.M.; Bloomfield, C.D.; Cazzola, M.; Vardiman, J.W. The 2016 revision to the World Health Organization classification of myeloid neoplasms and acute leukemia. Blood 2016, 127, 2391–2405. [Google Scholar] [CrossRef]
- Pang, W.W.; Pluvinage, J.V.; Price, E.A.; Sridhar, K.; Arber, D.A.; Greenberg, P.L.; Schrier, S.L.; Park, C.Y.; Weissman, I.L. Hematopoietic stem cell and progenitor cell mechanisms in myelodysplastic syndromes. Proc. Natl. Acad. Sci. USA 2013, 110, 3011–3016. [Google Scholar] [CrossRef] [PubMed]
- Neukirchen, J.; Blum, S.; Kuendgen, A.; Strupp, C.; Aivado, M.; Haas, R.; Aul, C.; Gattermann, N.; Germing, U. Platelet counts and haemorrhagic diathesis in patients with myelodysplastic syndromes. Eur. J. Haematol. 2009, 83, 477–482. [Google Scholar] [CrossRef] [PubMed]
- Nachtkamp, K.; Stark, R.; Strupp, C.; Kündgen, A.; Giagounidis, A.; Aul, C.; Hildebrandt, B.; Haas, R.; Gattermann, N.; Germing, U. Causes of death in 2877 patients with myelodysplastic syndromes. Ann. Hematol. 2016, 95, 937–944. [Google Scholar] [CrossRef] [PubMed]
- Moretti, S.; Lanza, F.; Spisani, S.; Latorraca, A.; Rigolin, G.M.; Giuliani, A.L.; Castoldi, G.L.; Traniello, S. Neutrophils from patients with myelodysplastic syndromes: Relationship between impairment of granular contents, complement receptors, functional activities and disease status. Leuk. Lymphoma 1994, 13, 471–477. [Google Scholar] [CrossRef] [PubMed]
- Shekhar, R.; Srinivasan, V.K.; Pai, S. How I investigate dysgranulopoiesis. Int. J. Lab. Hematol. 2021, 43, 538–546. [Google Scholar] [CrossRef]
- Fuhler, G.M.; Hooijenga, F.; Drayer, A.L.; Vellenga, E. Reduced expression of flavocytochrome b558, a component of the NADPH oxidase complex, in neutrophils from patients with myelodysplasia. Exp. Hematol. 2003, 31, 752–759. [Google Scholar] [CrossRef]
- Cutler, C.S.; Lee, S.J.; Greenberg, P.; Deeg, H.J.; Pérez, W.S.; Anasetti, C.; Bolwell, B.J.; Cairo, M.S.; Gale, R.P.; Klein, J.P.; et al. A decision analysis of allogeneic bone marrow transplantation for the myelodysplastic syndromes: Delayed transplantation for low-risk myelodysplasia is associated with improved outcome. Blood 2004, 104, 579–585. [Google Scholar] [CrossRef]
- Miceli, M.V.; Liles, M.R.; Newsome, D.A. Evaluation of oxidative processes in human pigment epithelial cells associated with retinal outer segment phagocytosis. Exp. Cell Res. 1994, 214, 242–249. [Google Scholar] [CrossRef]
- Uberti, A.F.; Olivera-Severo, D.; Wassermann, G.E.; Scopel-Guerra, A.; Moraes, J.A.; Barcellos-de-Souza, P.; Barja-Fidalgo, C.; Carlini, C.R. Pro-inflammatory properties and neutrophil activation by Helicobacter pylori urease. Toxicon 2013, 69, 240–249. [Google Scholar] [CrossRef]
- Bland, E.J.; Keshavarz, T.; Bucke, C. Using 2′,7′-dichlorodihydrofluorescein-diacetate to assess polysaccharides as immunomodulating agents. Mol. Biotechnol. 2001, 19, 125–131. [Google Scholar] [CrossRef] [PubMed]
- Merchant, R.; Gandhi, G.; Allahbadia, G.N. In vitro fertilization/intracytoplasmic sperm injection for male infertility. Indian J. Urol. 2011, 27, 121–132. [Google Scholar] [CrossRef] [PubMed]
- Girshovitz, P.; Shaked, N.T. Generalized cell morphological parameters based on interferometric phase microscopy and their application to cell life cycle characterization. Biomed. Opt. Express 2012, 3, 1757–1773. [Google Scholar] [CrossRef] [PubMed]
- Mirsky, S.K.; Barnea, I.; Levi, M.; Greenspan, H.; Shaked, N.T. Automated analysis of individual sperm cells using stain-free interferometric phase microscopy and machine learning. Cytometry A 2017, 91, 893–900. [Google Scholar] [CrossRef] [PubMed]
- Nissim, N.; Dudaie, M.; Barnea, I.; Shaked, N.T. Real-Time Stain-Free Classification of Cancer Cells and Blood Cells Using Interferometric Phase Microscopy and Machine Learning. Cytometry A 2021, 99, 511–523. [Google Scholar] [CrossRef]
- Cohen, A.; Dudaie, M.; Barnea, I.; Borrelli, F.; Běhal, J.; Miccio, L.; Memmolo, P.; Bianco, V.; Ferraro, P.; Shaked, N.T. Label-Free Imaging Flow Cytometry for Cell Classification Based on Multiple Interferometric Projections Using Deep Learning. Adv. Intell. Syst. 2024, 6, 2300433. [Google Scholar] [CrossRef]
- Ugele, M.; Weniger, M.; Stanzel, M.; Bassler, M.; Krause, S.W.; Friedrich, O.; Hayden, O.; Richter, L. Label-Free High-Throughput Leukemia Detection by Holographic Microscopy. Adv. Sci. 2018, 5, 1800761. [Google Scholar] [CrossRef]
- Noy, L.; Barnea, I.; Mirsky, S.K.; Kamber, D.; Levi, M.; Shaked, N.T. Sperm-cell DNA fragmentation prediction using label-free quantitative phase imaging and deep learning. Cytometry A 2023, 103, 470–478. [Google Scholar] [CrossRef]
- Rongli, G.; Barnea, I.; Shaked, N.T. Low-coherence shearing interferometry with constant off-axis angle. Front. Phys. 2021, 8, 611679. [Google Scholar]
- Girshovitz, P.; Shaked, N.T. Fast phase processing in off-axis holography using multiplexing with complex encoding and live-cell fluctuation map calculation in real-time. Opt. Express 2015, 23, 8773–8787. [Google Scholar] [CrossRef]
- Ban, B.; Min, E.; Ahn, Y.; Popescu, G.; Jung, W. Effect of tissue staining in quantitative phase imaging. J. Biophotonics 2018, 11, e201700402. [Google Scholar] [CrossRef] [PubMed]
- Chabot-Richards, D.S.; George, T.I. White blood cell counts: Reference methodology. Clin. Lab. Med. 2015, 35, 11–24. [Google Scholar] [CrossRef]
- Madanat, Y.; Sekeres, M.A. Optimizing the use of hypomethylating agents in myelodysplastic syndromes: Selecting the candidate, predicting the response, and enhancing the activity. Semin. Hematol. 2017, 54, 147–153. [Google Scholar] [CrossRef] [PubMed]
- Platzbecker, U. Treatment of MDS. Blood 2019, 133, 1096–1107. [Google Scholar] [CrossRef] [PubMed]
- Martin, S.; Baldock, S.C.; Ghoneim, A.T.; Child, J.A. Defective neutrophil function and microbicidal mechanisms in the myelodysplastic disorders. J. Clin. Pathol. 1983, 36, 1120–1128. [Google Scholar] [CrossRef] [PubMed]
- Watson, N.; Dunlop, L.; Robson, L.; Sharma, P.; Smith, A. 17p- syndrome arising from a novel dicentric translocation in a patient with acute myeloid leukemia. Cancer Genet. Cytogenet. 2000, 118, 159–162. [Google Scholar] [CrossRef]
- Pithon-Curi, T.C.; Schumacher, R.I.; Freitas, J.J.; Lagranha, C.; Newsholme, P.; Palanch, A.C.; Doi, S.Q.; Curi, R. Glutamine delays spontaneous apoptosis in neutrophils. Am. J. Physiol. Cell Physiol. 2003, 284, C1355–C1361. [Google Scholar] [CrossRef] [PubMed]
- Wang, Y.; Li, M.; Stadler, S.; Correll, S.; Li, P.; Wang, D.; Hayama, R.; Leonelli, L.; Han, H.; Grigoryev, S.A.; et al. Histone hypercitrullination mediates chromatin decondensation and neutrophil extracellular trap formation. J. Cell Biol. 2009, 184, 205–213. [Google Scholar] [CrossRef]
- Toma, A.; Fenaux, P.; Dreyfus, F.; Cordonnier, C. Infections in myelodysplastic syndromes. Haematologica 2012, 97, 1459–1470. [Google Scholar] [CrossRef]
- Brinkmann, V.; Zychlinsky, A. Beneficial suicide: Why neutrophils die to make NETs. Nat. Rev. Microbiol. 2007, 5, 577–582. [Google Scholar] [CrossRef] [PubMed]
- Hampton, M.B.; Kettle, A.J.; Winterbourn, C.C. Inside the neutrophil phagosome: Oxidants, myeloperoxidase, and bacterial killing. Blood 1998, 92, 3007–3017. [Google Scholar] [CrossRef] [PubMed]
- Brinkmann, V.; Reichard, U.; Goosmann, C.; Fauler, B.; Uhlemann, Y.; Weiss, D.S.; Weinrauch, Y.; Zychlinsky, A. Neutrophil extracellular traps kill bacteria. Science 2004, 303, 1532–1535. [Google Scholar] [CrossRef] [PubMed]
- Fuchs, T.A.; Abed, U.; Goosmann, C.; Hurwitz, R.; Schulze, I.; Wahn, V.; Weinrauch, Y.; Brinkmann, V.; Zychlinsky, A. Novel cell death program leads to neutrophil extracellular traps. J. Cell Biol. 2007, 176, 231–241. [Google Scholar] [CrossRef]
- Brings, C.; Fröbel, J.; Cadeddu, P.; Germing, U.; Haas, R.; Gattermann, N. Impaired formation of neutrophil extracellular traps in patients with MDS. Blood Adv. 2022, 6, 129–137. [Google Scholar] [CrossRef]


Disclaimer/Publisher’s Note: The statements, opinions and data contained in all publications are solely those of the individual author(s) and contributor(s) and not of MDPI and/or the editor(s). MDPI and/or the editor(s) disclaim responsibility for any injury to people or property resulting from any ideas, methods, instructions or products referred to in the content. |
© 2024 by the authors. Licensee MDPI, Basel, Switzerland. This article is an open access article distributed under the terms and conditions of the Creative Commons Attribution (CC BY) license (https://creativecommons.org/licenses/by/4.0/).
Share and Cite
Barnea, I.; Luria, L.; Girsault, A.; Dabah, O.; Dudaie, M.; Mirsky, S.K.; Merkel, D.; Shaked, N.T. Analyzing Blood Cells of High-Risk Myelodysplastic Syndrome Patients Using Interferometric Phase Microscopy and Fluorescent Flow Cytometry. Bioengineering 2024, 11, 256. https://doi.org/10.3390/bioengineering11030256
Barnea I, Luria L, Girsault A, Dabah O, Dudaie M, Mirsky SK, Merkel D, Shaked NT. Analyzing Blood Cells of High-Risk Myelodysplastic Syndrome Patients Using Interferometric Phase Microscopy and Fluorescent Flow Cytometry. Bioengineering. 2024; 11(3):256. https://doi.org/10.3390/bioengineering11030256
Chicago/Turabian StyleBarnea, Itay, Lior Luria, Arik Girsault, Ofira Dabah, Matan Dudaie, Simcha K. Mirsky, Drorit Merkel, and Natan T. Shaked. 2024. "Analyzing Blood Cells of High-Risk Myelodysplastic Syndrome Patients Using Interferometric Phase Microscopy and Fluorescent Flow Cytometry" Bioengineering 11, no. 3: 256. https://doi.org/10.3390/bioengineering11030256
APA StyleBarnea, I., Luria, L., Girsault, A., Dabah, O., Dudaie, M., Mirsky, S. K., Merkel, D., & Shaked, N. T. (2024). Analyzing Blood Cells of High-Risk Myelodysplastic Syndrome Patients Using Interferometric Phase Microscopy and Fluorescent Flow Cytometry. Bioengineering, 11(3), 256. https://doi.org/10.3390/bioengineering11030256