

Impact of Deep Learning-Based Image Reconstruction on Tumor Visibility and Diagnostic Confidence in Computed Tomography


Abstract

1. Introduction
2. Materials and Methods
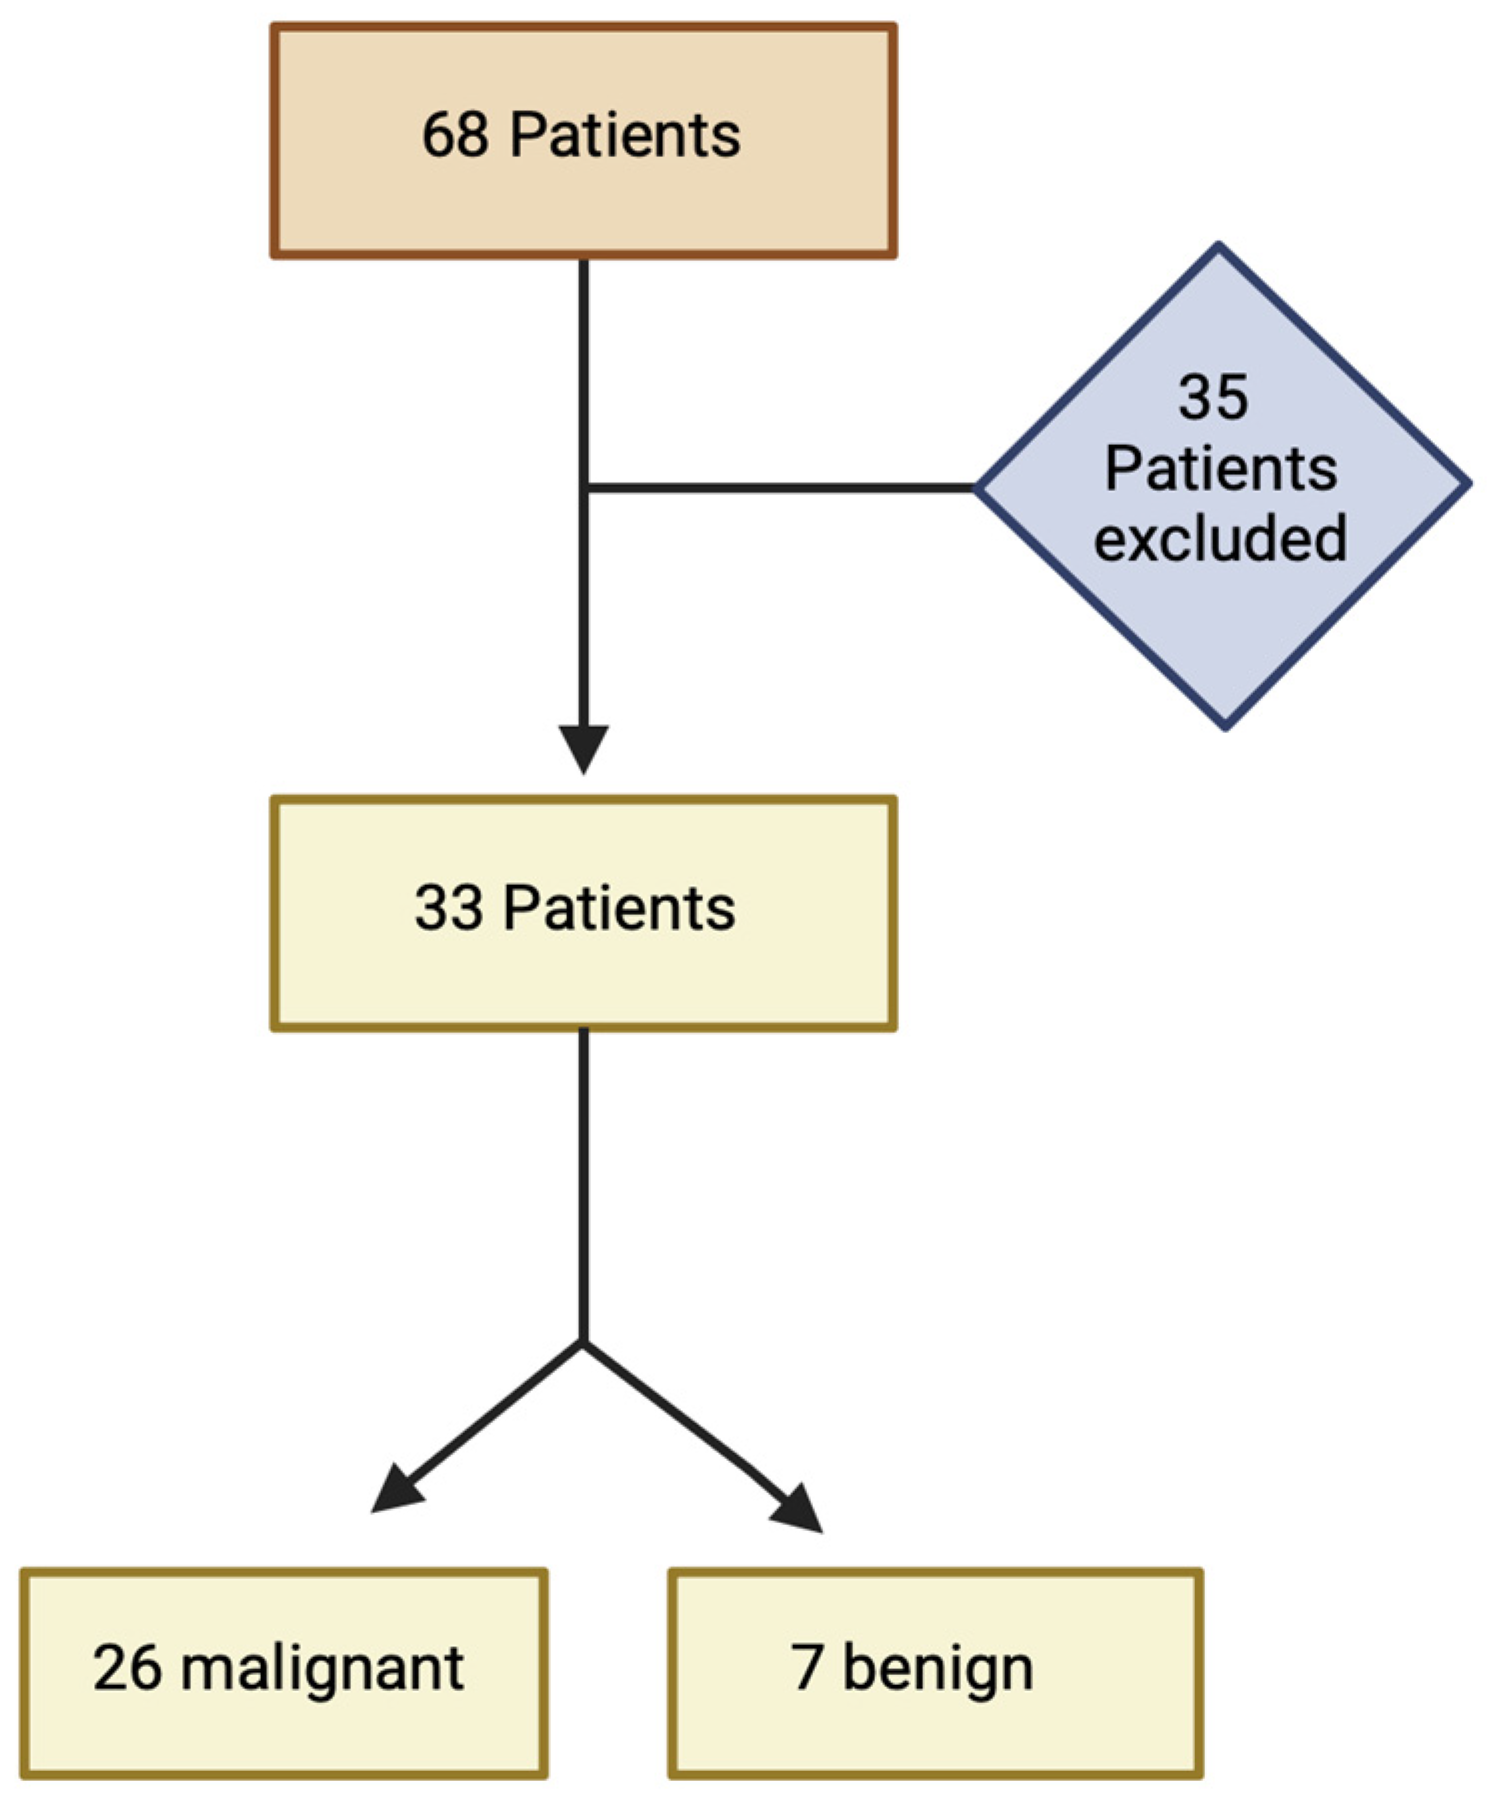
2.1. Study Population
2.2. CT Data Acquisition
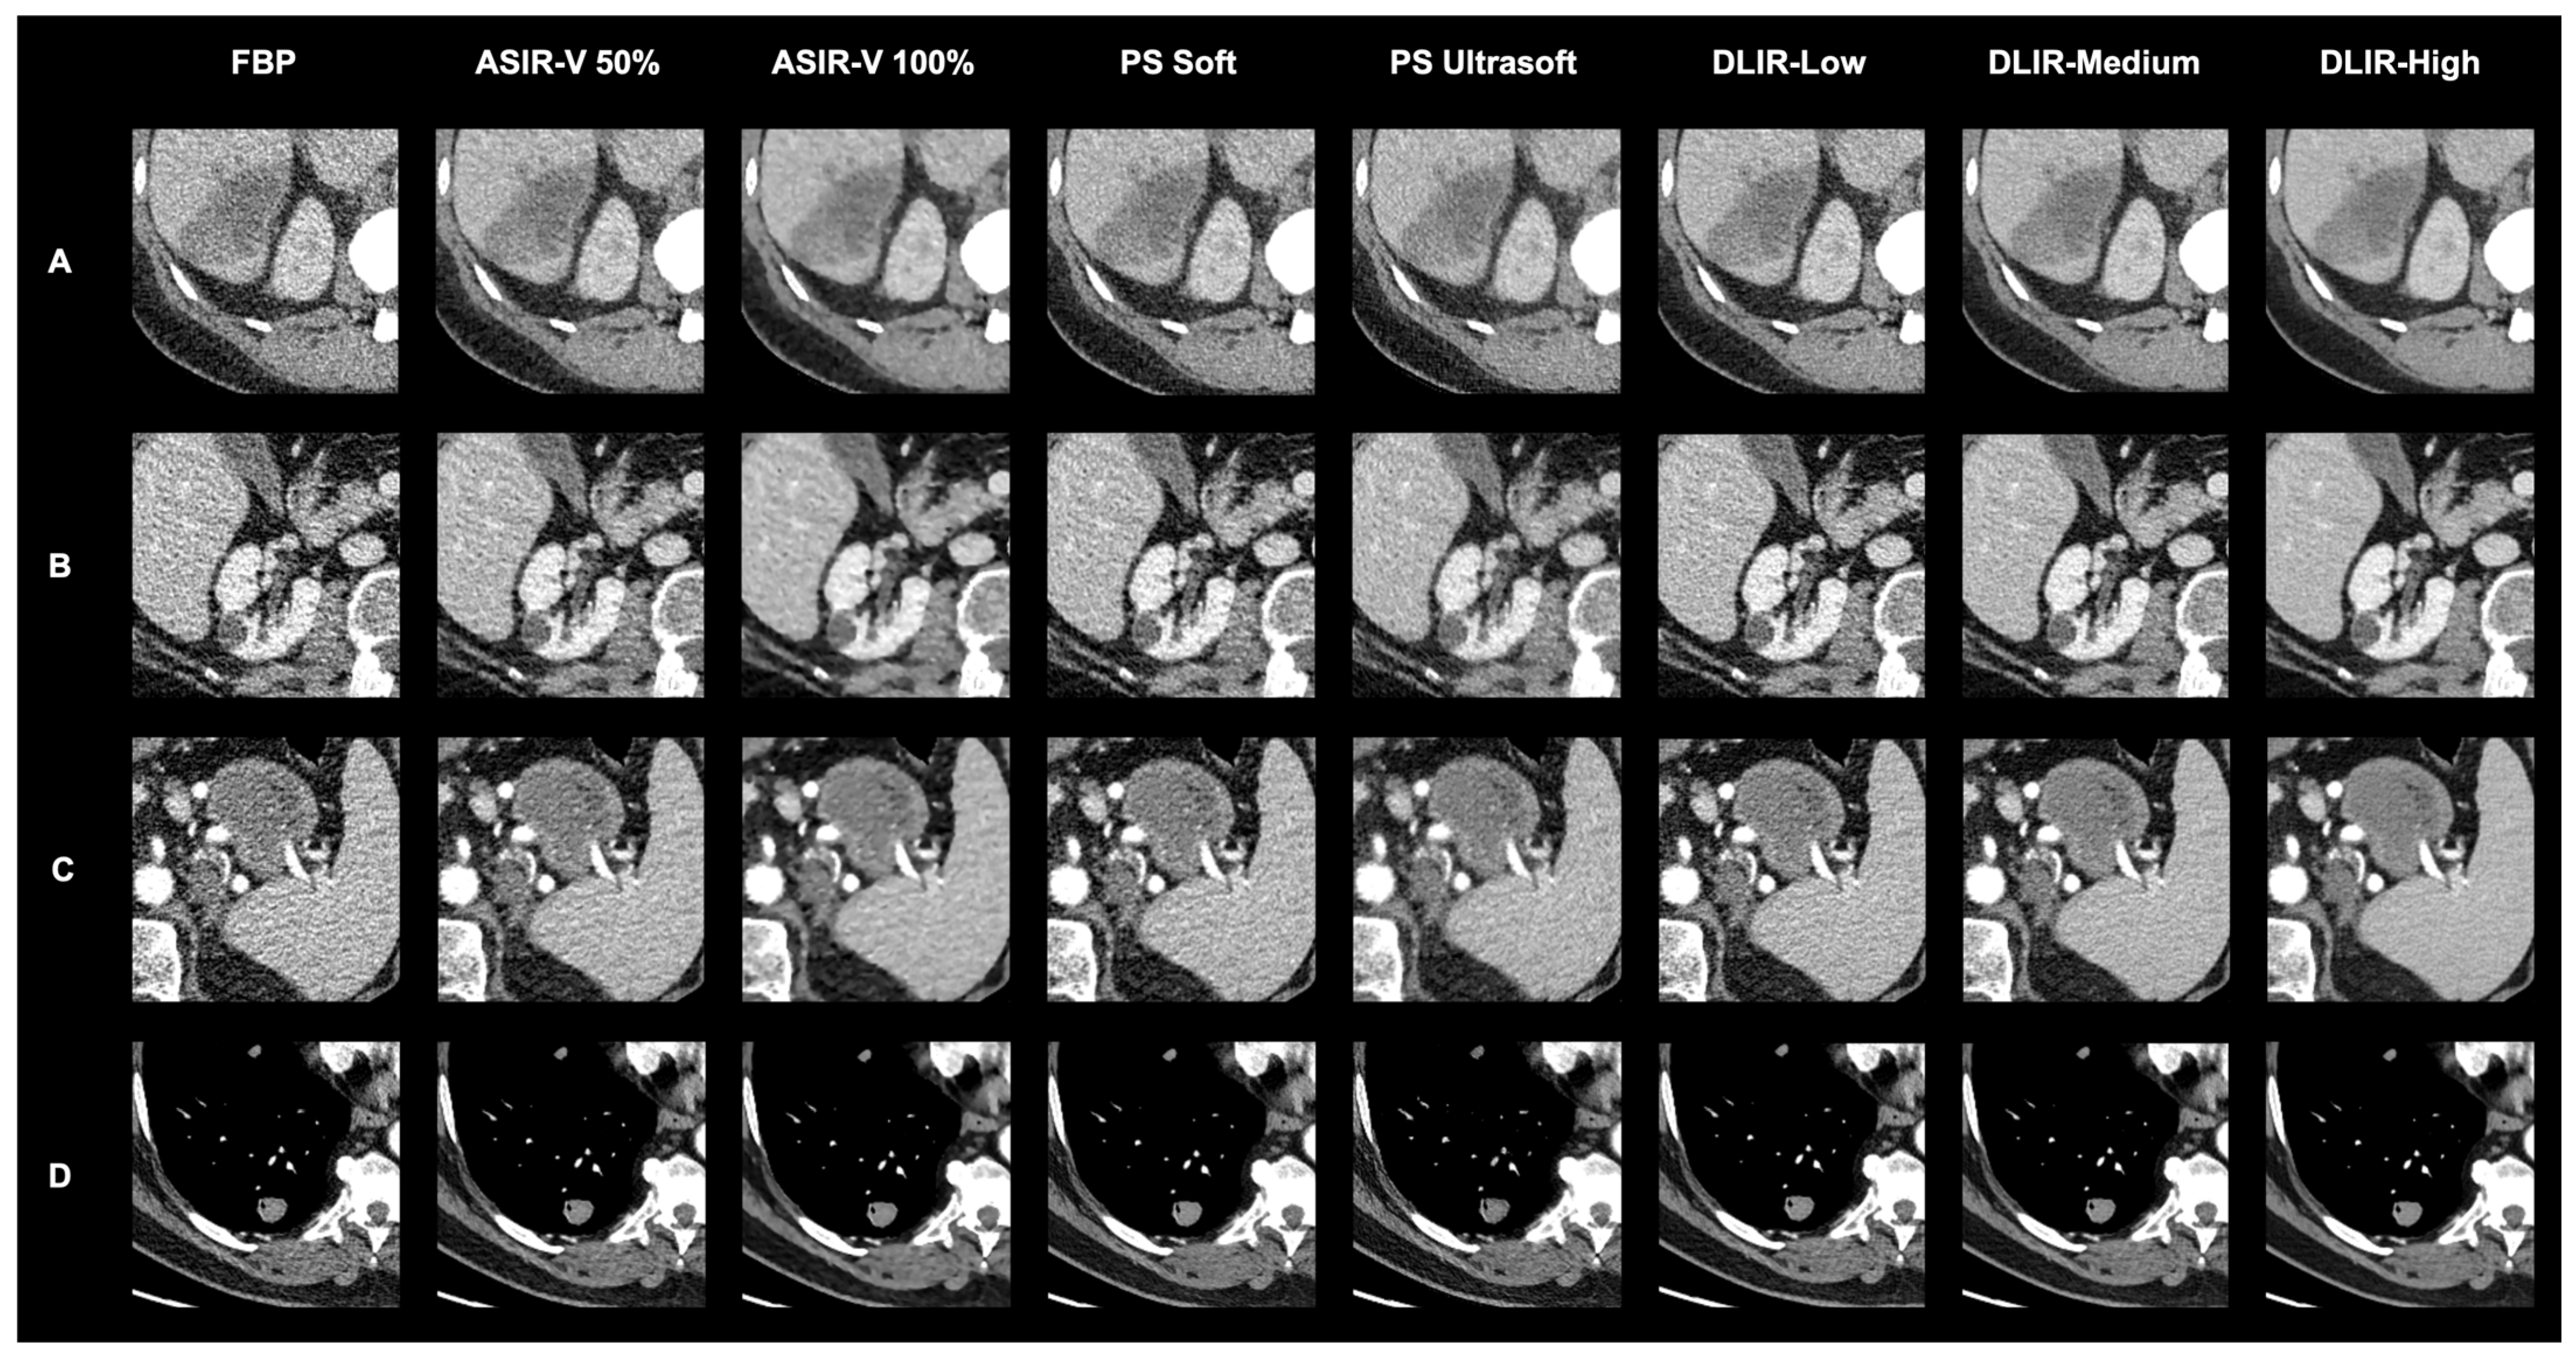
2.3. Image Reconstructions
2.3.1. TrueFidelity
2.3.2. Pixelshine
2.4. Quantitative Evaluation
2.5. Qualitative Evaluation
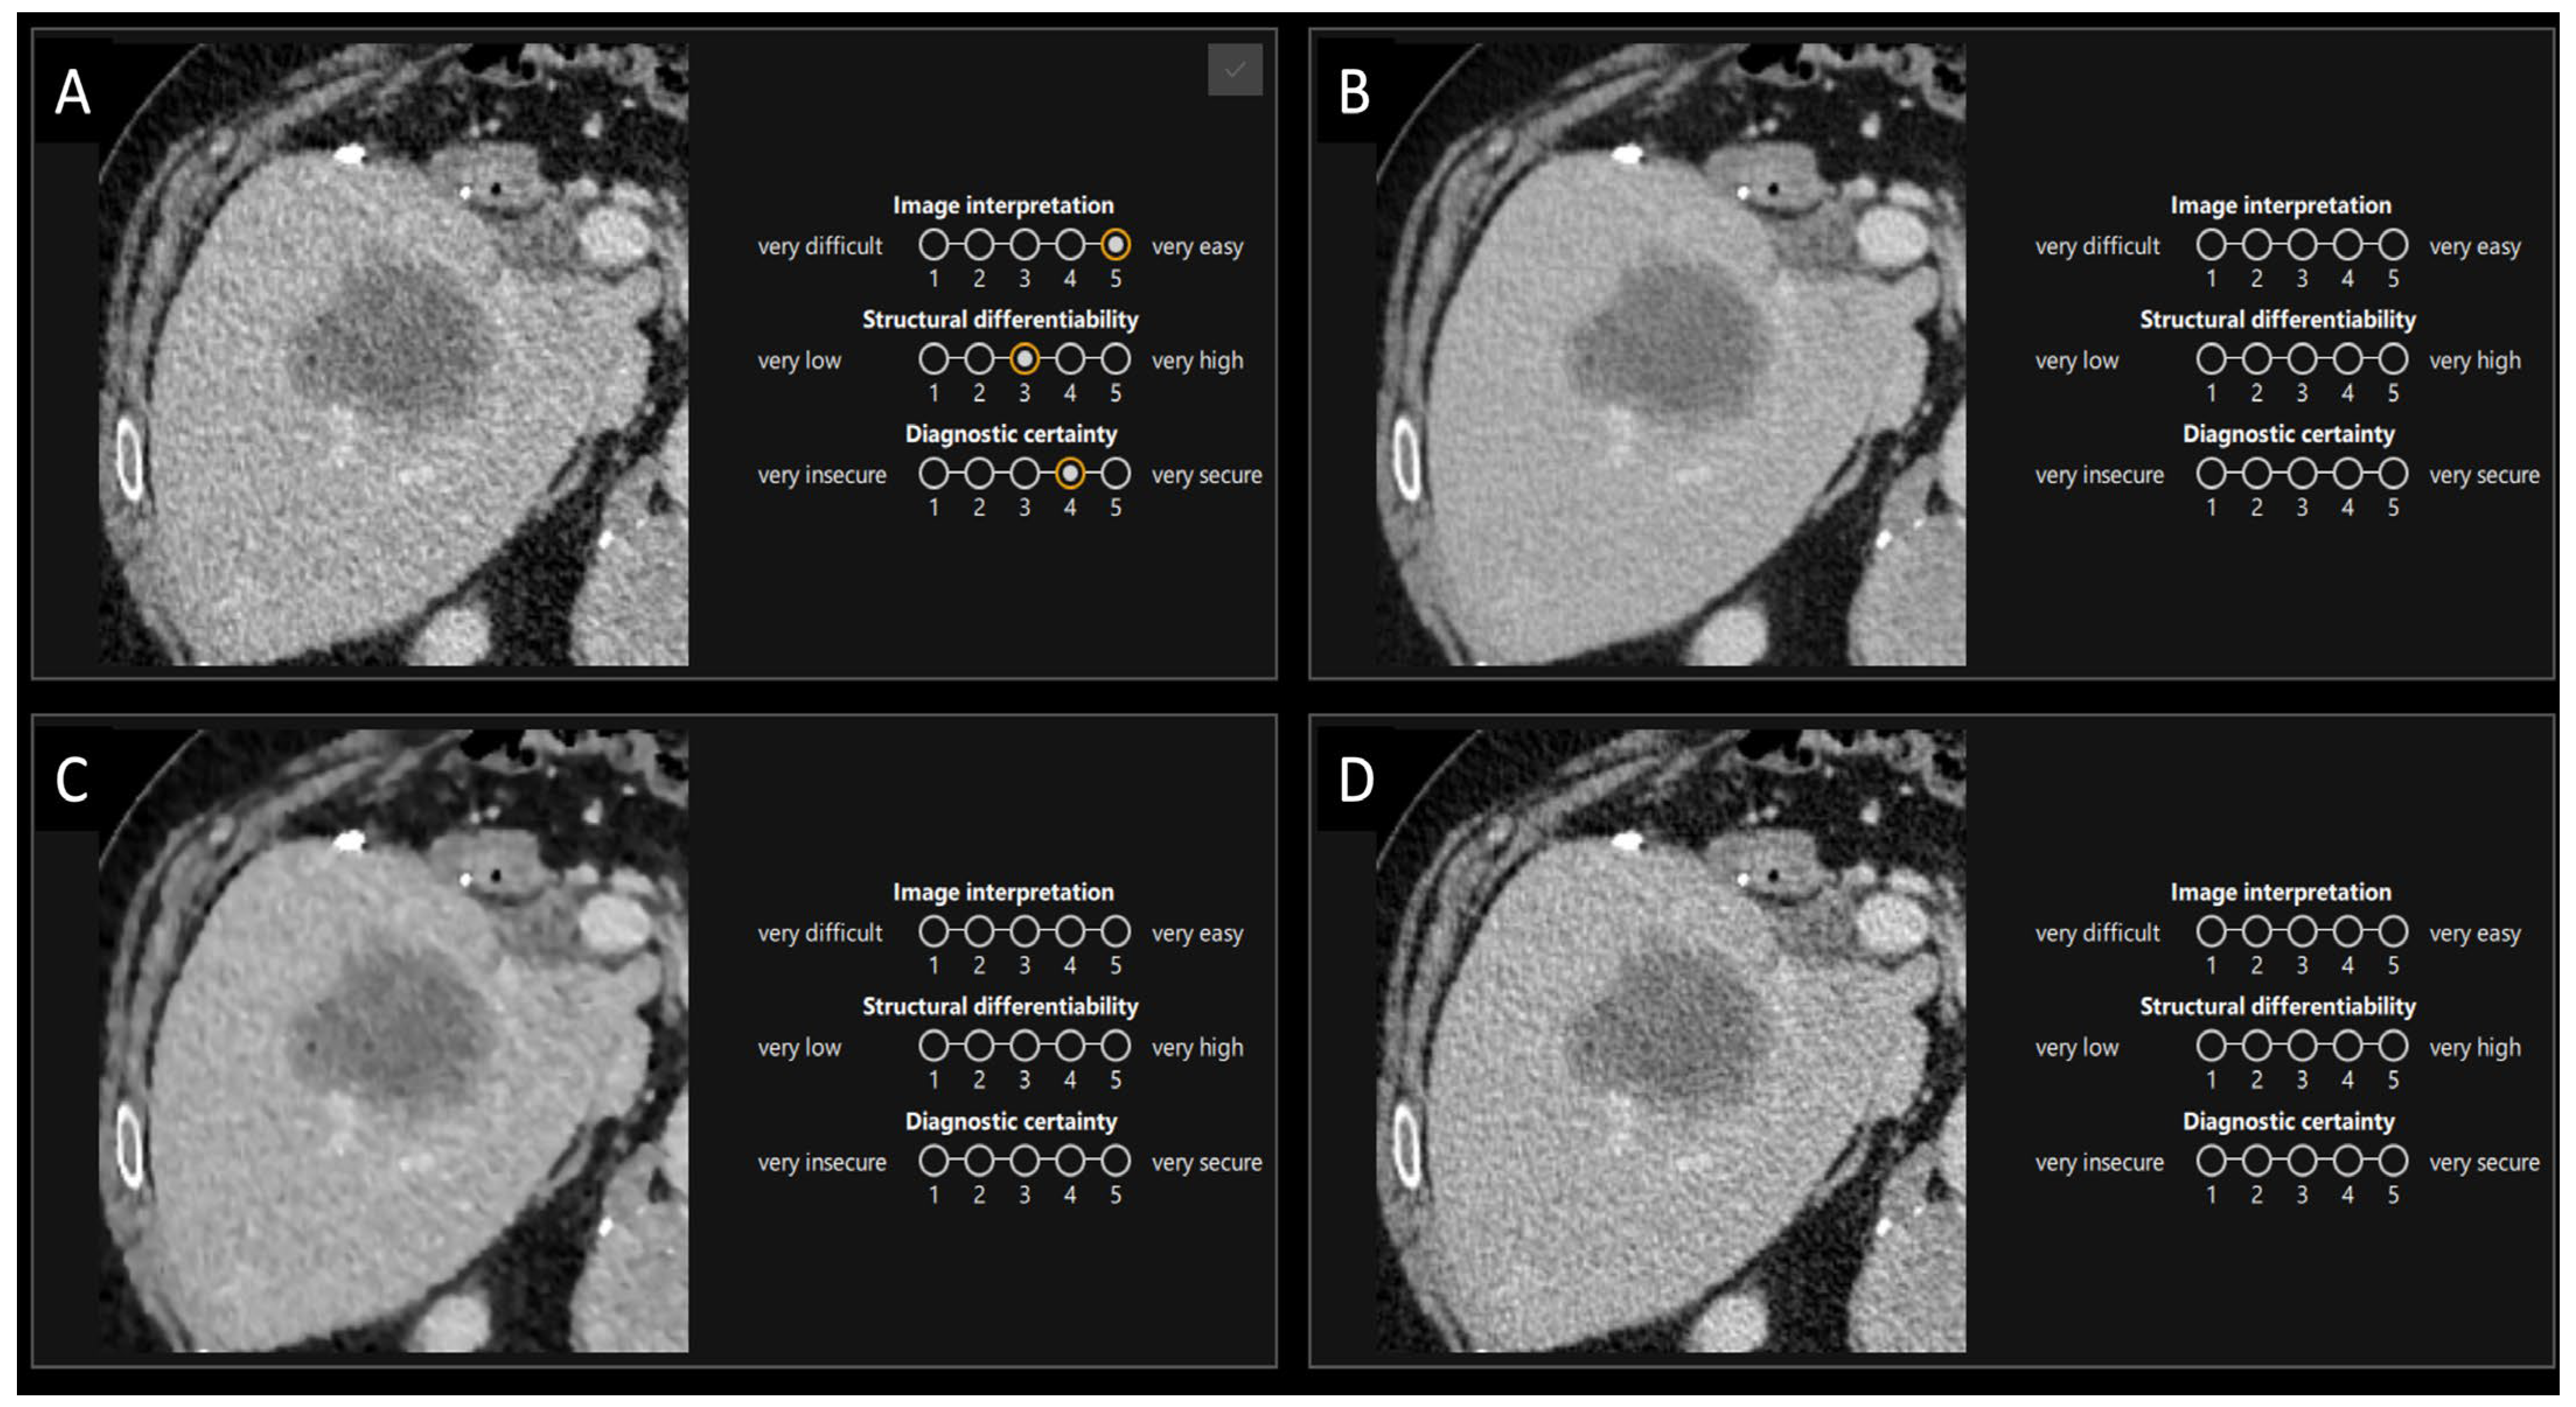
2.5.1. First Part
2.5.2. Second Part
2.6. Statistical Analysis
3. Results
3.1. Quantitative Evaluation
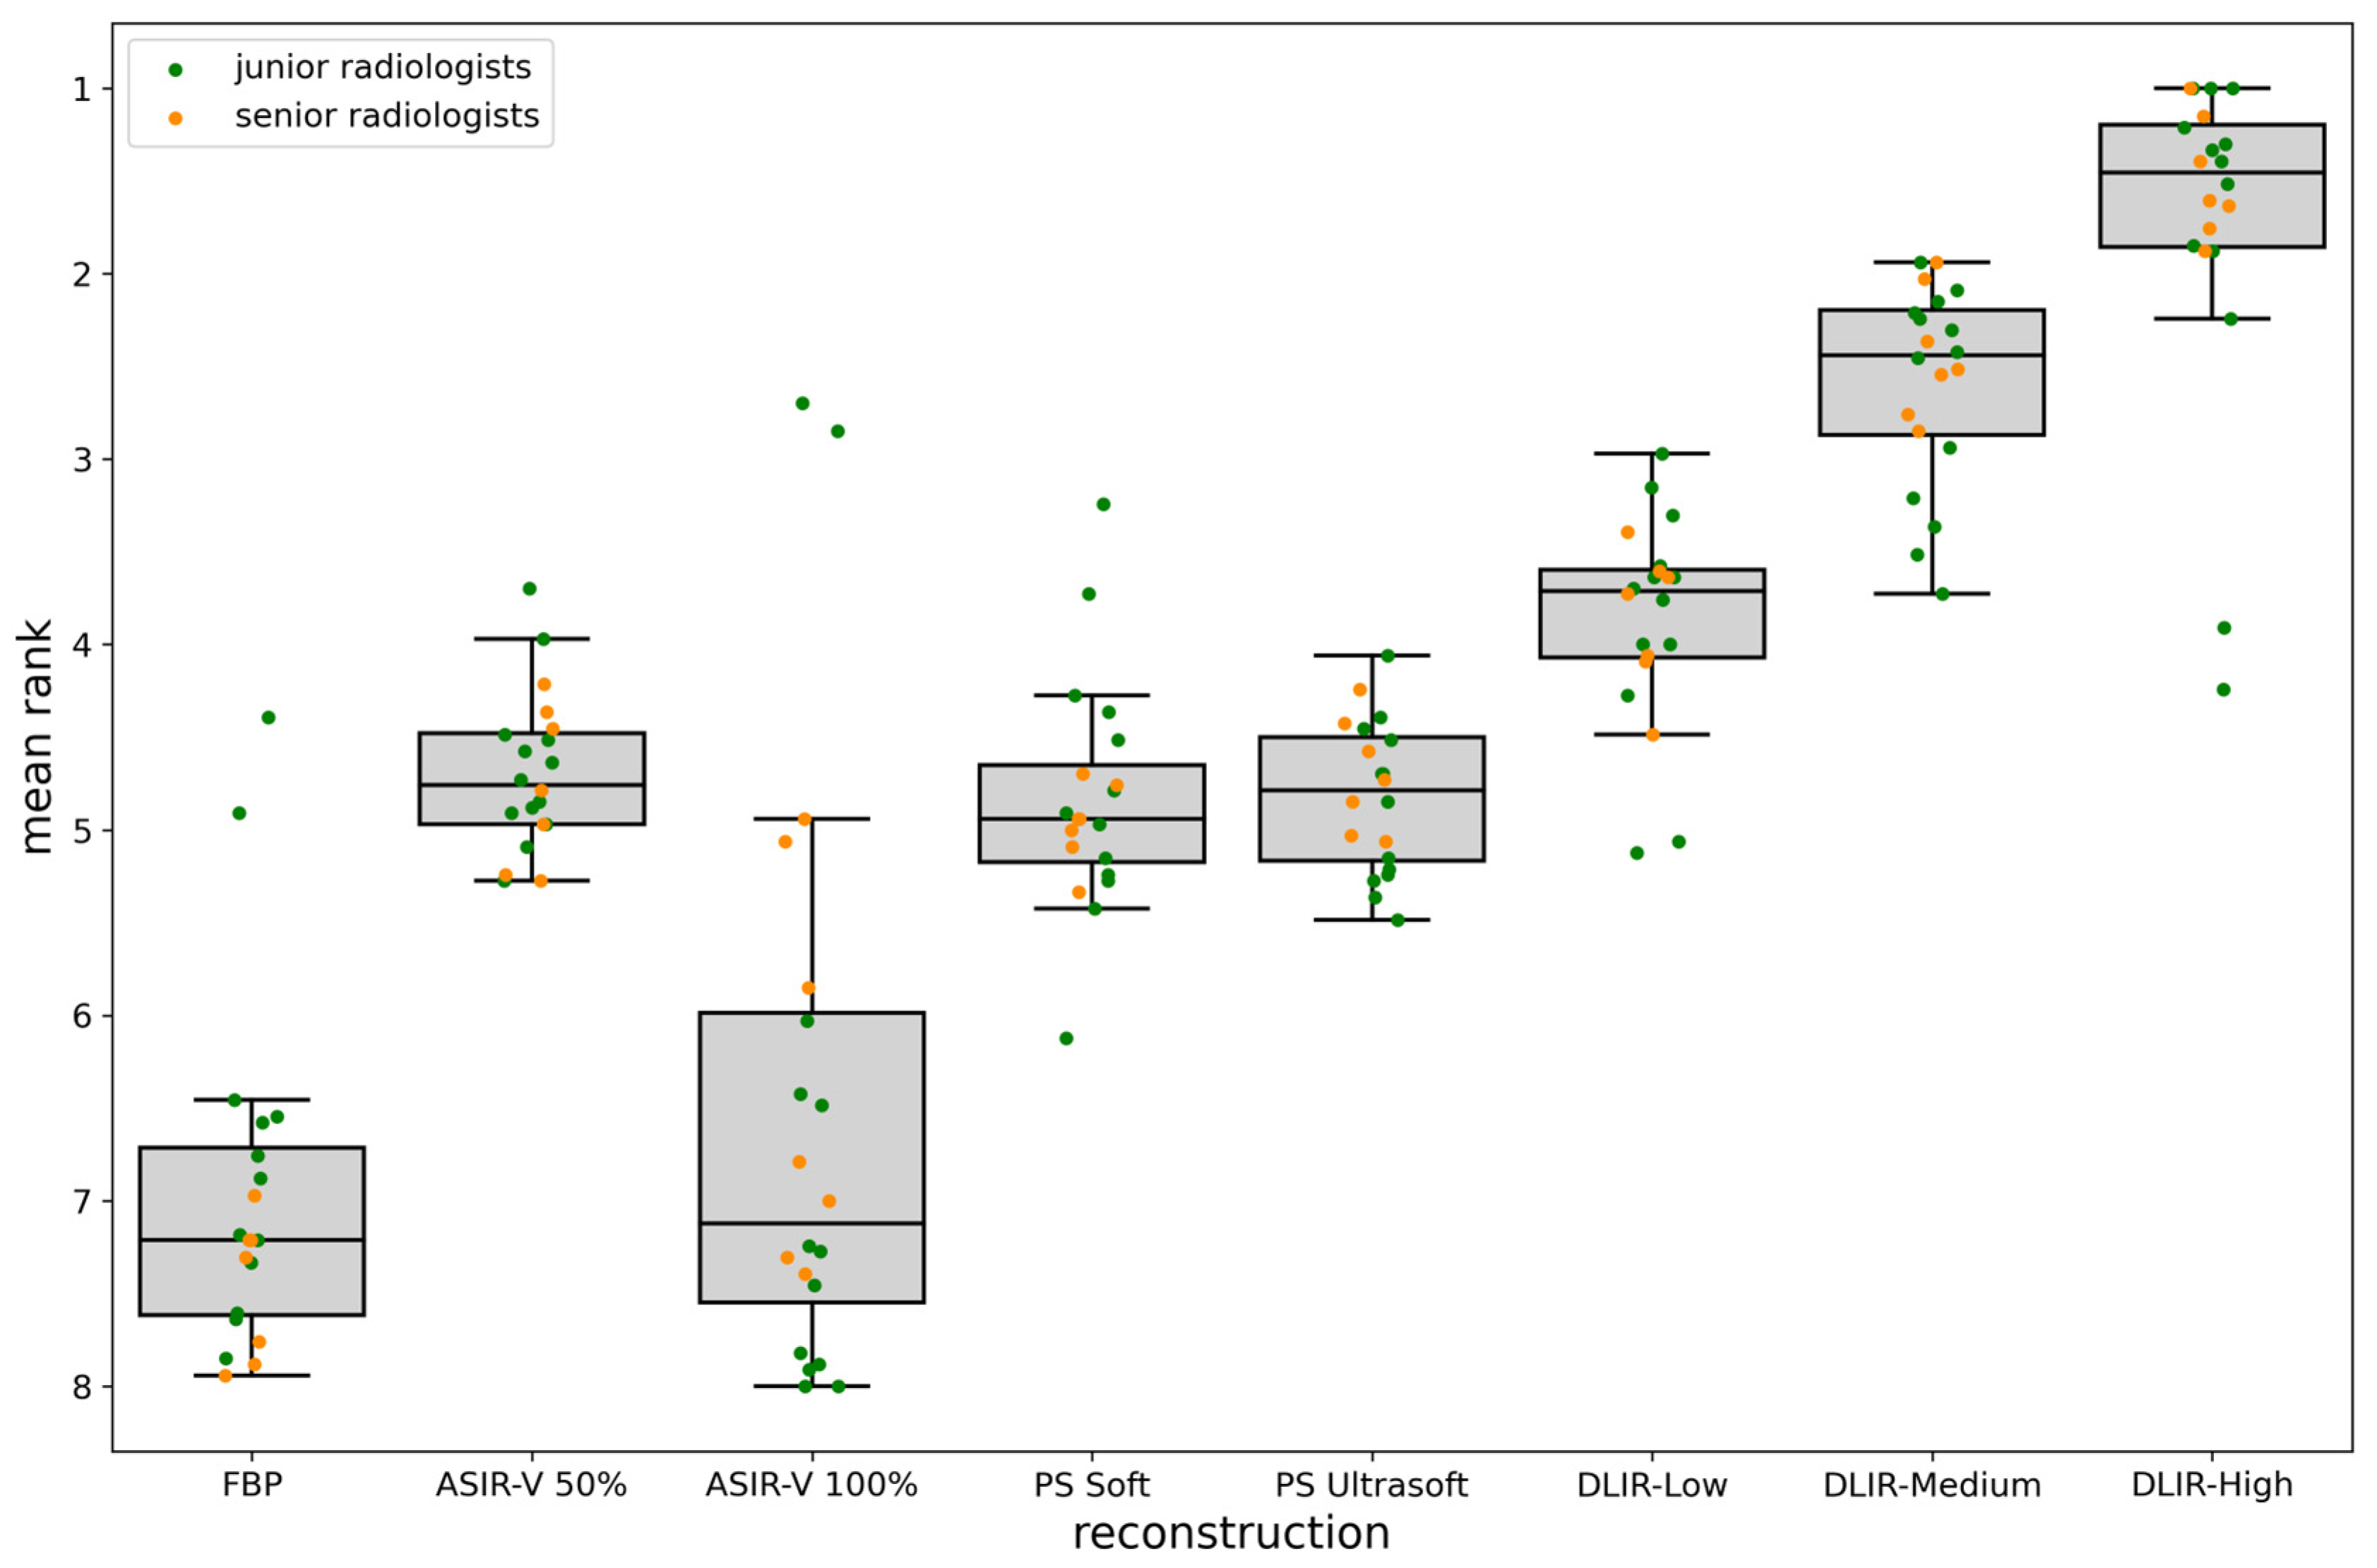
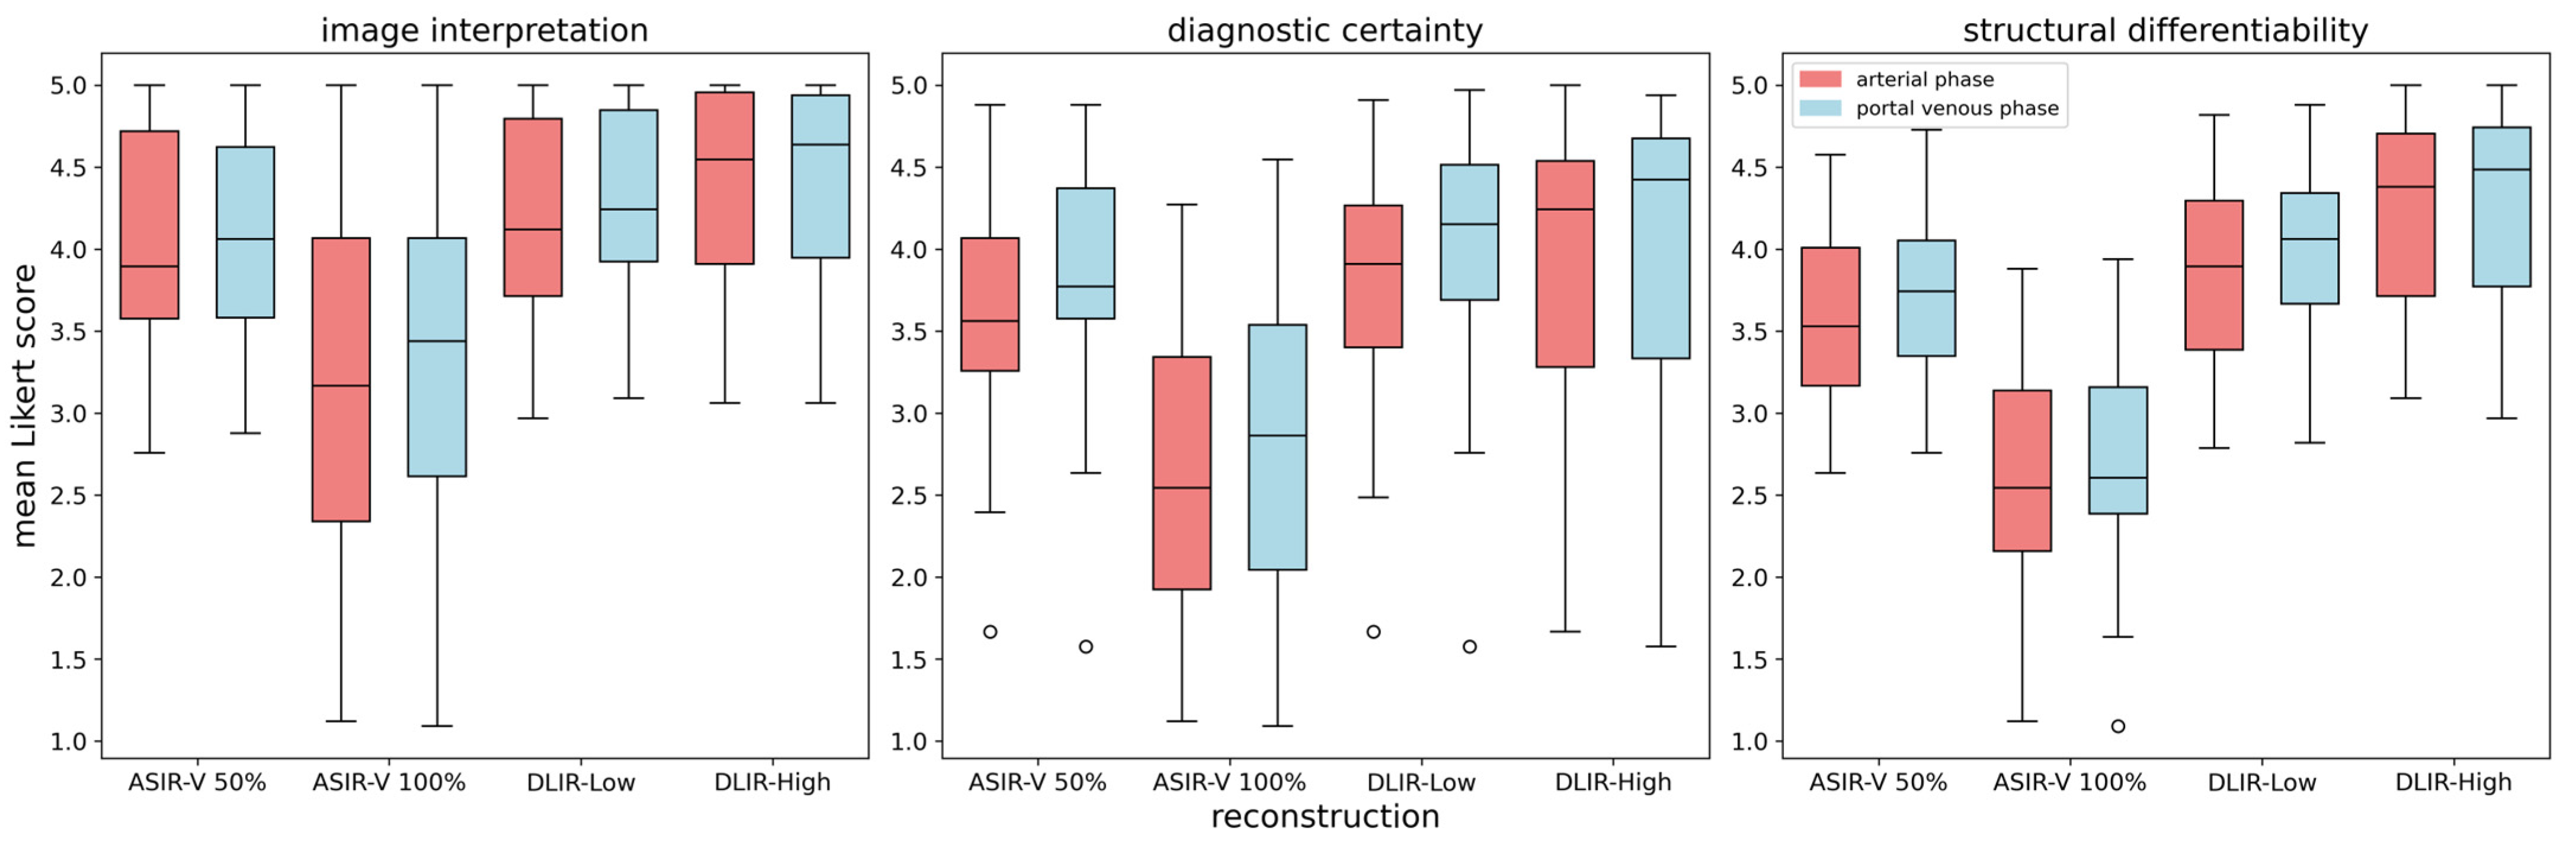
3.2. Qualitative Evaluation
4. Discussion
5. Conclusions
Author Contributions
Funding
Institutional Review Board Statement
Informed Consent Statement
Data Availability Statement
Acknowledgments
Conflicts of Interest
References
- Hsieh, J.; Liu, E.; Nett, B.; Tang, J.; Thibault, J.-B.; Sahney, S. A New Era of Image Reconstruction: TrueFidelity; White Paper (JB68676XX); GE Healthcare: Tokyo, Japan, 2019. [Google Scholar]
- Tian, S.-F.; Liu, A.-L.; Liu, J.-H.; Liu, Y.-J.; Pan, J.-D. Potential value of the PixelShine deep learning algorithm for increasing quality of 70 kVp+ ASiR-V reconstruction pelvic arterial phase CT images. Jpn. J. Radiol. 2019, 37, 186–190. [Google Scholar] [CrossRef] [PubMed]
- Kim, J.H.; Yoon, H.J.; Lee, E.; Kim, I.; Cha, Y.K.; Bak, S.H. Validation of Deep-Learning Image Reconstruction for Low-Dose Chest Computed Tomography Scan: Emphasis on Image Quality and Noise. Korean J. Radiol. 2021, 22, 131–138. [Google Scholar] [CrossRef] [PubMed]
- Park, C.; Choo, K.S.; Jung, Y.; Jeong, H.S.; Hwang, J.Y.; Yun, M.S. CT iterative vs. deep learning reconstruction: Comparison of noise and sharpness. Eur. Radiol. 2021, 31, 3156–3164. [Google Scholar] [CrossRef] [PubMed]
- Zhang, K.; Shi, X.; Xie, S.S.; Sun, J.H.; Liu, Z.H.; Zhang, S.; Song, J.Y.; Shen, W. Deep learning image reconstruction in pediatric abdominal and chest computed tomography: A comparison of image quality and radiation dose. Quant. Imaging Med. Surg. 2022, 12, 3238–3250. [Google Scholar] [CrossRef] [PubMed]
- Li, Y.; Liu, X.; Zhuang, X.H.; Wang, M.J.; Song, X.F. Assessment of low-dose paranasal sinus CT imaging using a new deep learning image reconstruction technique in children compared to adaptive statistical iterative reconstruction V (ASiR-V). BMC Med. Imaging 2022, 22, 106. [Google Scholar] [CrossRef] [PubMed]
- Tamura, A.; Mukaida, E.; Ota, Y.; Nakamura, I.; Arakita, K.; Yoshioka, K. Deep learning reconstruction allows low-dose imaging while maintaining image quality: Comparison of deep learning reconstruction and hybrid iterative reconstruction in contrast-enhanced abdominal CT. Quant. Imaging Med. Surg. 2022, 12, 2977–2984. [Google Scholar] [CrossRef] [PubMed]
- De Santis, D.; Polidori, T.; Tremamunno, G.; Rucci, C.; Piccinni, G.; Zerunian, M.; Pugliese, L.; Del Gaudio, A.; Guido, G.; Barbato, L.; et al. Deep learning image reconstruction algorithm: Impact on image quality in coronary computed tomography angiography. Radiol. Med. 2023, 128, 434–444. [Google Scholar] [CrossRef] [PubMed]
- Xu, J.J.; Lönn, L.; Budtz-Jørgensen, E.; Jawad, S.; Ulriksen, P.S.; Hansen, K.L. Evaluation of thin-slice abdominal DECT using deep-learning image reconstruction in 74 keV virtual monoenergetic images: An image quality comparison. Abdom. Radiol. 2023, 48, 1536–1544. [Google Scholar] [CrossRef] [PubMed]
- Geyer, L.L.; Schoepf, U.J.; Meinel, F.G.; Nance, J.W., Jr.; Bastarrika, G.; Leipsic, J.A.; Paul, N.S.; Rengo, M.; Laghi, A.; De Cecco, C.N. State of the Art: Iterative CT Reconstruction Techniques. Radiology 2015, 276, 339–357. [Google Scholar] [CrossRef] [PubMed]
- Greffier, J.; Frandon, J.; Pereira, F.; Hamard, A.; Beregi, J.; Larbi, A.; Omoumi, P. Optimization of radiation dose for CT detection of lytic and sclerotic bone lesions: A phantom study. Eur. Radiol. 2019, 30, 1075–1078. [Google Scholar] [CrossRef] [PubMed]
- Leipsic, J.; Labounty, T.M.; Heilbron, B.; Min, J.K.; Mancini, G.B.; Lin, F.Y.; Taylor, C.; Dunning, A.; Earls, J.P. Adaptive statistical iterative reconstruction: Assessment of image noise and image quality in coronary CT angiography. AJR Am. J. Roentgenol. 2010, 195, 649–654. [Google Scholar] [CrossRef] [PubMed]
- Koetzier, L.R.; Mastrodicasa, D.; Szczykutowicz, T.P.; van der Werf, N.R.; Wang, A.S.; Sandfort, V.; van der Molen, A.J.; Fleischmann, D.; Willemink, M.J. Deep Learning Image Reconstruction for CT: Technical Principles and Clinical Prospects. Radiology 2023, 306, e221257. [Google Scholar] [CrossRef] [PubMed]
- Greffier, J.; Hamard, A.; Pereira, F.; Barrau, C.; Pasquier, H.; Beregi, J.P.; Frandon, J. Image quality and dose reduction opportunity of deep learning image reconstruction algorithm for CT: A phantom study. Eur. Radiol. 2020, 30, 3951–3959. [Google Scholar] [CrossRef] [PubMed]
- Jiang, J.M.; Miao, L.; Liang, X.; Liu, Z.H.; Zhang, L.; Li, M. The Value of Deep Learning Image Reconstruction in Improving the Quality of Low-Dose Chest CT Images. Diagnostics 2022, 12, 2560. [Google Scholar] [CrossRef] [PubMed]
- Heinrich, A.; Schenkl, S.; Buckreus, D.; Güttler, F.V.; Teichgräber, U.K.M. CT-based thermometry with virtual monoenergetic images by dual-energy of fat, muscle and bone using FBP, iterative and deep learning–based reconstruction. Eur. Radiol. 2022, 32, 424–431. [Google Scholar] [CrossRef] [PubMed]
- Wu, J.; Li, R.; Zhang, H.; Zheng, Q.; Tao, W.; Yang, M.; Zhu, Y.; Ji, G.; Li, W. Screening for lung cancer using thin-slice low-dose computed tomography in southwestern China: A population-based real-world study. Thorac. Cancer 2024, 15, 1522–1532. [Google Scholar] [CrossRef] [PubMed]
- Heinrich, A. Accelerating computer vision-based human identification through the integration of deep learning-based age estimation from 2 to 89 years. Sci. Rep. 2024, 14, 4195. [Google Scholar] [CrossRef] [PubMed]
- Bonada, M.; Rossi, L.F.; Carone, G.; Panico, F.; Cofano, F.; Fiaschi, P.; Garbossa, D.; Di Meco, F.; Bianconi, A. Deep Learning for MRI Segmentation and Molecular Subtyping in Glioblastoma: Critical Aspects from an Emerging Field. Biomedicines 2024, 12, 1878. [Google Scholar] [CrossRef] [PubMed]


| Overall (n = 33) | Staging (n = 7) | Restaging (n = 26) | |
|---|---|---|---|
| Age [years] | 64.09 ± 12.77 | 68.00 ± 9.42 | 63.04 ± 13.49 |
| Sex (male/female) | 16/17 | 2/5 | 14/12 |
| BMI [kg/m2] | 27.49 ± 6.13 | 26.19 ± 4.99 | 27.85 ± 6.46 |
| Malignant | 26 | 5 | 21 |
| Benign | 7 | 2 | 5 |
| ASIR-V 30% | ASIR-V 50% | ASIR-V 70% | ASIR-V 100% | PS Soft | PS Ultrasoft | DLIR-Low | DLIR-Medium | DLIR-High | |
|---|---|---|---|---|---|---|---|---|---|
| improvement compared to FBP [%] native | |||||||||
| SNR | 23 ± 12 | 49 ± 28 | 75 ± 39 | 156 ± 89 | 15 ± 7 | 28 ± 16 | 51 ± 27 | 85 ± 46 | 144 ± 80 |
| CNR | 10 ± 14 | 19 ± 25 | 29 ± 36 | 54 ± 60 | 2 ± 3 | 10 ± 12 | 22 ± 30 | 34 ± 44 | 56 ± 69 |
| arterial | |||||||||
| SNR | 21 ± 15 | 40 ± 30 | 67 ± 54 | 137 ± 135 | 34 ± 21 | 38 ± 26 | 42 ± 32 | 70 ± 54 | 118 ± 98 |
| CNR | 13 ± 14 | 25 ± 27 | 41 ± 42 | 81 ± 82 | 20 ± 21 | 21 ± 20 | 27 ± 30 | 46 ± 49 | 79 ± 84 |
| portal venous | |||||||||
| SNR | 23 ± 13 | 44 ± 26 | 73 ± 44 | 144 ± 98 | 37 ± 21 | 46 ± 27 | 47 ± 29 | 78 ± 49 | 130 ± 86 |
| CNR | 15 ± 14 | 30 ± 26 | 49 ± 42 | 98 ± 86 | 26 ± 23 | 33 ± 27 | 33 ± 30 | 56 ± 52 | 99 ± 98 |
| overall mean with phase variability | |||||||||
| SNR | 22 ± 1 | 45 ± 4 | 72 ± 4 | 145 ± 10 | 28 ± 12 | 37 ± 9 | 47 ± 5 | 78 ± 8 | 131 ± 13 |
| CNR | 12 ± 3 | 24 ± 5 | 39 ± 10 | 78 ± 22 | 16 ± 13 | 21 ± 12 | 27 ± 5 | 45 ± 11 | 78 ± 21 |
| p Value | FBP | ASIR-V 50% | ASIR-V 100% | PS Soft | PS Ultrasoft | DLIR-Low | DLIR-Medium | DLIR-High |
|---|---|---|---|---|---|---|---|---|
| FBP | - | <0.001 Sign. | 0.715 | <0.001 Sign. | <0.001 Sign. | <0.001 Sign. | <0.001 Sign. | <0.001 Sign. |
| ASIR-V 50% | <0.001 Sign. | - | <0.001 Sign. | 0.218 | 0.516 | <0.001 Sign. | <0.001 Sign. | <0.001 Sign. |
| ASIR-V 100% | 0.715 | <0.001 Sign. | - | <0.001 Sign. | <0.001 Sign. | <0.001 Sign. | <0.001 Sign. | <0.001 Sign. |
| PS Soft | <0.001 Sign. | 0.218 | <0.001 Sign. | - | 0.655 | <0.001 Sign. | <0.001 Sign. | <0.001 Sign. |
| PS Ultrasoft | <0.001 Sign. | 0.516 | <0.001 Sign. | 0.655 | - | <0.001 Sign. | <0.001 Sign. | <0.001 Sign. |
| DLIR-Low | <0.001 Sign. | <0.001 Sign. | <0.001 Sign. | <0.001 Sign. | <0.001 Sign. | - | <0.001 Sign. | <0.001 Sign. |
| DLIR-Medium | <0.001 Sign. | <0.001 Sign. | <0.001 Sign. | <0.001 Sign. | <0.001 Sign. | <0.001 Sign. | - | <0.001 Sign. |
| DLIR-High | <0.001 Sign. | <0.001 Sign. | <0.001 Sign. | <0.001 Sign. | <0.001 Sign. | <0.001 Sign. | <0.001 Sign. | - |
| Arterial Phase | Portal Venous Phase | ||||||||
|---|---|---|---|---|---|---|---|---|---|
| ASIR-50% | ASIR-100% | DLIR-Low | DLIR-High | ASIR-50% | ASIR-100% | DLIR-Low | DLIR-High | ||
| image interpretation | ASIR-50% | - | 0.023 (Sign.) | 0.397 | 0.080 | - | 0.014 (Sign.) | 0.327 | 0.140 |
| ASIR-100% | 0.023 (Sign.) | - | 0.005 (Sign.) | <0.001 Sign. | 0.014 (Sign.) | - | 0.002 Sign. | 0.002 Sign. | |
| DLIR-Low | 0.397 | 0.005 (Sign.) | - | 0.211 | 0.327 | 0.002 Sign. | - | 0.515 | |
| DLIR-High | 0.080 | <0.001 Sign. | 0.211 | - | 0.140 | 0.002 Sign. | 0.515 | - | |
| diagnostic certainty | ASIR-50% | - | 0.001 Sign. | 0.274 | 0.036 (Sign.) | - | 0.002 Sign. | 0.212 | 0.070 |
| ASIR-100% | 0.001 Sign. | - | <0.001 Sign. | <0.001 Sign. | 0.002 Sign. | - | <0.001 Sign. | <0.001 Sign. | |
| DLIR-Low | 0.274 | <0.001 Sign. | - | 0.051 | 0.212 | <0.001 Sign. | - | 0.332 | |
| DLIR-High | 0.036 (Sign.) | <0.001 Sign. | 0.051 | - | 0.070 | <0.001 Sign. | 0.332 | - | |
| structural differentiability | ASIR-50% | - | <0.001 Sign. | 0.122 | 0.004 (Sign.) | - | <0.001 Sign. | 0.066 | 0.010 (Sign.) |
| ASIR-100% | <0.001 Sign. | - | <0.001 Sign. | <0.001 Sign. | <0.001 Sign. | - | <0.001 Sign. | <0.001 Sign. | |
| DLIR-Low | 0.122 | <0.001 Sign. | - | 0.051 | 0.066 | <0.001 Sign. | - | 0.183 | |
| DLIR-High | 0.004 (Sign.) | <0.001 Sign. | 0.051 | - | 0.010 (Sign.) | <0.001 Sign. | 0.183 | - | |
| Author/Year | RADs | Exp. [yrs] | Pat. | Region | CA | Method | Outcome |
|---|---|---|---|---|---|---|---|
| Kim et al. [3] 2020 | 2 | 2, 13 | 58 | Lung, mediastinum, liver staging | no | - GE Revolution with low-dose chest protocol (voltage: 120 kVp, slice thickness: 2.5 mm) - Reconstructions: ASIR-V (30%), DLIR (High, Medium) - Evaluation: qualitative analysis of image contrast, noise and the conspicuity of major structures, including the pulmonary arteries, pulmonary veins, trachea and bronchi, lymph nodes, pleura, and pericardium, with 5-point Likert scale; quantitative analysis of signal, noise, SNR and CNR | - Image noise, image quality, SNR, and CNR improve with DLIR compared to ASIR-V 30%. There is no evaluation of findings. |
| Park et al. [4] 2021 | 2 | 9, 21 | 37 | Vessels, Liver, Psoas muscle | art. | - GE Revolution with CT angiography protocol (voltage: 70 kVp, slice thickness: 2.5 mm) - Reconstructions: ASIR-V (80%, 100%), DLIR (High, Medium, Low) - Evaluation: qualitative analysis of quantum mottle and blurring using a 4-grade system; quantitative analysis of mean attenuation, noise, SNR, CNR, and sharpness (blur metric software) | - Qualitative: Mottle and blurring (best to worst) DLIR-High, DLIR-Medium, ASIR-V 80%, DLIR-Low, ASIR-V 100%. - Quantitative: SNR and CNR (best to worst)—DLIR-High = ASIR-V 100%, ASIR-V 80%, DLIR-Medium, DLIR-Low; sharpness better with DLIR than ASIR-V. There is no evaluation of findings. |
| Zhang et al. [5] 2022 | 2 | 13, 23 | 20 pediatric | abdominal/chest | no | - GE Revolution with abdominal/chest protocol (voltage: 70–80 kVp, slice thickness 0.625 mm) - Reconstructions: ASIR-V (30%, 70%), DLIR (High, Medium) - Evaluation: qualitative analysis of image quality using a 5-point Likert scale; quantitative analysis of noise, SNR, and CNR with a phantom | - Qualitative: DLIR-High had the highest subjective score (abdominal study); no significant difference in subjective scores among the 4 methods (chest study). - Quantitative: DLIR-High showed greatest noise reduction and SNR improvement (abdominal study); DLIR not effective for optimizing extreme CT values (chest study). There is no evaluation of findings. |
| Li et al. [6] 2022 | 2 | 8, 15 | 25 pediatric | paranasal sinuses | no | - GE Revolution with paranasal sinus protocol (voltage: 100 kVp, slice thickness 0.625 mm) - Reconstructions: FBP, ASIR-V (30%, 50%), DLIR (High, Medium, Low) - Evaluation: qualitative analysis of image quality (ethmoid sinus and nasal cavity) using a 5-point Likert scale; quantitative analysis of noise, SNR, and CNR | - Qualitative: image quality (best to worst) DLIR-High, DLIR-Medium, DLIR-Low, ASIR-V 50%, ASIR-V 30%, and FBP. - Quantitative: As DLIR and ASIR-V strength increased, noise decreased and SNR and CNR improved; DLIR-High was the best. There is no evaluation of findings. |
| Tamura et al. [7] 2022 | 2 | 3, 13 | 71 | Liver staging (hepatocellular carcinoma) | pv. | - Canon Aquilion ONE PRISM with liver staging protocol (voltage: 120 kVp, slice thickness 3 mm) - Reconstructions: adaptive iterative dose reduction 3D (AIDR 3D), advanced intelligent clear-IQ engine (AiCE) - Evaluation: qualitative analysis of noise, artifacts, sharpness, and diagnostic acceptability using a 5-point Likert scale; quantitative analysis of noise, and CNR | - Qualitative: no significant difference in image noise and artifacts; AiCE superior to AIDR 3D in sharpness and diagnostic acceptability. - Quantitative: AiCE had significantly lower noise and higher CNR than AIDR 3D. |
| De Santis et al. [8] 2023 | 2 | 8, 12 | 51 | coronary angiography | art. | - GE Revolution EVO with coronary angiography protocol (voltage: 80–100 kVp, slice thickness 0.625 mm) - Reconstructions: FBP, ASIR-V (10–100%, 10% increments), DLIR (High, Medium, Low) - Evaluation: qualitative analysis of image quality focused on plaques for ASIR-V 50%, ASIR-V 100% DLIR-High and DLIR-Medium using a 4-point Likert scale; qualitative image quality analysis of coronary artery disease (CAD) with ASIR-V 50% and DLIR-Medium; quantitative analysis of noise, SNR and CNR | - Qualitative: DLIR-Medium had the highest image quality; DLIR-High and ASIR-V 50% were comparable, followed by ASIR-V 100%; DLIR-Medium has a very strong correlation with ASIR-V 50% for diagnosing CAD. - Quantitative: DLIR-High showed the lowest noise, comparable to ASIR-V 100%, and achieved the highest objective quality with SNR and CNR similar to ASIR-V 100%; DLIR-Medium had comparable objective image quality to ASIR-V 80% and 90%. |
| Xu et al. [9] 2023 | 2 | 6, >20 | 30 | abdominal | pv. | - GE Revolution with dual energy abdomen protocol (voltage: 80/140 kVp, slice thickness 0.625 and 2 mm) - Reconstructions: virtual monoenergetic (VM) images of 74 keV for ASIR-V 60% and DLIR-High - Evaluation: qualitative analysis of noise, sharpness, noise texture and overall image quality using a 5-point Likert scale; quantitative image quality analysis of noise, SNR and CNR | - Qualitative: DLIR-High significantly improved image quality, especially in 0.625 mm images, compared to ASIR-V 60%. - Quantitative: DLIR-High significantly reduced image noise and increased SNR and CNR compared to ASIR-V 60%. There is no evaluation of findings. |
| This study | 28 | 0–17 | 33 | chest, abdomen and pelvis staging | art. and pv. | - GE Revolution with stagging protocol (voltage: 120 kVp, slice thickness 0.625 mm) - Reconstructions: FBP, ASIR-V (30%, 50%, 70%, 100%), Pixelshine (Soft, Ultrasoft), DLIR (High, Medium, Low) - Evaluation: qualitative analysis of ranked image quality on a scale from 1 (best) to 8 (worst); qualitative analysis of image interpretation, structural differentiability, and diagnostic certainty for ASIR-V 50%, ASIR-V 100% DLIR-High and DLIR-Low using a 5-point Likert scale; quantitative analysis of SNR and CNR | - Qualitative: DLIR-High ranked highest, followed by DLIR-Medium and DLIR-Low; ASIR-V 50%, Pixelshine Soft, and Ultrasoft were mid-ranked, with FBP and ASIR-V 100% at the bottom; DLIR-High is preferred for all three criteria (image interpretation, diagnostic certainty, and structural differentiability), followed by DLIR-Low, ASIR-V 50%, and ASIR-V 100%. - No significant difference in evaluation between younger and older radiologists, or between arterial and portal venous phases. - Quantitative: SNR and CNR (best to worst)—DLIR-High = ASIR-V 100%, DLIR-Medium = ASIR-V 70%, DLIR-Low = PS Ultrasoft = ASIR-V 50%, PS Soft, ASIR-V 30%, FBP; DLIR-High and ASIR-V 100% showed the highest SNR- and CNR-values with the lowest noise. |
Disclaimer/Publisher’s Note: The statements, opinions and data contained in all publications are solely those of the individual author(s) and contributor(s) and not of MDPI and/or the editor(s). MDPI and/or the editor(s) disclaim responsibility for any injury to people or property resulting from any ideas, methods, instructions or products referred to in the content. |
© 2024 by the authors. Licensee MDPI, Basel, Switzerland. This article is an open access article distributed under the terms and conditions of the Creative Commons Attribution (CC BY) license (https://creativecommons.org/licenses/by/4.0/).
Share and Cite
Bertl, M.; Hahne, F.-G.; Gräger, S.; Heinrich, A. Impact of Deep Learning-Based Image Reconstruction on Tumor Visibility and Diagnostic Confidence in Computed Tomography. Bioengineering 2024, 11, 1285. https://doi.org/10.3390/bioengineering11121285
Bertl M, Hahne F-G, Gräger S, Heinrich A. Impact of Deep Learning-Based Image Reconstruction on Tumor Visibility and Diagnostic Confidence in Computed Tomography. Bioengineering. 2024; 11(12):1285. https://doi.org/10.3390/bioengineering11121285
Chicago/Turabian StyleBertl, Marie, Friedrich-Georg Hahne, Stephanie Gräger, and Andreas Heinrich. 2024. "Impact of Deep Learning-Based Image Reconstruction on Tumor Visibility and Diagnostic Confidence in Computed Tomography" Bioengineering 11, no. 12: 1285. https://doi.org/10.3390/bioengineering11121285
APA StyleBertl, M., Hahne, F.-G., Gräger, S., & Heinrich, A. (2024). Impact of Deep Learning-Based Image Reconstruction on Tumor Visibility and Diagnostic Confidence in Computed Tomography. Bioengineering, 11(12), 1285. https://doi.org/10.3390/bioengineering11121285