

Multi-Dimensional Validation of the Integration of Syntactic and Semantic Distance Measures for Clustering Fibromyalgia Patients in the Rheumatic Monitor Big Data Study

 ,
,  , ,
, , 
Abstract
1. Introduction
2. Methods
2.1. Data Source, Study Participants and Questionnaire
2.2. Ethical Approval
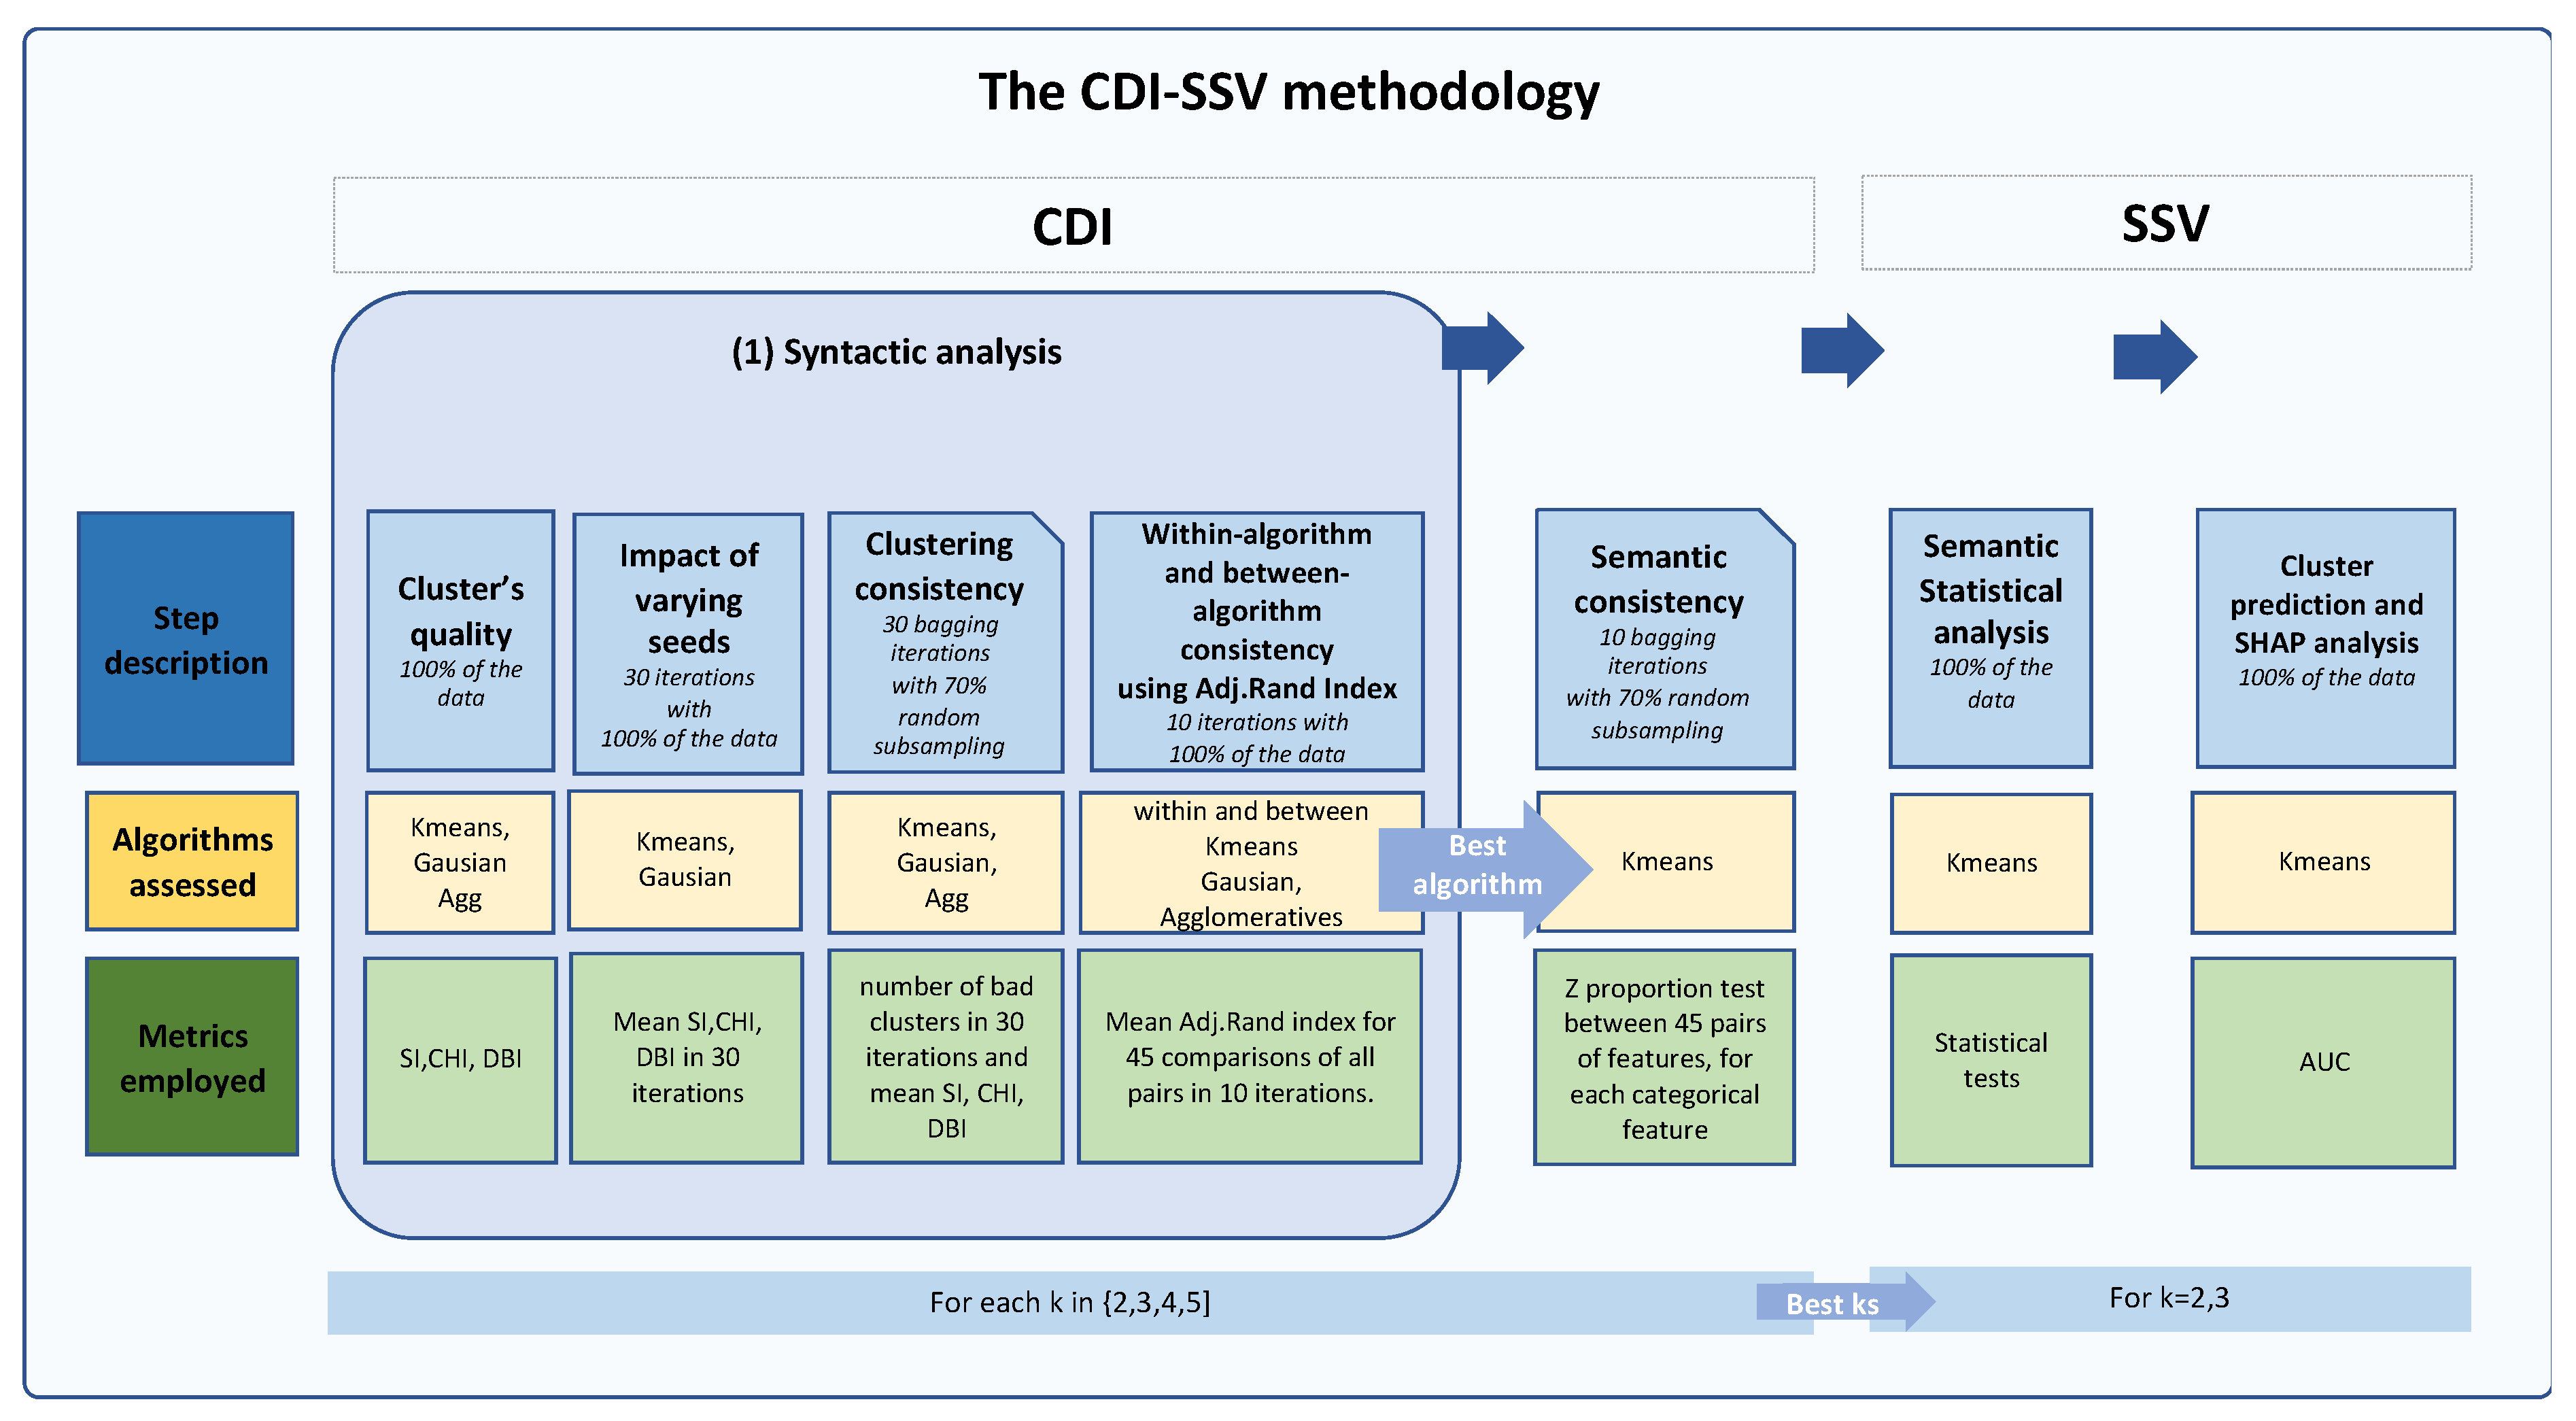
2.3. The Clustering, Distance Measures and Iterative Statistical and Semantic Validation (CDI-SSV) Methodology
2.4. Data Scaling
2.5. The CDI (Clustering, Distance Measures, and Iterative) Phase
2.5.1. Clustering Algorithms
2.5.2. Distance Measures
Syntactic Clustering-Quality Evaluation Metrics
Assessment of the Clustering’s Quality via Multiple Syntactic Distance Evaluation Metrics
2.5.3. Iterative Phase
Assessing the Clustering’s Sensitivity to Starting Seeds
Within and between Clustering Consistency Using the Adjusted Rand Index (Ari)
Within and between Clustering Consistency Using the Adjusted Rand Index (ARI)
Internal Semantic Assessment through Multiple Bagging Iterations Using Partial Subsets (70%) of the Data
2.6. The SSV (Statistical and Semantic Validation) Phase
2.6.1. External (Clinical) Semantic Assessment Using Statistical Analysis
2.6.2. Cluster Validation and Interpretation Using Machine Learning and SHAP
3. Results
3.1. Results of the CDI Phase
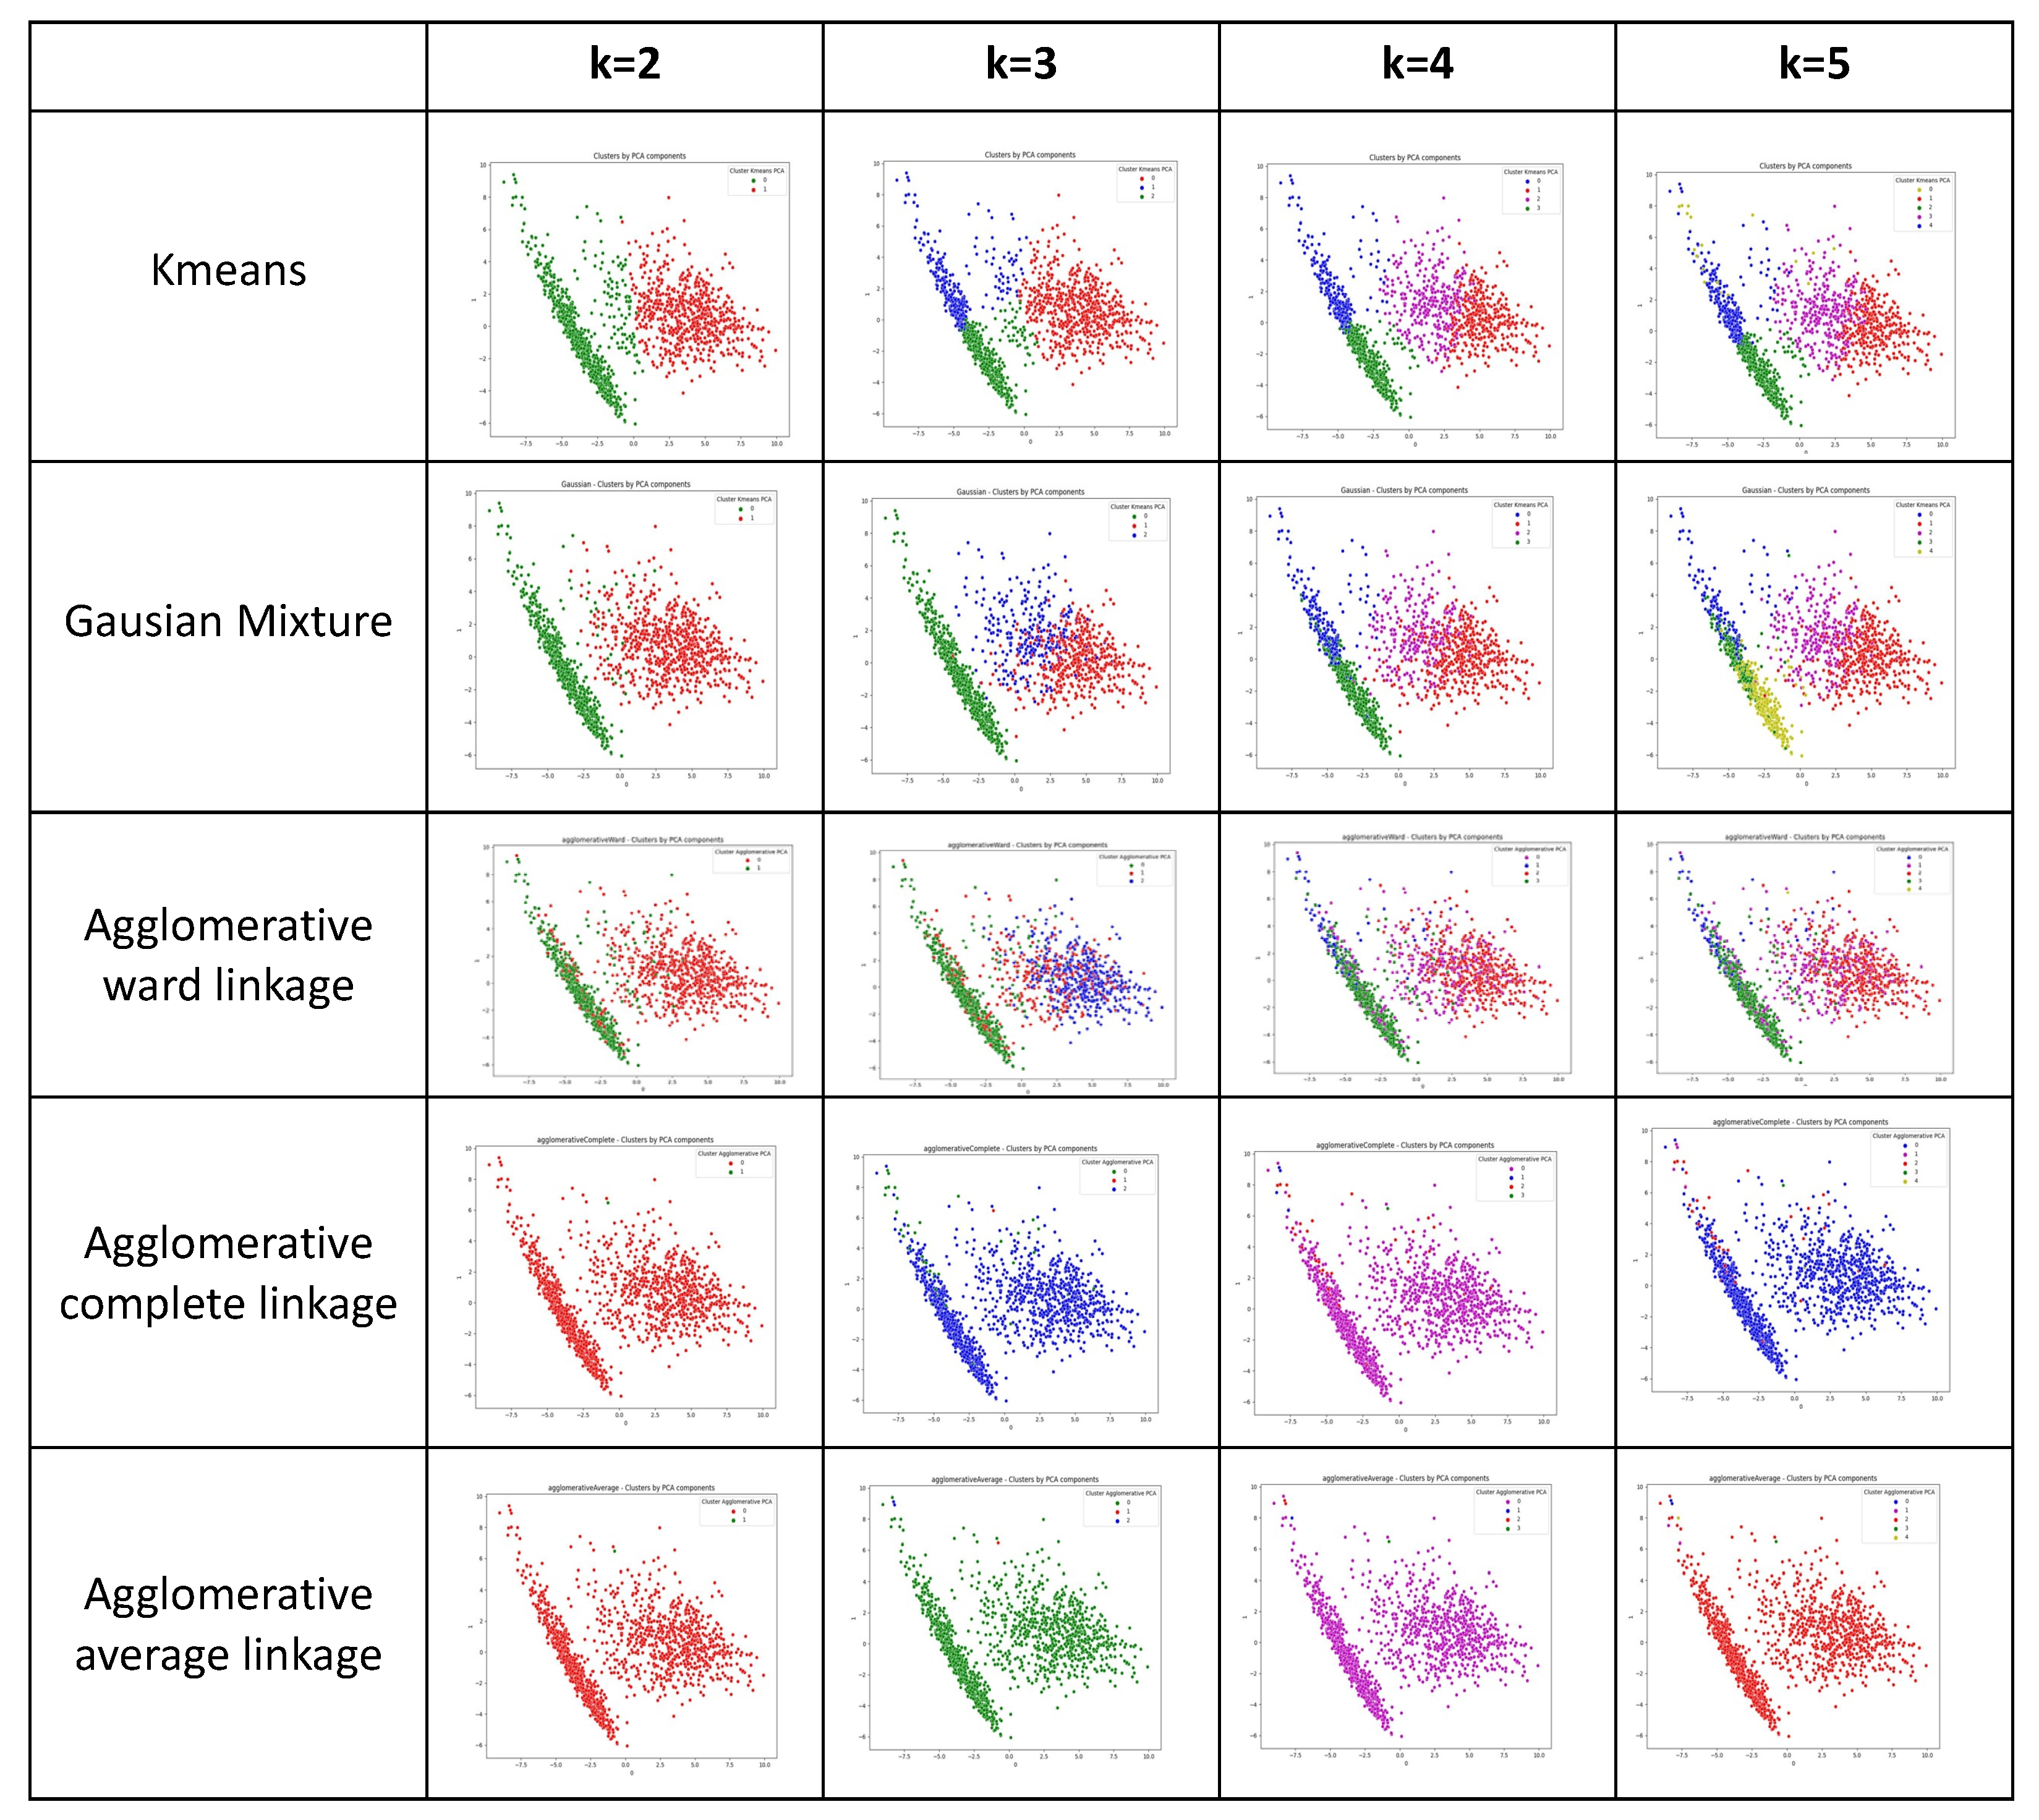
3.1.1. Results of the Clustering Phase
3.1.2. Results of the Distance Measure Phase
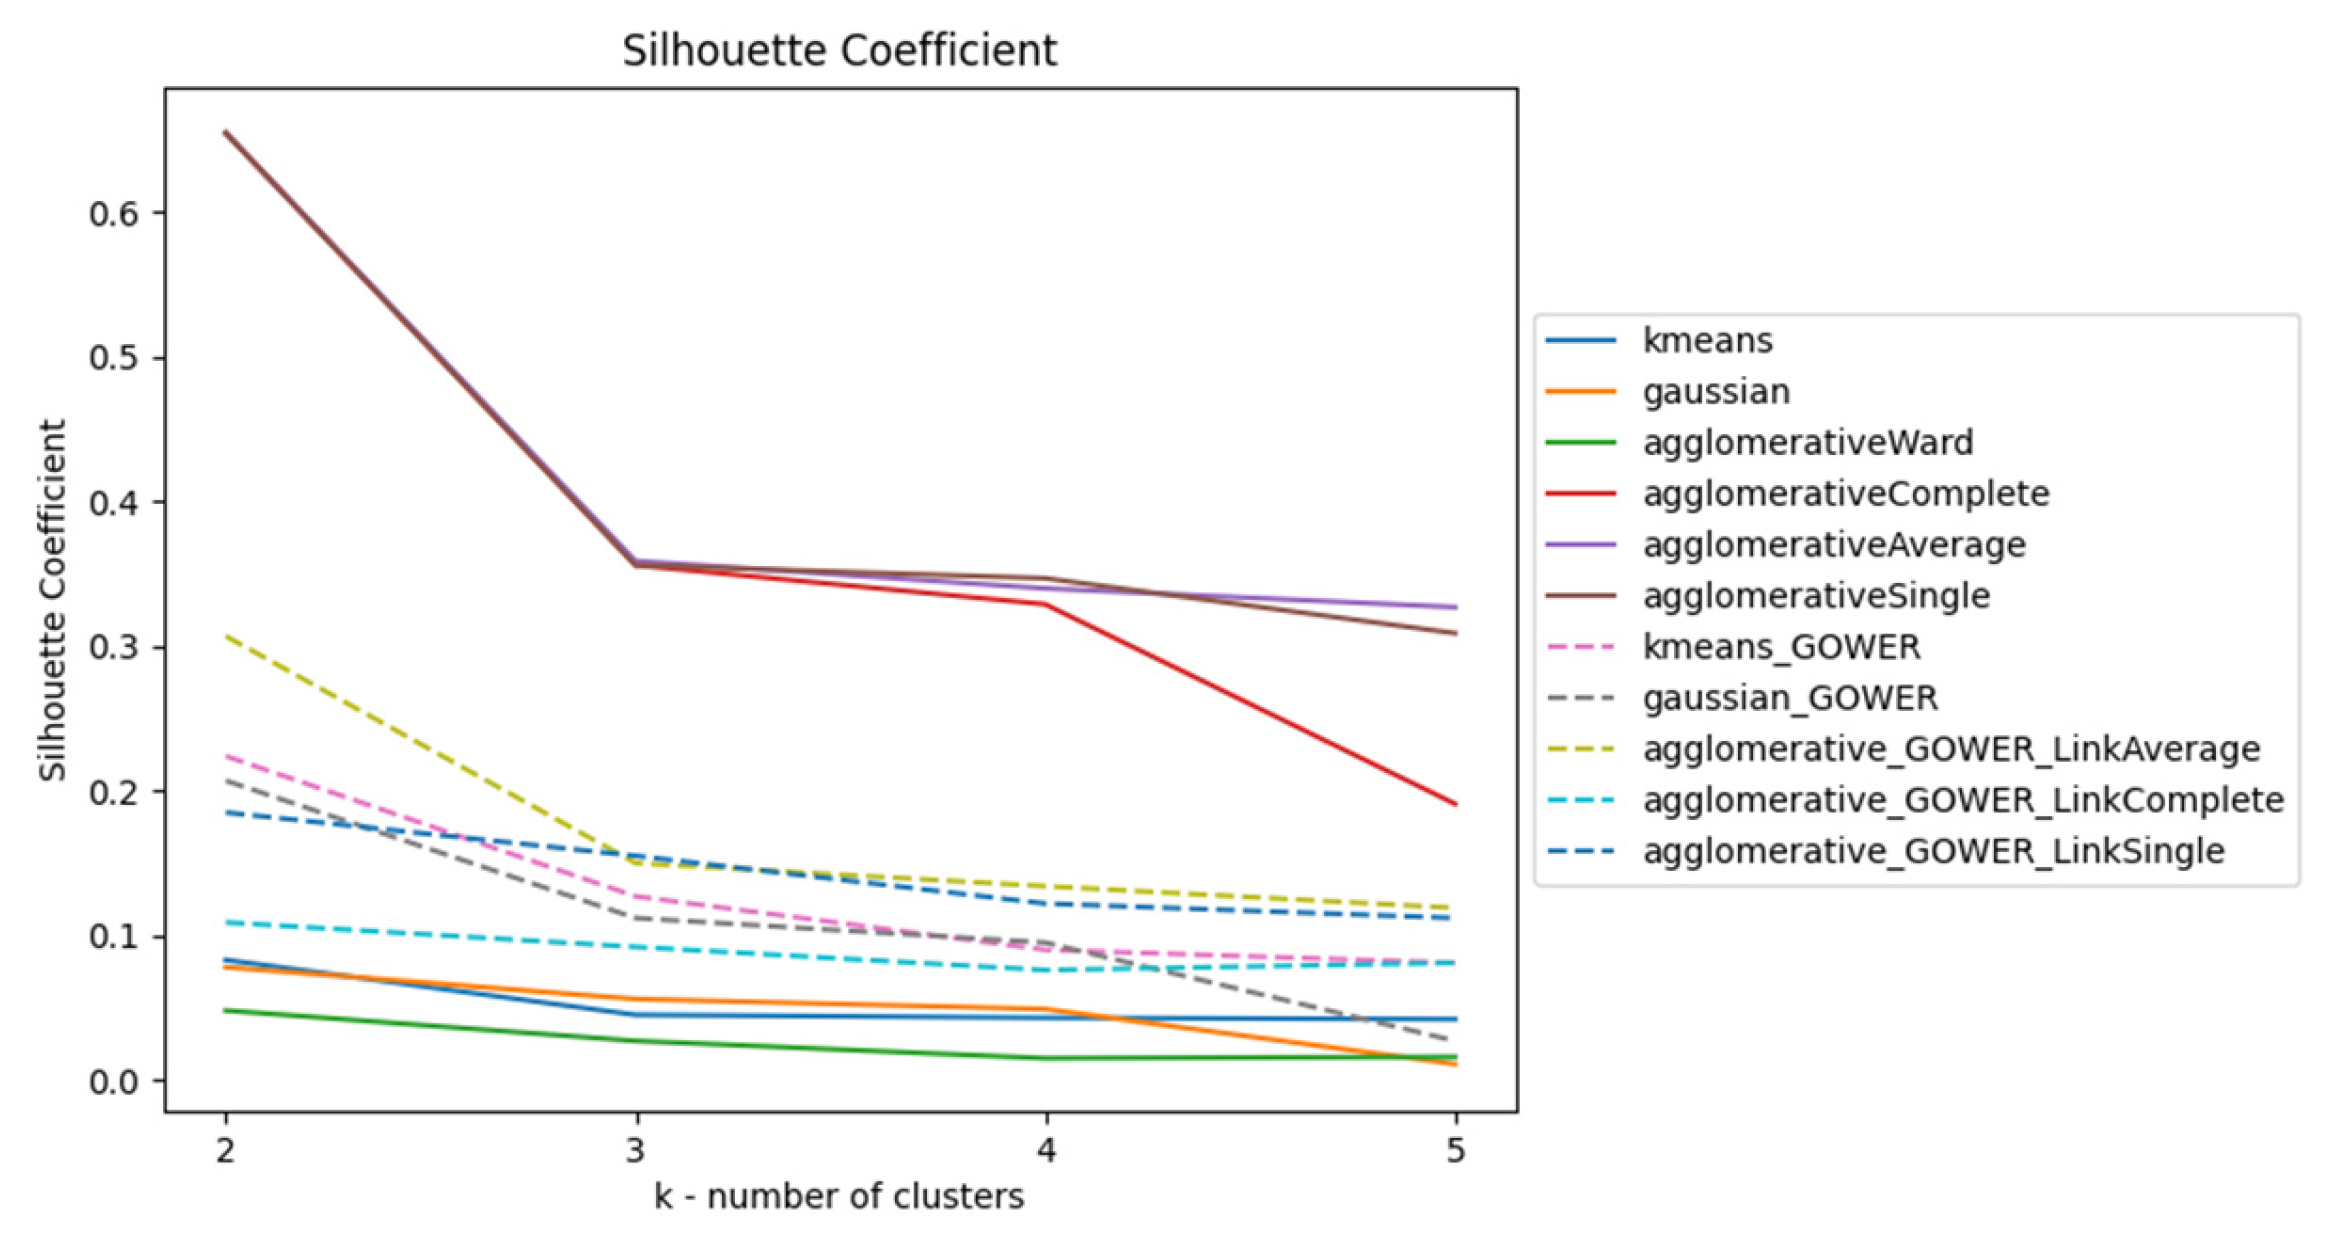
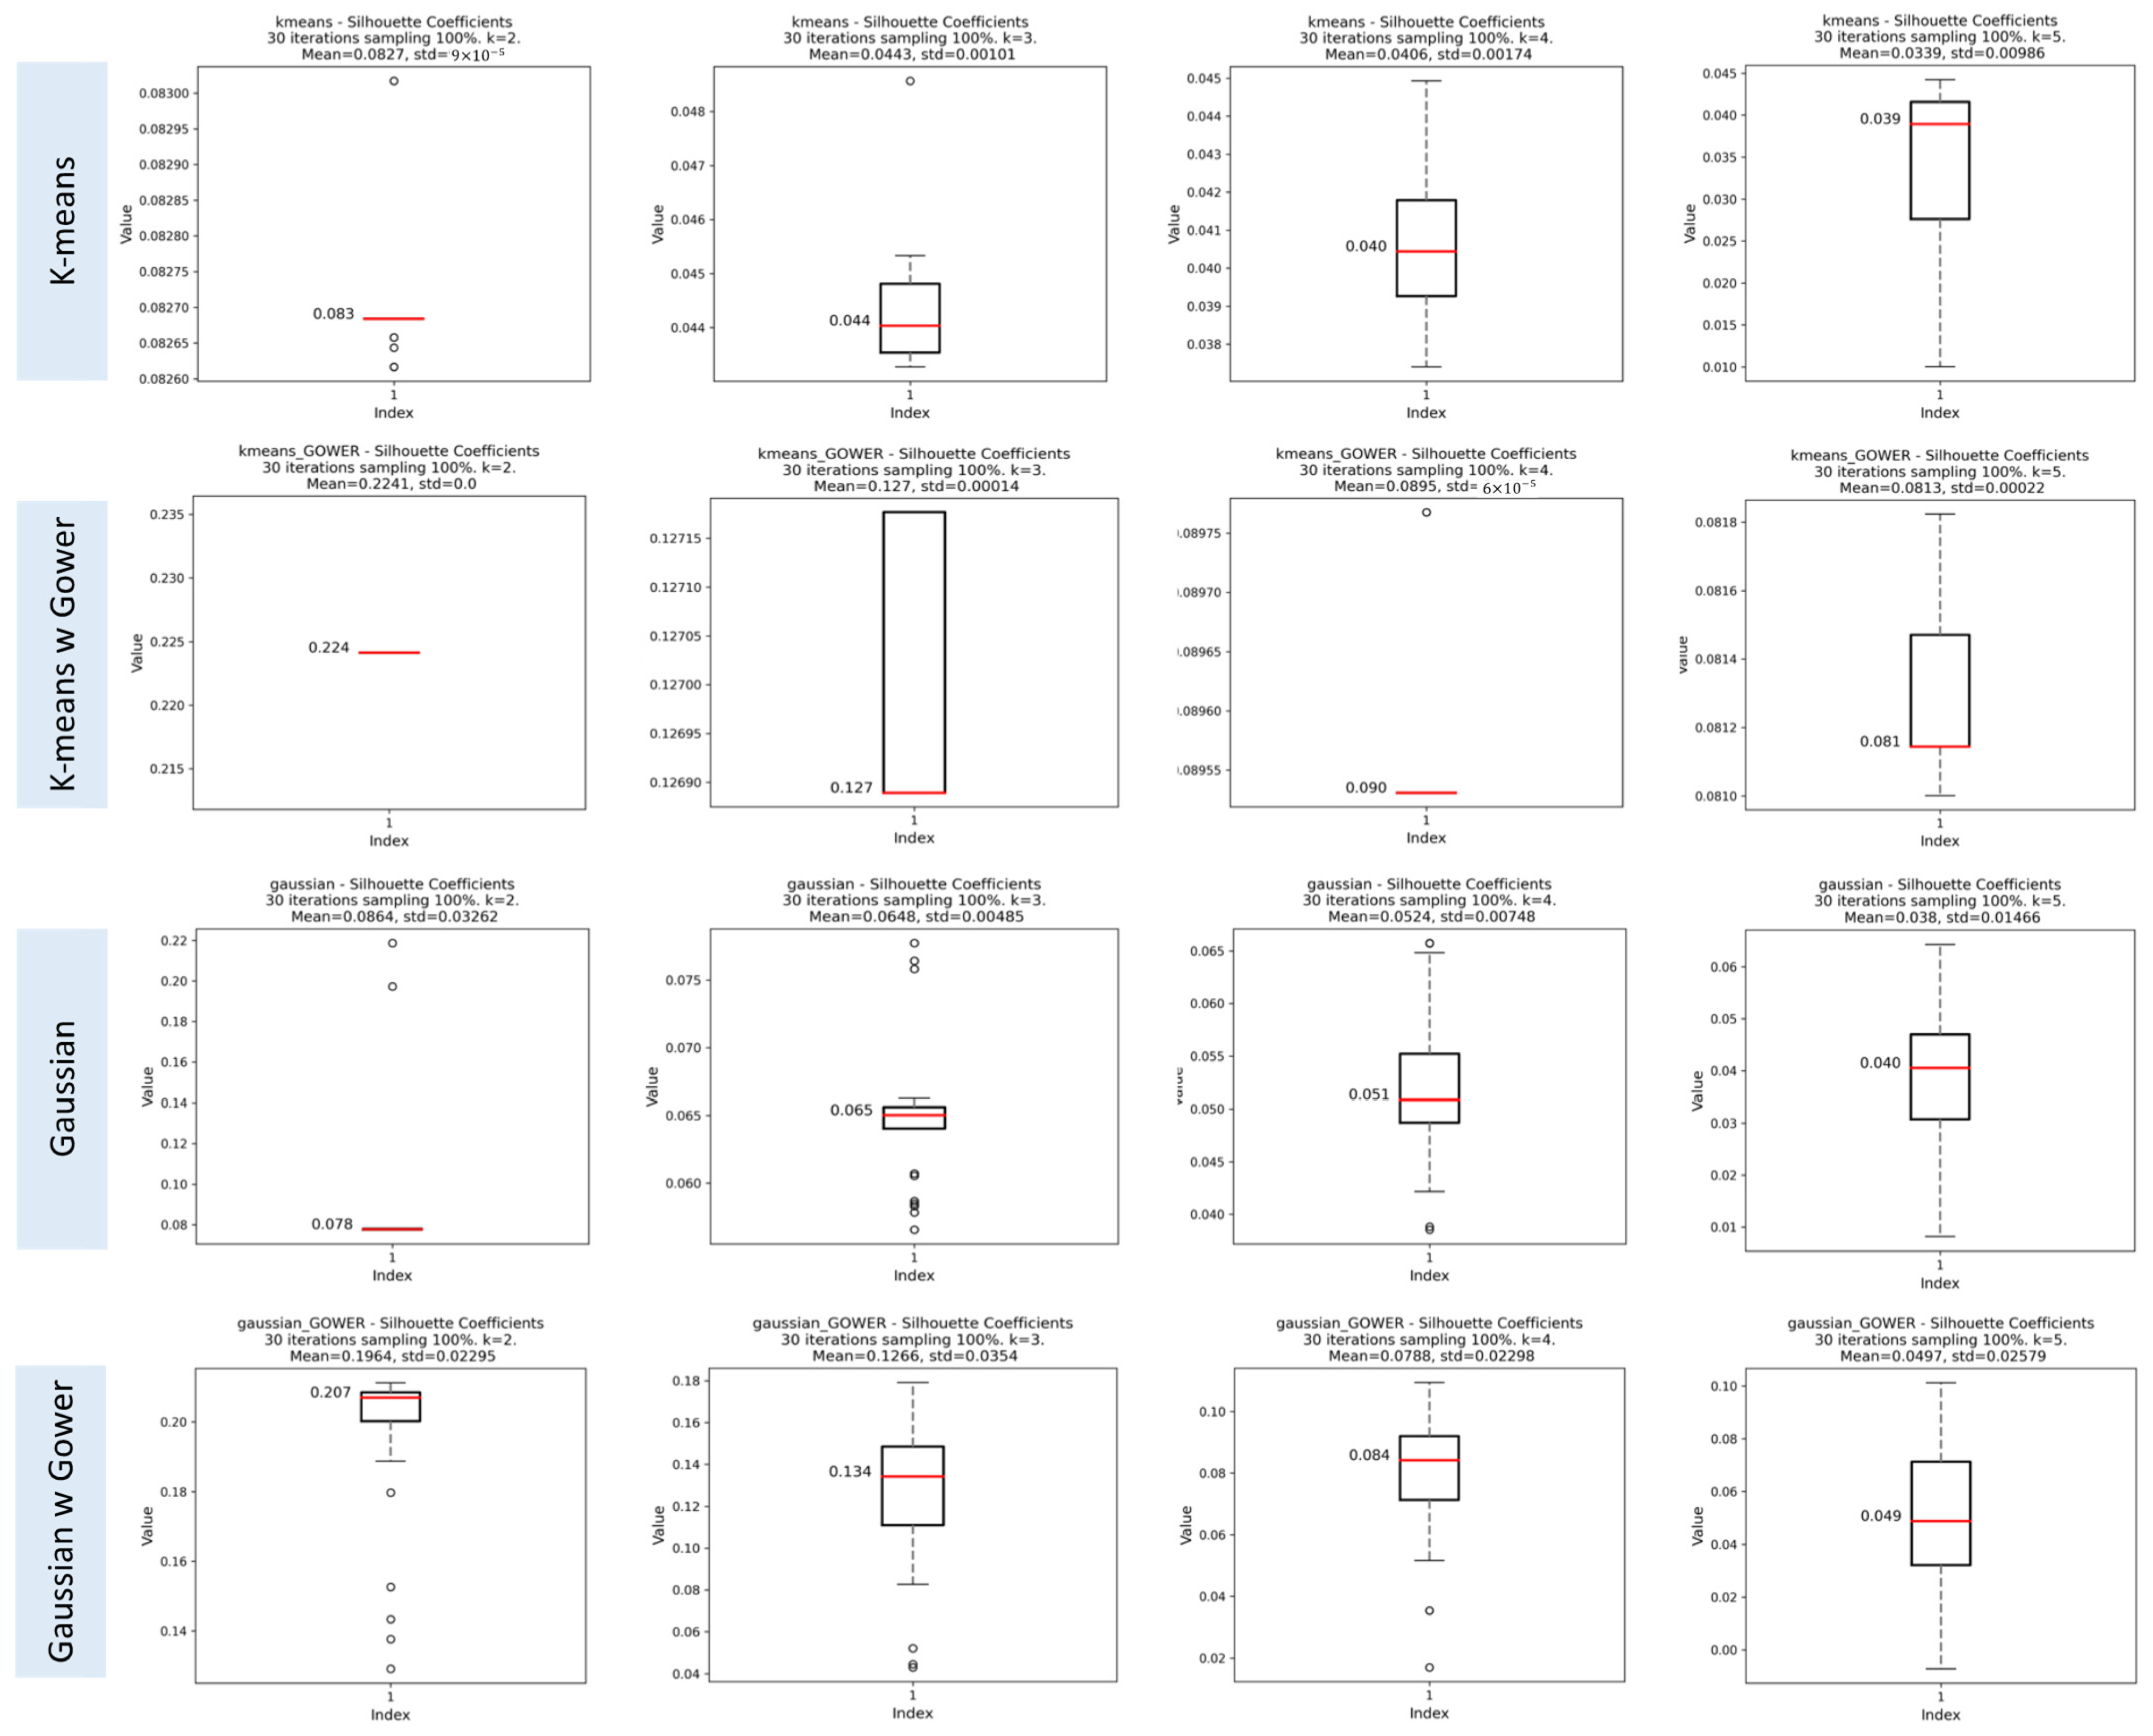
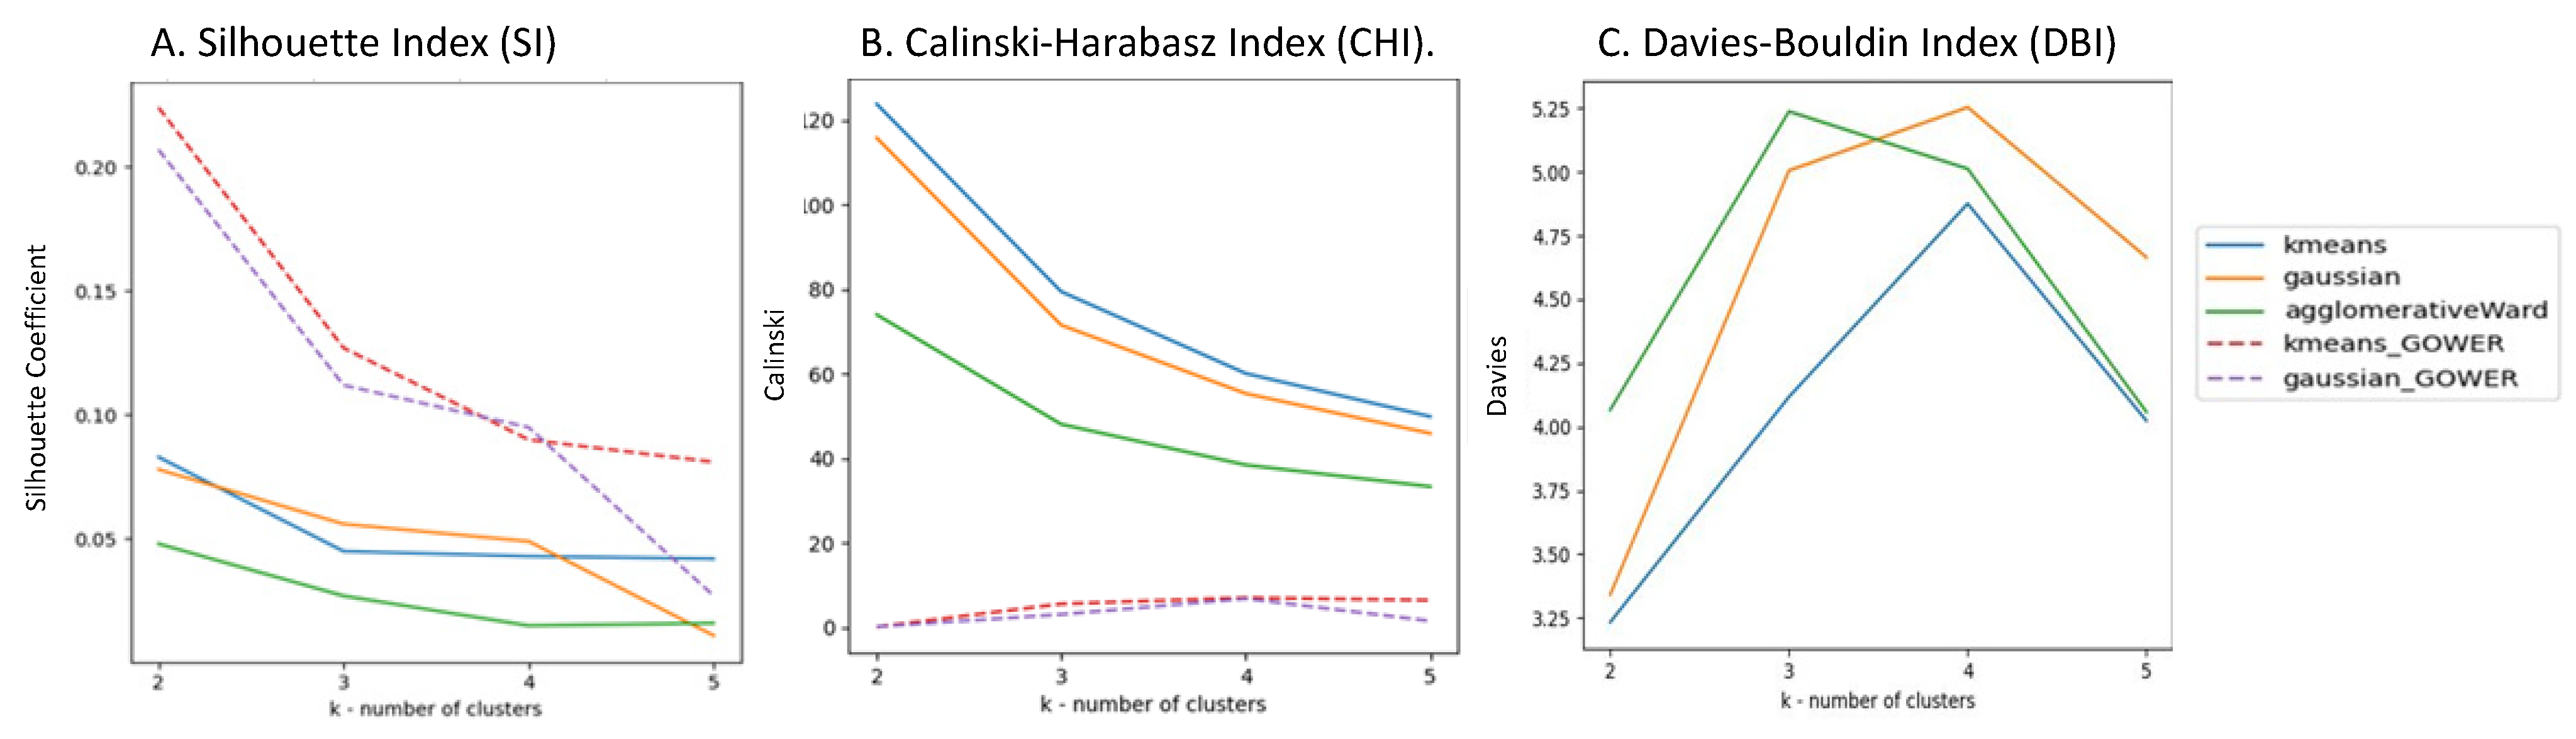
Silhouette Index (SI)
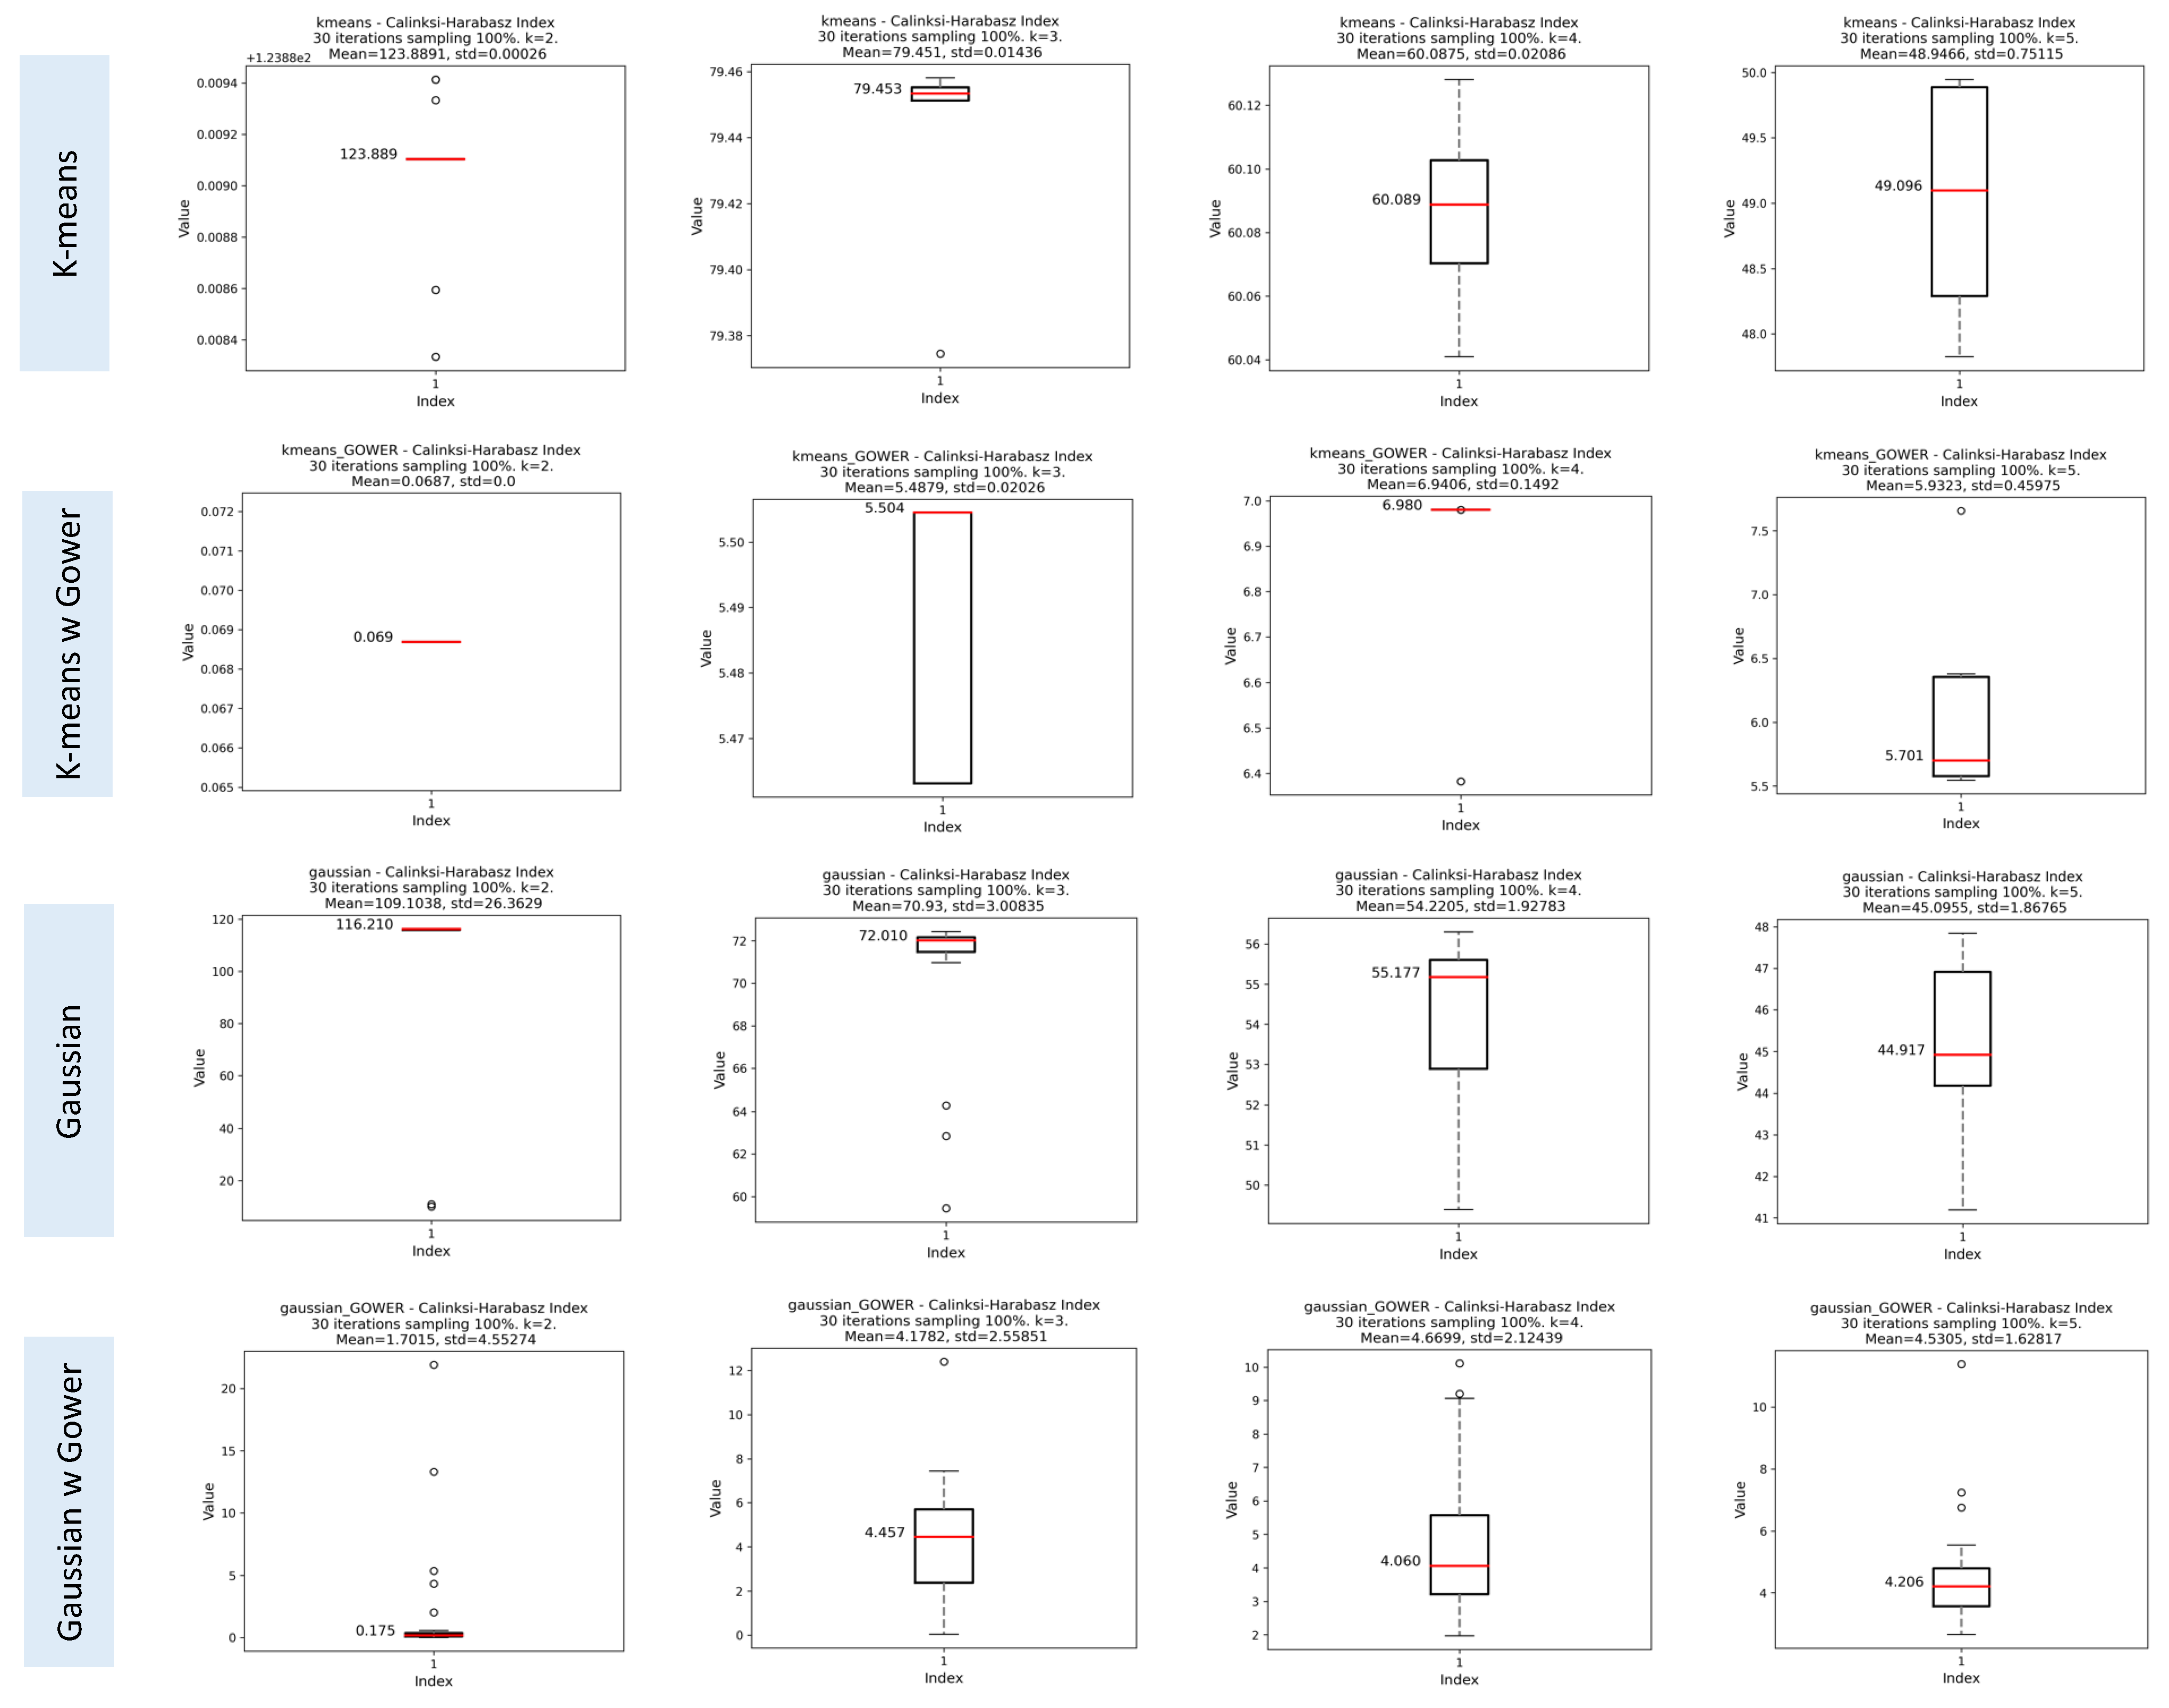
Calinski–Harabasz Index (CHI)
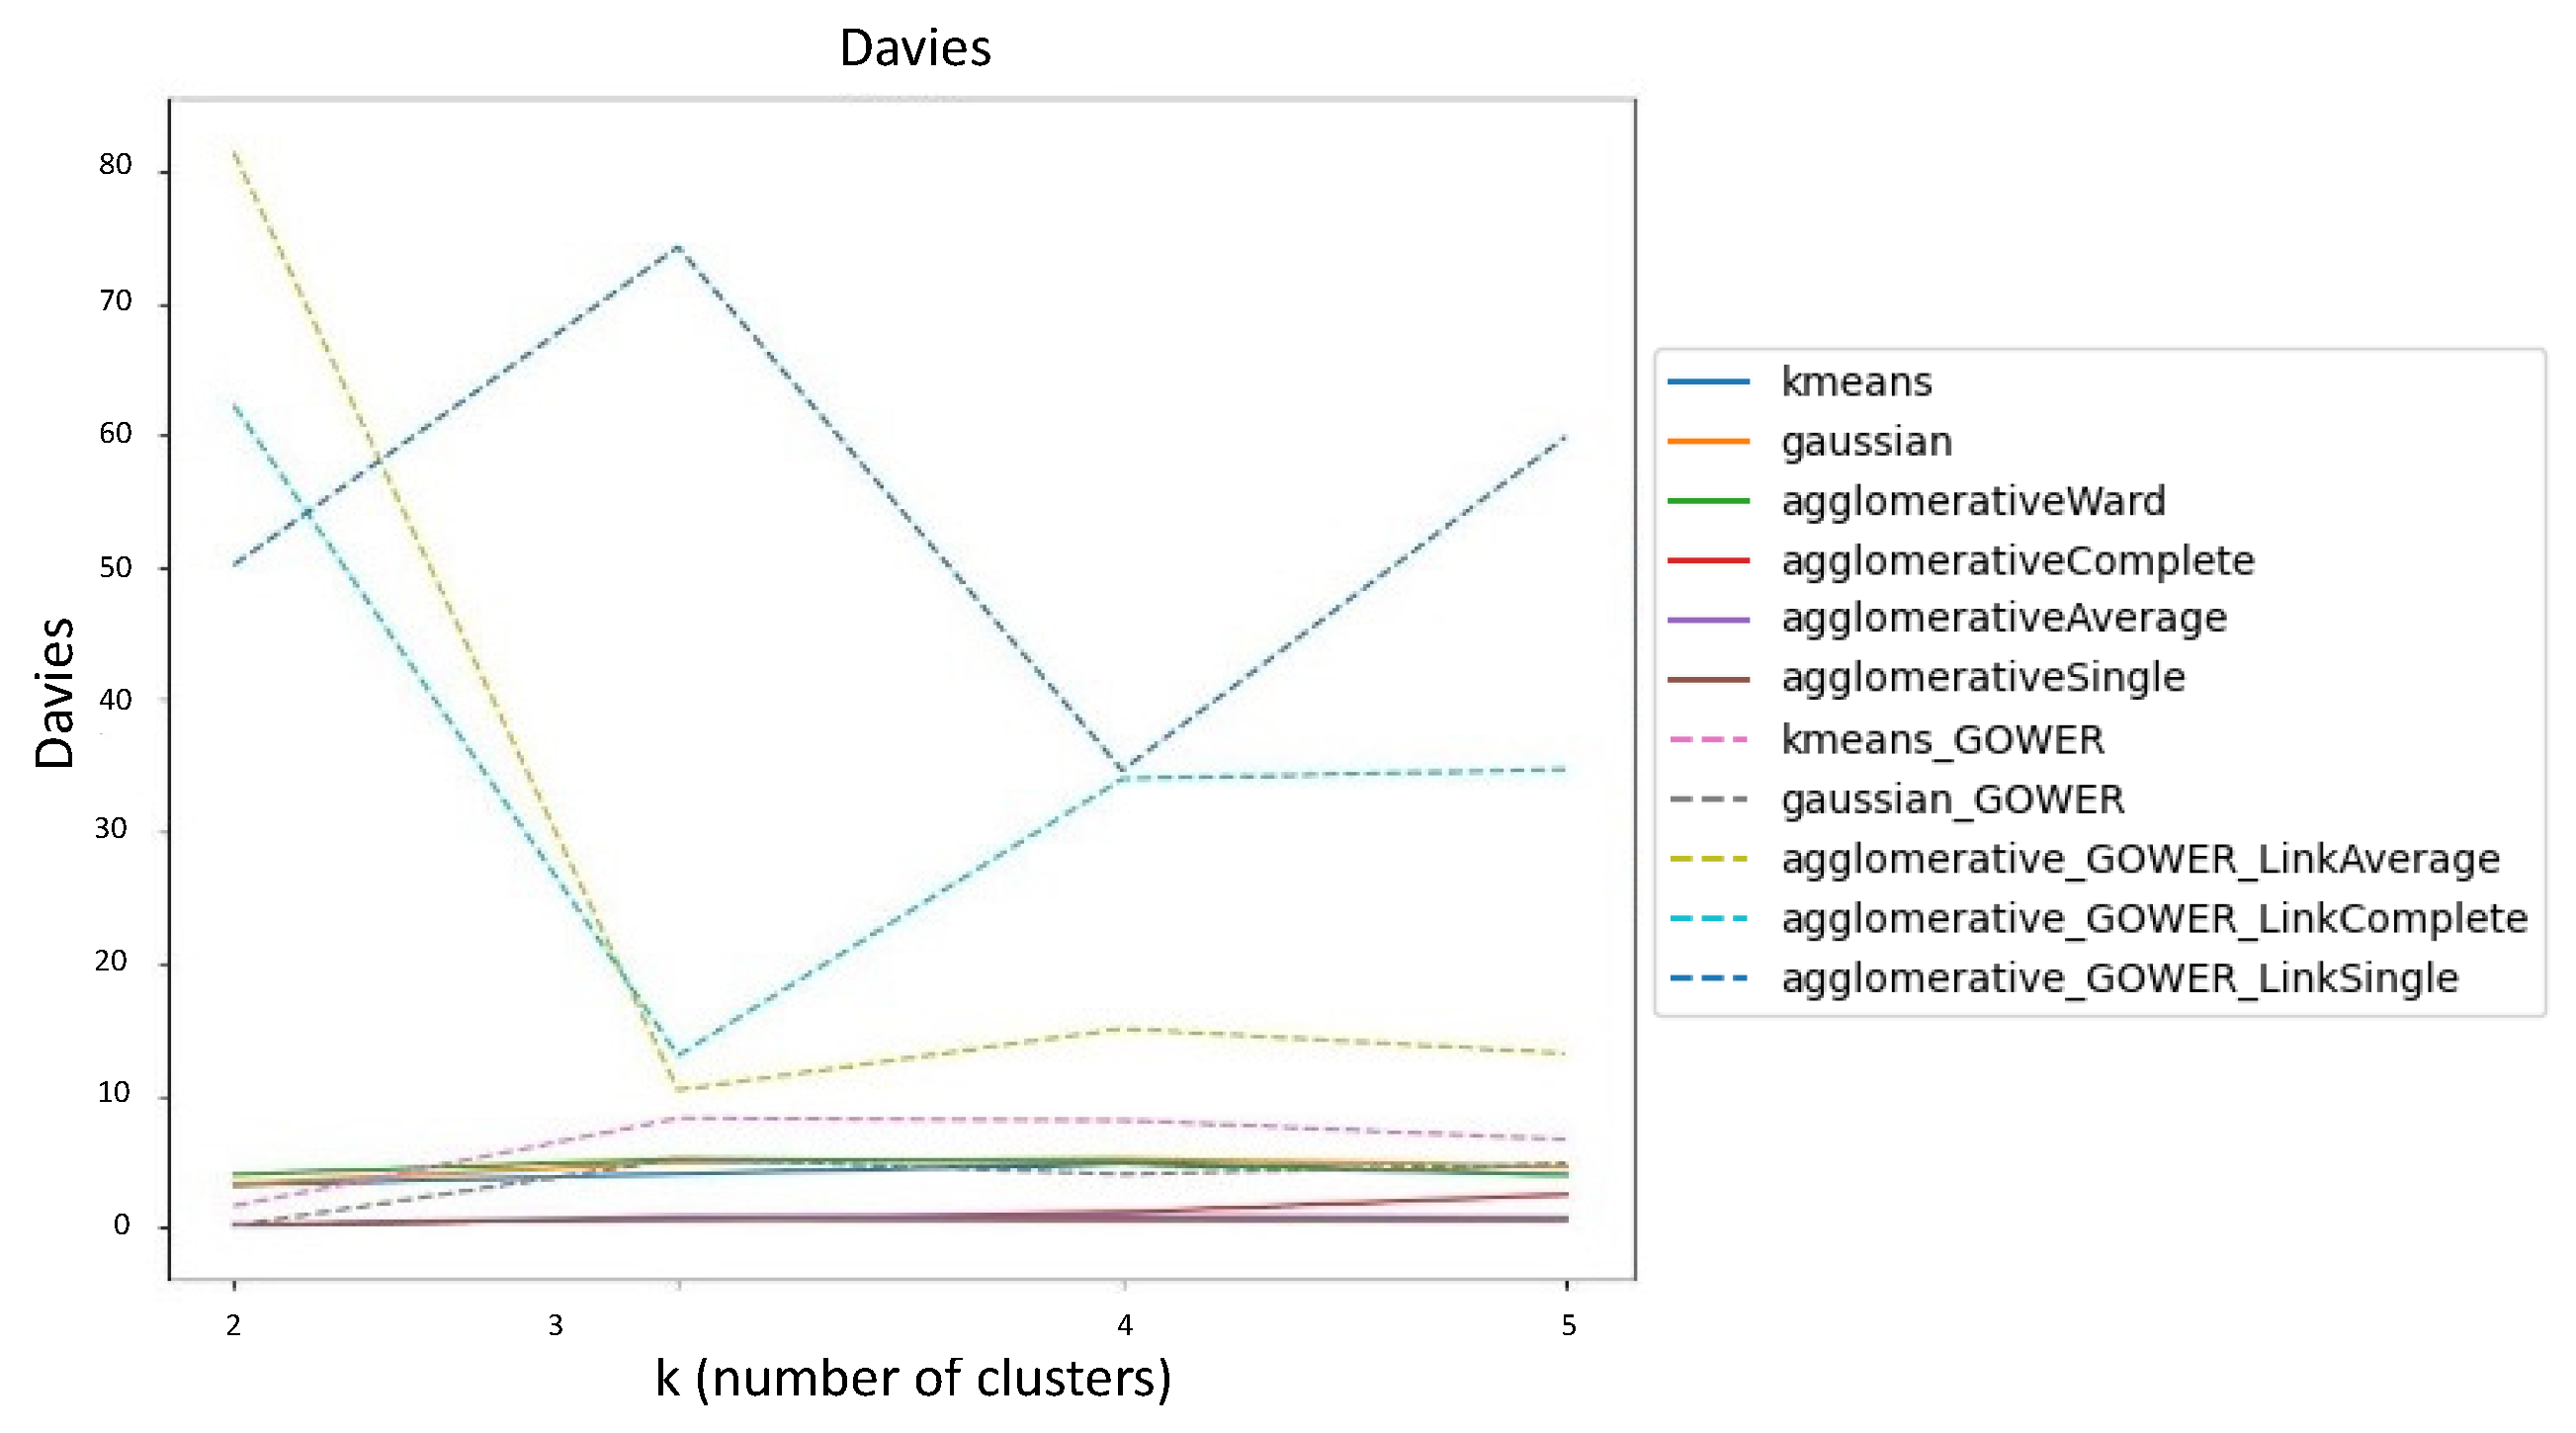
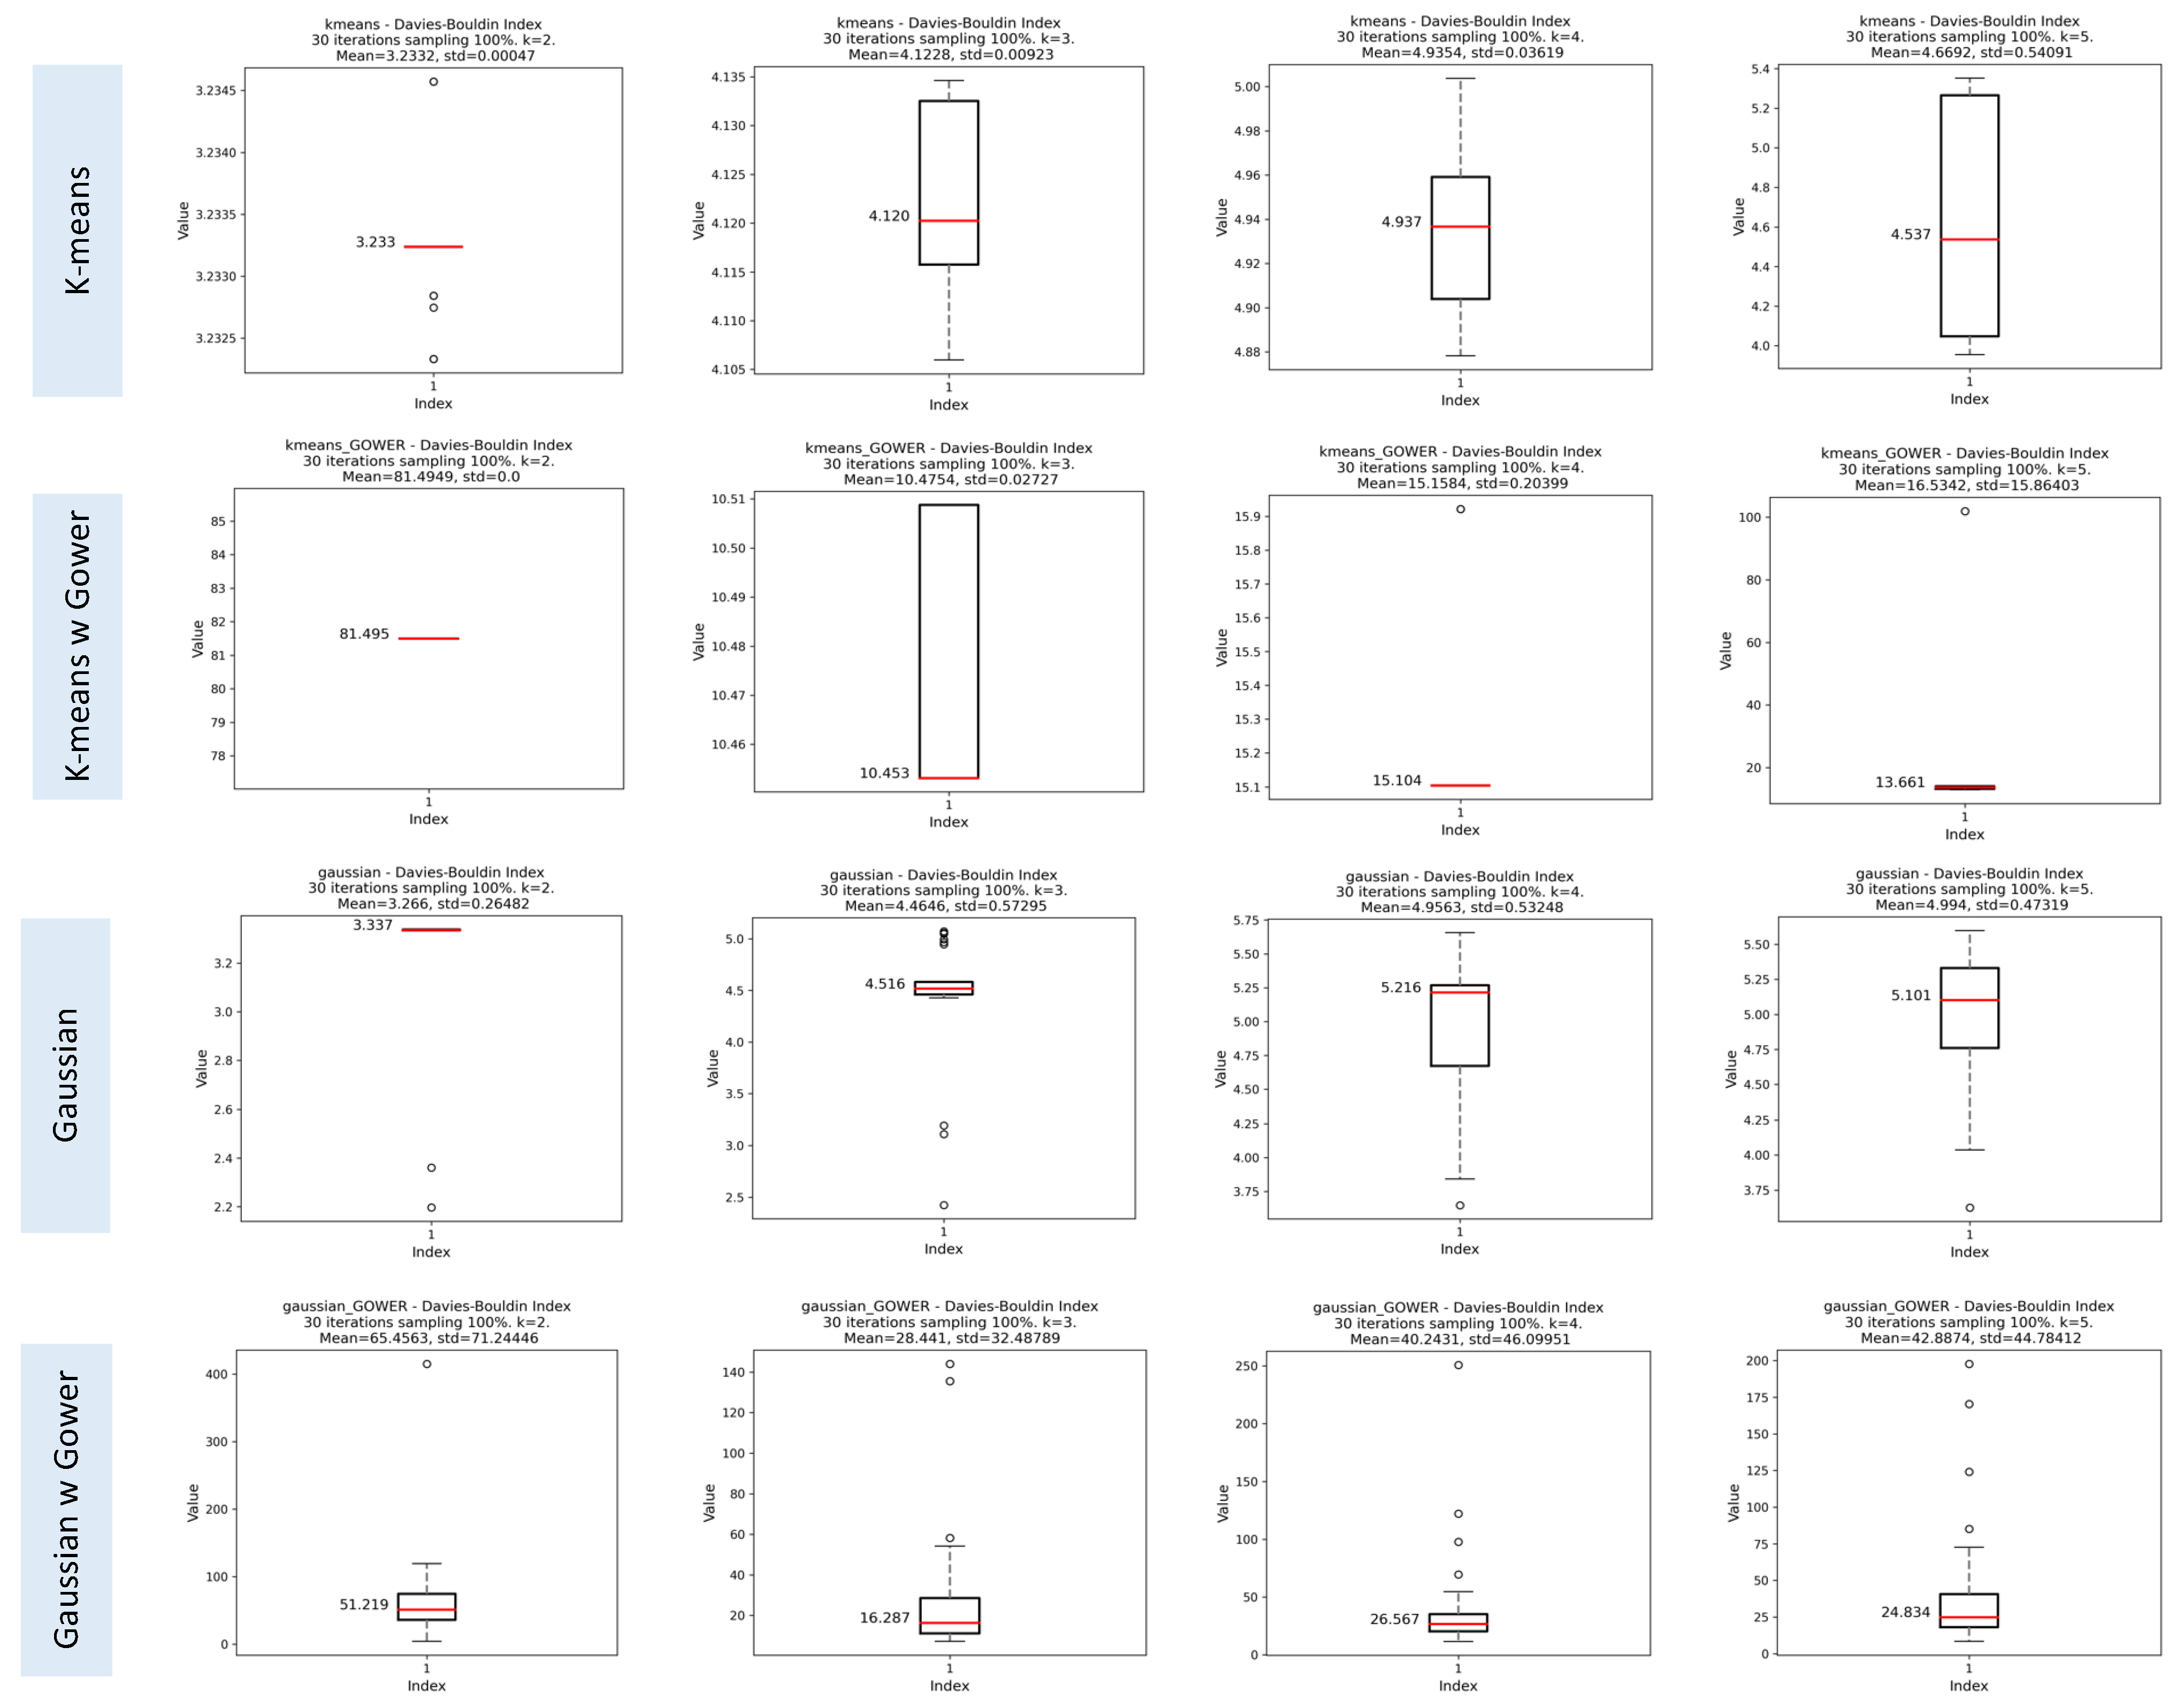
Davies-Bouldin Index (DBI)
3.1.3. Results of the Iterative Phase
Assessment of Clustering Algorithms’ Sensitivity to Initial Seeds
Evaluation of Cluster Consistency Using Random Subsets of 70% of the Data
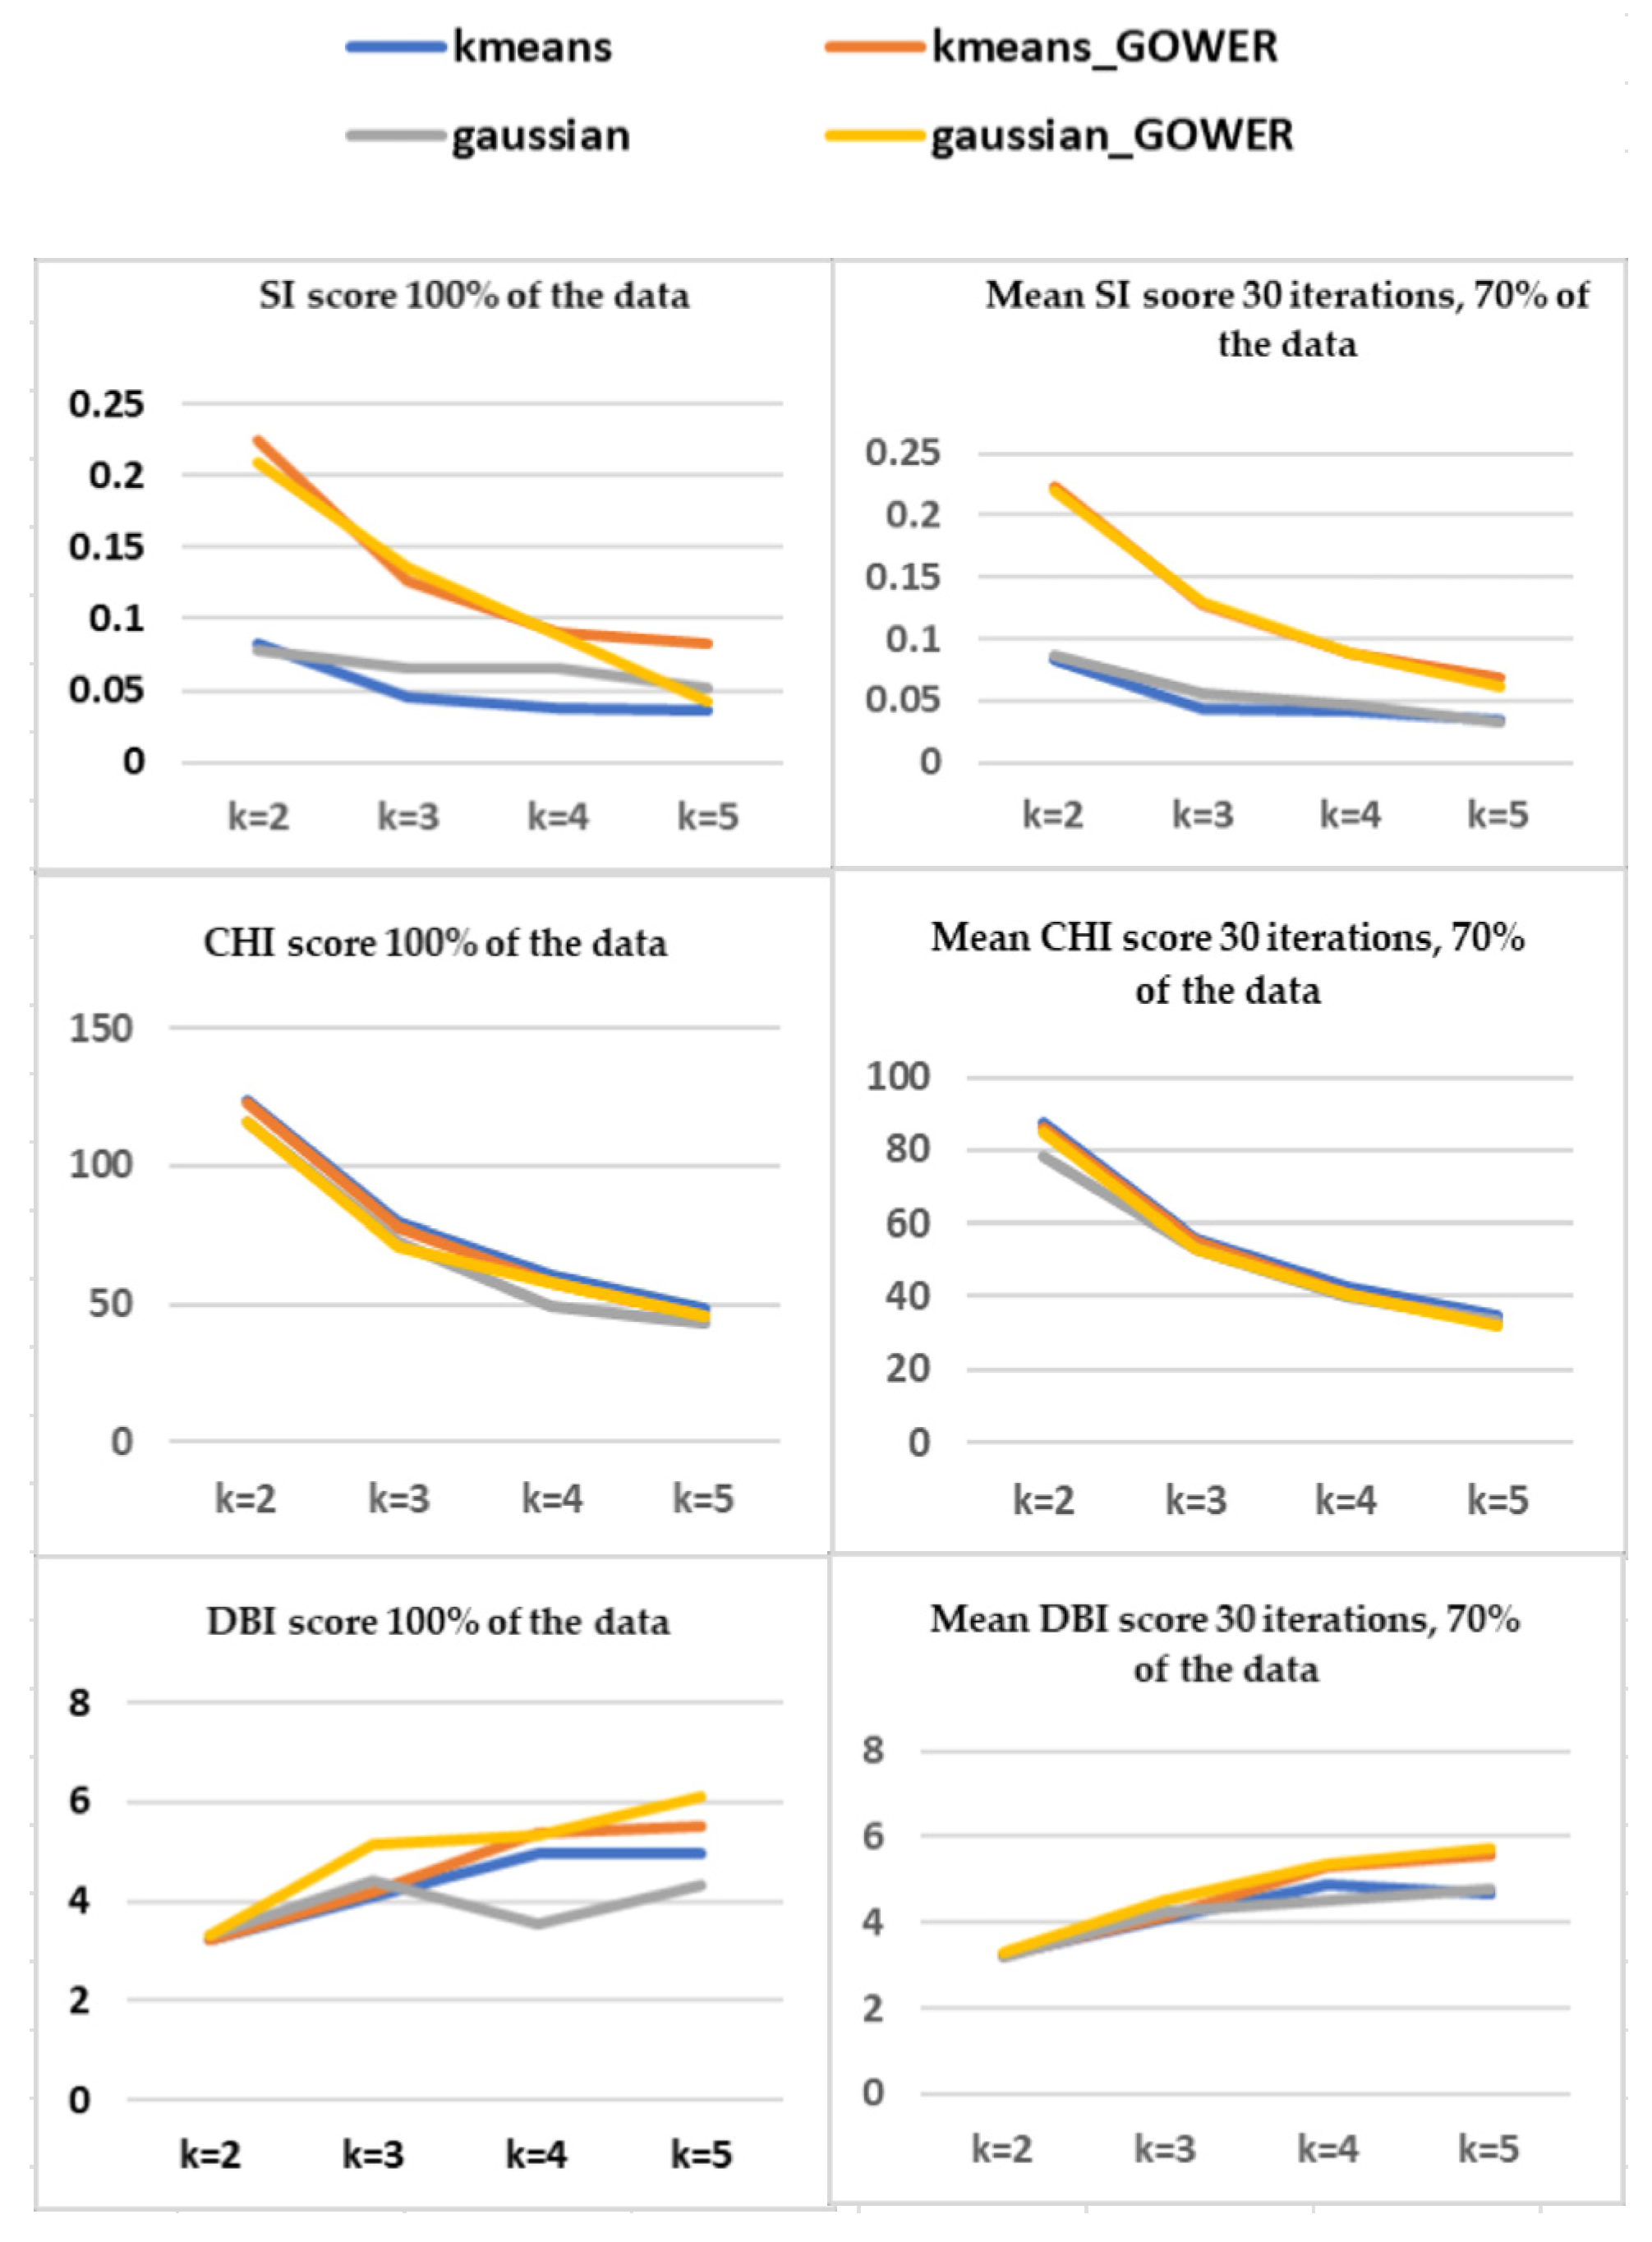
Comparison of SI, CHI, and DBI Scores using 100% and 70% of Data
Assessing Consistency within and between Clustering Methods Using the Adjusted Rand Index (ARI)
3.2. Results of the SSV Phase
3.2.1. The Semantic Phase
Semantic Assessment of Clustering Methods Using 70% of the Data
External Semantic Assessment Using Statistical and Clinical Evaluation of Selected Clusters
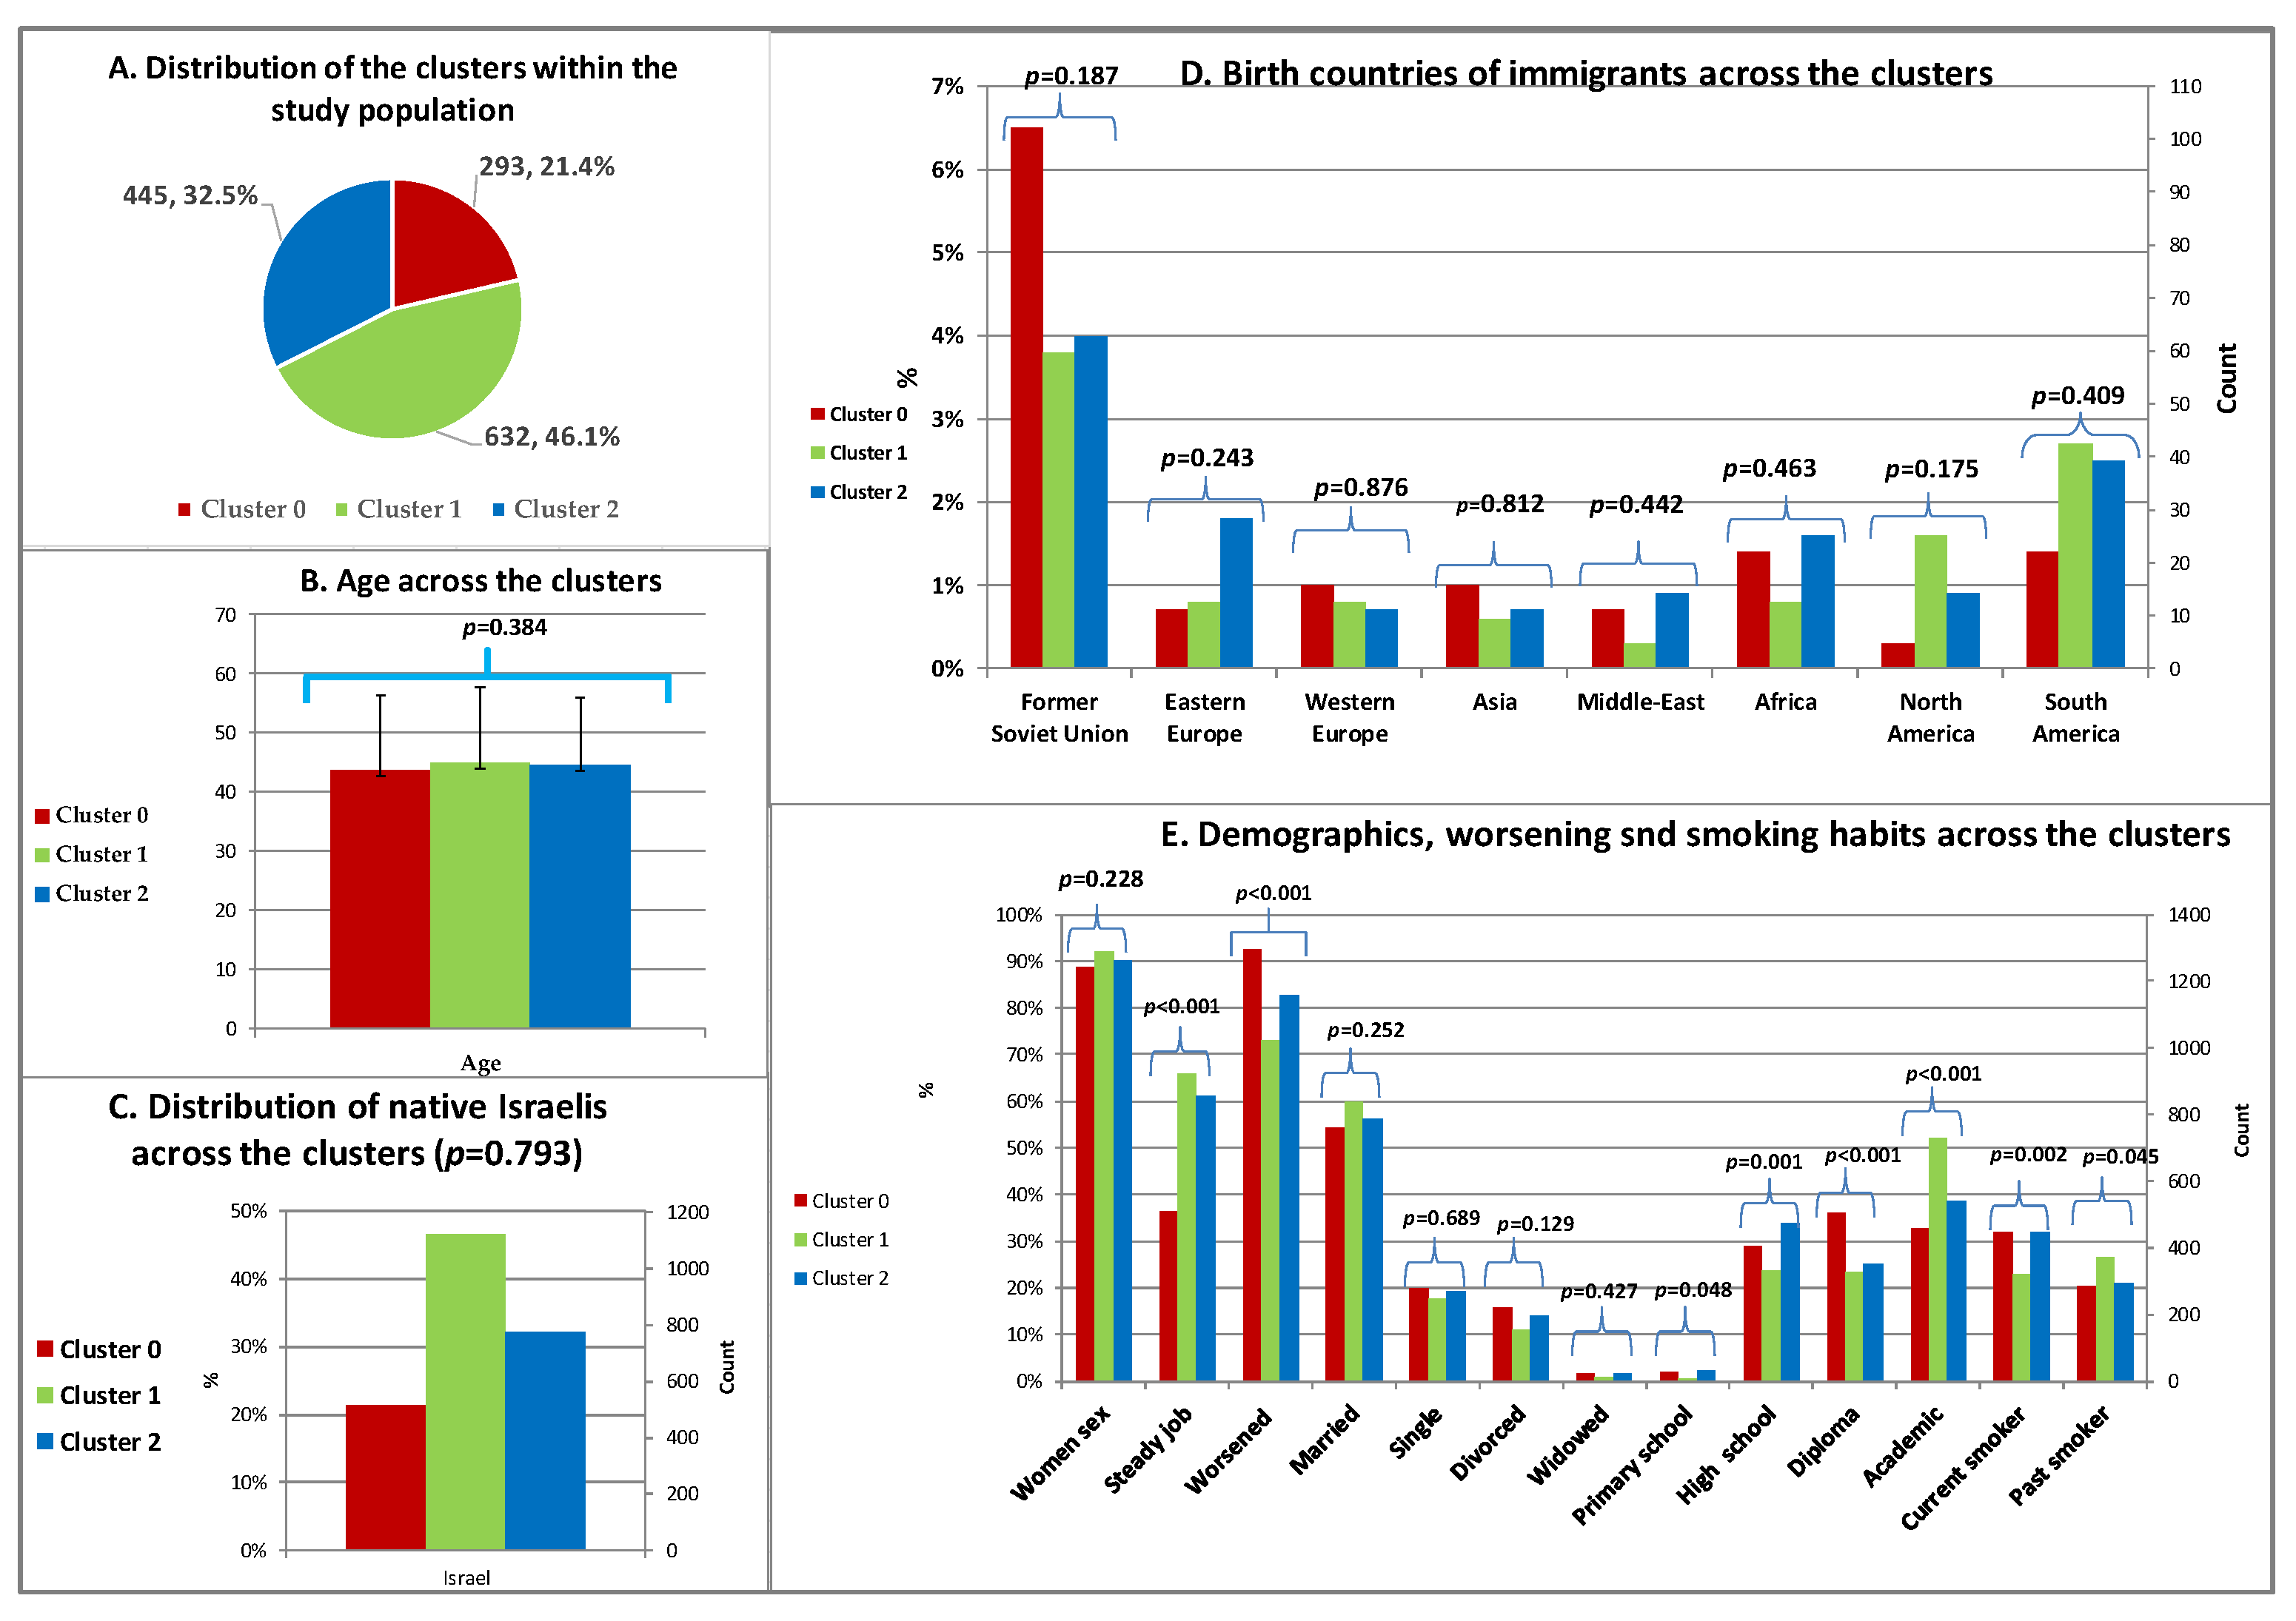
Demographics and Smoking Habits across the Clusters
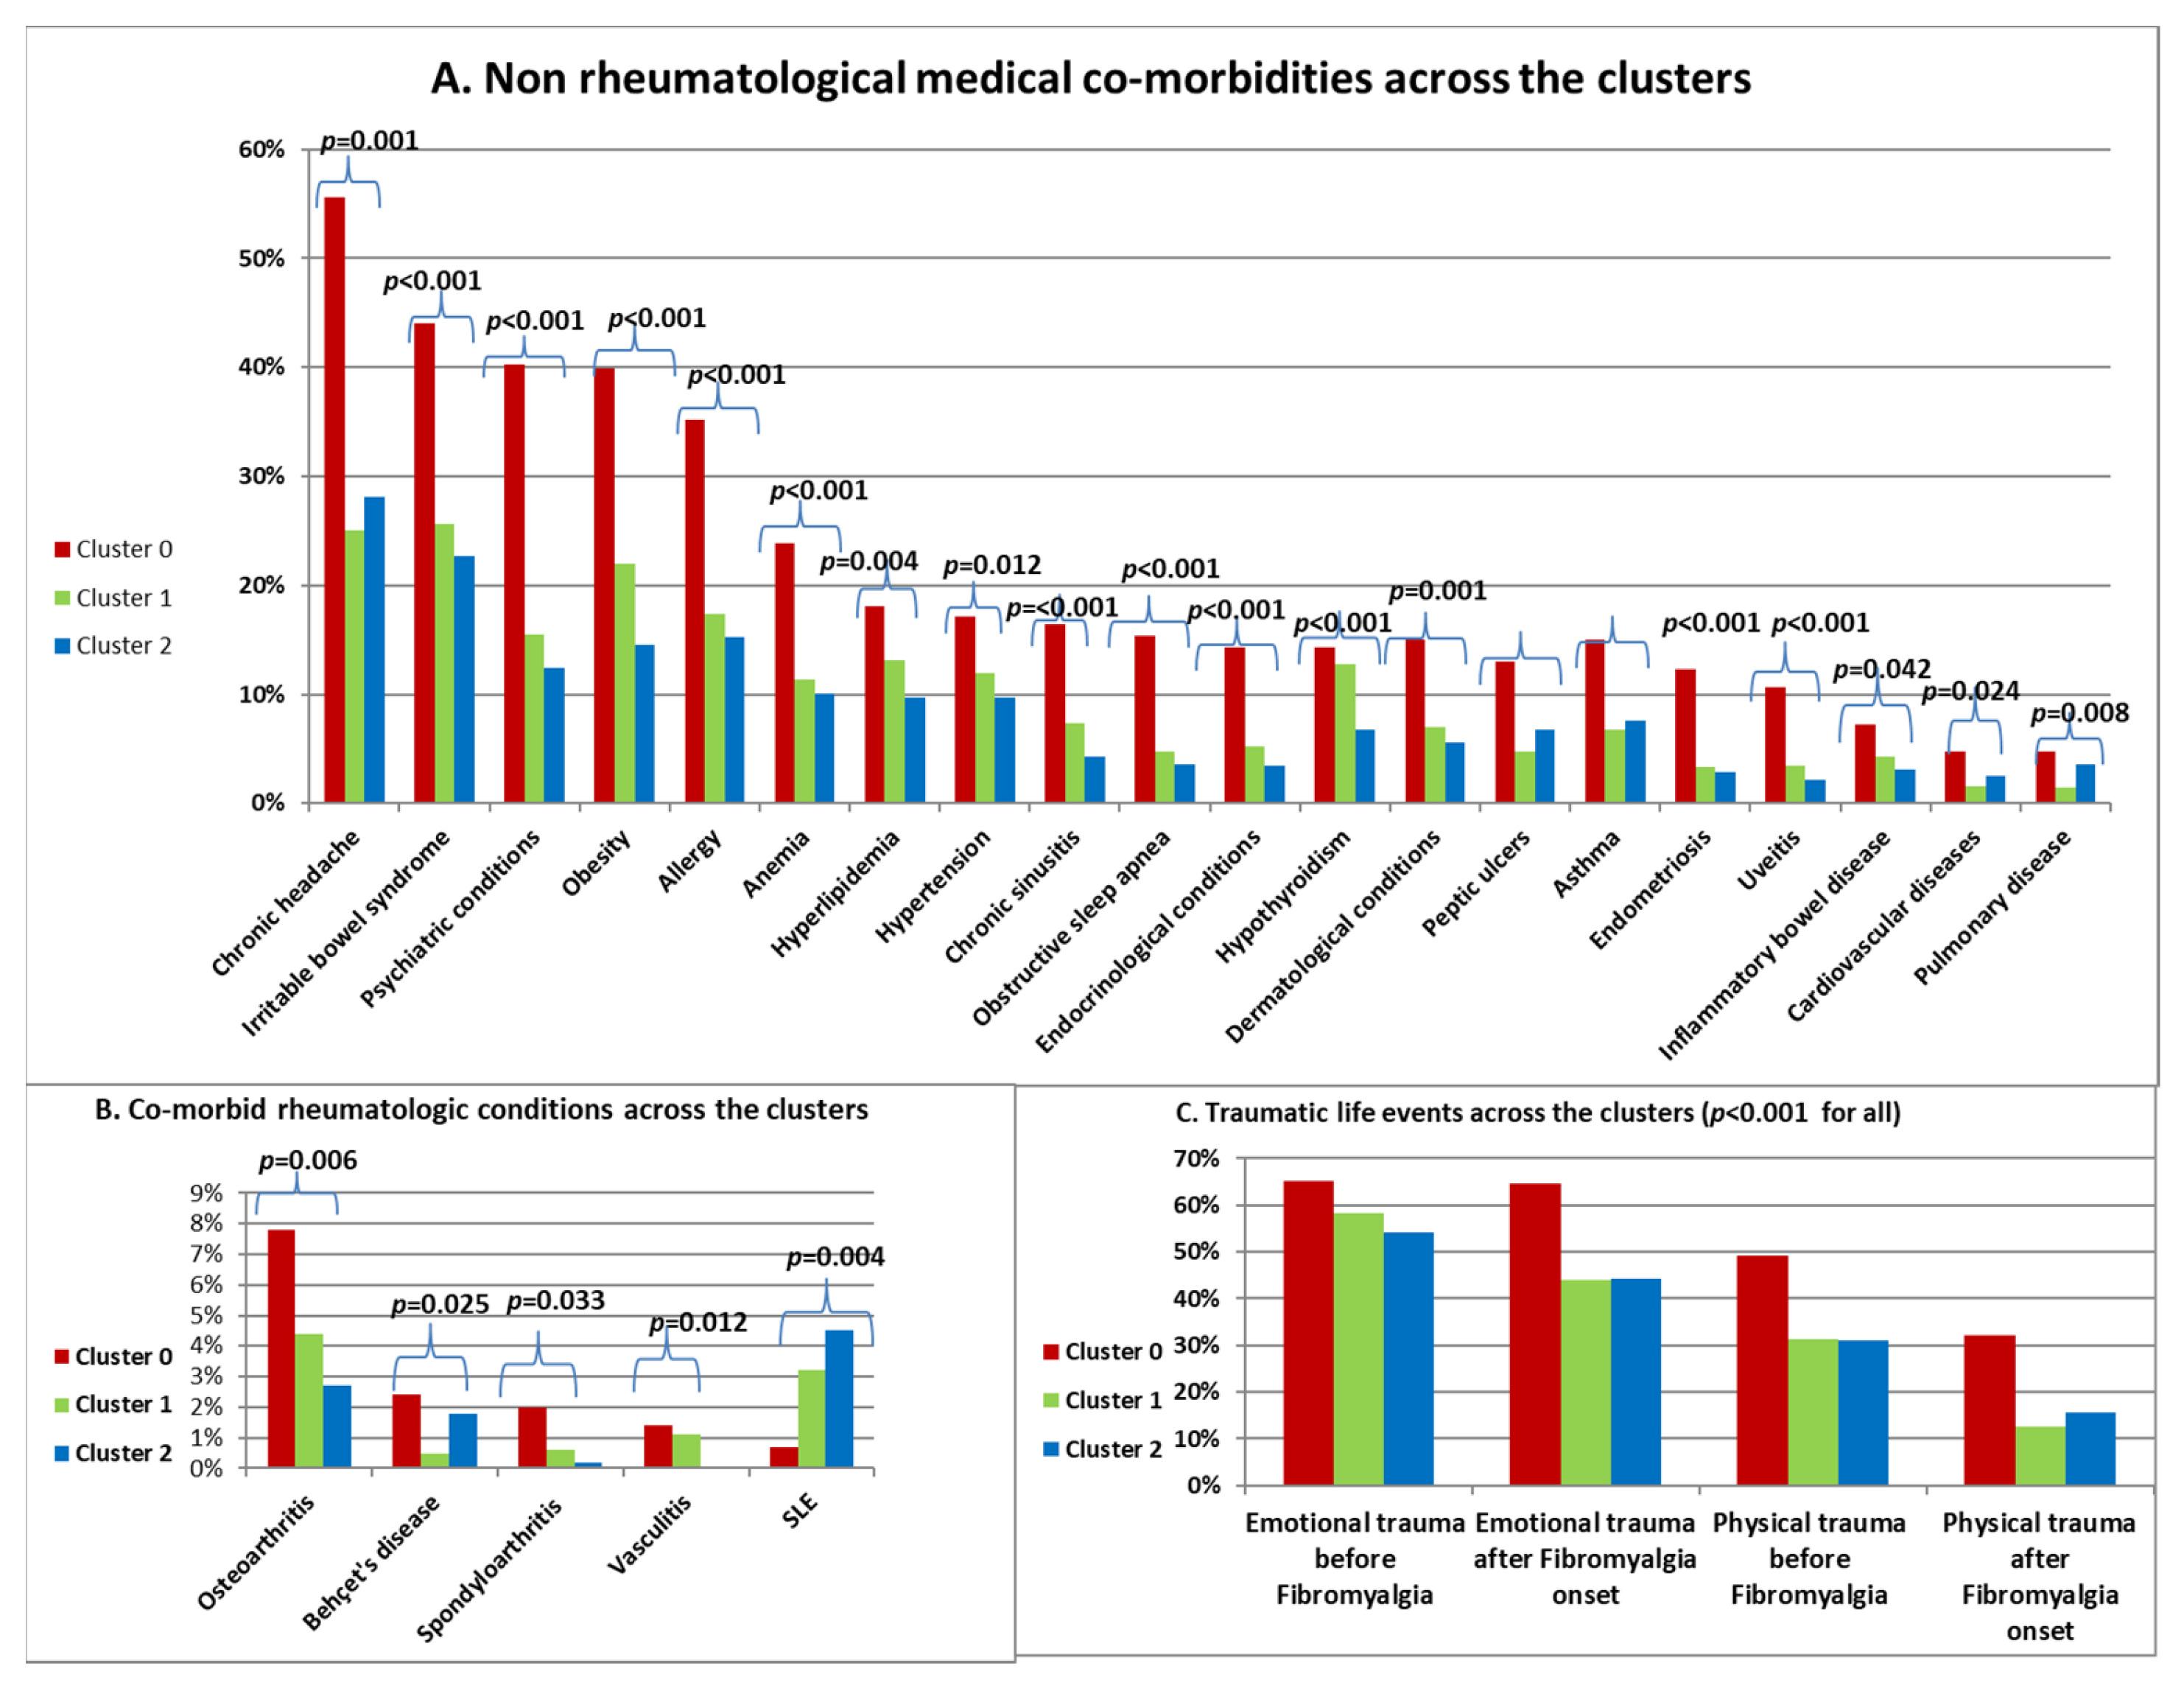
Comorbidities and History of Trauma across the Clusters
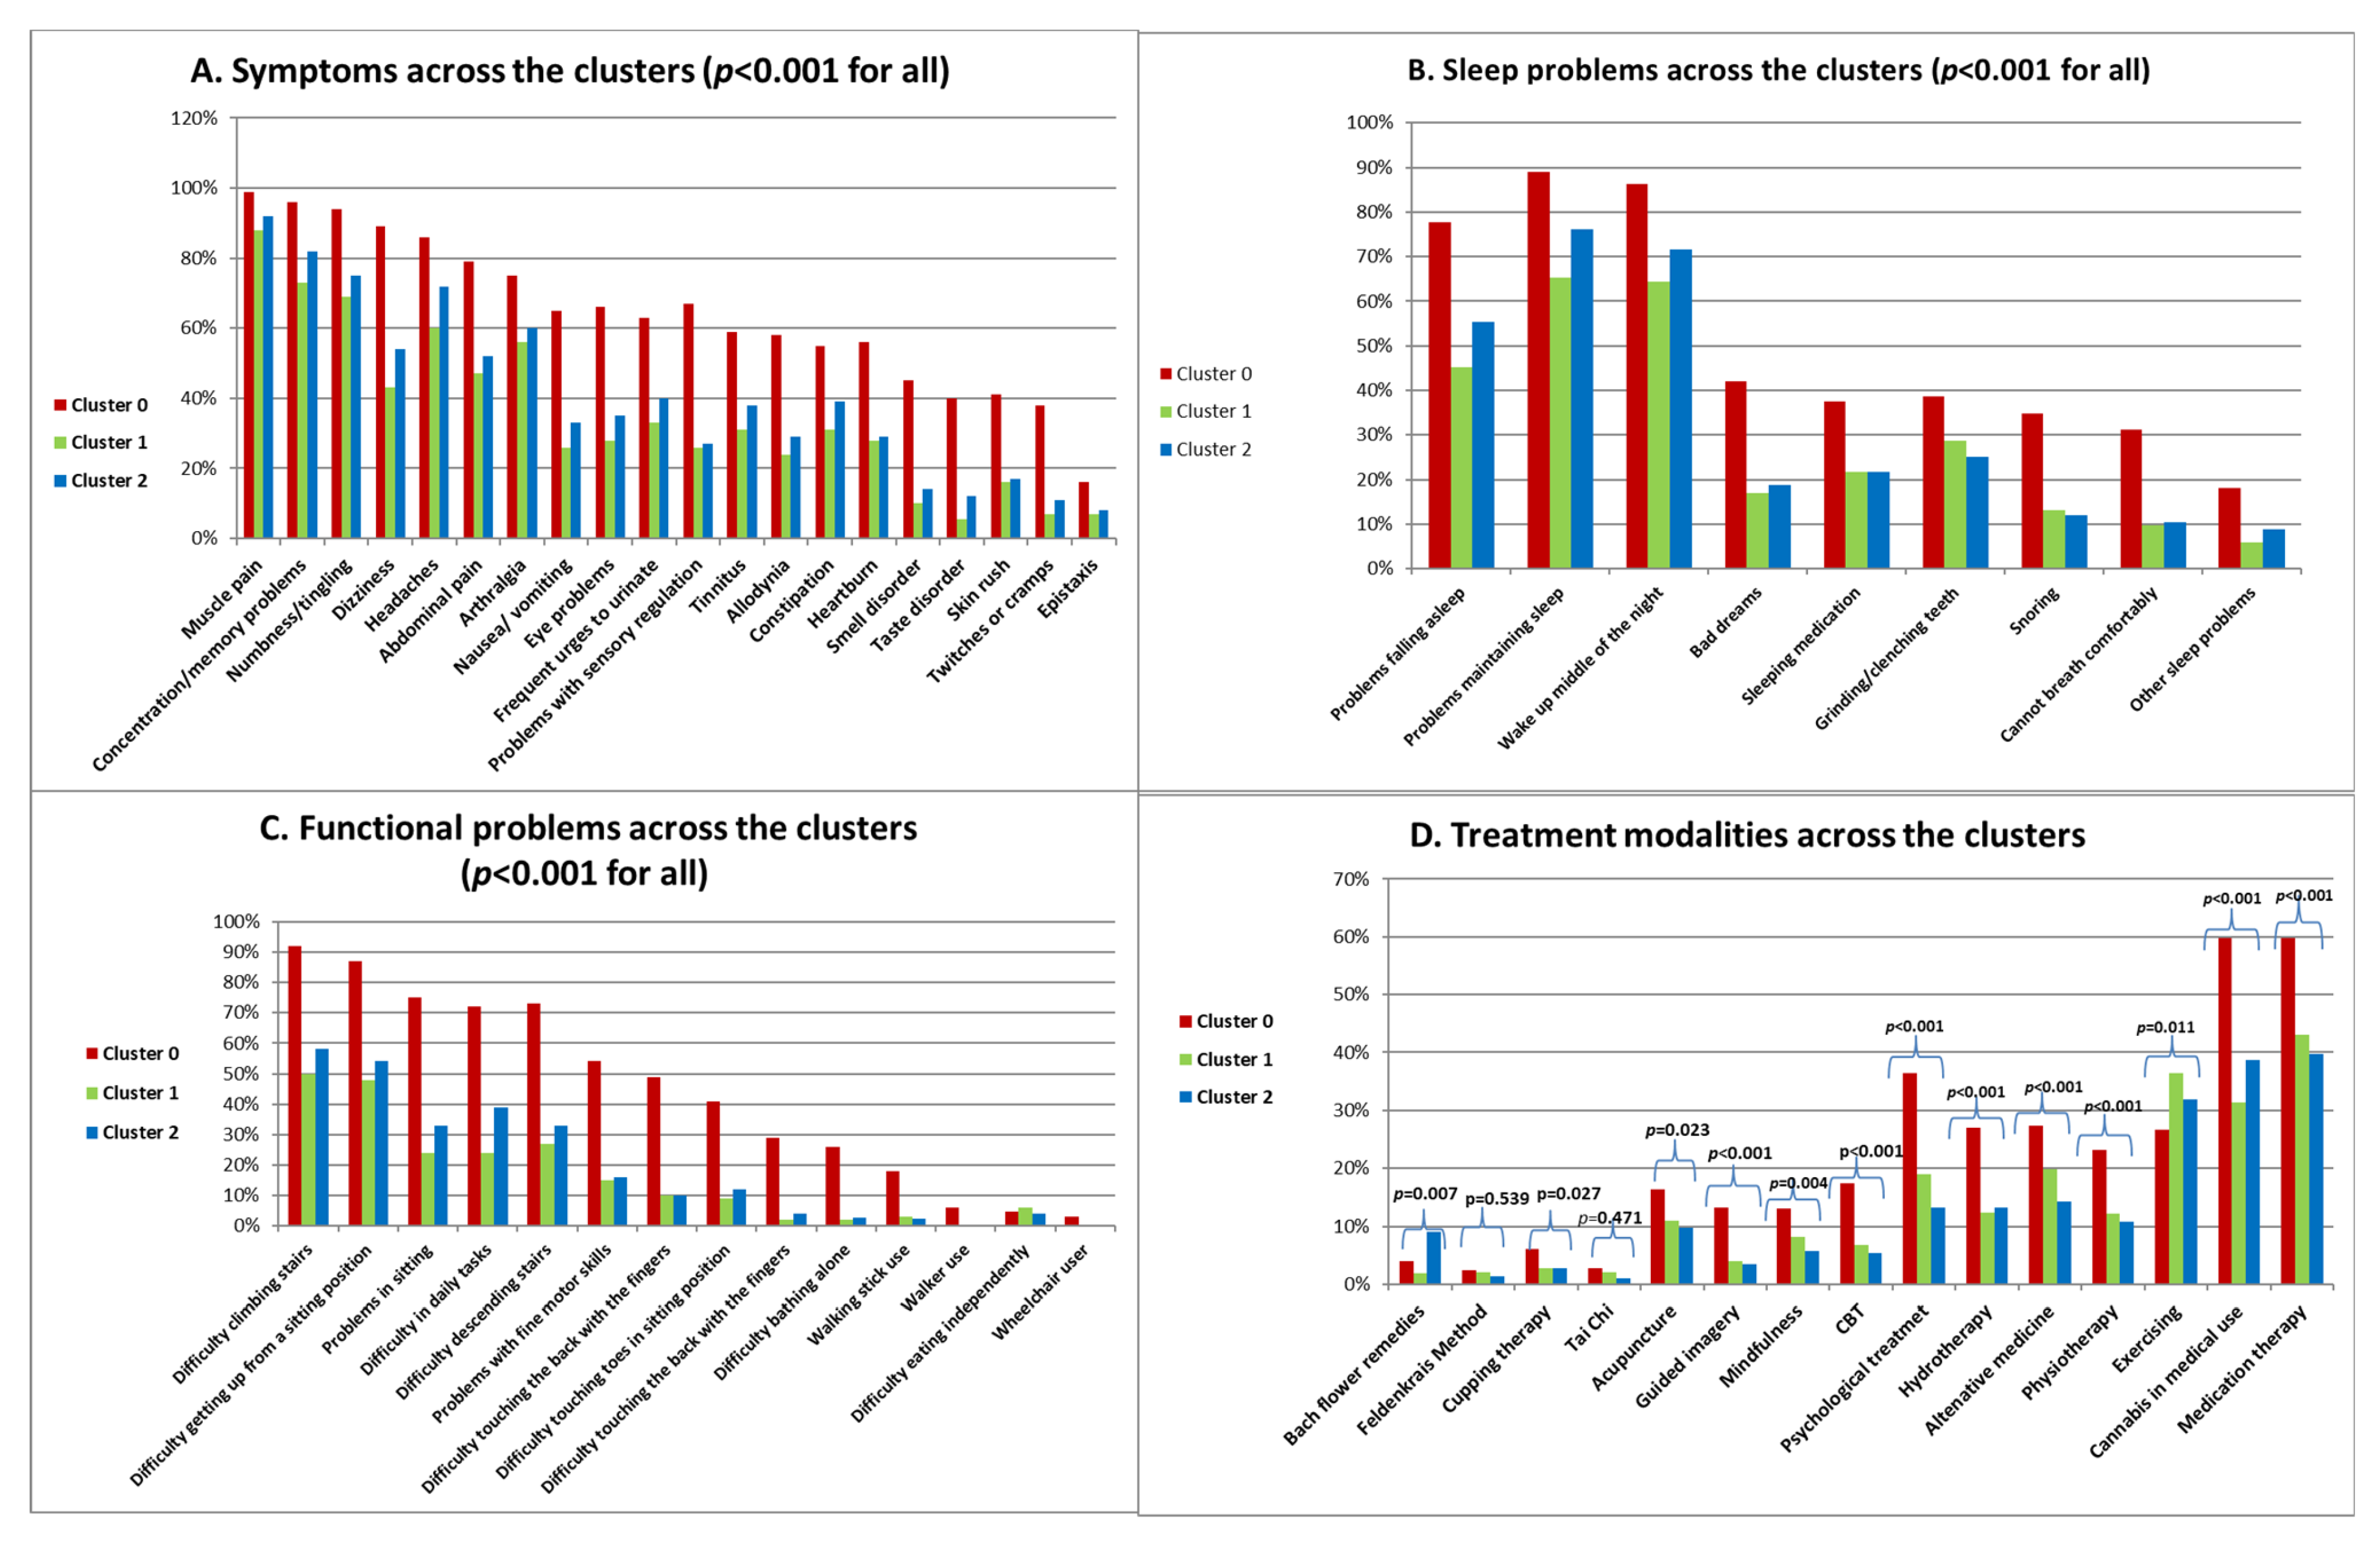
Symptoms, Sleep and Functional Problems and Treatment Modalities across the Clusters
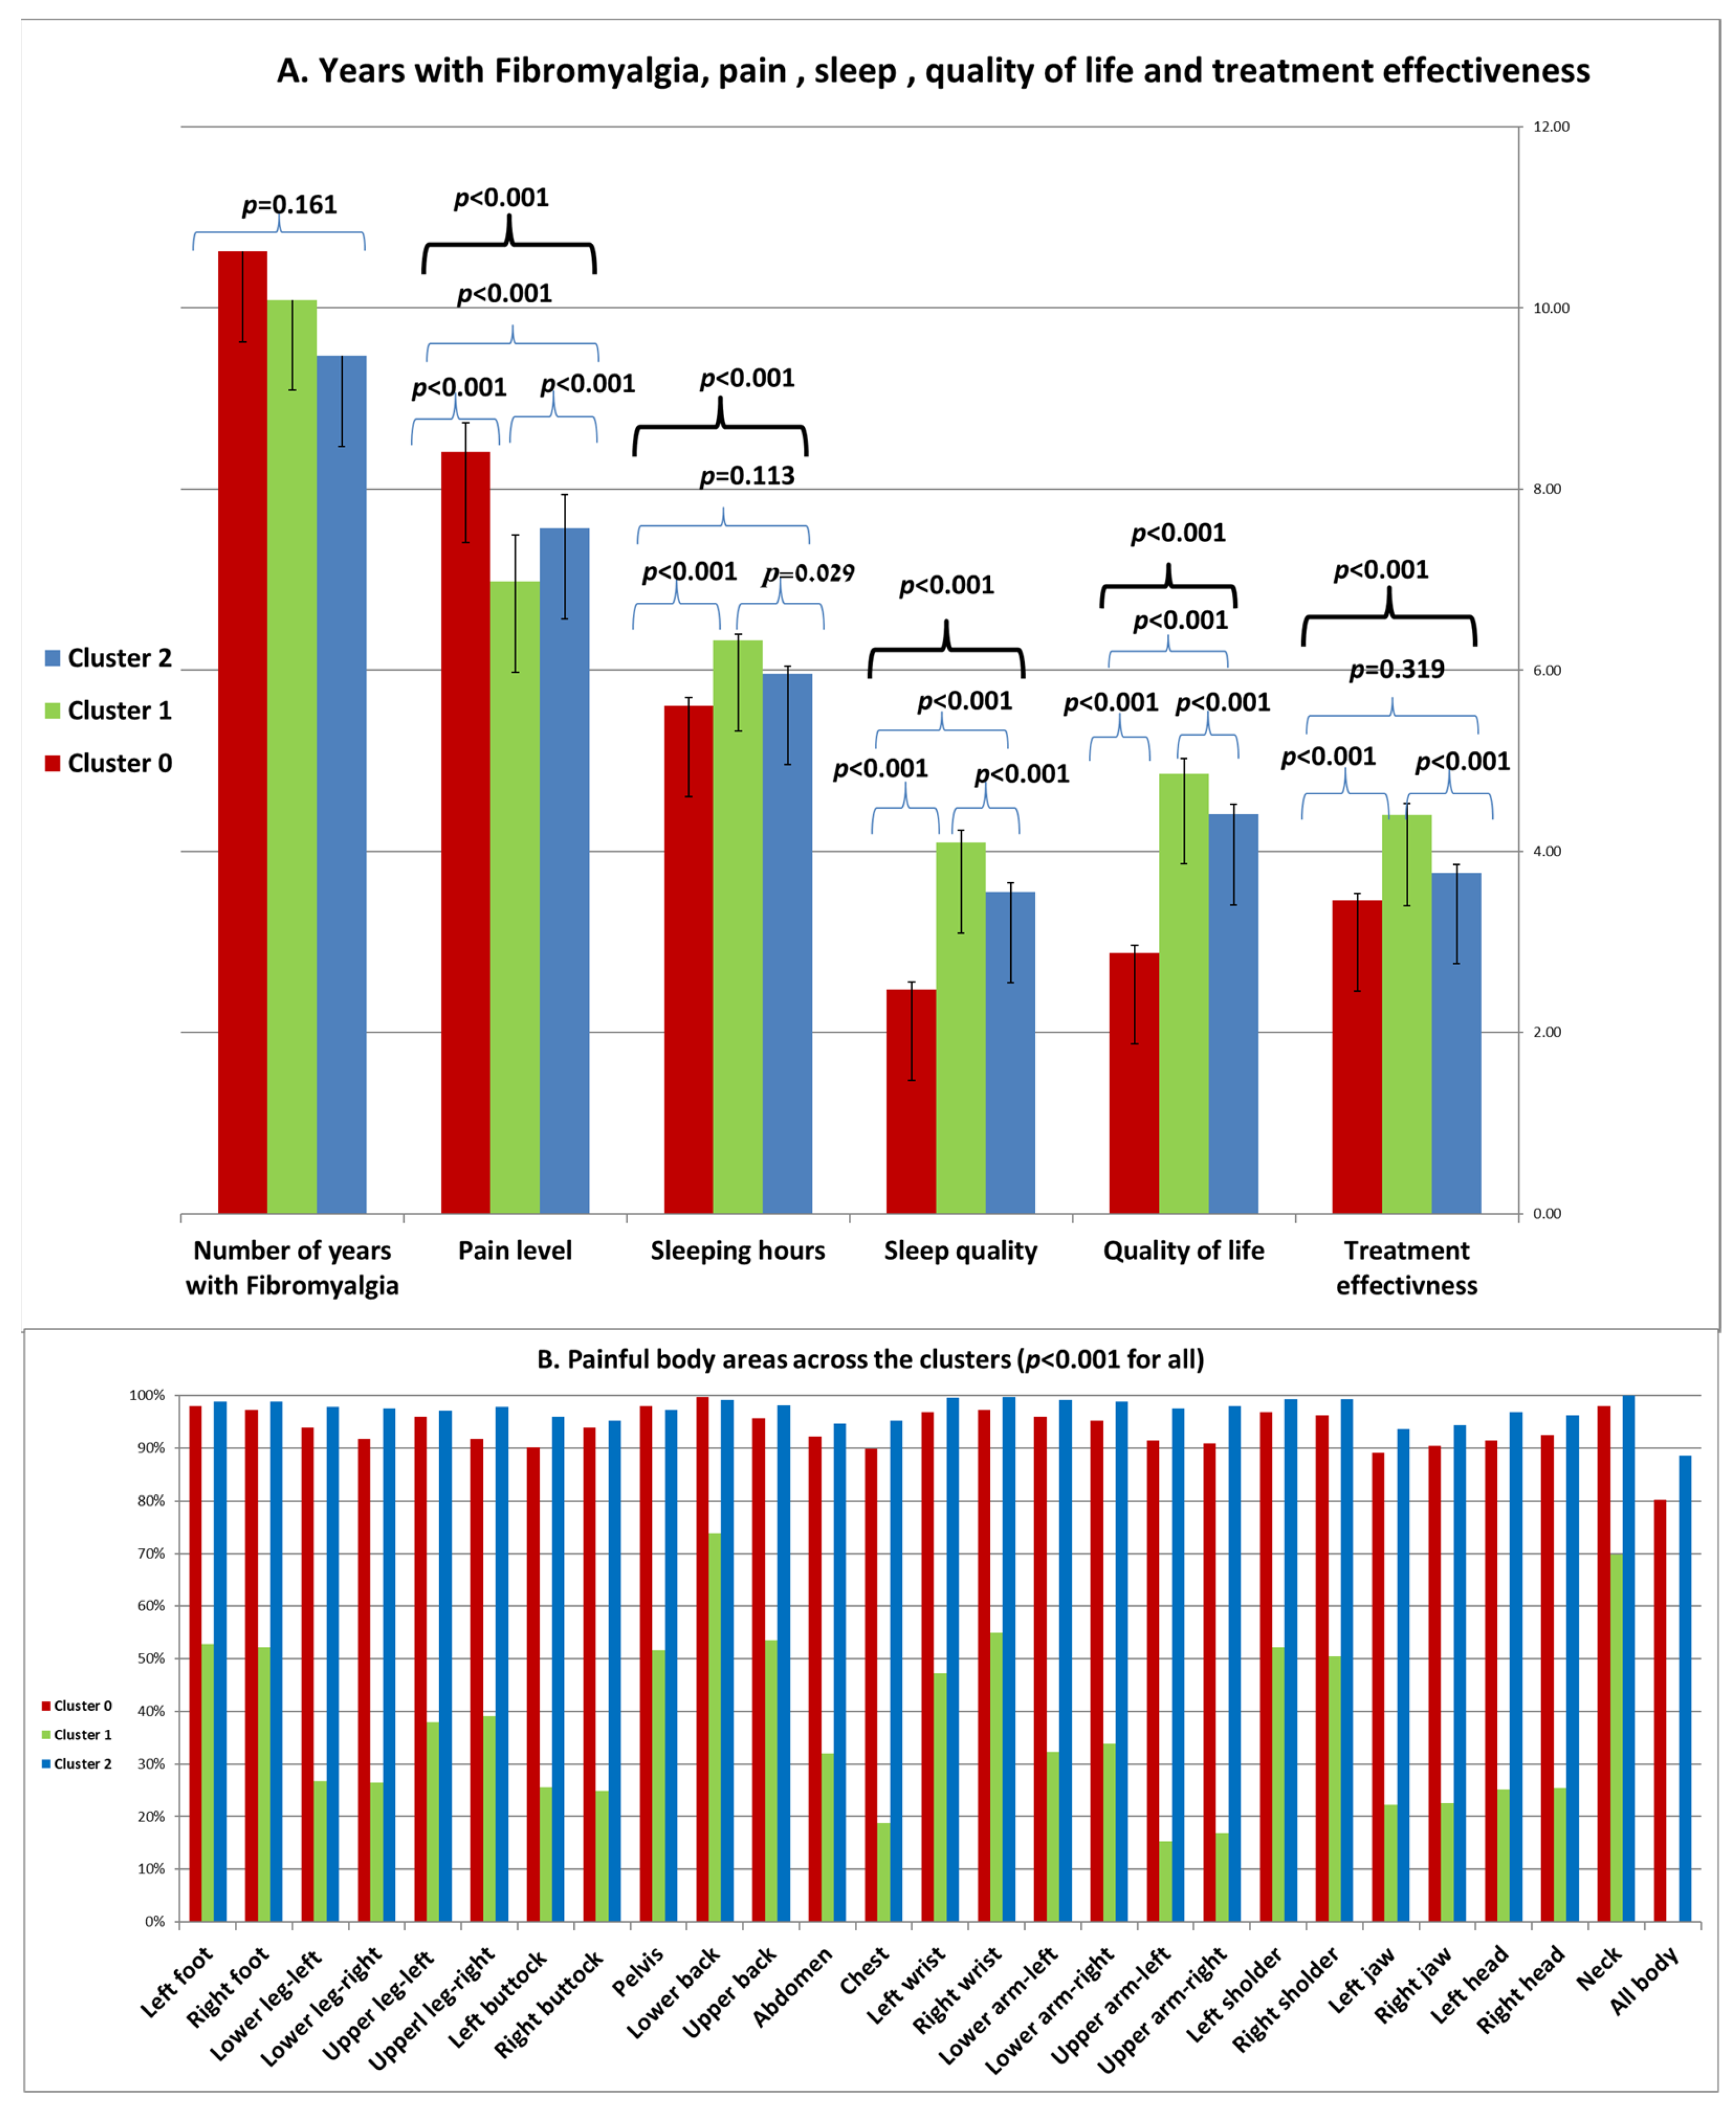
Years with Fibromyalgia, Pain, Sleep, Quality of Life and Treatment Effectiveness across the Clusters
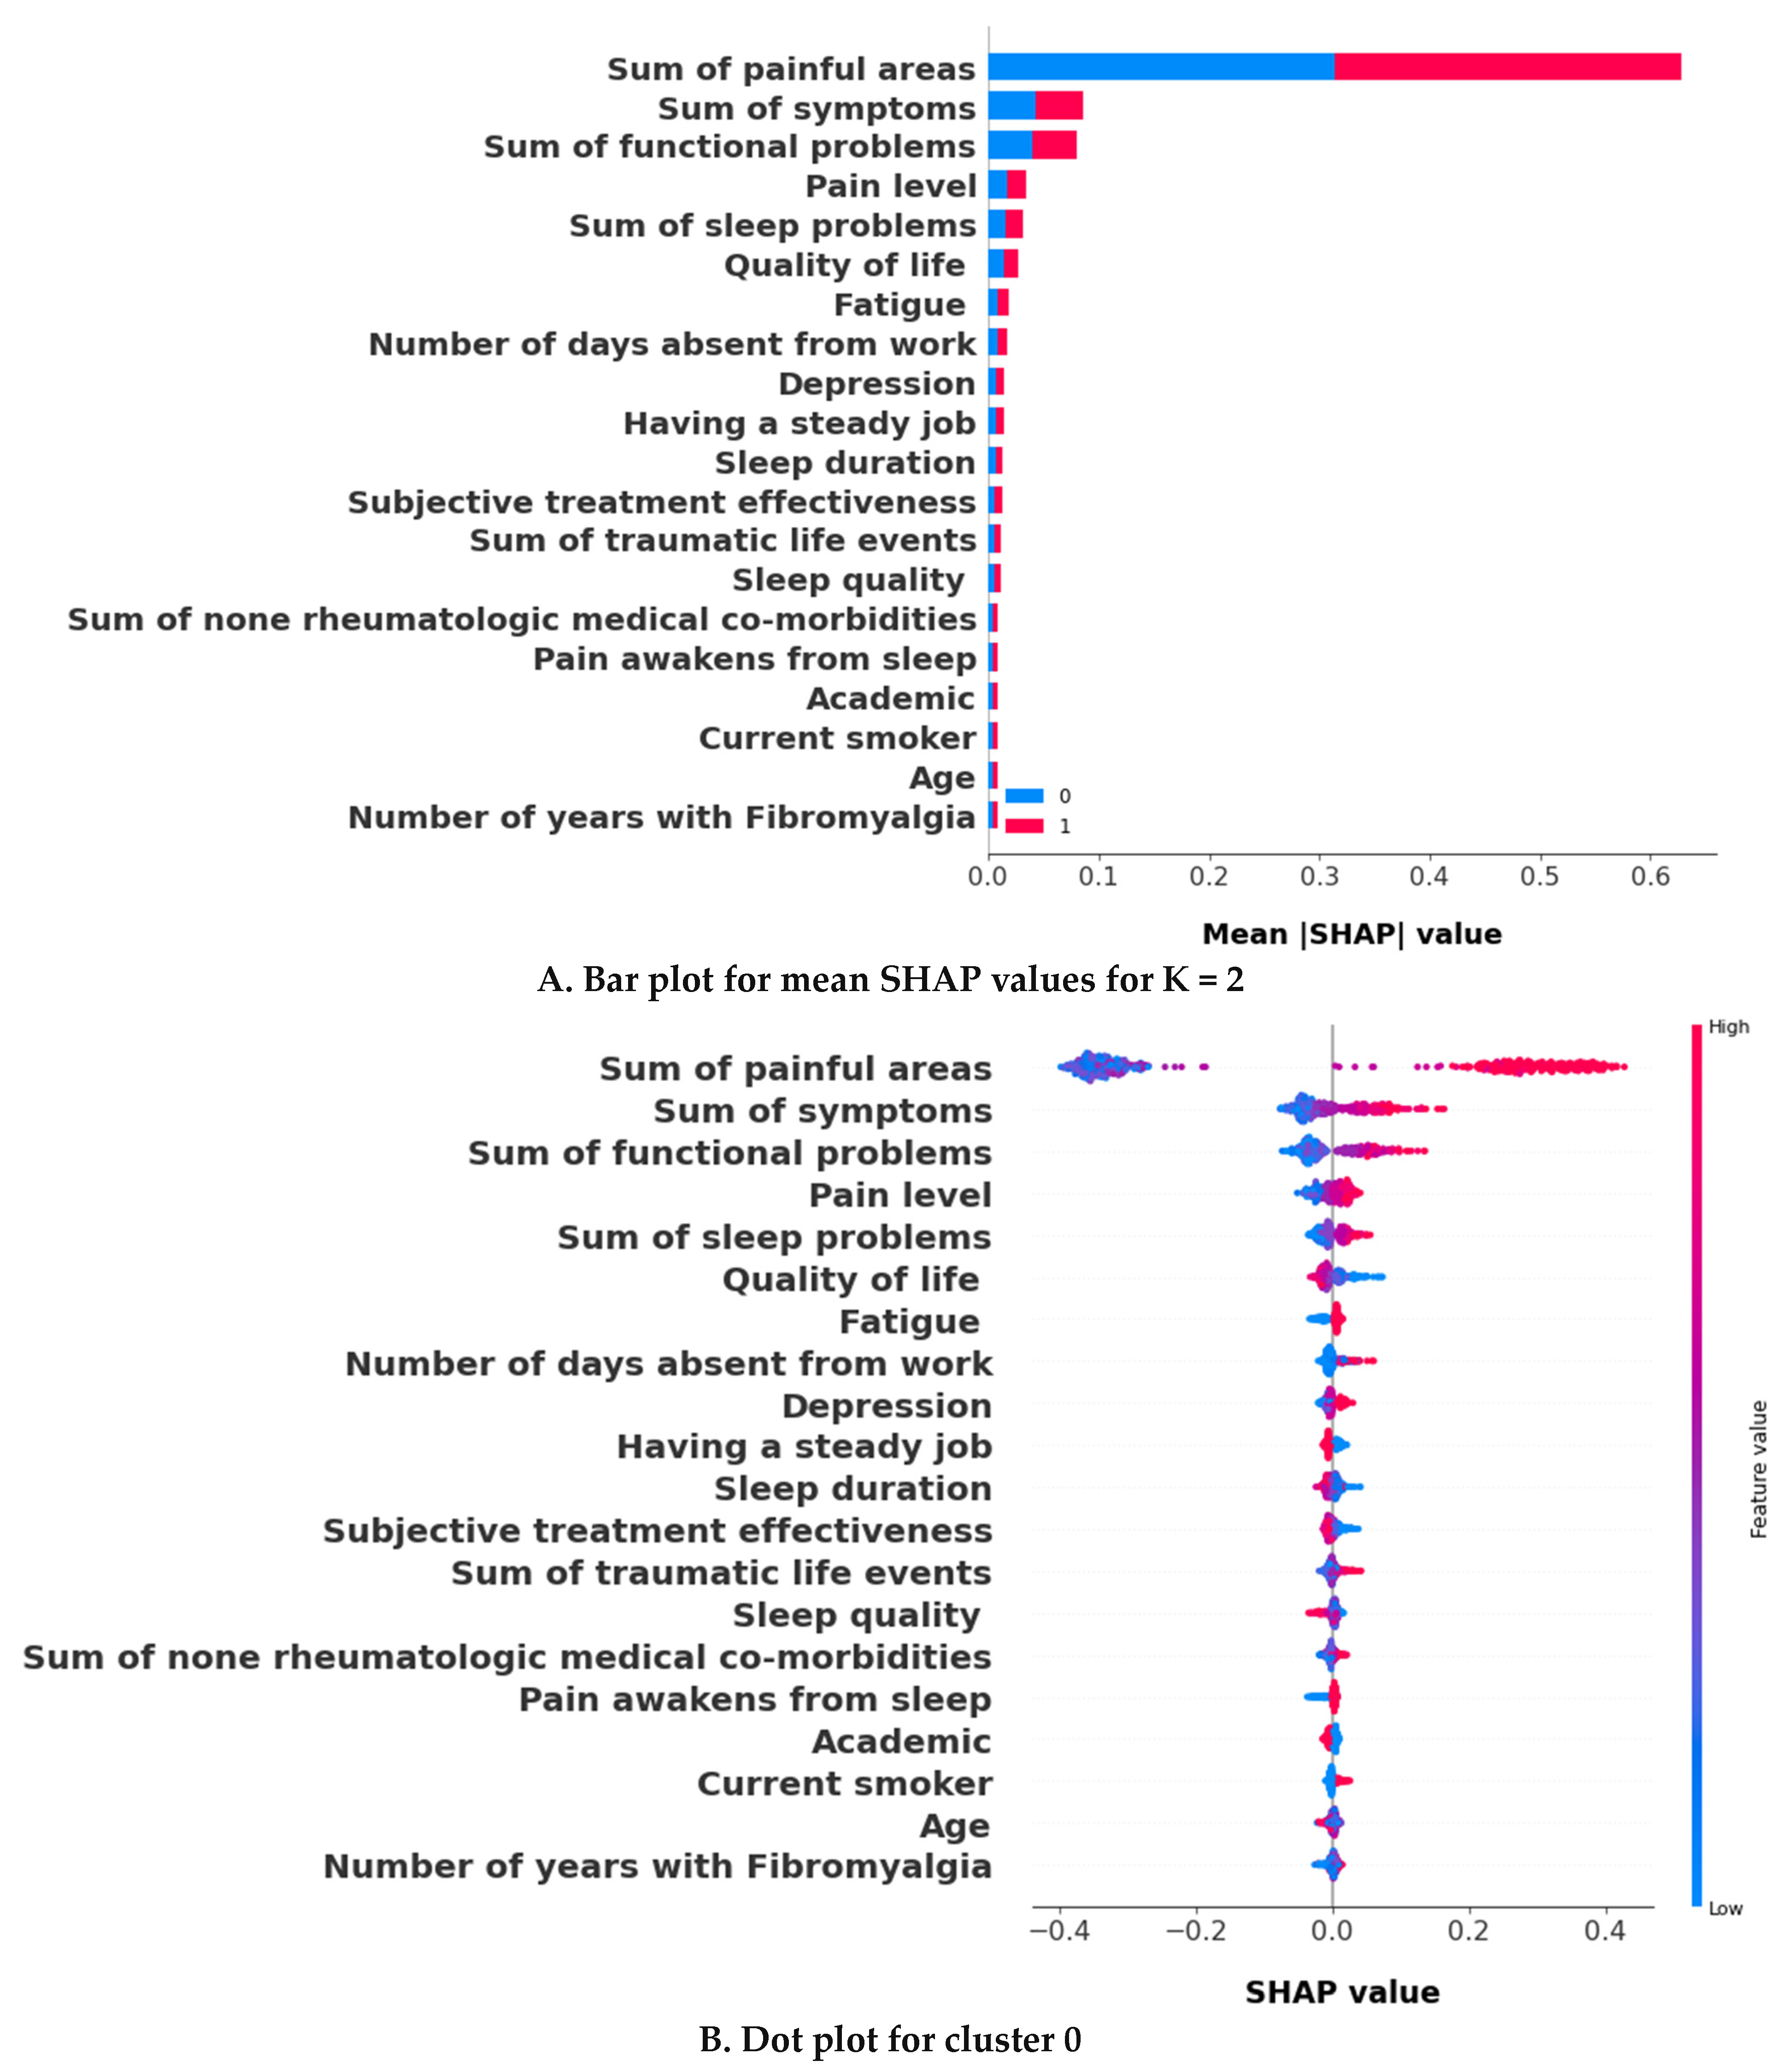
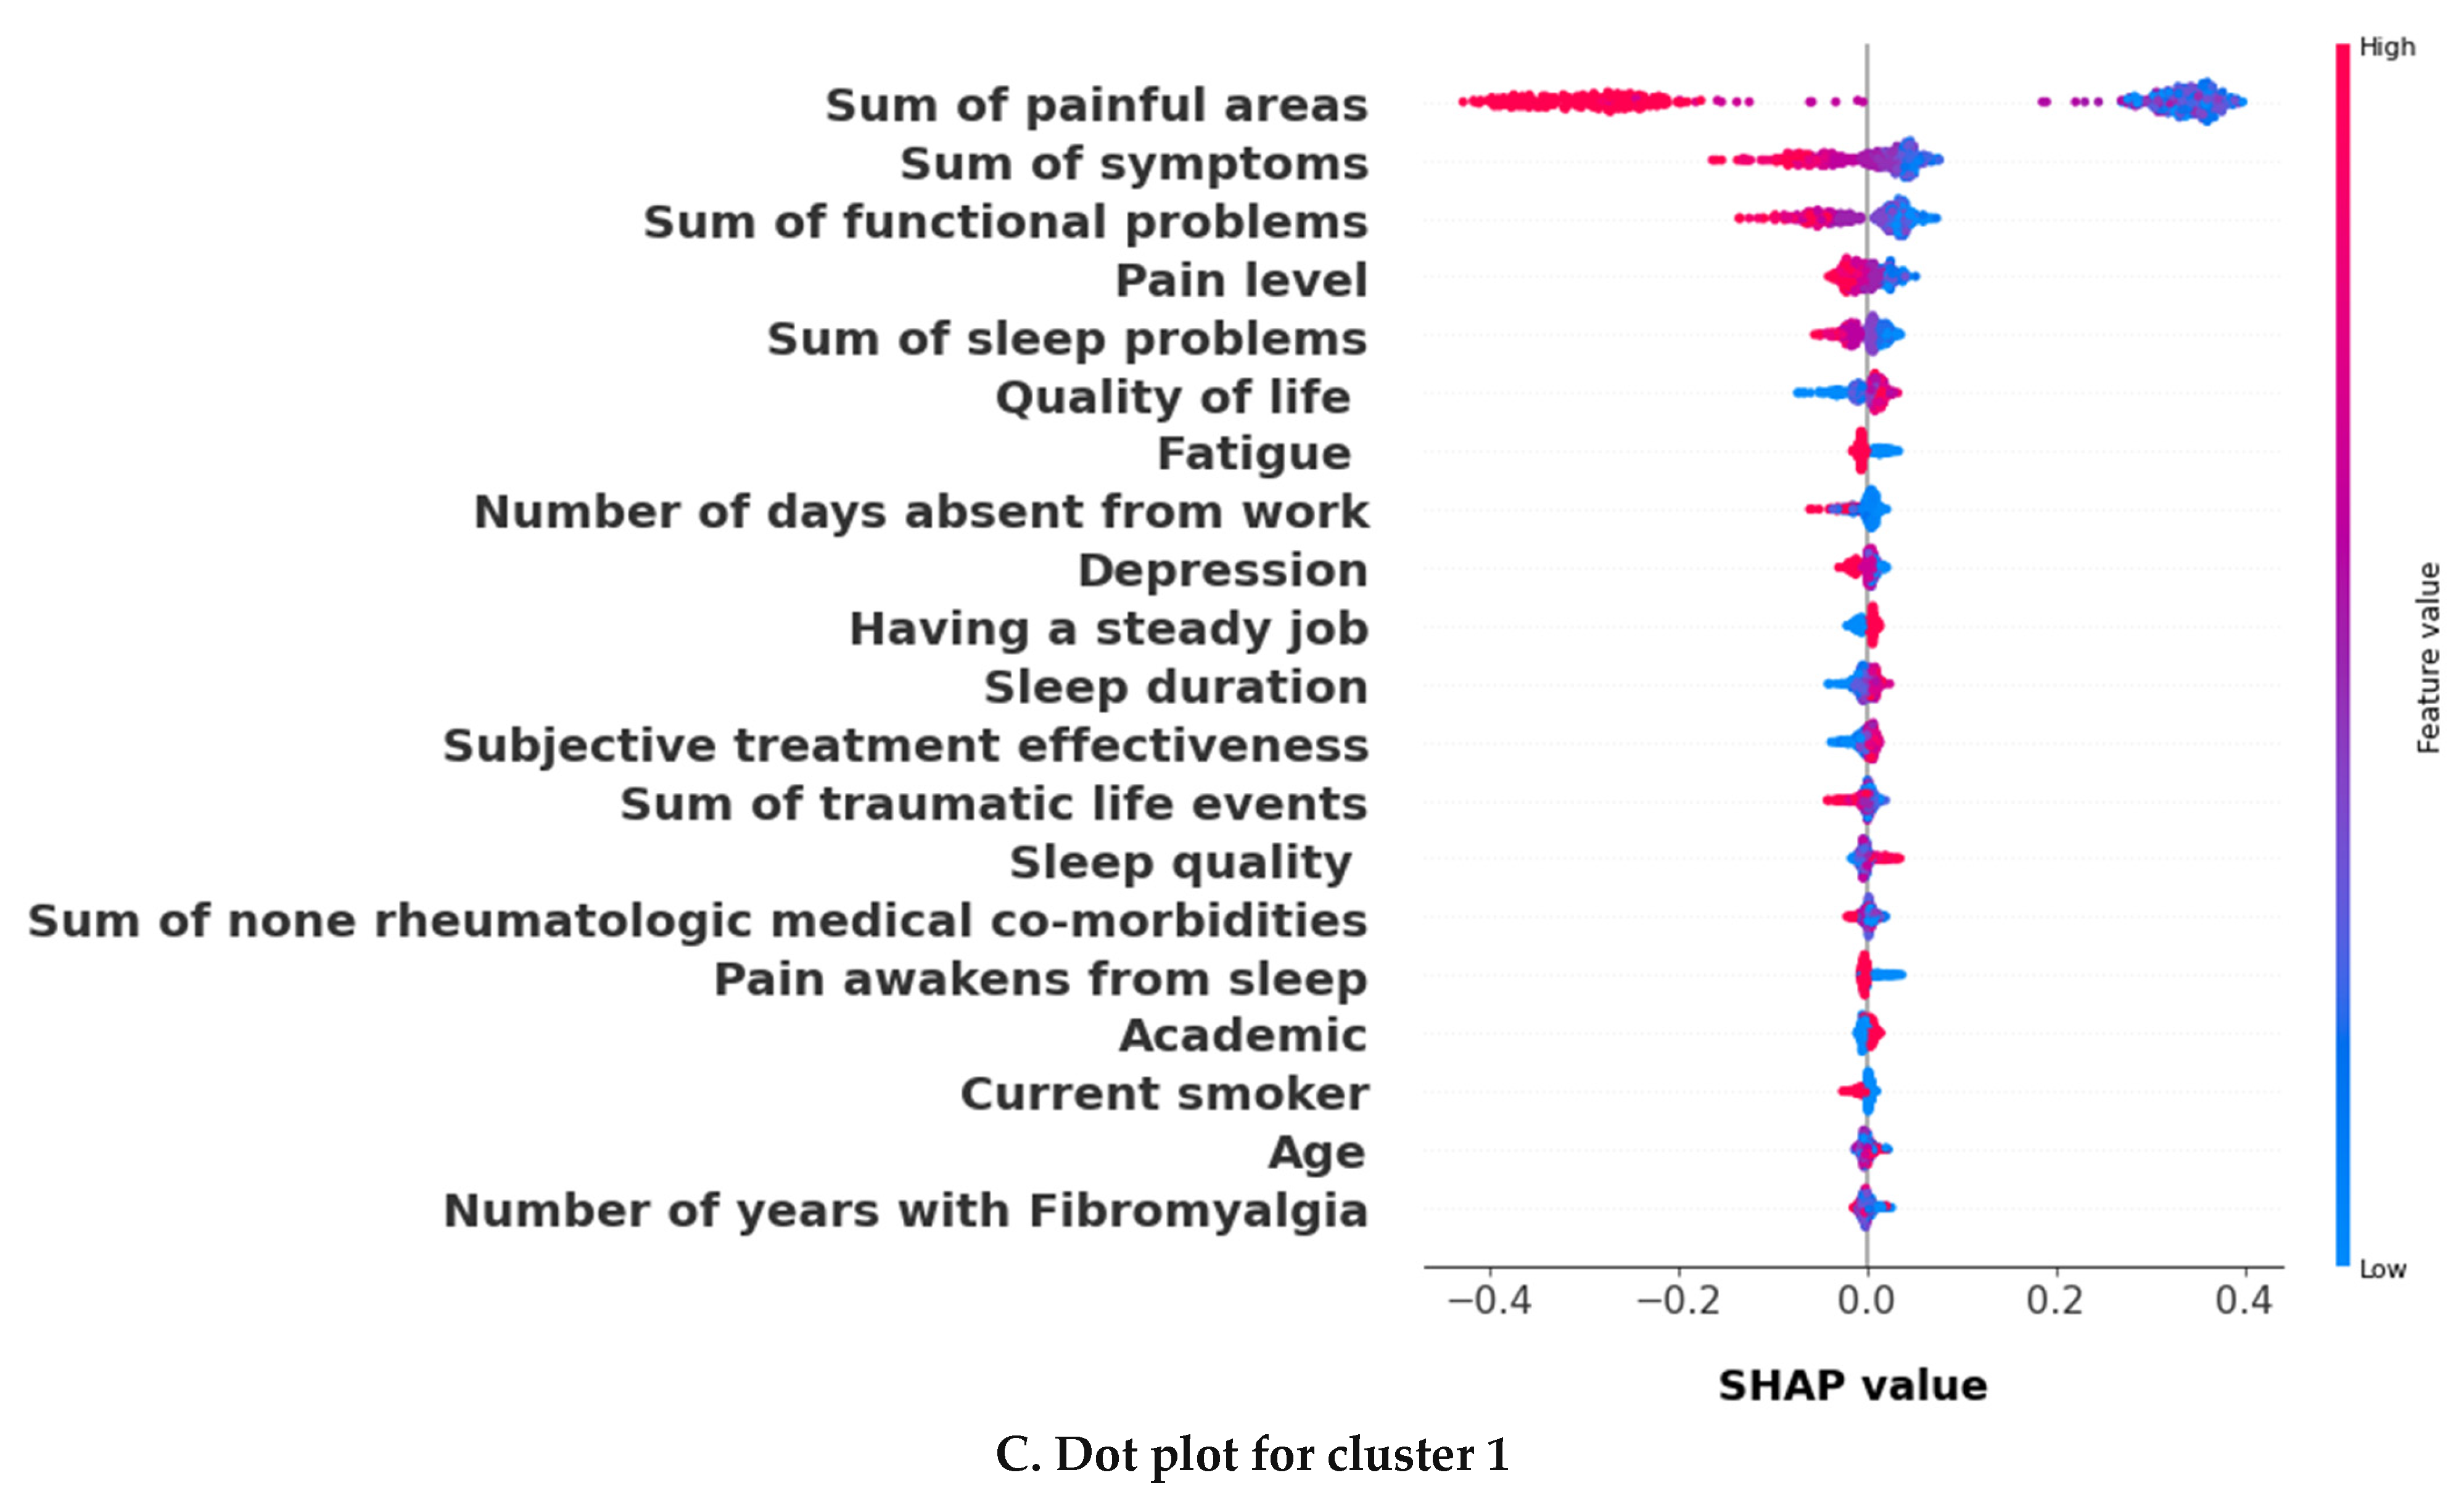
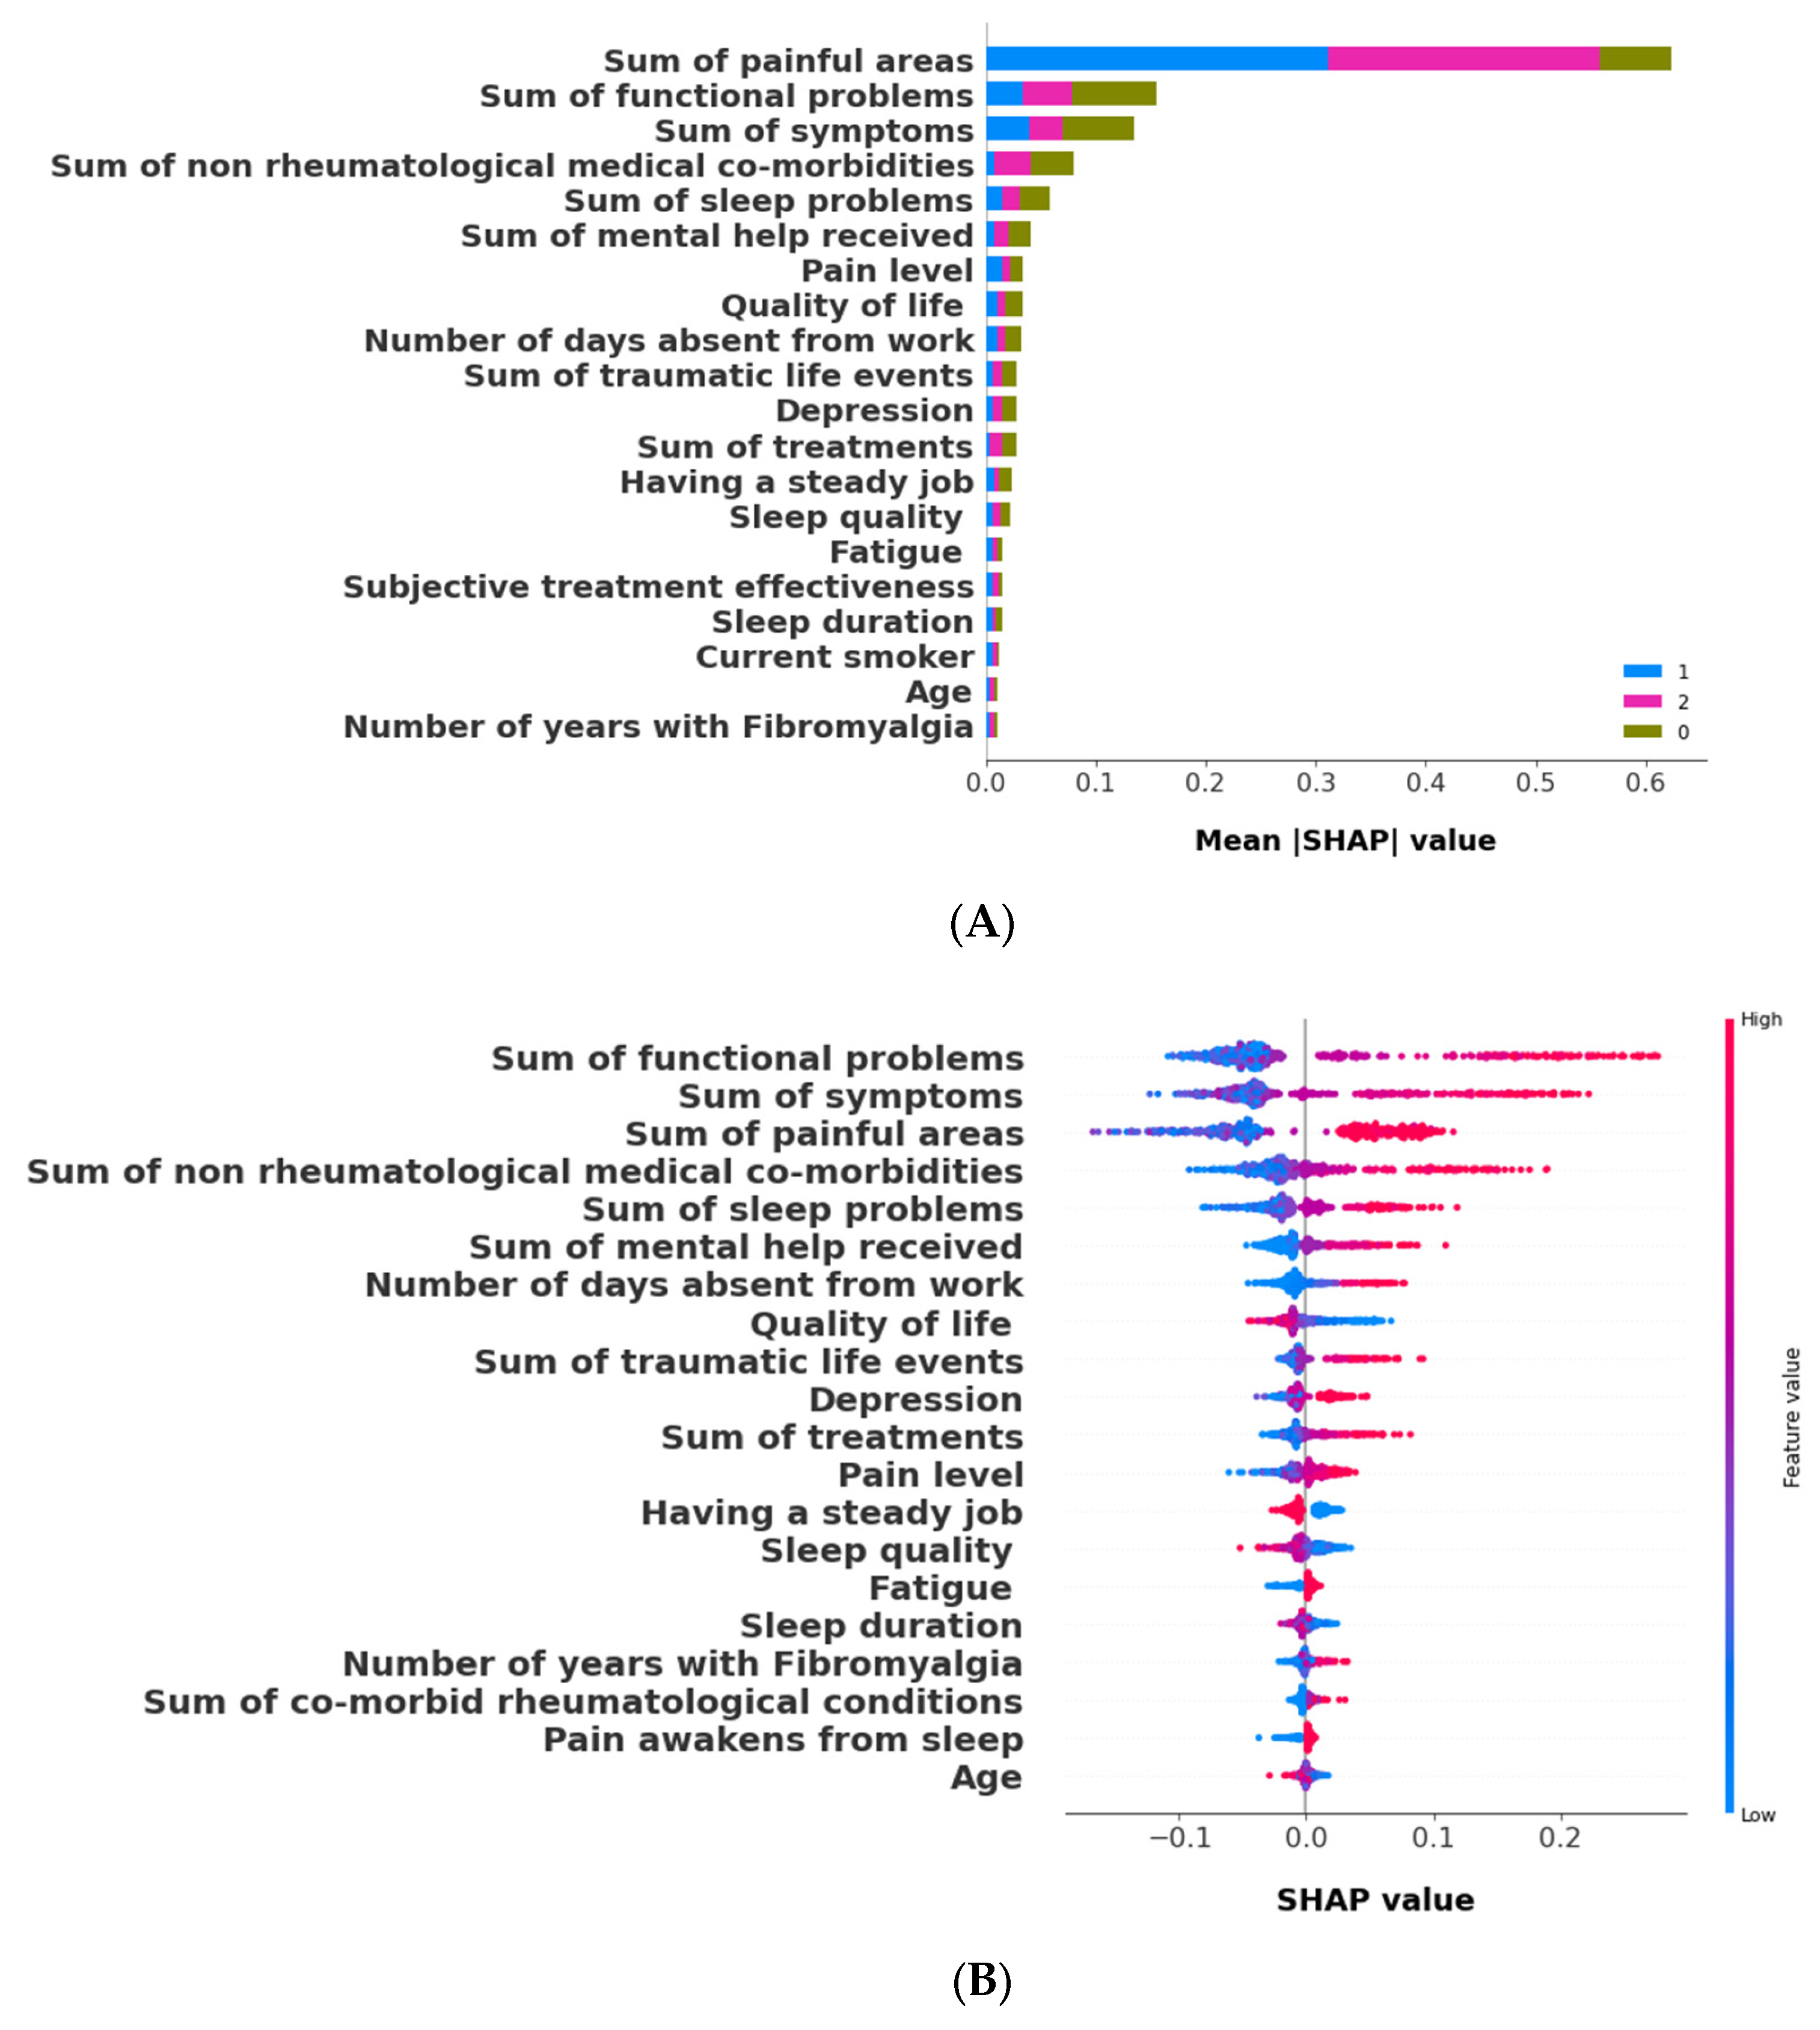
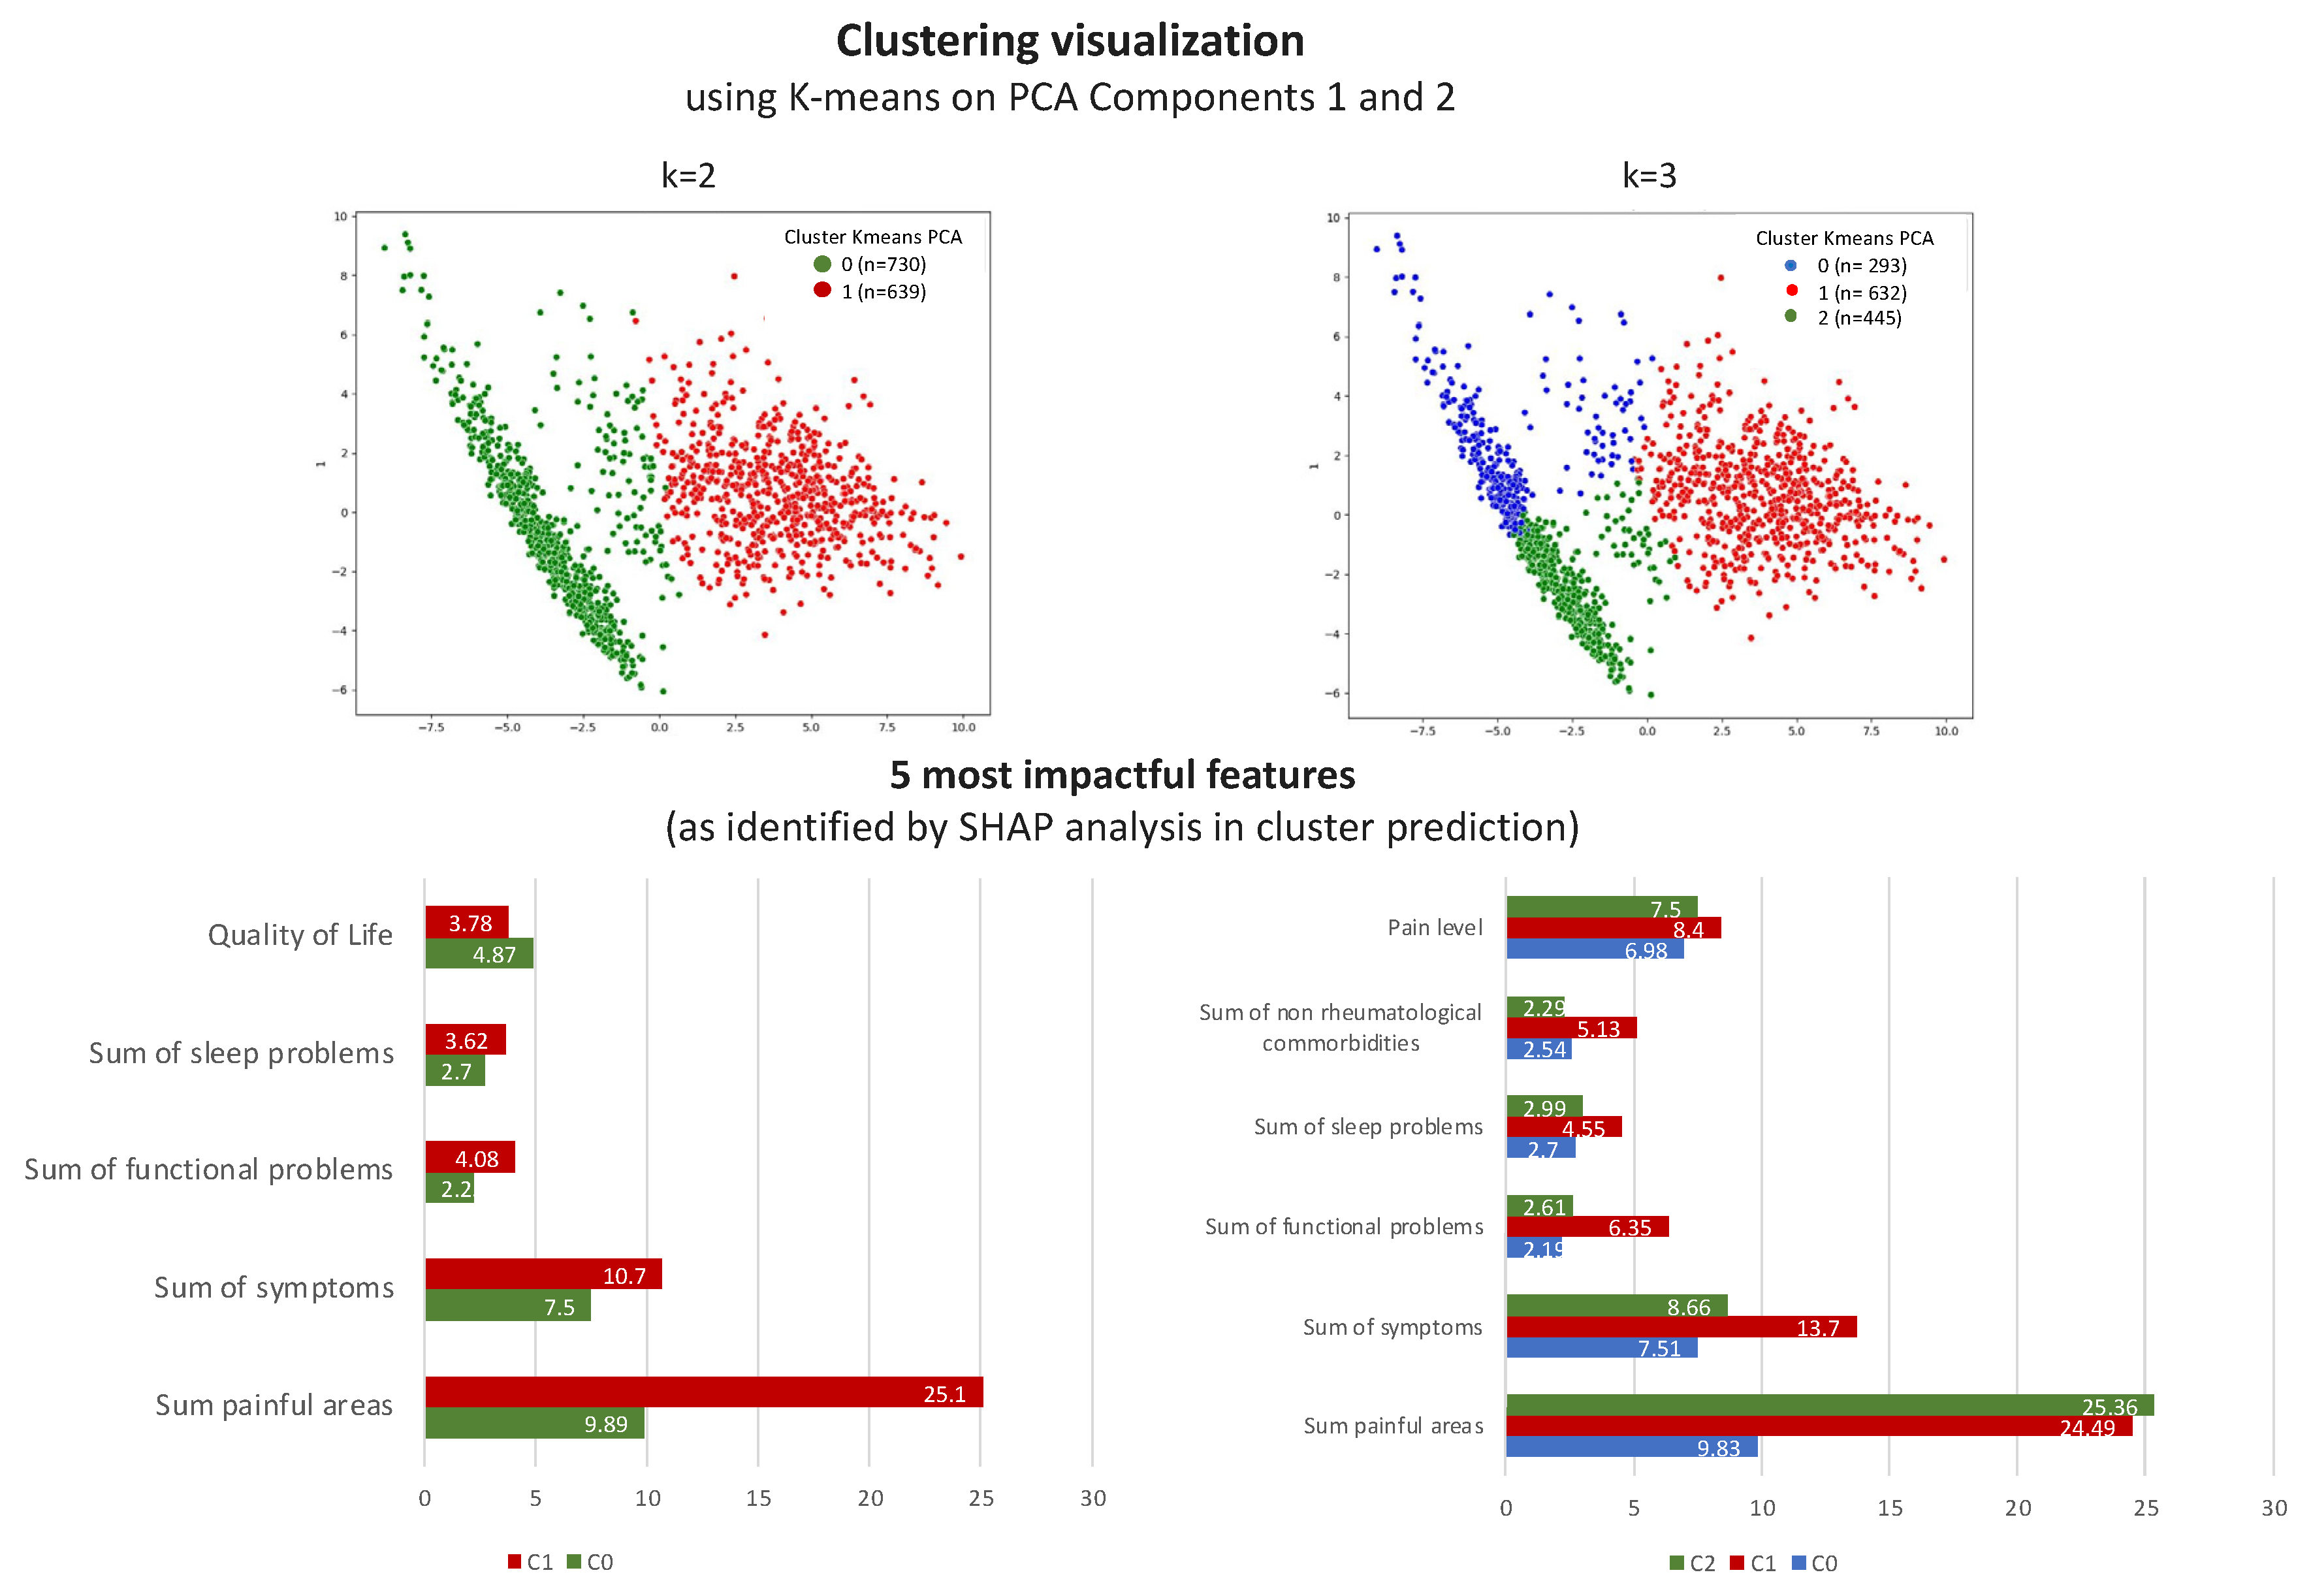
3.2.2. The Validation Phase: A Cluster Classification Model and Computation of Its SHAP Values to Assess the Relative Importance of Different Features When Forming Clusters
3.3. The k = 2 Solution
4. Discussion
5. Conclusions
Author Contributions
Funding
Institutional Review Board Statement
Informed Consent Statement
Data Availability Statement
Acknowledgments
Conflicts of Interest
Appendix A. Supplementary Analyses


| Bad Clusterings | K = 2 | K = 3 | K = 4 | K = 5 |
|---|---|---|---|---|
| K-means | 0 | 0 | 0 | 18 |
| K-means Gower | 0 | 0 | 0 | 5 |
| Gaussian | 2 | 3 | 13 | 16 |
| Gaussian Gower | 0 | 0 | 1 | 4 |
| Agglomerative Ward | 0 | 5 | 16 | 34 |
| Agglomerative average | 30 | 60 | 90 | 120 |
| Agglomerative average Gower | 30 | 60 | 90 | 120 |
| Agglomerative single | 30 | 60 | 90 | 120 |
| Agglomerative single Gower | 30 | 60 | 90 | 120 |
| Agglomerative complete | 29 | 51 | 80 | 109 |
| Agglomerative complete Gower | 1 | 16 | 28 | 47 |
| Features | Variable | Cluster_0 | Cluster_1 | p Values |
|---|---|---|---|---|
| Sex | Yes | 656 (89.74) | 587 (91.86) | 0.1766 |
| No | 75 (10.26) | 52 (8.14) | ||
| Other rheumatic dis. | Yes | 123 (16.83) | 63 (9.86) | <0.001 |
| No | 608 (83.17) | 576 (90.14) | ||
| Behcet’s disease | Yes | 15 (2.05) | 3 (0.47) | 0.0103 |
| No | 716 (97.95) | 636 (99.53) | ||
| FMF | Yes | 25 (3.42) | 16 (2.5) | 0.3208 |
| No | 706 (96.58) | 623 (97.5) | ||
| Inflammatory muscle disease | Yes | 25 (3.42) | 7 (1.1) | 0.0045 |
| No | 706 (96.58) | 632 (98.9) | ||
| Vasculitis | Yes | 4 (0.55) | 7 (1.1) | 0.2566 |
| No | 727 (99.45) | 632 (98.9) | ||
| Osteoarthritis | Yes | 36 (4.92) | 27 (4.23) | 0.5375 |
| No | 695 (95.08) | 612 (95.77) | ||
| Scleroderma | Yes | 1 (0.14) | 2 (0.31) | 0.4864 |
| No | 730 (99.86) | 637 (99.69) | ||
| Pseudogout | Yes | 1 (0.14) | 0 (0.0) | 0.3496 |
| No | 730 (99.86) | 639 (100.0) | ||
| Gout | Yes | 6 (0.82) | 7 (1.1) | 0.6009 |
| No | 725 (99.18) | 632 (98.9) | ||
| SLE | Yes | 22 (3.01) | 20 (3.13) | 0.8975 |
| No | 709 (96.99) | 619 (96.87) | ||
| Sjogren’s | Yes | 12 (1.64) | 11 (1.72) | 0.9086 |
| No | 719 (98.36) | 628 (98.28) | ||
| Arthritis related to IBD | Yes | 11 (1.5) | 9 (1.41) | 0.8821 |
| No | 720 (98.5) | 630 (98.59) | ||
| Spondyloarthritis | Yes | 7 (0.96) | 4 (0.63) | 0.4926 |
| No | 724 (99.04) | 635 (99.37) | ||
| Ankylosing spondylitis | Yes | 10 (1.37) | 11 (1.72) | 0.5953 |
| No | 721 (98.63) | 628 (98.28) | ||
| Psoriatic arthritis | Yes | 36 (4.92) | 20 (3.13) | 0.0942 |
| No | 695 (95.08) | 619 (96.87) | ||
| RA | Yes | 58 (7.93) | 44 (6.89) | 0.4608 |
| No | 673 (92.07) | 595 (93.11) | ||
| No other rheumatological condition | Yes | 443 (60.6) | 429 (67.14) | 0.0121 |
| No | 288 (39.4) | 210 (32.86) | ||
| Endometriosis | Yes | 50 (6.84) | 20 (3.13) | 0.0019 |
| No | 681 (93.16) | 619 (96.87) | ||
| Chronic sinusitis | Yes | 66 (9.03) | 47 (7.36) | 0.2613 |
| No | 665 (90.97) | 592 (92.64) | ||
| Asthma | Yes | 78 (10.67) | 43 (6.73) | 0.0103 |
| No | 653 (89.33) | 596 (93.27) | ||
| Allergy | Yes | 173 (23.67) | 108 (16.9) | 0.002 |
| No | 558 (76.33) | 531 (83.1) | ||
| Liver disease | Yes | 16 (2.19) | 15 (2.35) | 0.8439 |
| No | 715 (97.81) | 624 (97.65) | ||
| Obesity | Yes | 181 (24.76) | 140 (21.91) | 0.2139 |
| No | 550 (75.24) | 499 (78.09) | ||
| Uveitis | Yes | 41 (5.61) | 22 (3.44) | 0.0562 |
| No | 690 (94.39) | 617 (96.56) | ||
| Anemia | Yes | 114 (15.6) | 73 (11.42) | 0.0249 |
| No | 617 (84.4) | 566 (88.58) | ||
| Obstructive sleep apnea | Yes | 62 (8.48) | 29 (4.54) | 0.0035 |
| No | 669 (91.52) | 610 (95.46) | ||
| Renal disease | Yes | 9 (1.23) | 8 (1.25) | 0.9724 |
| No | 722 (98.77) | 631 (98.75) | ||
| Chronic headache | Yes | 283 (38.71) | 163 (25.51) | <0.001 |
| No | 448 (61.29) | 476 (74.49) | ||
| Psychiatric conditions | Yes | 171 (23.39) | 100 (15.65) | <0.001 |
| No | 560 (76.61) | 539 (84.35) | ||
| Endocrinological conditions | Yes | 55 (7.52) | 35 (5.48) | 0.1272 |
| No | 676 (92.48) | 604 (94.52) | ||
| Hyperthyroidism | Yes | 21 (2.87) | 11 (1.72) | 0.1593 |
| No | 710 (97.13) | 628 (98.28) | ||
| Hypothyroidism | Yes | 70 (9.58) | 83 (12.99) | 0.0454 |
| No | 661 (90.42) | 556 (87.01) | ||
| Dermatological conditions | Yes | 68 (9.3) | 45 (7.04) | 0.1293 |
| No | 663 (90.7) | 594 (92.96) | ||
| Malignancy | Yes | 7 (0.96) | 7 (1.1) | 0.8002 |
| No | 724 (99.04) | 632 (98.9) | ||
| Irritable bowel syndrome | Yes | 229 (31.33) | 163 (25.51) | 0.0174 |
| No | 502 (68.67) | 476 (74.49) | ||
| Inflammatory bowel disease | Yes | 37 (5.06) | 25 (3.91) | 0.3073 |
| No | 694 (94.94) | 614 (96.09) | ||
| Peptic ulcers | Yes | 69 (9.44) | 29 (4.54) | <0.001 |
| No | 662 (90.56) | 610 (95.46) | ||
| Pulmonary disease | Yes | 29 (3.97) | 10 (1.56) | 0.0076 |
| No | 702 (96.03) | 629 (98.44) | ||
| Hyperlipidemia | Yes | 94 (12.86) | 85 (13.3) | 0.8083 |
| No | 637 (87.14) | 554 (86.7) | ||
| Hypertension | Yes | 91 (12.45) | 77 (12.05) | 0.8224 |
| No | 640 (87.55) | 562 (87.95) | ||
| Cardiovascular diseases | Yes | 25 (3.42) | 10 (1.56) | 0.0299 |
| No | 706 (96.58) | 629 (98.44) | ||
| Diabetes | Yes | 60 (8.21) | 34 (5.32) | 0.035 |
| No | 671 (91.79) | 605 (94.68) | ||
| Having a steady job | Yes | 378 (51.71) | 419 (65.57) | <0.001 |
| No | 353 (48.29) | 220 (34.43) | ||
| Fibromyalgia had worsened in the past year | Yes | 633 (86.59) | 468 (73.24) | <0.001 |
| No | 98 (13.41) | 171 (26.76) | ||
| Emotional trauma before fibromyalgia onset | Yes | 428 (58.55) | 373 (58.37) | 0.947 |
| No | 303 (41.45) | 266 (41.63) | ||
| Physical trauma before fibromyalgia onset | Yes | 279 (38.17) | 201 (31.46) | 0.0094 |
| No | 452 (61.83) | 438 (68.54) | ||
| Emotional trauma after fibromyalgia onset | Yes | 383 (52.39) | 282 (44.13) | 0.0023 |
| No | 348 (47.61) | 357 (55.87) | ||
| Physical trauma after fibromyalgia onset | Yes | 162 (22.16) | 81 (12.68) | <0.001 |
| No | 569 (77.84) | 558 (87.32) | ||
| Pain causing awakening from sleep | Yes | 651 (89.06) | 479 (74.96) | <0.001 |
| No | 80 (10.94) | 160 (25.04) | ||
| Waking up tired | Yes | 713 (97.54) | 605 (94.68) | 0.0057 |
| No | 18 (2.46) | 34 (5.32) | ||
| Other sleep problems | Yes | 90 (12.31) | 40 (6.26) | <0.001 |
| No | 641 (87.69) | 599 (93.74) | ||
| Sleeping medication | Yes | 201 (27.5) | 142 (22.22) | 0.0246 |
| No | 530 (72.5) | 497 (77.78) | ||
| Bad dreams | Yes | 208 (28.45) | 105 (16.43) | <0.001 |
| No | 523 (71.55) | 534 (83.57) | ||
| Snoring/coughing | Yes | 157 (21.48) | 81 (12.68) | <0.001 |
| No | 574 (78.52) | 558 (87.32) | ||
| Waking up in the middle of the night/early morning | Yes | 566 (77.43) | 413 (64.63) | <0.001 |
| No | 165 (22.57) | 226 (35.37) | ||
| Inability to breathe comfortably | Yes | 137 (18.74) | 61 (9.55) | <0.001 |
| No | 594 (81.26) | 578 (90.45) | ||
| Grinding/clenching teeth | Yes | 226 (30.92) | 180 (28.17) | 0.2666 |
| No | 505 (69.08) | 459 (71.83) | ||
| Problems maintaining sleep | Yes | 596 (81.53) | 417 (65.26) | <0.001 |
| No | 135 (18.47) | 222 (34.74) | ||
| Problems falling asleep | Yes | 470 (64.3) | 289 (45.23) | <0.001 |
| No | 261 (35.7) | 350 (54.77) | ||
| Left foot | Yes | 721 (98.63) | 340 (53.21) | <0.001 |
| No | 10 (1.37) | 299 (46.79) | ||
| Right foot | Yes | 720 (98.5) | 335 (52.43) | <0.001 |
| No | 11 (1.5) | 304 (47.57) | ||
| Lower leg: left | Yes | 706 (96.58) | 173 (27.07) | <0.001 |
| No | 25 (3.42) | 466 (72.93) | ||
| Lower leg: right | Yes | 701 (95.9) | 169 (26.45) | <0.001 |
| No | 30 (4.1) | 470 (73.55) | ||
| Upper leg: left | Yes | 709 (96.99) | 244 (38.18) | <0.001 |
| No | 22 (3.01) | 395 (61.82) | ||
| Upper leg: right | Yes | 698 (95.49) | 253 (39.59) | <0.001 |
| No | 33 (4.51) | 386 (60.41) | ||
| Left buttock | Yes | 688 (94.12) | 165 (25.82) | <0.001 |
| No | 43 (5.88) | 474 (74.18) | ||
| Right buttock | Yes | 696 (95.21) | 160 (25.04) | <0.001 |
| No | 35 (4.79) | 479 (74.96) | ||
| Pelvis | Yes | 716 (97.95) | 330 (51.64) | <0.001 |
| No | 15 (2.05) | 309 (48.36) | ||
| Lower back | Yes | 726 (99.32) | 474 (74.18) | <0.001 |
| No | 5 (0.68) | 165 (25.82) | ||
| Upper back | Yes | 714 (97.67) | 341 (53.36) | <0.001 |
| No | 17 (2.33) | 298 (46.64) | ||
| Abdomen | Yes | 689 (94.25) | 204 (31.92) | <0.001 |
| No | 42 (5.75) | 435 (68.08) | ||
| Chest | Yes | 684 (93.57) | 122 (19.09) | <0.001 |
| No | 47 (6.43) | 517 (80.91) | ||
| Left wrist | Yes | 722 (98.77) | 303 (47.42) | <0.001 |
| No | 9 (1.23) | 336 (52.58) | ||
| Right wrist | Yes | 722 (98.77) | 354 (55.4) | <0.001 |
| No | 9 (1.23) | 285 (44.6) | ||
| Lower arm: left | Yes | 718 (98.22) | 208 (32.55) | <0.001 |
| No | 13 (1.78) | 431 (67.45) | ||
| Lower arm: right | Yes | 713 (97.54) | 220 (34.43) | <0.001 |
| No | 18 (2.46) | 419 (65.57) | ||
| Upper arm: left | Yes | 697 (95.35) | 102 (15.96) | <0.001 |
| No | 34 (4.65) | 537 (84.04) | ||
| Upper arm: right | Yes | 695 (95.08) | 113 (17.68) | <0.001 |
| No | 36 (4.92) | 526 (82.32) | ||
| Left shoulder | Yes | 722 (98.77) | 334 (52.27) | <0.001 |
| No | 9 (1.23) | 305 (47.73) | ||
| Right shoulder | Yes | 716 (97.95) | 327 (51.17) | <0.001 |
| No | 15 (2.05) | 312 (48.83) | ||
| Left jaw | Yes | 678 (92.75) | 141 (22.07) | <0.001 |
| No | 53 (7.25) | 498 (77.93) | ||
| Right jaw | Yes | 683 (93.43) | 144 (22.54) | <0.001 |
| No | 48 (6.57) | 495 (77.46) | ||
| Left head | Yes | 695 (95.08) | 163 (25.51) | <0.001 |
| No | 36 (4.92) | 476 (74.49) | ||
| Right head | Yes | 699 (95.62) | 161 (25.2) | <0.001 |
| No | 32 (4.38) | 478 (74.8) | ||
| Neck | Yes | 727 (99.45) | 446 (69.8) | <0.001 |
| No | 4 (0.55) | 193 (30.2) | ||
| All body | Yes | 629 (86.05) | 0 (0.0) | <0.001 |
| No | 102 (13.95) | 639 (100.0) | ||
| Dizziness | Yes | 501 (68.54) | 280 (43.82) | <0.001 |
| No | 230 (31.46) | 359 (56.18) | ||
| Nausea/vomiting | Yes | 336 (45.96) | 172 (26.92) | <0.001 |
| No | 395 (54.04) | 467 (73.08) | ||
| Abdominal pain | Yes | 467 (63.89) | 301 (47.1) | <0.001 |
| No | 264 (36.11) | 338 (52.9) | ||
| Constipation | Yes | 334 (45.69) | 200 (31.3) | <0.001 |
| No | 397 (54.31) | 439 (68.7) | ||
| Heartburn | Yes | 297 (40.63) | 179 (28.01) | <0.001 |
| No | 434 (59.37) | 460 (71.99) | ||
| Taste disorder | Yes | 169 (23.12) | 38 (5.95) | <0.001 |
| No | 562 (76.88) | 601 (94.05) | ||
| Smell disorder | Yes | 198 (27.09) | 69 (10.8) | <0.001 |
| No | 533 (72.91) | 570 (89.2) | ||
| Xerostomia | Yes | 403 (55.13) | 221 (34.59) | <0.001 |
| No | 328 (44.87) | 418 (65.41) | ||
| Epistaxis | Yes | 84 (11.49) | 46 (7.2) | 0.0068 |
| No | 647 (88.51) | 593 (92.8) | ||
| Frequent urges to urinate | Yes | 364 (49.79) | 212 (33.18) | <0.001 |
| No | 367 (50.21) | 427 (66.82) | ||
| Tinnitus | Yes | 343 (46.92) | 198 (30.99) | <0.001 |
References
- Arnold, L.M.; Bennett, R.M.; Crofford, L.J.; Dean, L.E.; Clauw, D.J.; Goldenberg, D.L.; Fitzcharles, M.A.; Paiva, E.S.; Staud, R.; Sarzi-Puttini, P.; et al. AAPT Diagnostic Criteria for Fibromyalgia. J. Pain 2019, 20, 611–628. [Google Scholar] [CrossRef] [PubMed]
- Clauw, D.J. Fibromyalgia: A clinical review. JAMA 2014, 311, 1547–1555. [Google Scholar] [CrossRef] [PubMed]
- Walitt, B.; Nahin, R.L.; Katz, R.S.; Bergman, M.J.; Wolfe, F. The Prevalence and Characteristics of Fibromyalgia in the 2012 National Health Interview Survey. PLoS ONE 2015, 10, e0138024. [Google Scholar] [CrossRef]
- Vincent, A.; Lahr, B.D.; Wolfe, F.; Clauw, D.J.; Whipple, M.O.; Oh, T.H.; Barton, D.L.; St Sauver, J. Prevalence of fibromyalgia: A population-based study in Olmsted County, Minnesota, utilizing the Rochester Epidemiology Project. Arthritis Care Res. 2013, 65, 786–792. [Google Scholar] [CrossRef]
- Jones, G.T.; Atzeni, F.; Beasley, M.; Fluss, E.; Sarzi-Puttini, P.; Macfarlane, G.J. The prevalence of fibromyalgia in the general population: A comparison of the American College of Rheumatology 1990, 2010, and modified 2010 classification criteria. Arthritis Rheumatol. 2015, 67, 568–575. [Google Scholar] [CrossRef]
- Hazra, S.; Venkataraman, S.; Handa, G.; Yadav, S.L.; Wadhwa, S.; Singh, U.; Kochhar, K.P.; Deepak, K.K.; Sarkar, K. A Cross-Sectional Study on Central Sensitization and Autonomic Changes in Fibromyalgia. Front. Neurosci. 2020, 14, 788. [Google Scholar] [CrossRef]
- Dadabhoy, D.; Crofford, L.J.; Spaeth, M.; Russell, I.J.; Clauw, D.J. Biology and therapy of fibromyalgia. Evidence-based biomarkers for fibromyalgia syndrome. Arthritis Res. Ther. 2008, 10, 211. [Google Scholar] [CrossRef] [PubMed]
- Turk, D.C.; Okifuji, A.; Sinclair, J.D.; Starz, T.W. Differential responses by psychosocial subgroups of fibromyalgia syndrome patients to an interdisciplinary treatment. Arthritis Care Res. 1998, 11, 397–404. [Google Scholar] [CrossRef] [PubMed]
- Homma, M.; Ishikawa, H.; Kiuchi, T. Association of physicians’ illness perception of fibromyalgia with frustration and resistance to accepting patients: A cross-sectional study. Clin. Rheumatol. 2016, 35, 1019–1027. [Google Scholar] [CrossRef] [PubMed]
- Fernandez-de-Las-Penas, C.; Valera-Calero, J.A.; Arendt-Nielsen, L.; Martin-Guerrero, J.D.; Cigaran-Mendez, M.; Navarro-Pardo, E.; Pellicer-Valero, O.J. Clustering Analysis Identifies Two Subgroups of Women with Fibromyalgia with Different Psychological, Cognitive, Health-Related and Physical Features but Similar Widespread Pressure Pain Sensitivity. Pain Med. 2022, 24, 881–889. [Google Scholar] [CrossRef]
- Yim, Y.R.; Lee, K.E.; Park, D.J.; Kim, S.H.; Nah, S.S.; Lee, J.H.; Kim, S.K.; Lee, Y.A.; Hong, S.J.; Kim, H.S.; et al. Identifying fibromyalgia subgroups using cluster analysis: Relationships with clinical variables. Eur. J. Pain 2017, 21, 374–384. [Google Scholar] [CrossRef] [PubMed]
- Docampo, E.; Collado, A.; Escaramis, G.; Carbonell, J.; Rivera, J.; Vidal, J.; Alegre, J.; Rabionet, R.; Estivill, X. Cluster analysis of clinical data identifies fibromyalgia subgroups. PLoS ONE 2013, 8, e74873. [Google Scholar] [CrossRef] [PubMed]
- Vincent, A.; Hoskin, T.L.; Whipple, M.O.; Clauw, D.J.; Barton, D.L.; Benzo, R.P.; Williams, D.A. OMERACT-based fibromyalgia symptom subgroups: An exploratory cluster analysis. Arthritis Res. Ther. 2014, 16, 463. [Google Scholar] [CrossRef] [PubMed]
- Tenti, M.; Raffaeli, W.; Malafoglia, V.; Paroli, M.; Ilari, S.; Muscoli, C.; Fraccaroli, E.; Bongiovanni, S.; Gioia, C.; Iannuccelli, C.; et al. Common-sense model of self-regulation to cluster fibromyalgia patients: Results from a cross-sectional study in Italy. Clin. Exp. Rheumatol. 2022, 40, 1175–1182. [Google Scholar] [CrossRef]
- El-Rabbat, M.S.; Mahmoud, N.K.; Gheita, T.A. Clinical significance of fibromyalgia syndrome in different rheumatic diseases: Relation to disease activity and quality of life. Reumatol. Clin. 2018, 14, 285–289. [Google Scholar] [CrossRef]
- Jiao, J.; Vincent, A.; Cha, S.S.; Luedtke, C.A.; Kim, C.H.; Oh, T.H. Physical Trauma and Infection as Precipitating Factors in Patients with Fibromyalgia. Am. J. Phys. Med. Rehabil. 2015, 94, 1075–1082. [Google Scholar] [CrossRef] [PubMed]
- Gardoki-Souto, I.; Redolar-Ripoll, D.; Fontana, M.; Hogg, B.; Castro, M.J.; Blanch, J.M.; Ojeda, F.; Solanes, A.; Radua, J.; Valiente-Gomez, A.; et al. Prevalence and Characterization of Psychological Trauma in Patients with Fibromyalgia: A Cross-Sectional Study. Pain Res. Manag. 2022, 2022, 2114451. [Google Scholar] [CrossRef]
- Smiti, A. When machine learning meets medical world: Current status and future challenges. Comput. Sci. Rev. 2020, 37, 100280. [Google Scholar] [CrossRef]
- Handelman, G.S.; Kok, H.K.; Chandra, R.V.; Razavi, A.H.; Lee, M.J.; Asadi, H. eDoctor: Machine learning and the future of medicine. J. Intern. Med. 2018, 284, 603–619. [Google Scholar] [CrossRef]
- Ahmedt-Aristizabal, D.; Armin, M.A.; Denman, S.; Fookes, C.; Petersson, L. Graph-Based Deep Learning for Medical Diagnosis and Analysis: Past, Present and Future. Sensors 2021, 21, 4758. [Google Scholar] [CrossRef]
- Cerquitelli, T.; Meo, M.; Curado, M.; Skorin-Kapov, L.; Tsiropoulou, E.E. Machine Learning Empowered Computer Networks. Comput. Netw. 2023, 230, 109807. [Google Scholar]
- Lukauskas, M.; Ruzgas, T. Data clustering and its applications in medicine. New Trends in Mathematical Science. New Trends Math. Sci. 2022, 10, 067–070. [Google Scholar] [CrossRef]
- Huang, L.; Shea, A.L.; Qian, H.; Masurkar, A.; Deng, H.; Liu, D. Patient clustering improves efficiency of federated machine learning to predict mortality and hospital stay time using distributed electronic medical records. J. Biomed. Inform. 2019, 99, 103291. [Google Scholar] [CrossRef] [PubMed]
- Al-Shammari, A.; Zhou, R.; Naseriparsaa, M.; Liu, C. An effective density-based clustering and dynamic maintenance framework for evolving medical data streams. Int. J. Med. Inform. 2019, 126, 176–186. [Google Scholar] [CrossRef] [PubMed]
- Almoznino, G.; Shahar, Y. Rheumatic Monitor. Available online: https://www.rheumaticmonitor.org/ (accessed on 1 January 2024).
- Pedregosa, F.; Varoquaux, G.; Gramfort, A.; Michel, V.; Thirion, B.; Grisel, O.; Blondel, M.; Prettenhofer, P.; Weiss, R.; Dubourg, V.; et al. Scikit-Learn: Machine Learning in Python. J. Mach. Learn. Res. 2011, 12, 2825–2830. [Google Scholar]
- Abdelaziz, S.; Lu, S. K-means algorithm with level set for brain tumor segmentation. Indones. J. Electr. Eng. Comput. Sci. 2019, 15, 991–1000. [Google Scholar] [CrossRef]
- Hossain, M.; Akhtar, M.; Ahmad, R.B.; Rahman, M. A dynamic K-means clustering for data mining. Indones. J. Electr. Eng. Comput. Sci. 2019, 13, 521–526. [Google Scholar]
- Celeux, G.; Govaert, G. A classification EM algorithm for clustering and two stochastic versions. Comput. Stat. Data Anal. 1992, 14, 315–332. [Google Scholar] [CrossRef]
- Celeux, G.; Govaert, G. Gaussian parsimonious clustering models. Pattern Recognit. 1995, 28, 781–793. [Google Scholar] [CrossRef]
- Eisen, M.; Spellman, P.; Brown, P.; Botstein, D. Cluster analysis and display of genome-wide expression patterns. Proc. Natl. Acad. Sci. USA 1998, 95, 14863–14868. [Google Scholar] [CrossRef] [PubMed]
- Jarman, A.M. Hierarchical Cluster Analysis: Comparison of Single Linkage, Complete Linkage, Average Linkage and Centroid Linkage Method; Georgia Southern University: Statesboro, GA, USA, 2020. [Google Scholar]
- Gower, J.C. A General Coefficient of Similarity and Some of Its Properties. Biometrics 1971, 27, 859. [Google Scholar]
- Rousseeuw, P.J. Silhouettes: A Graphical Aid to the Interpretation and Validation of Cluster Analysis. J. Comput. Appl. Math. 1987, 20, 53–65. [Google Scholar] [CrossRef]
- Starczewski, A.; Krzyżak, A. Performance Evaluation of the Silhouette Index. In Proceedings of the ICAISC 2015: Artificial Intelligence and Soft Computing, Zakopane, Poland, 14–18 June 2015; Rutkowski, L., Korytkowski, M., Scherer, R., Tadeusiewicz, R., Zadeh, L., Zurada, J., Eds.; Lecture Notes in Computer Science; Springer: Cham, Switzerland, 2015. [Google Scholar]
- Davies, D.L.; Bouldin, D.W. A Cluster Separation Measure. IEEE Trans. Pattern Anal. Mach. Intell. 1979, 2, 224–227. [Google Scholar]
- Caliński, T.; Harabasz, J. A dendrite method for cluster analysis. Commun. Stat. 1974, 3, 1–27. [Google Scholar]
- Ben-Hur, A.; Elisseeff, A.; Guyon, I. A stability based method for discovering structure in clustered data. Pac. Symp. Biocomput. 2002, 7, 6–17. [Google Scholar]
- Lange, T.; Roth, V.; Braun, M.L.; Buhmann, J.M. Stability-based validation of clustering solutions. Neural Comput. 2004, 16, 1299–1323. [Google Scholar] [CrossRef] [PubMed]
- Hennig, C. Cluster-wise assessment of cluster stability. Comput. Stat. Data Anal. 2007, 52, 258–271. [Google Scholar] [CrossRef]
- Jolliffe, I.T. (Ed.) Principal Component Analysis; Wiley: Hoboken, NJ, USA, 2002. [Google Scholar]
- Jolliffe, I.T. Principal component analysis and factor analysis. Stat. Methods Med. Res. 1986, 5, 69–95. [Google Scholar]

| Intra-Algorithm adj. Rand Index | k = 2 | k = 3 | K = 4 | K = 5 | Intra-Algorithm adj. Rand Index | k = 2 | k = 3 | k = 4 | k = 5 |
|---|---|---|---|---|---|---|---|---|---|
| K-means | 0.998 | 0.977 | 0.893 | 0.722 | K-means, Gaussian | 0.751 | 0.615 | 0.590 | 0.574 |
| Gaussian | 0.990 | 0.747 | 0.673 | 0.597 | K-means Gower, Gaussian Gower | 0.764 | 0.743 | 0.931 | 0.900 |
| K-means Gower | 1 | 0.999 | 1 | 0.985 | K-means Gower, Gaussian | 0.756 | 0.537 | 0.561 | 0.525 |
| Gaussian Gower | 1 | 0.739 | 0882 | 0.80 | K-means, Gaussian Gower | 0.751 | 0.674 | 0.6239 | 0.543 |
| Gaussian X Gaussian Gower | 0.978 | 0.609 | 0.558 | 0.518 | AggWard, K-means | 0.764 | 0.743 | 0.93 | 0.9007 |
| K-means X K-means Gower | 0.944 | 0.819 | 0.642 | 0.546 | AggWard, gaussian | 0.520 | 0.367 | 0.33 | 0.297 |
| AggWard | 1 | 1 | 1 | 1 | AggComplete, K-means | −0.0001 | −0.0002 | 0.0013 | 0.0068 |
| AggComplete | 1 | 1 | 1 | 1 | Agg Complete, Gaussian | 0.00005 | 0.0005 | 0.0045 | 0.0106 |
| AggAverage | 1 | 1 | 1 | 1 | Agg Average, K-means | −0.0001 | 0.0020 | 0.0008 | 0.0014 |
| AggComplete Gower | 1 | 1 | 1 | 1 | Agg Average, Gaussian | 0.00005 | 0.0018 | 0.0025 | 0.0018 |
| AggAvg Gower | 1 | 1 | 1 | 1 | Agg Single, K-means | −0.0001 | −0.0002 | 0.0005 | 0.0013 |
Disclaimer/Publisher’s Note: The statements, opinions and data contained in all publications are solely those of the individual author(s) and contributor(s) and not of MDPI and/or the editor(s). MDPI and/or the editor(s) disclaim responsibility for any injury to people or property resulting from any ideas, methods, instructions or products referred to in the content. |
© 2024 by the authors. Licensee MDPI, Basel, Switzerland. This article is an open access article distributed under the terms and conditions of the Creative Commons Attribution (CC BY) license (https://creativecommons.org/licenses/by/4.0/).
Share and Cite
Goldstein, A.; Shahar, Y.; Weisman Raymond, M.; Peleg, H.; Ben-Chetrit, E.; Ben-Yehuda, A.; Shalom, E.; Goldstein, C.; Shiloh, S.S.; Almoznino, G. Multi-Dimensional Validation of the Integration of Syntactic and Semantic Distance Measures for Clustering Fibromyalgia Patients in the Rheumatic Monitor Big Data Study. Bioengineering 2024, 11, 97. https://doi.org/10.3390/bioengineering11010097
Goldstein A, Shahar Y, Weisman Raymond M, Peleg H, Ben-Chetrit E, Ben-Yehuda A, Shalom E, Goldstein C, Shiloh SS, Almoznino G. Multi-Dimensional Validation of the Integration of Syntactic and Semantic Distance Measures for Clustering Fibromyalgia Patients in the Rheumatic Monitor Big Data Study. Bioengineering. 2024; 11(1):97. https://doi.org/10.3390/bioengineering11010097
Chicago/Turabian StyleGoldstein, Ayelet, Yuval Shahar, Michal Weisman Raymond, Hagit Peleg, Eldad Ben-Chetrit, Arie Ben-Yehuda, Erez Shalom, Chen Goldstein, Shmuel Shay Shiloh, and Galit Almoznino. 2024. "Multi-Dimensional Validation of the Integration of Syntactic and Semantic Distance Measures for Clustering Fibromyalgia Patients in the Rheumatic Monitor Big Data Study" Bioengineering 11, no. 1: 97. https://doi.org/10.3390/bioengineering11010097
APA StyleGoldstein, A., Shahar, Y., Weisman Raymond, M., Peleg, H., Ben-Chetrit, E., Ben-Yehuda, A., Shalom, E., Goldstein, C., Shiloh, S. S., & Almoznino, G. (2024). Multi-Dimensional Validation of the Integration of Syntactic and Semantic Distance Measures for Clustering Fibromyalgia Patients in the Rheumatic Monitor Big Data Study. Bioengineering, 11(1), 97. https://doi.org/10.3390/bioengineering11010097