

PCA of Running Biomechanics after 5 km between Novice and Experienced Runners

 ,
,  ,
,  and
and 
Abstract
1. Introduction
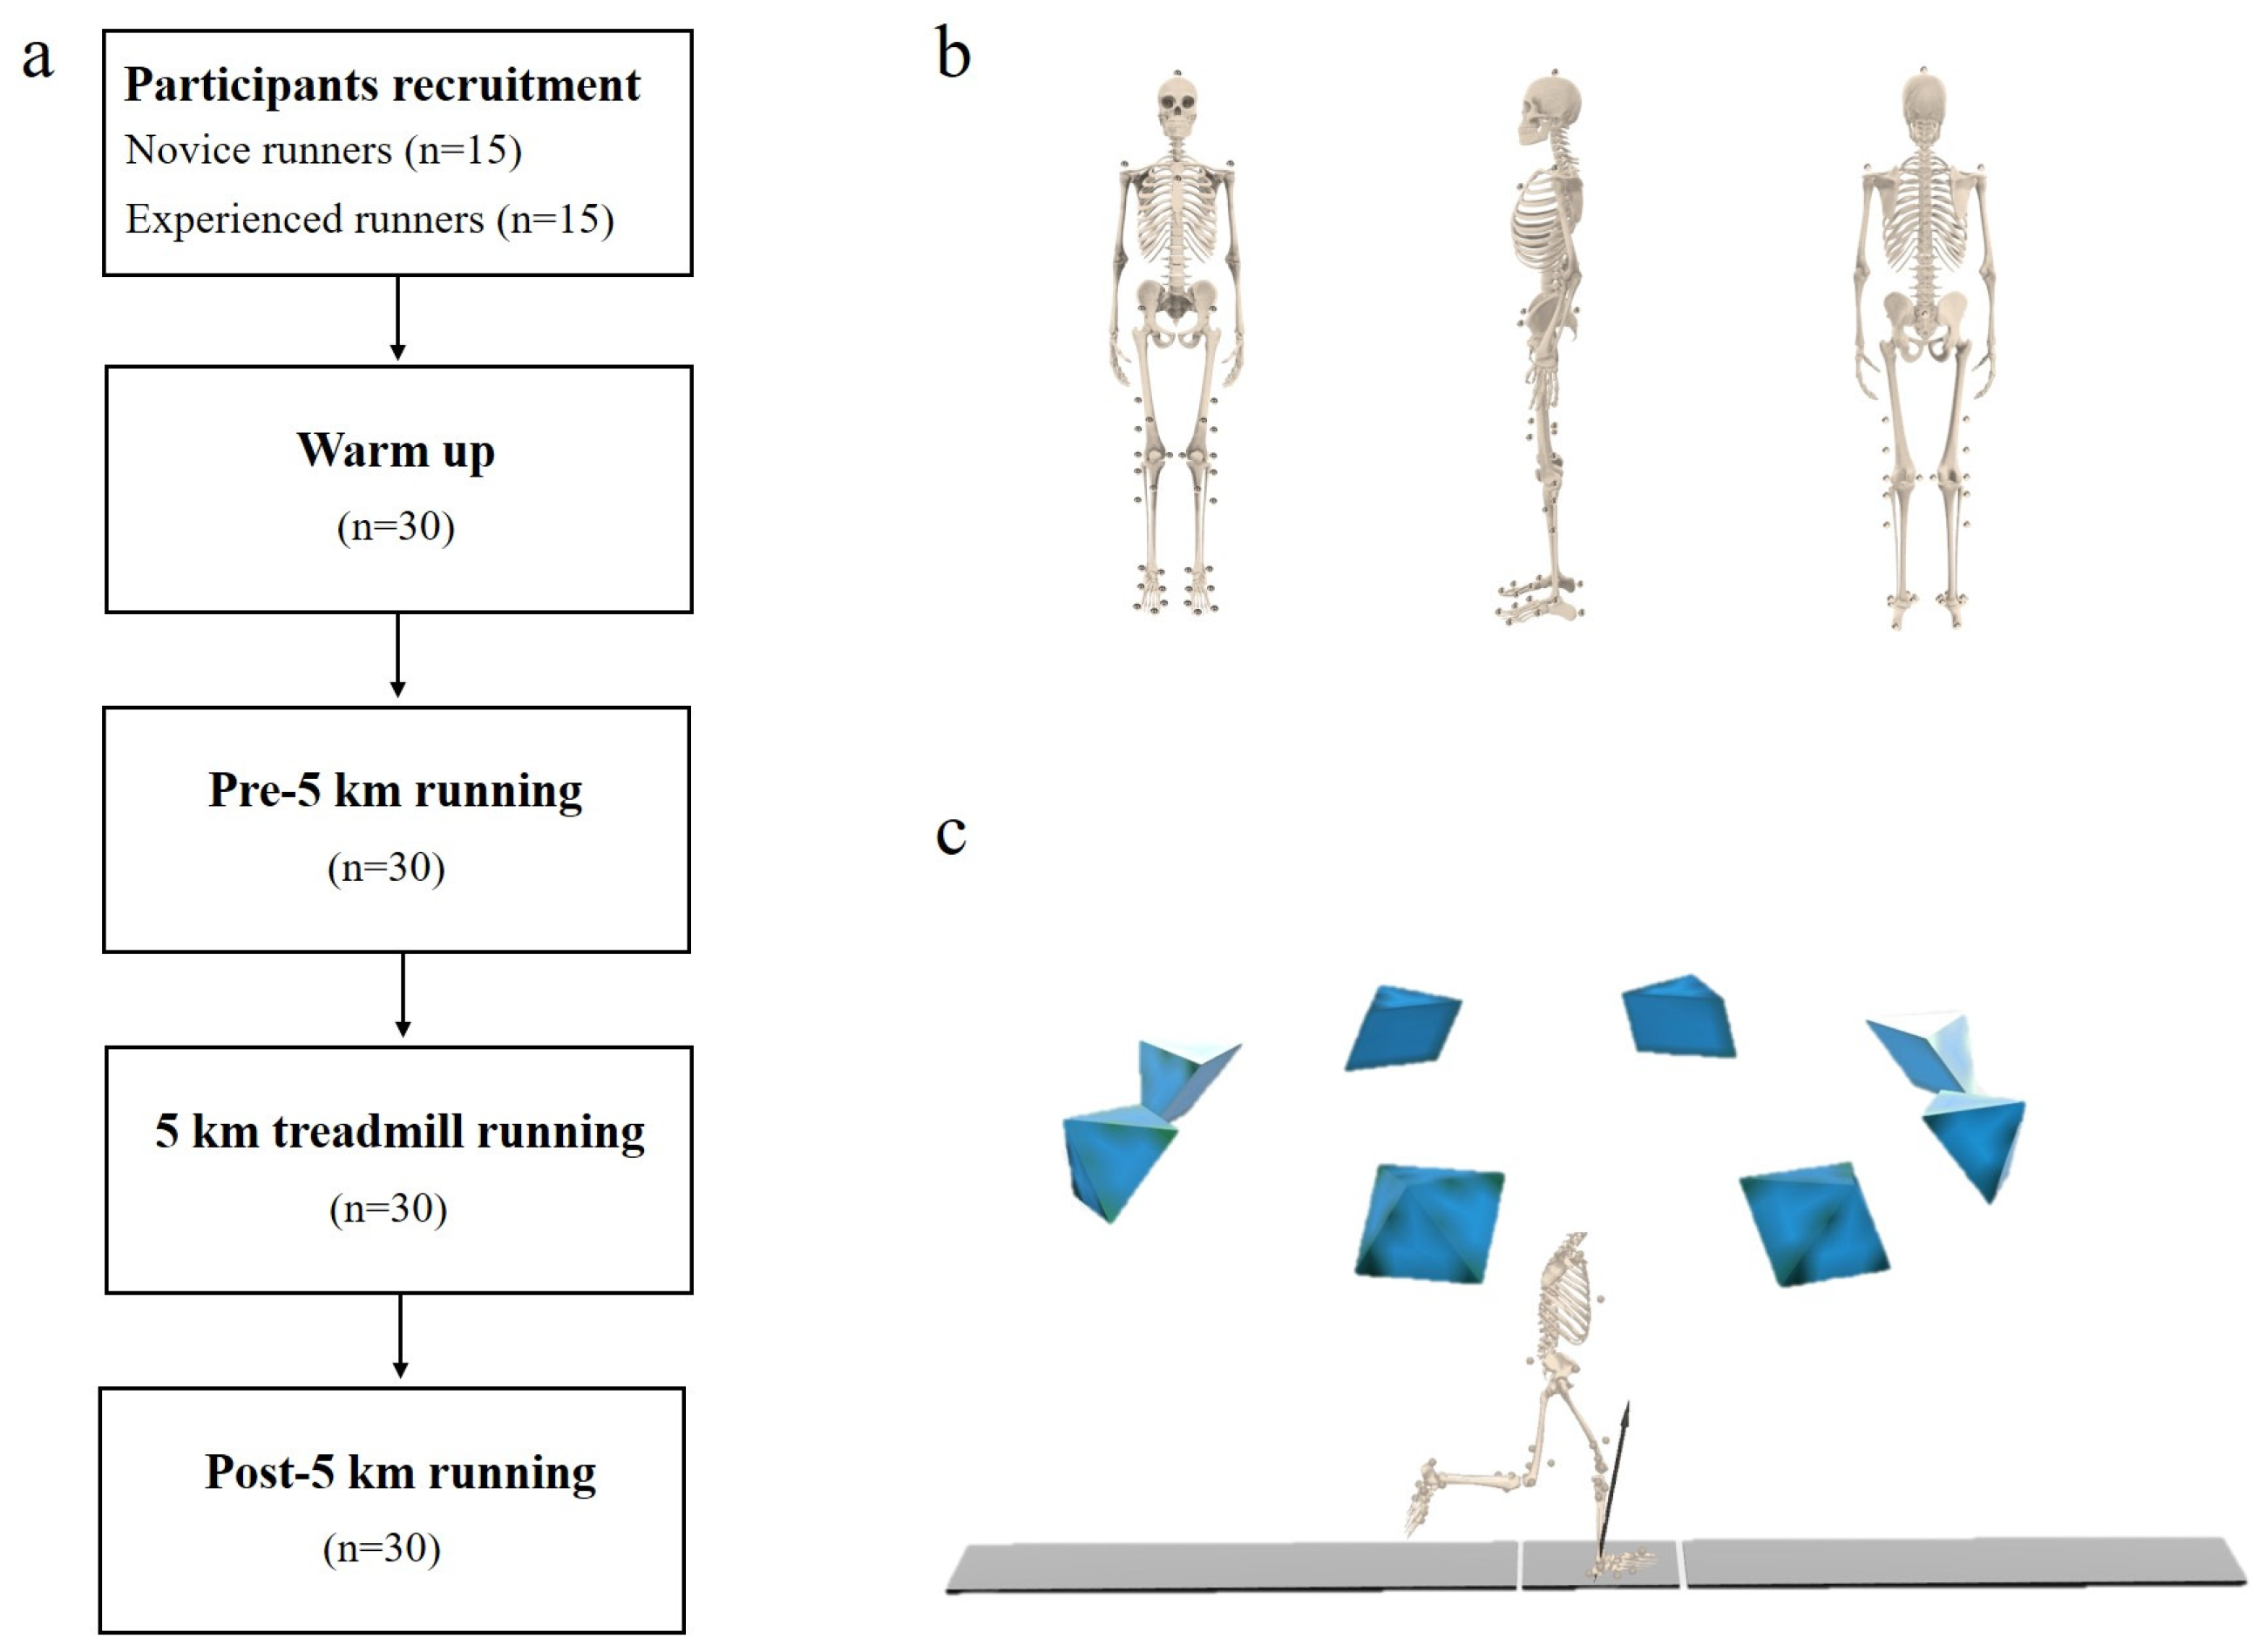
2. Materials and Methods
2.1. Participants
2.2. Experimental Procedures
2.3. Data Analysis
2.4. Statistical Analysis
3. Results
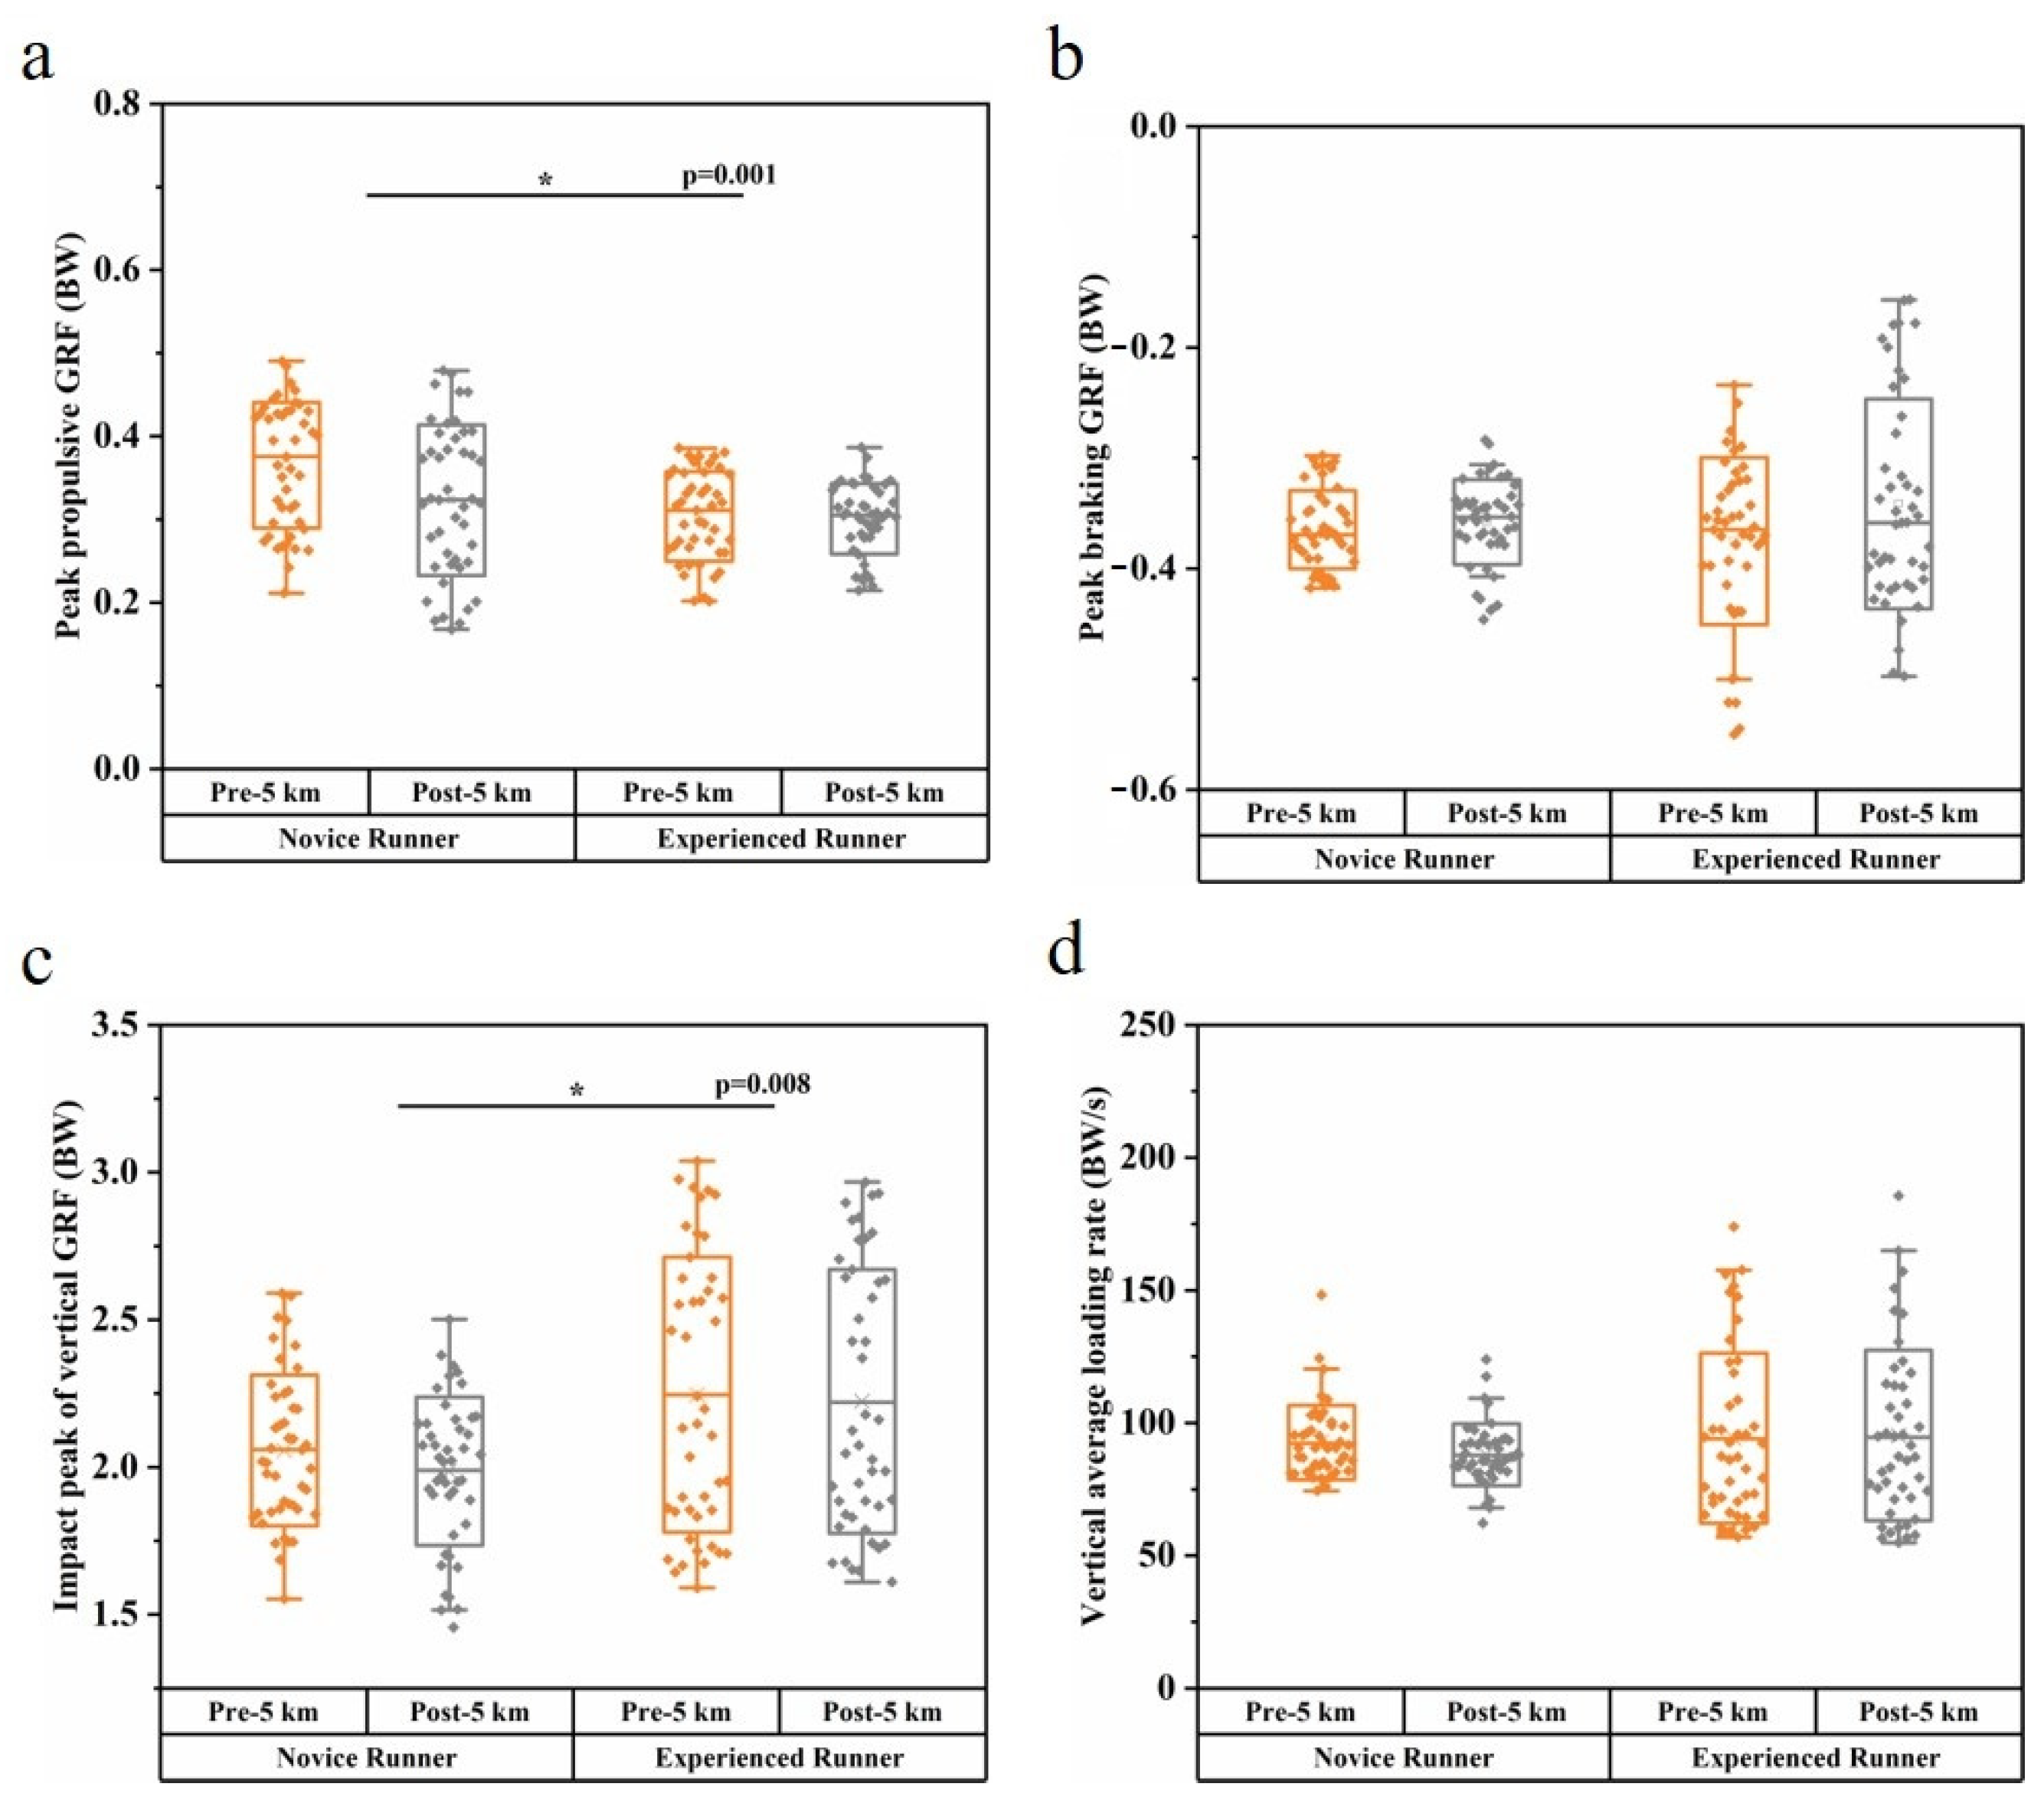
3.1. Discrete Variables
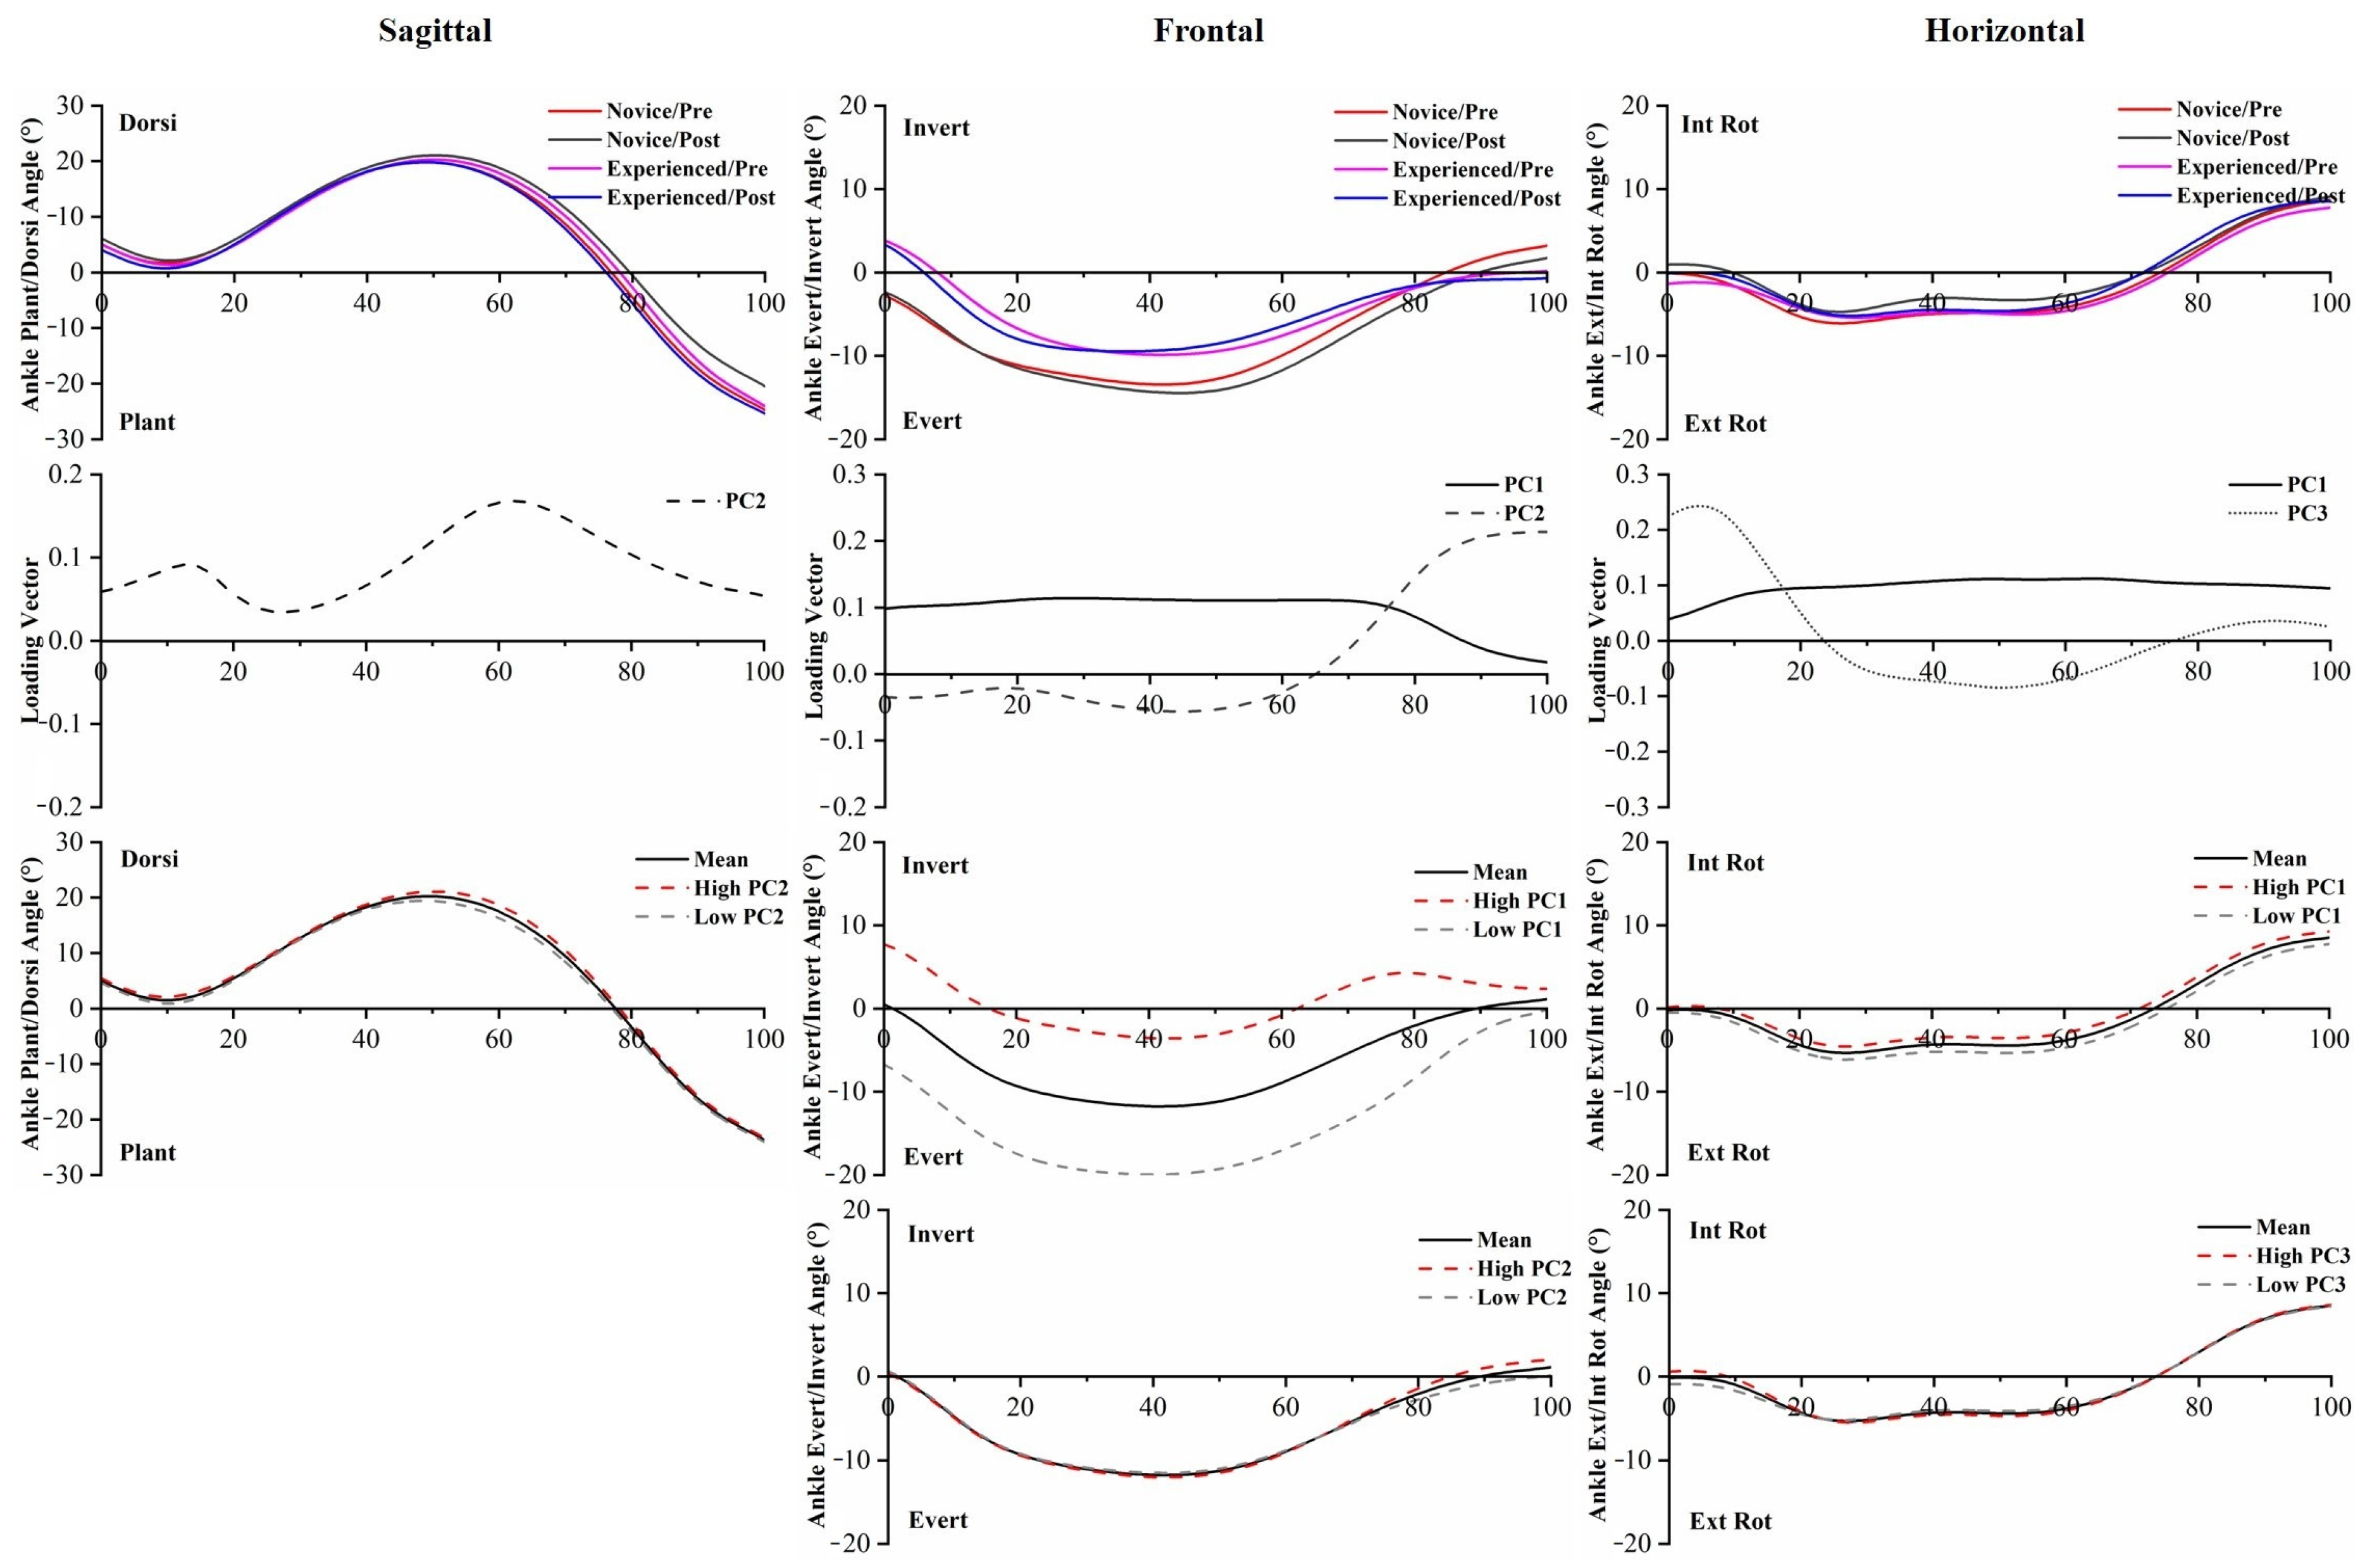
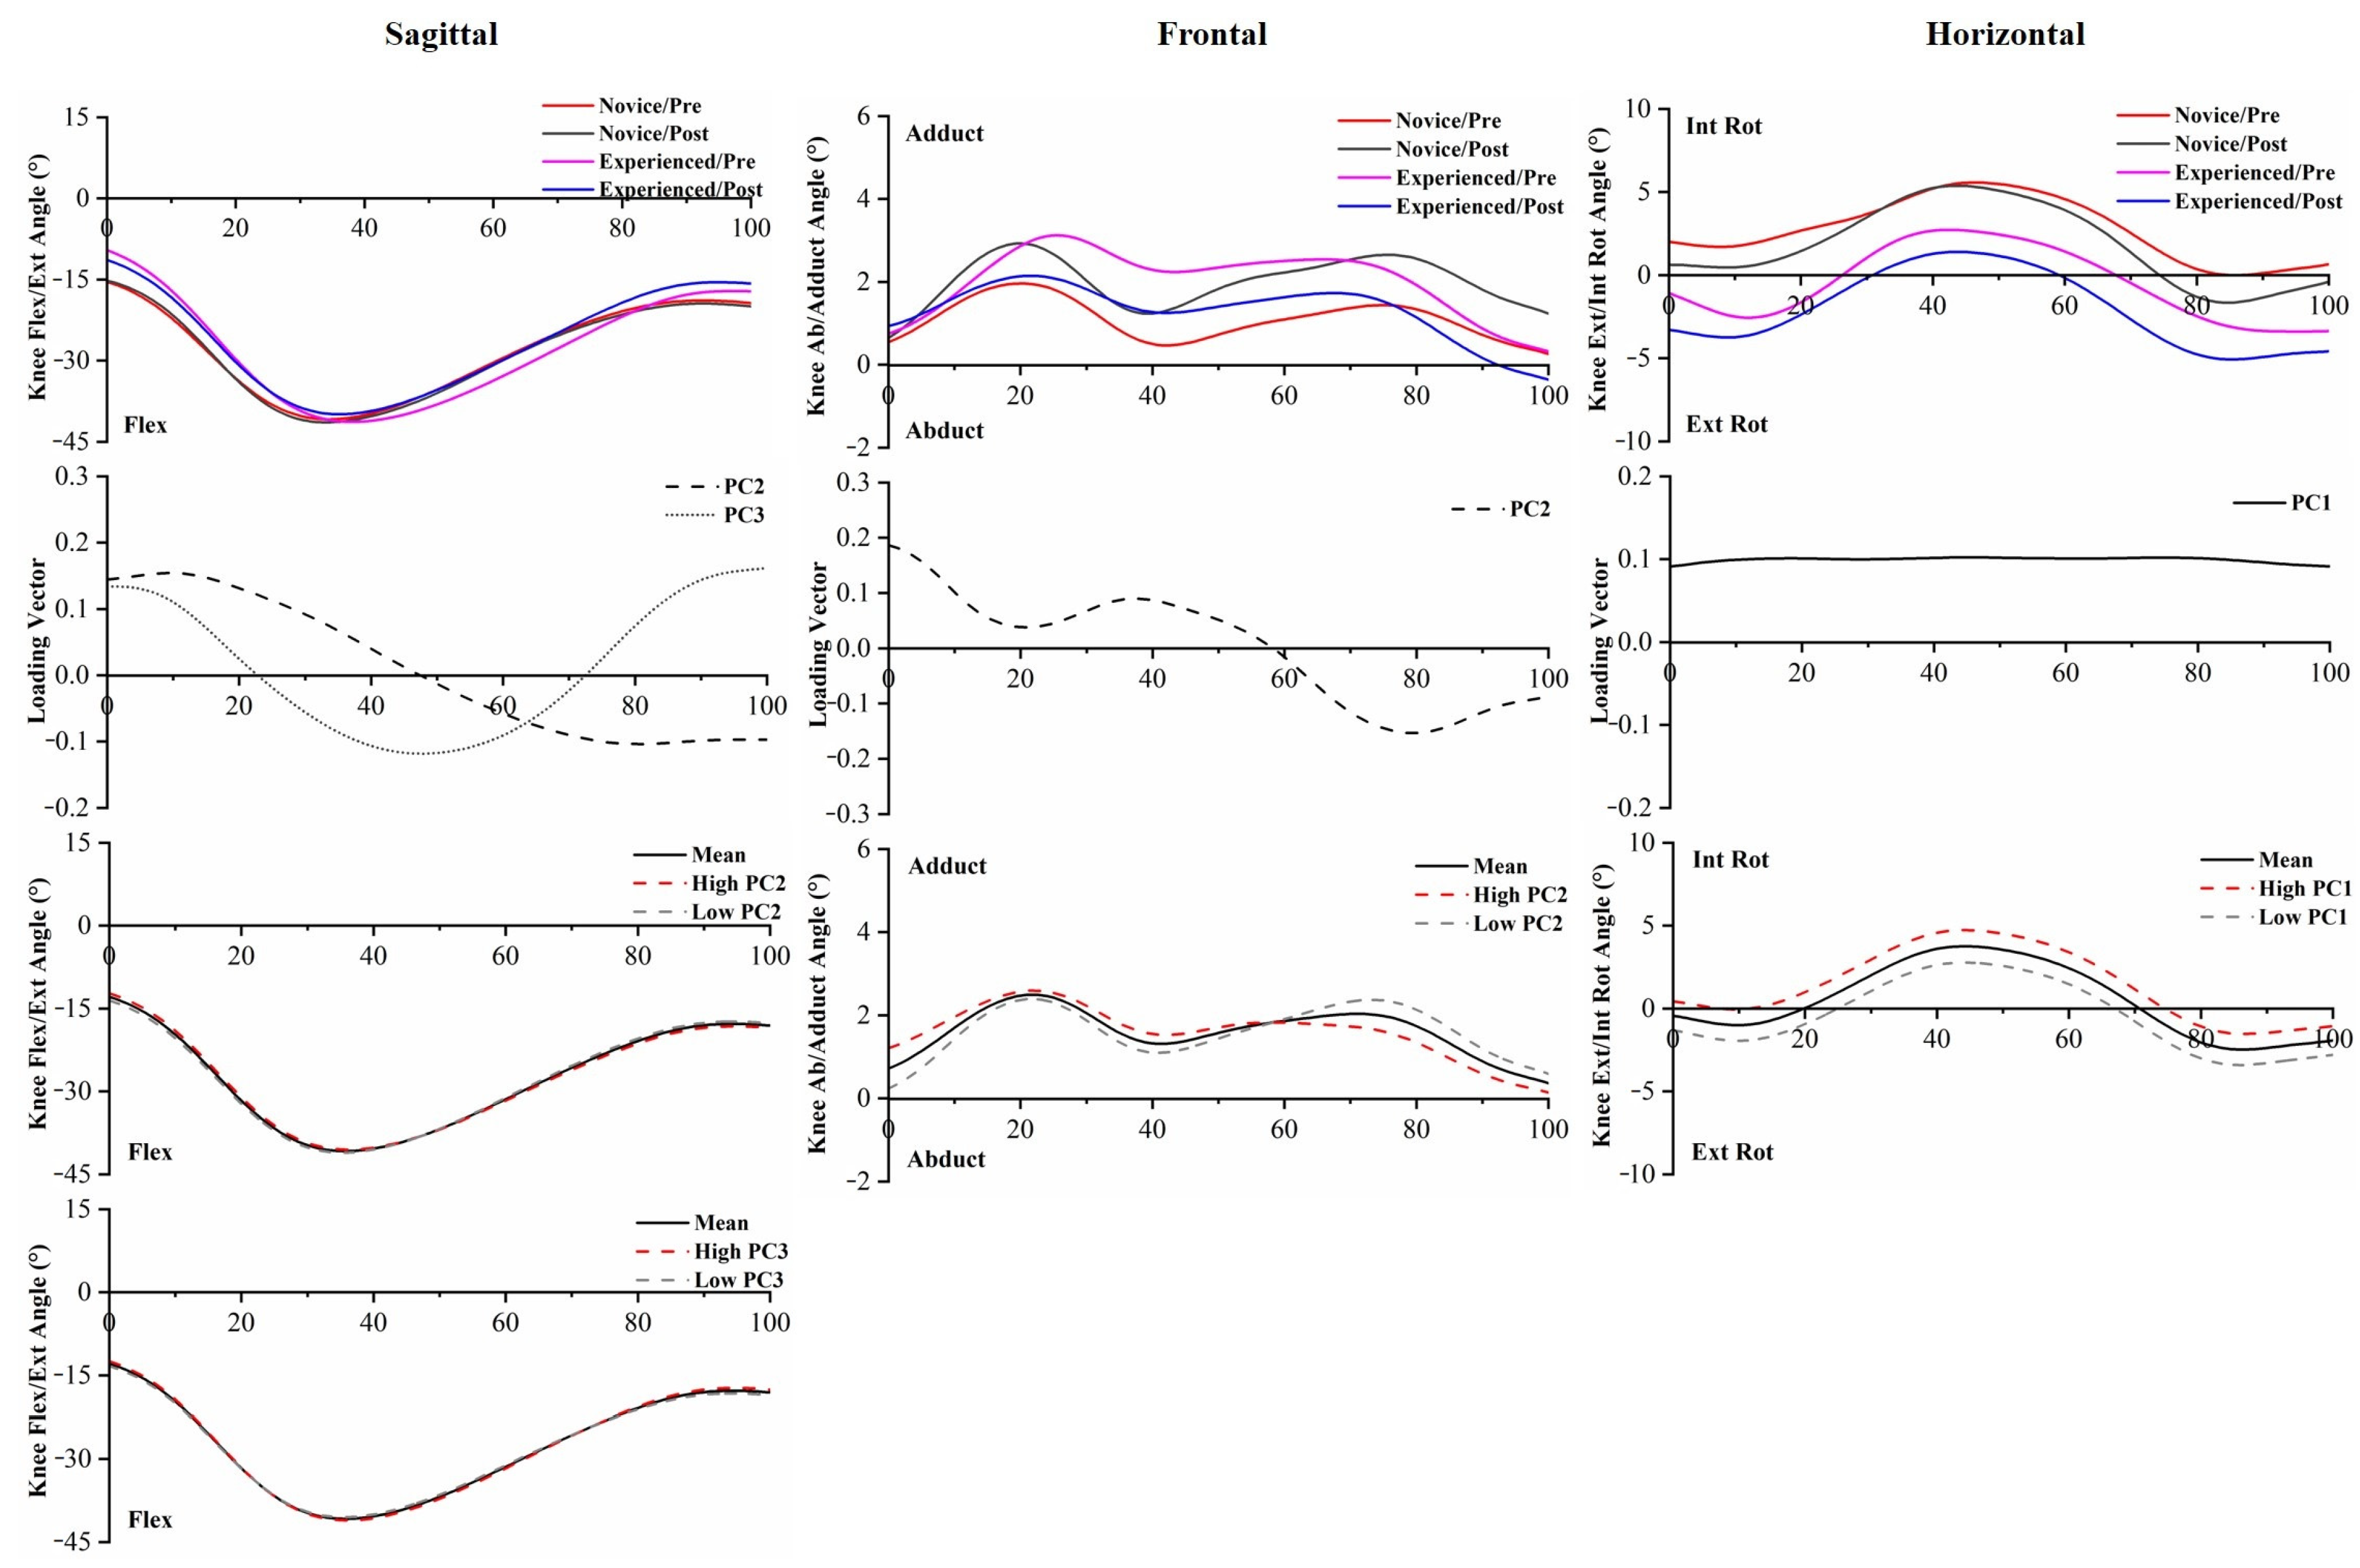
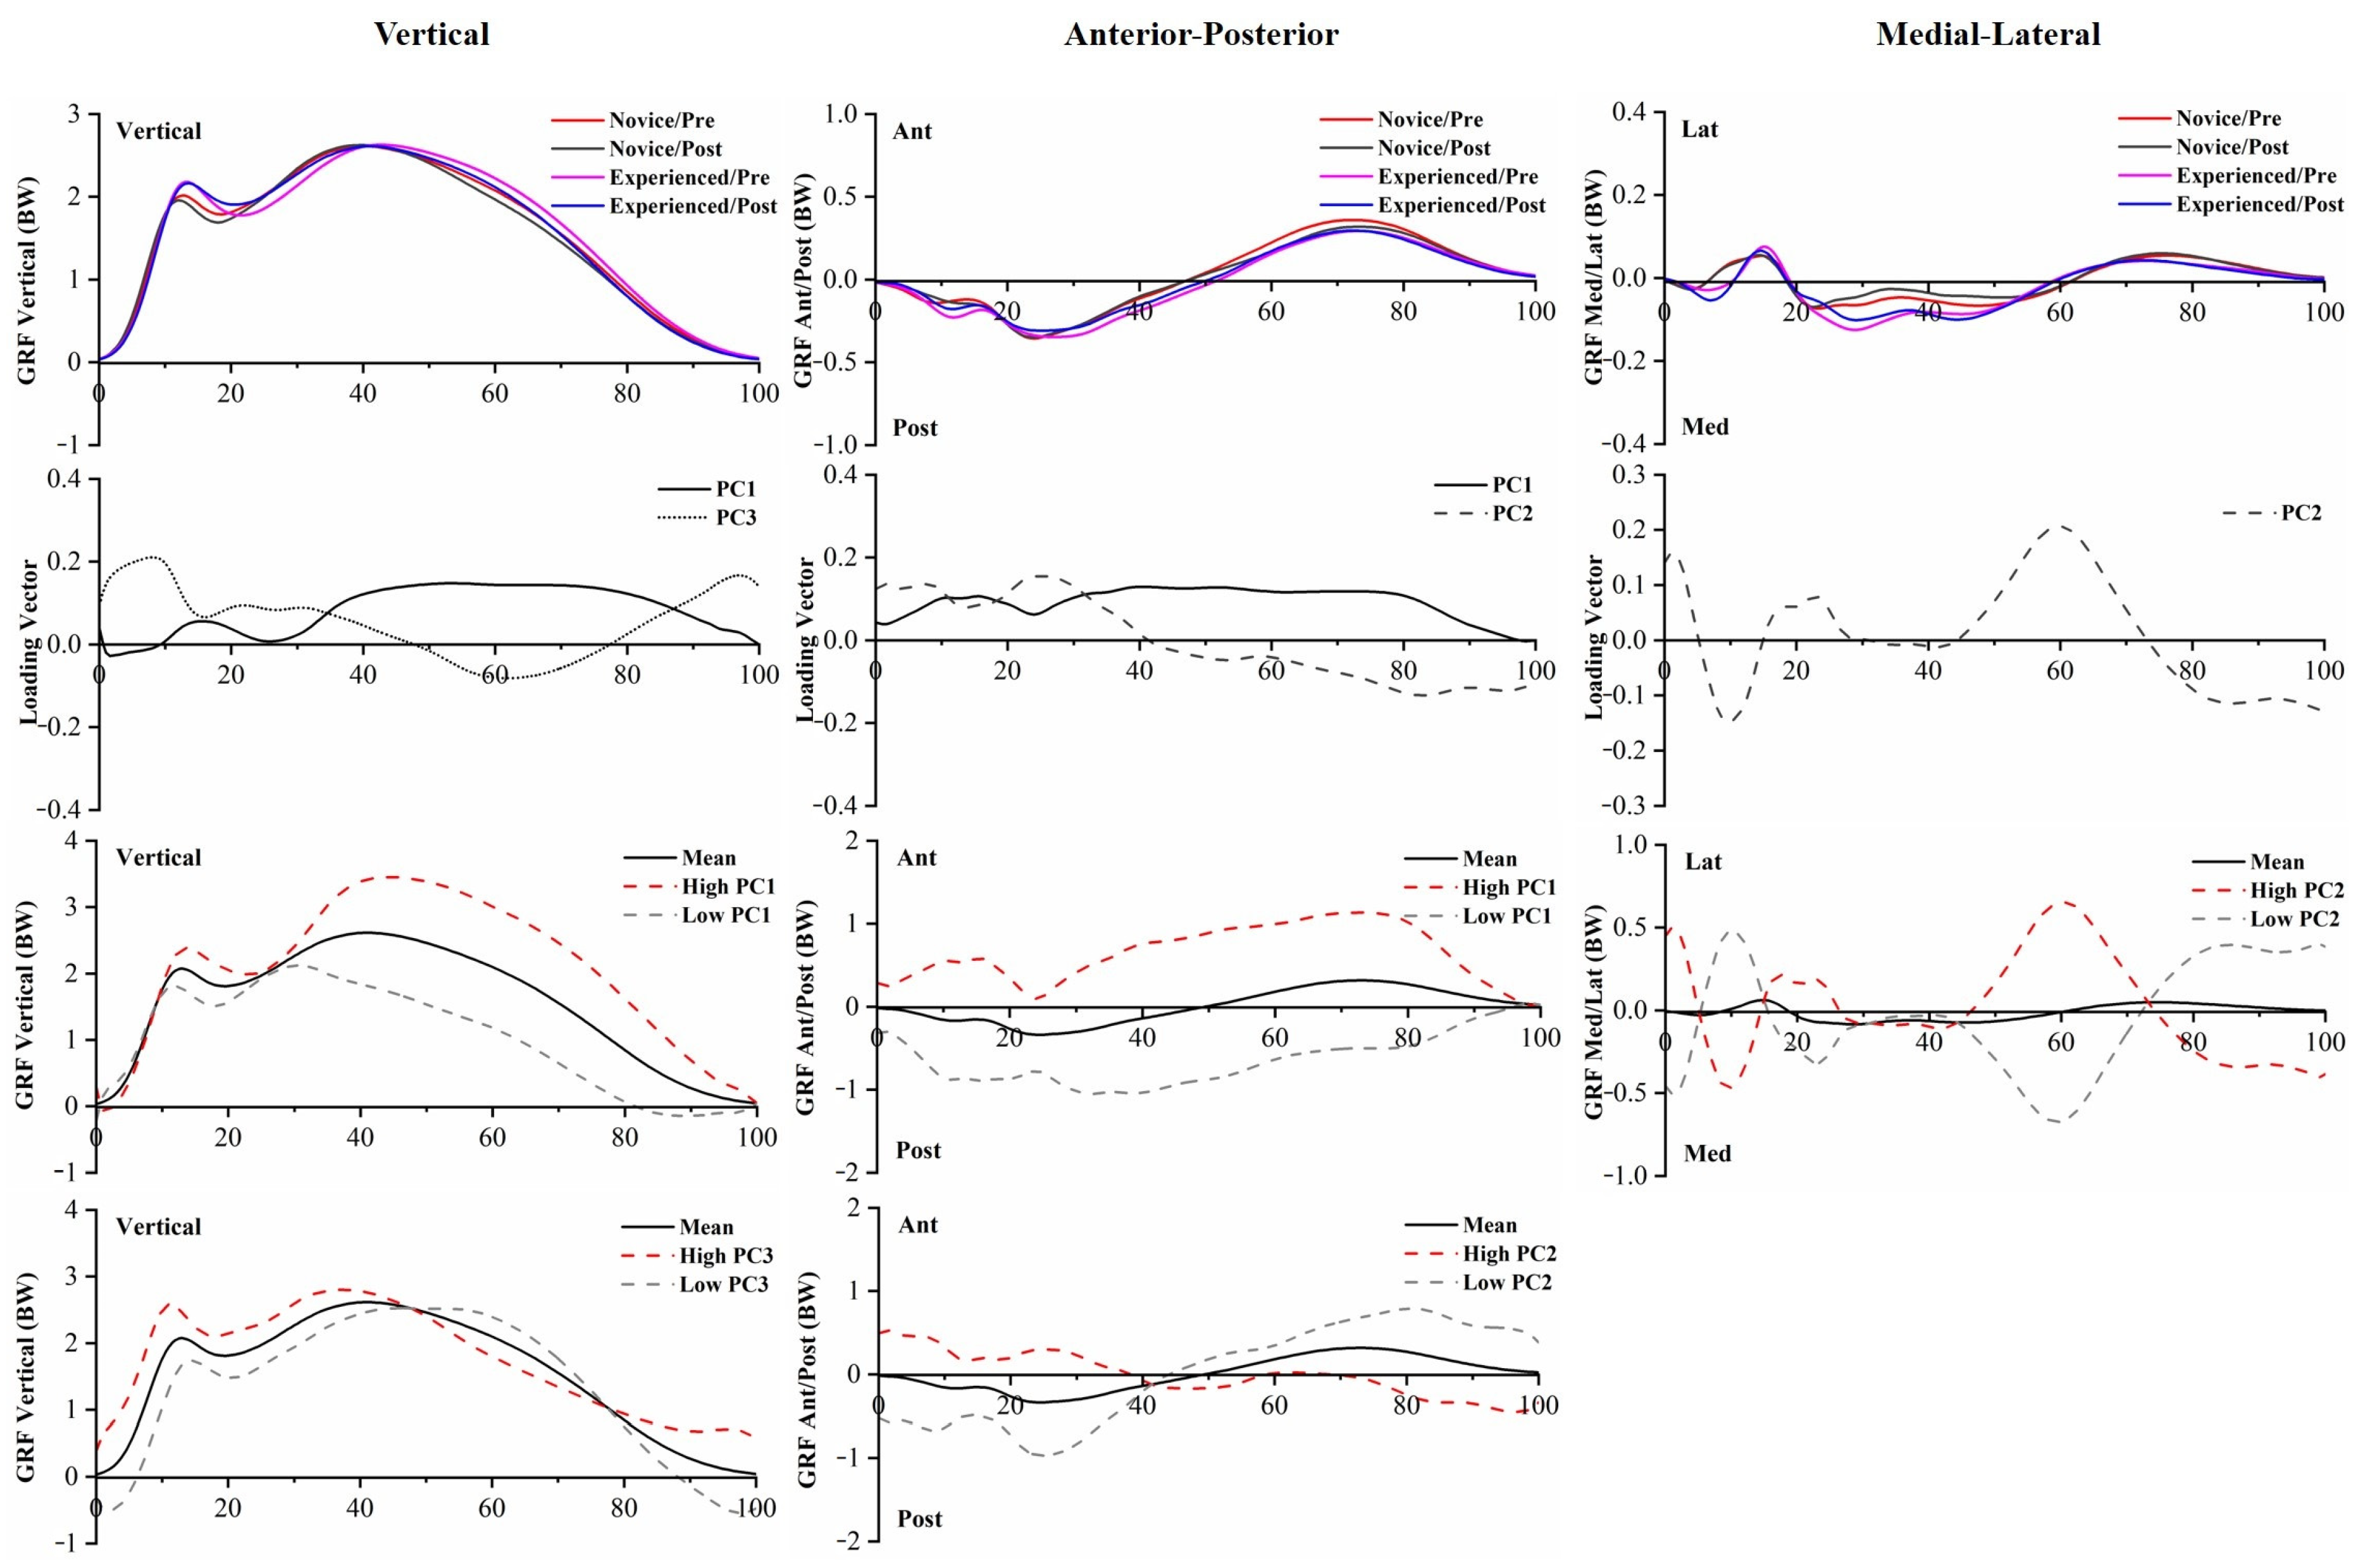
3.2. PCA
4. Discussion
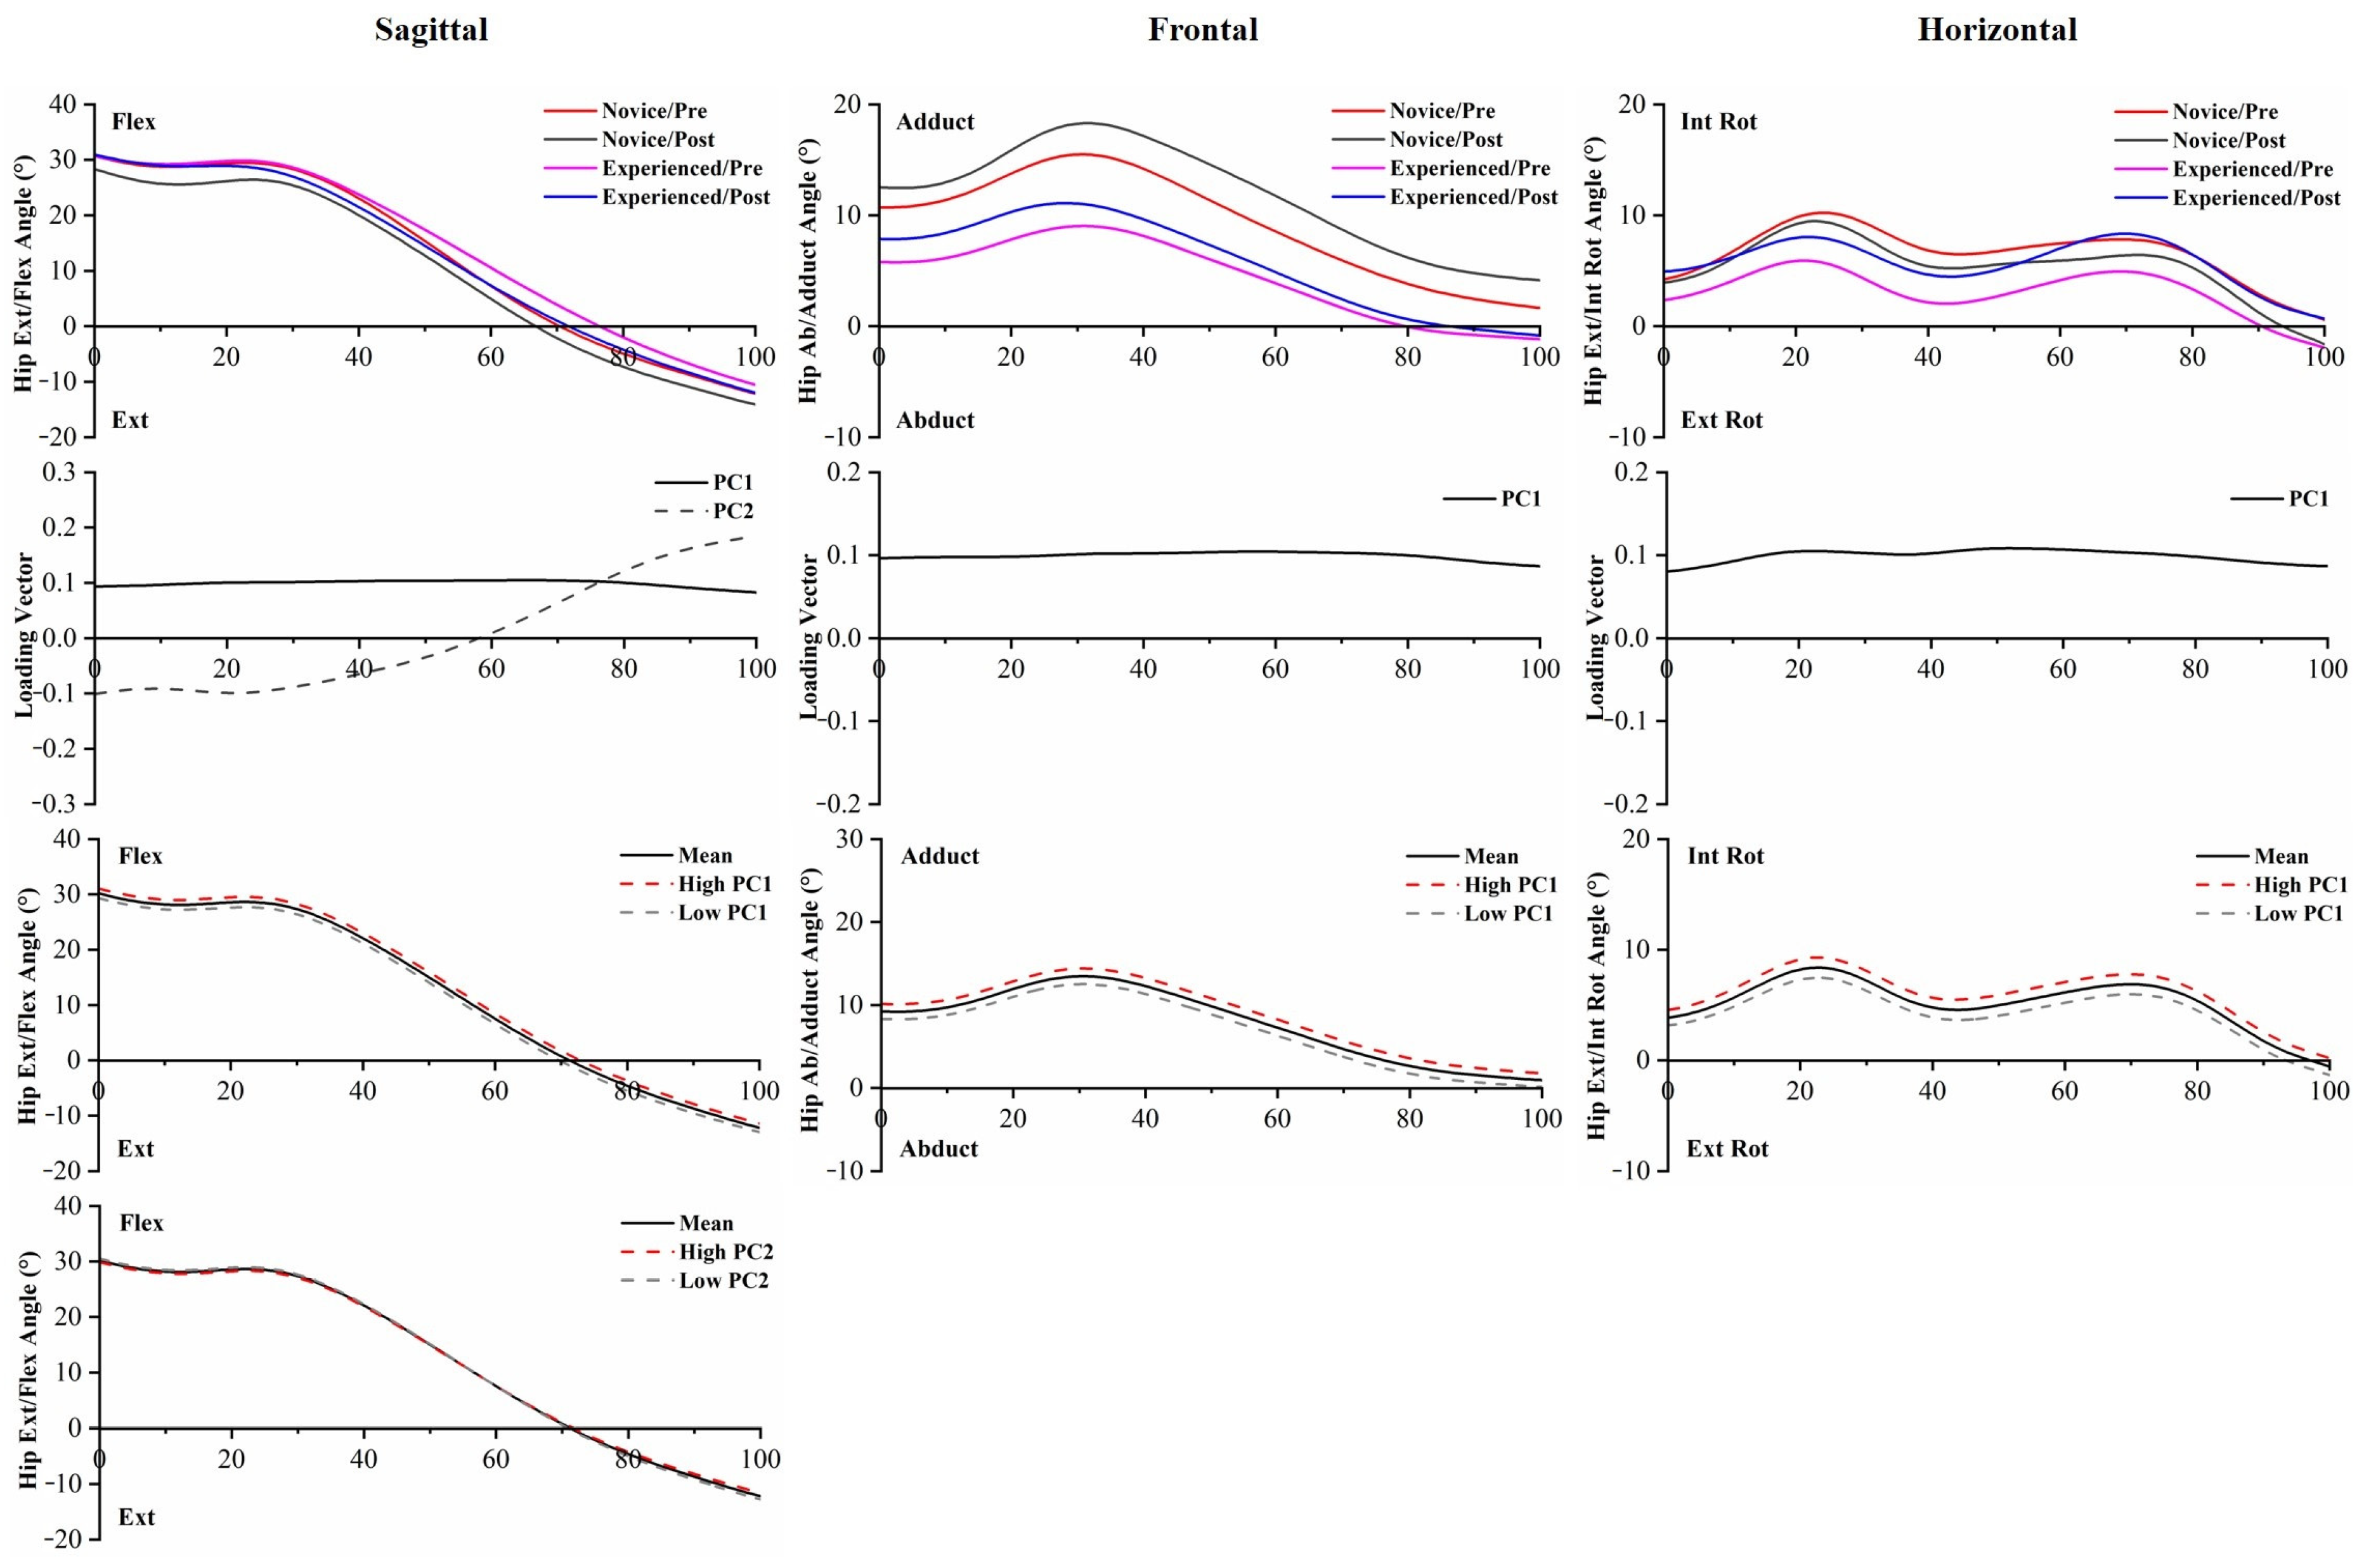
4.1. Kinematics
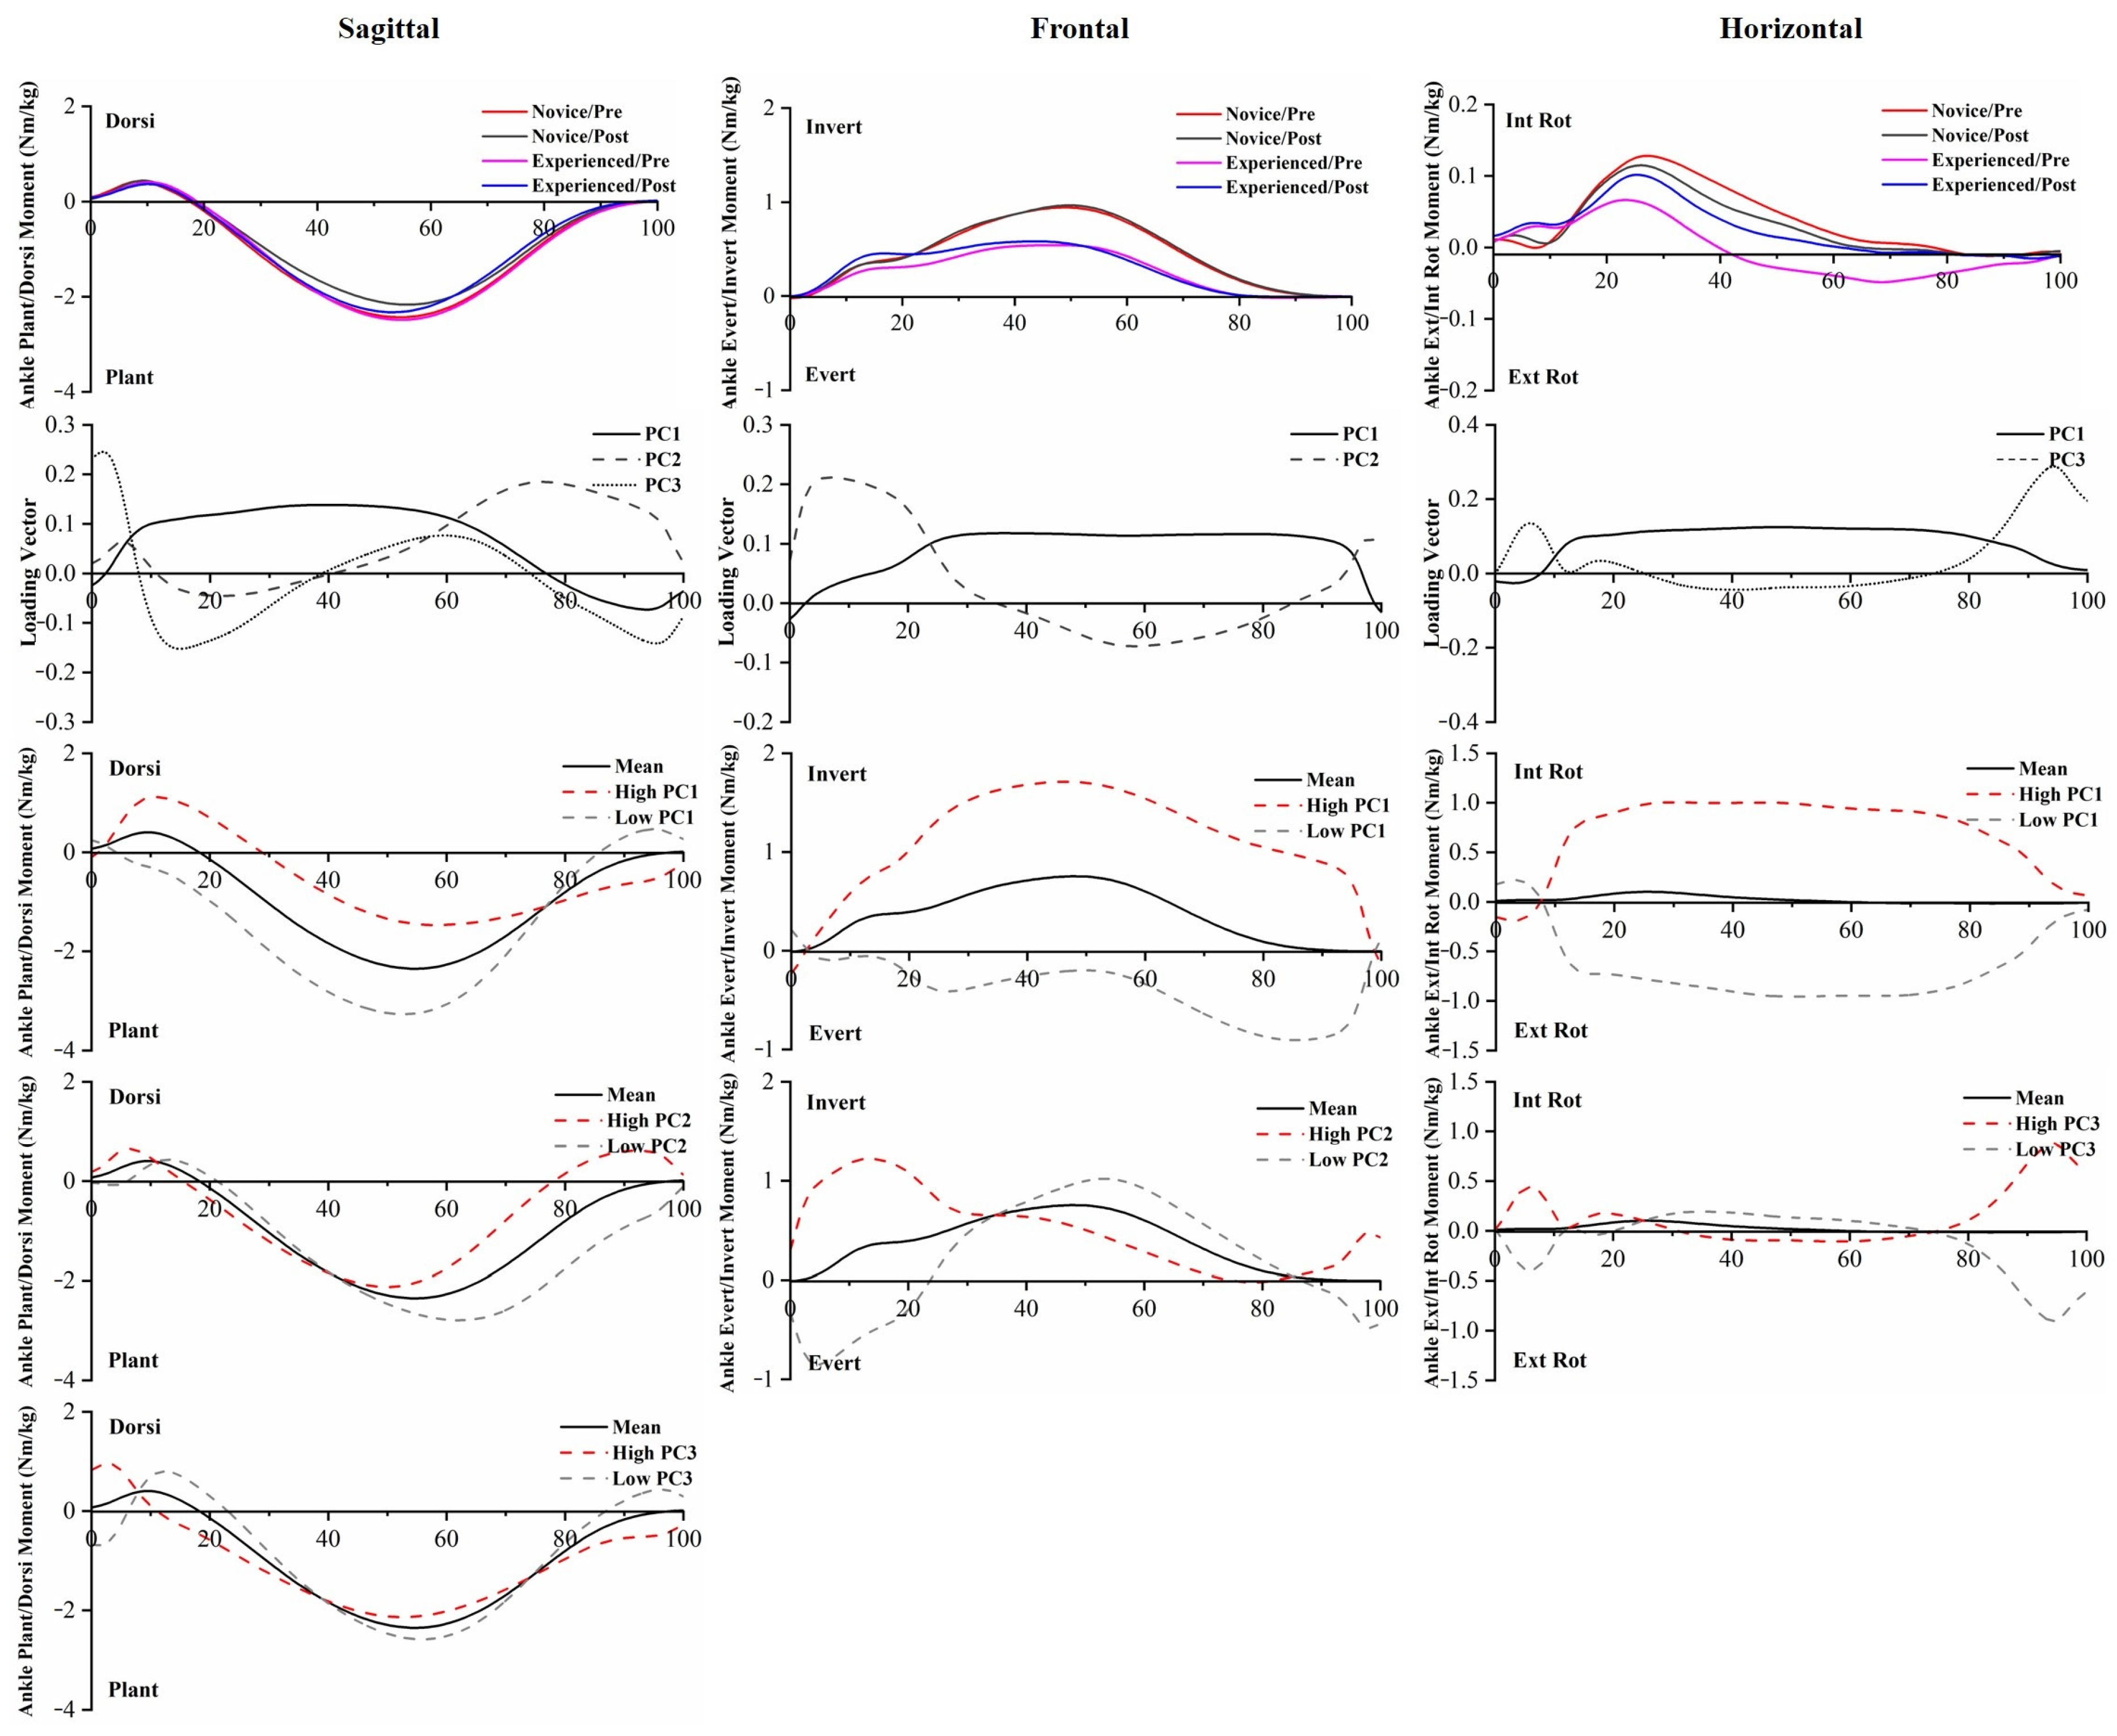
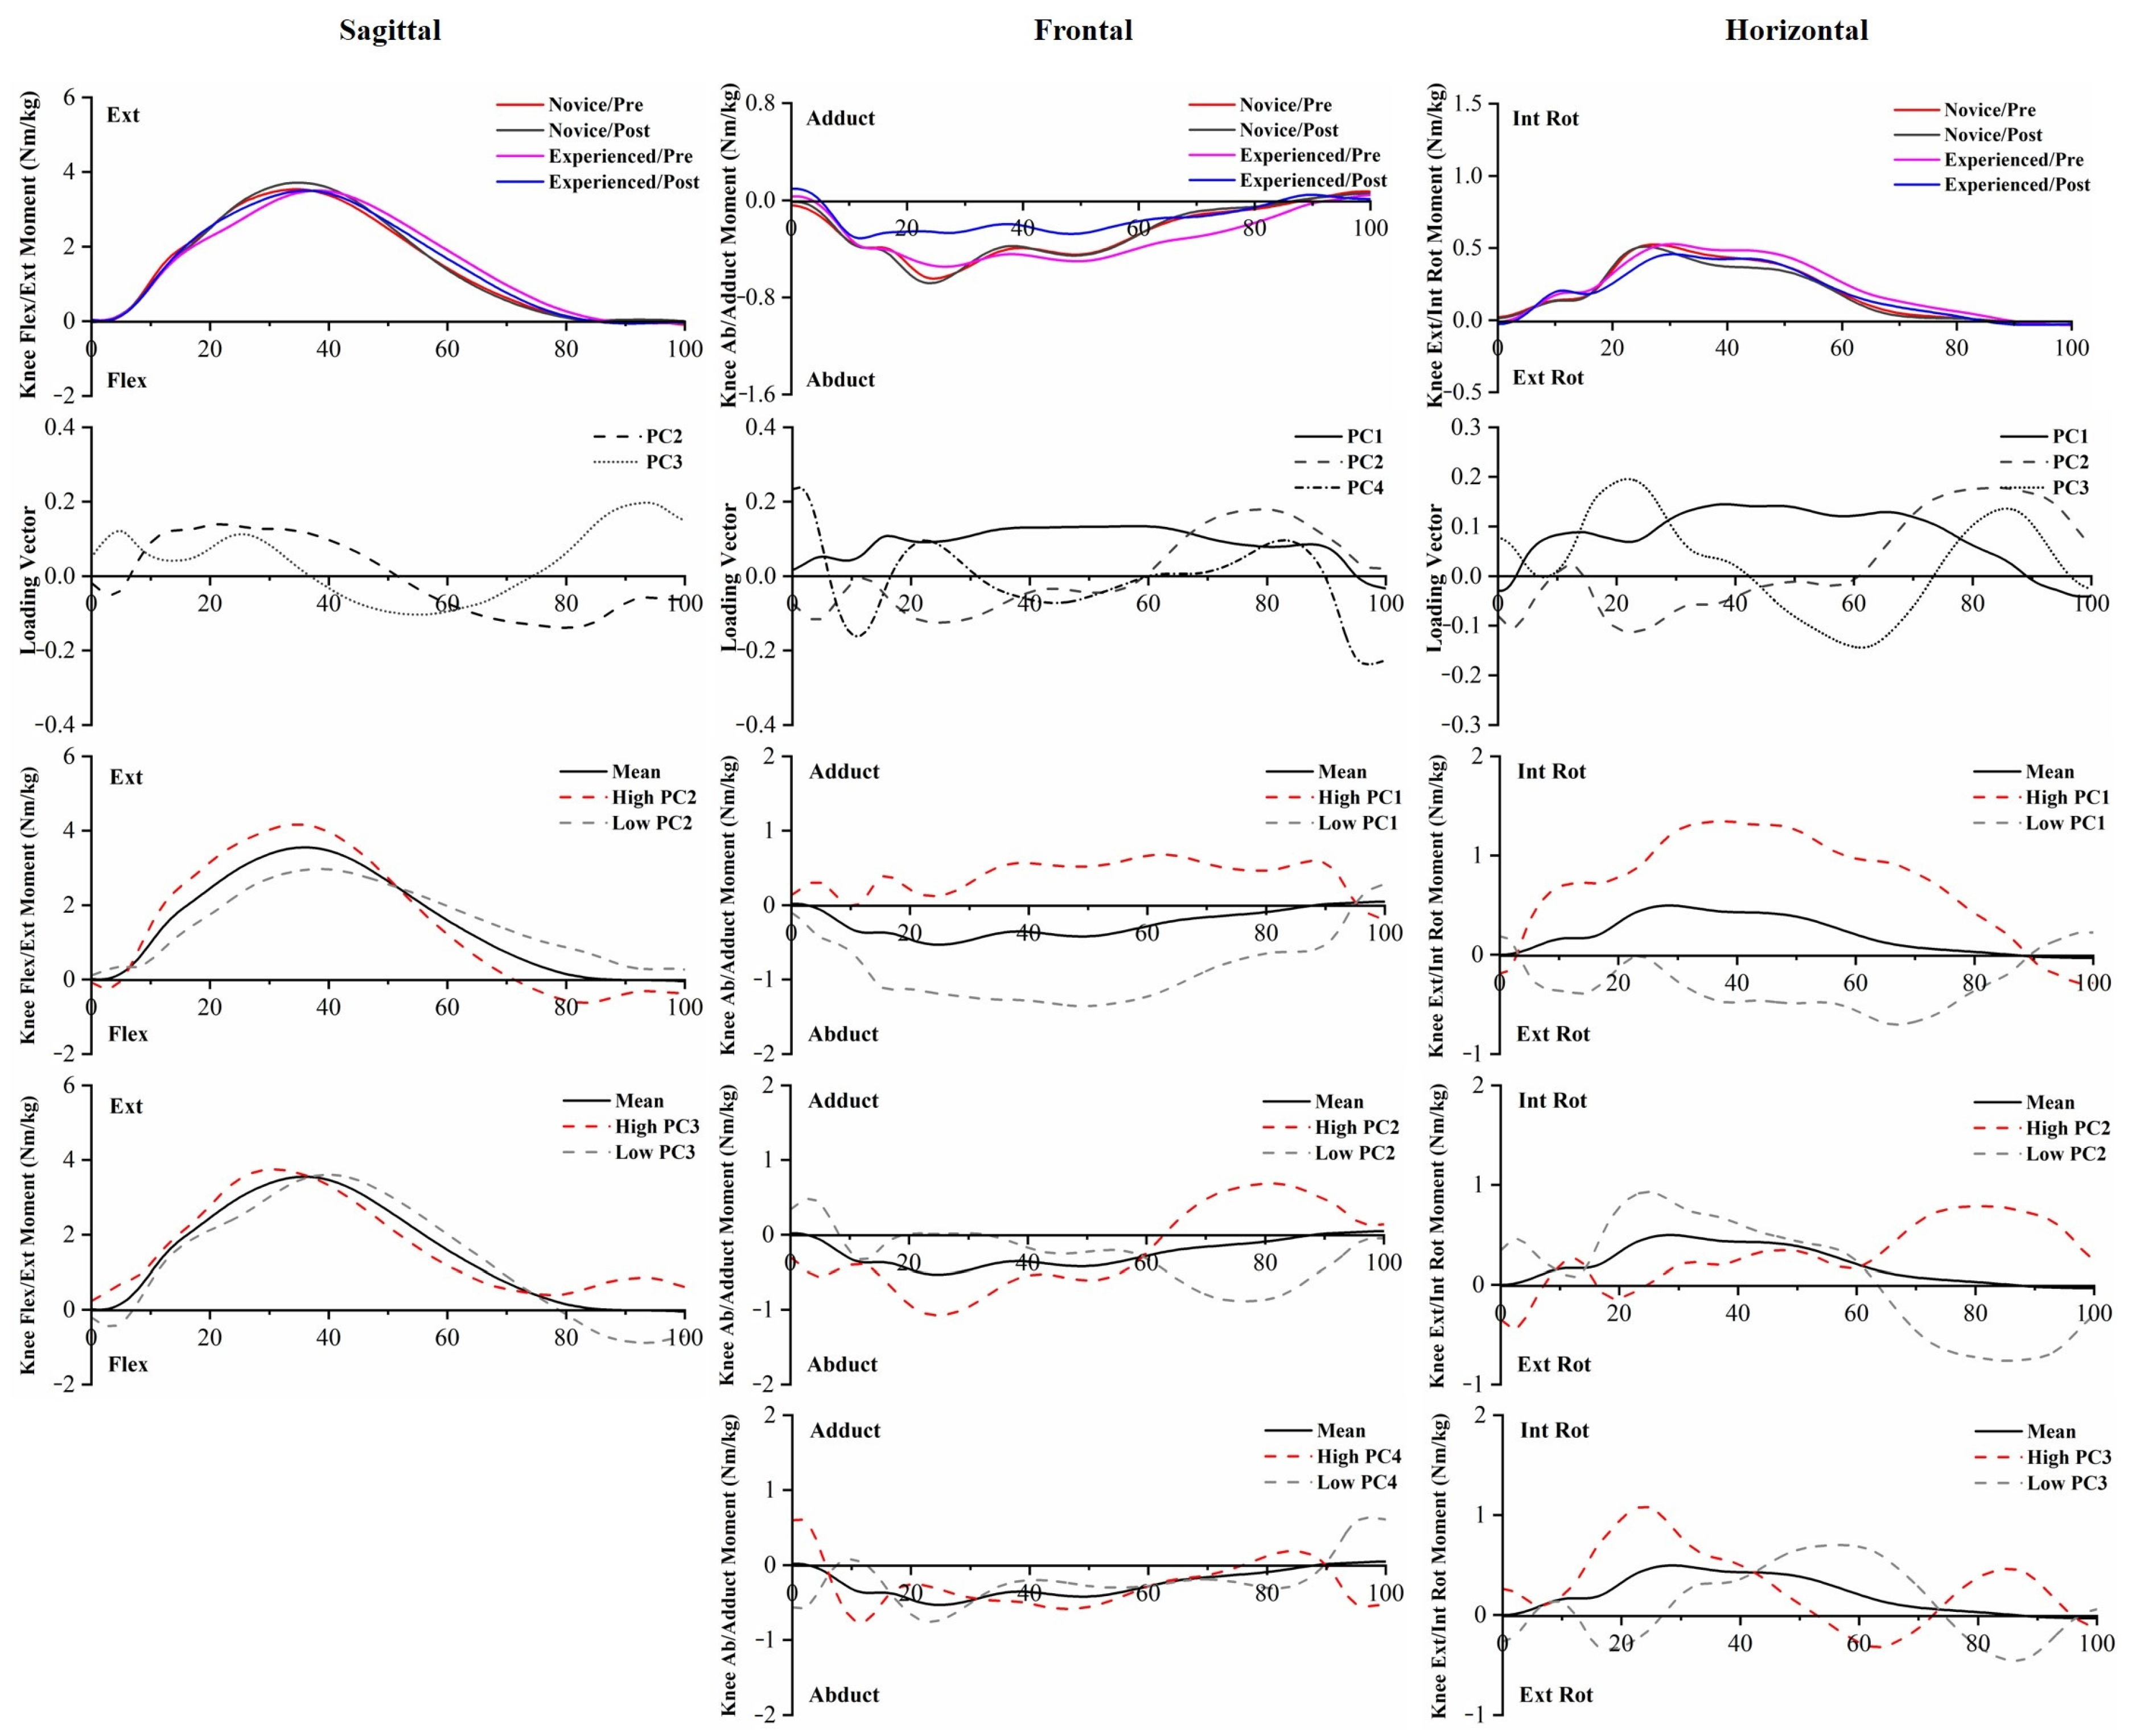
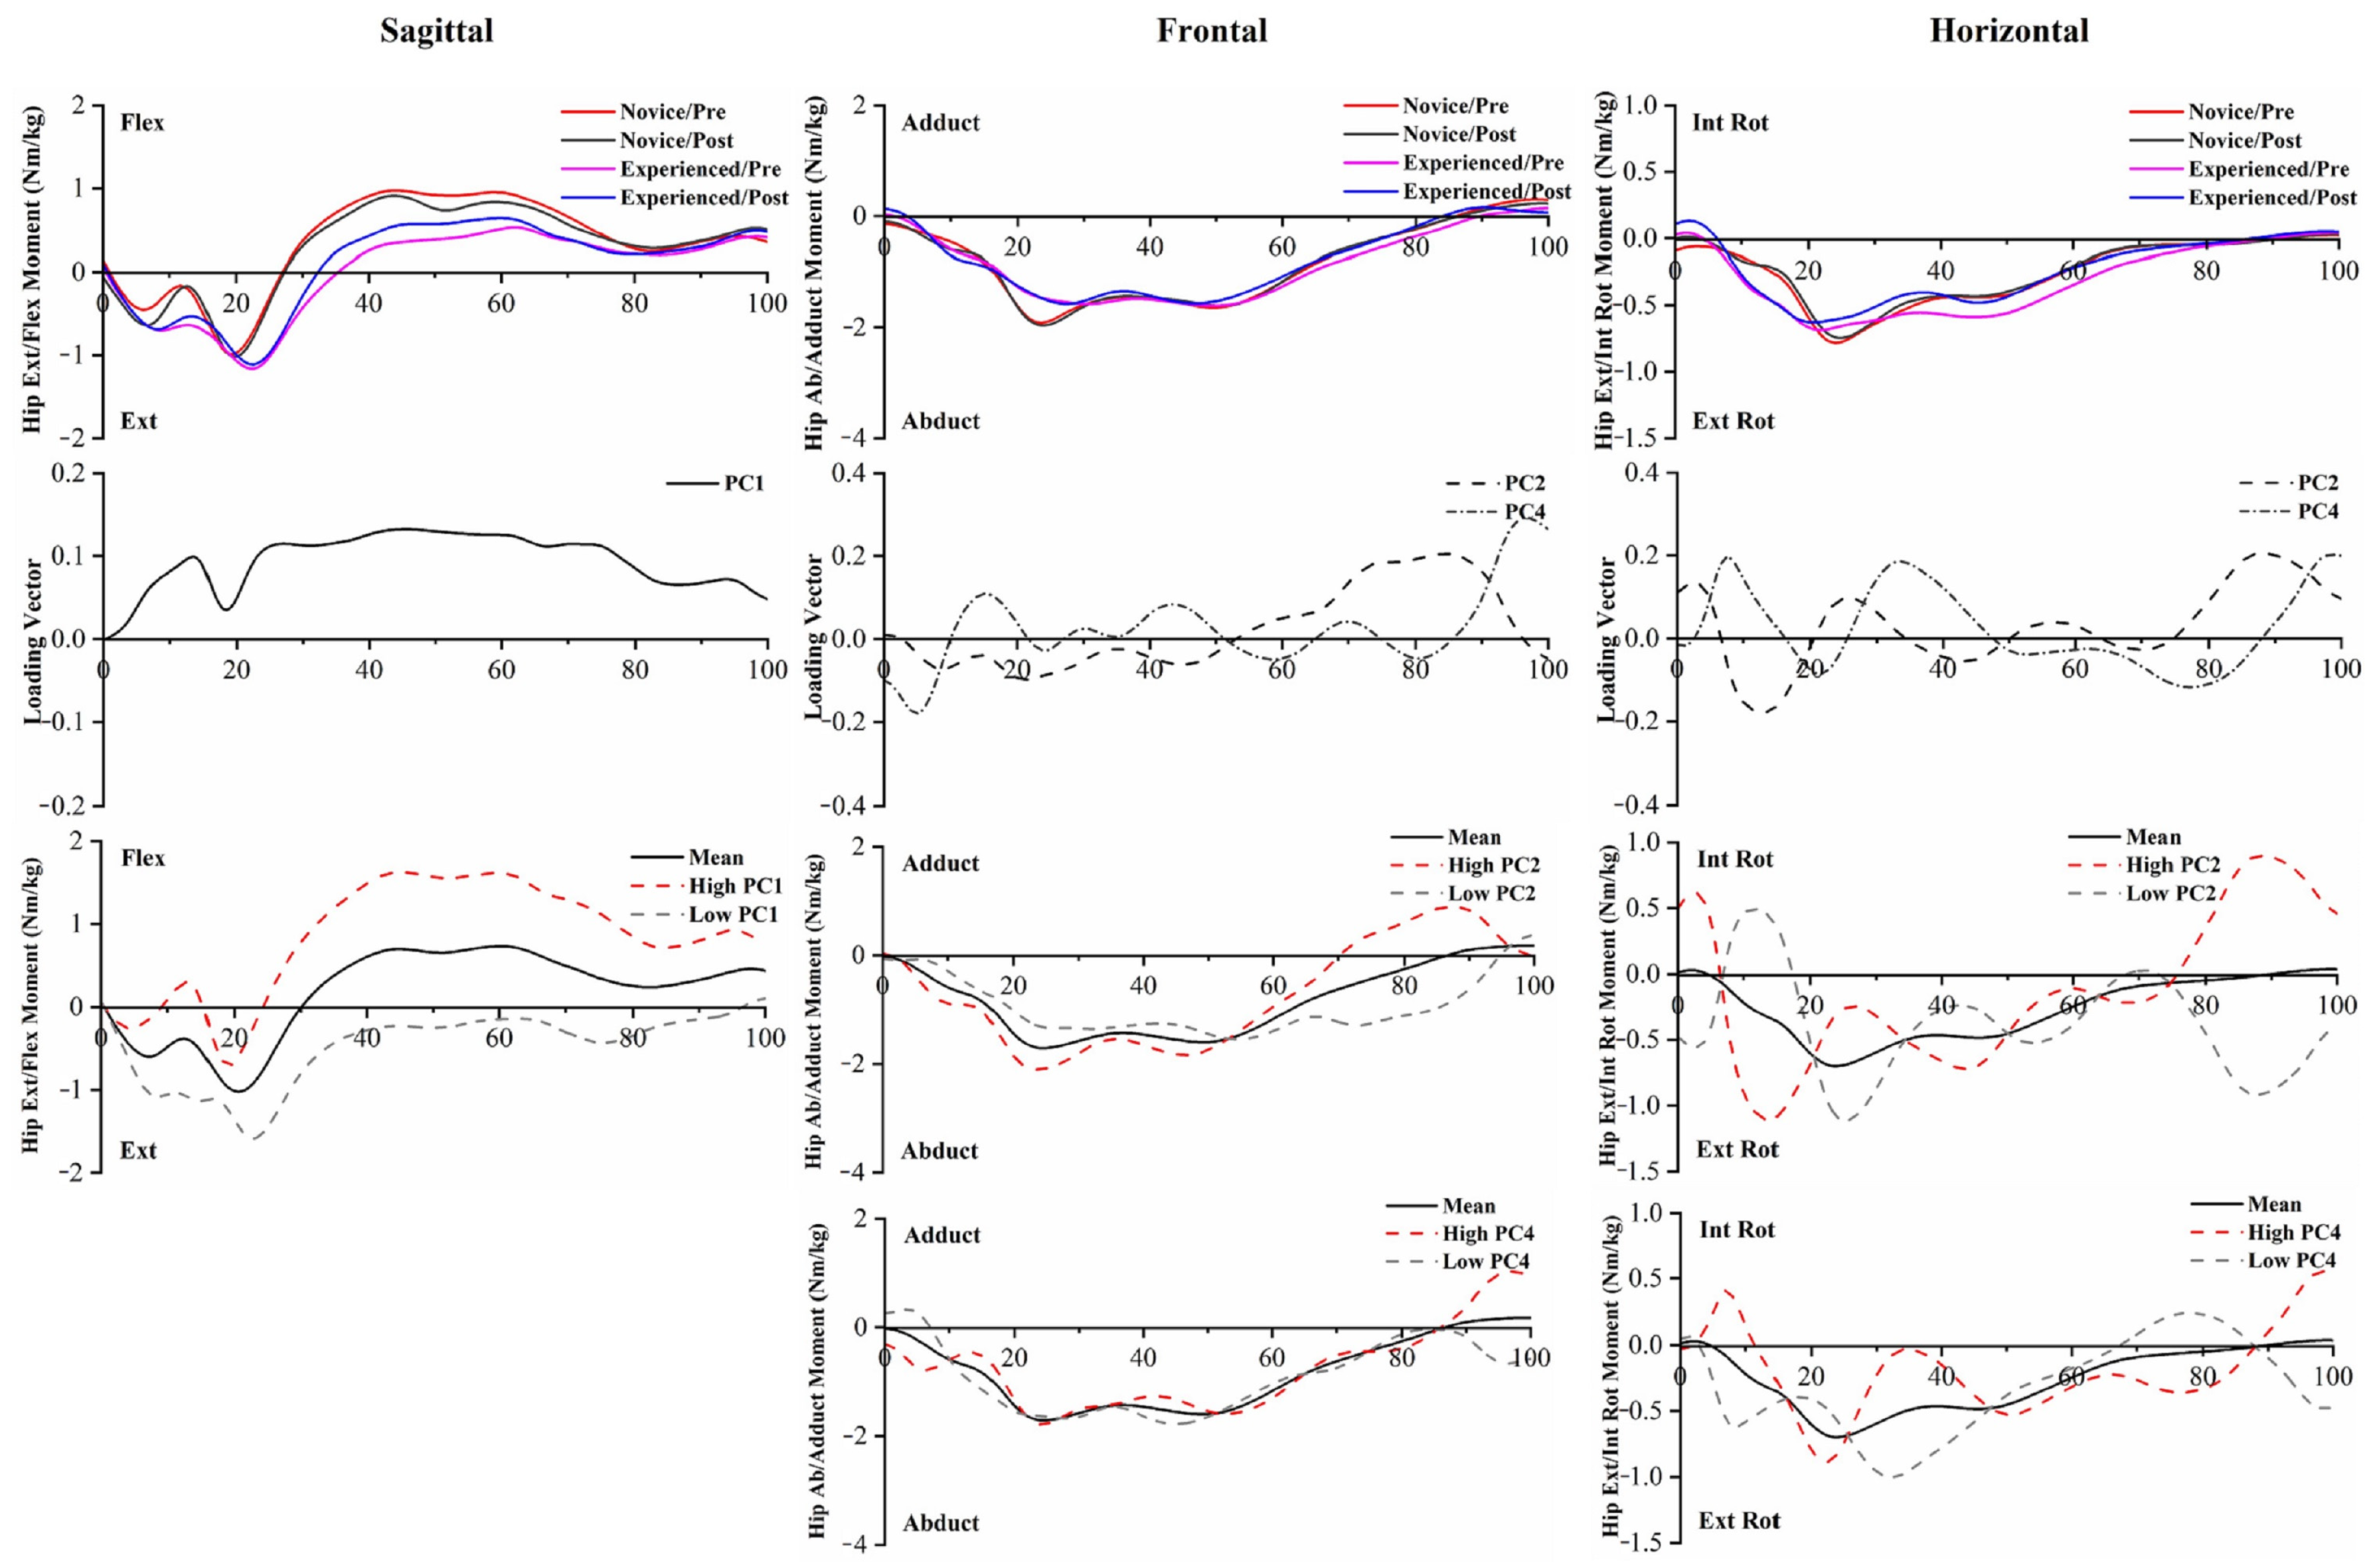
4.2. Kinetics
4.3. Limitations
5. Conclusions
Supplementary Materials
Author Contributions
Funding
Institutional Review Board Statement
Informed Consent Statement
Data Availability Statement
Conflicts of Interest
References
- Xu, D.; Quan, W.; Zhou, H.; Sun, D.; Baker, J.S.; Gu, Y. Explaining the differences of gait patterns between high and low-mileage runners with machine learning. Sci. Rep. 2022, 12, 2981. [Google Scholar] [CrossRef] [PubMed]
- Xiang, L.; Mei, Q.; Wang, A.; Shim, V.; Fernandez, J.; Gu, Y. Evaluating function in the hallux valgus foot following a 12-week minimalist footwear intervention: A pilot computational analysis. J. Biomech. 2022, 132, 110941. [Google Scholar] [CrossRef] [PubMed]
- Yamane, T.; Yamasaki, Y.; Nakashima, W.; Morita, M. Tri-Axial Accelerometer-Based Recognition of Daily Activities Causing Shortness of Breath in COPD Patients. Phys. Act. Health 2023, 7, 64–75. [Google Scholar] [CrossRef]
- Kluitenberg, B.; van Middelkoop, M.; Diercks, R.; van der Worp, H. What are the differences in injury proportions between different populations of runners? A systematic review and meta-analysis. Sport. Med. 2015, 45, 1143–1161. [Google Scholar] [CrossRef] [PubMed]
- Junior, L.C.H.; Costa, L.O.P.; Lopes, A.D. Previous injuries and some training characteristics predict running-related injuries in recreational runners: A prospective cohort study. J. Physiother. 2013, 59, 263–269. [Google Scholar] [CrossRef]
- Dempster, J.; Dutheil, F.; Ugbolue, U.C. The prevalence of lower extremity injuries in running and associated risk factors: A systematic review. Phys. Act. Health 2021, 5, 133–145. [Google Scholar] [CrossRef]
- Linton, L.; Valentin, S. Running with injury: A study of UK novice and recreational runners and factors associated with running related injury. J. Sci. Med. Sport 2018, 21, 1221–1225. [Google Scholar] [CrossRef]
- Van der Worp, M.P.; Ten Haaf, D.S.; van Cingel, R.; de Wijer, A.; Nijhuis-van der Sanden, M.W.; Staal, J.B. Injuries in runners; a systematic review on risk factors and sex differences. PLoS ONE 2015, 10, e0114937. [Google Scholar] [CrossRef]
- Hulme, A.; Nielsen, R.O.; Timpka, T.; Verhagen, E.; Finch, C. Risk and protective factors for middle-and long-distance running-related injury. Sport. Med. 2017, 47, 869–886. [Google Scholar] [CrossRef]
- Schmitz, A.; Russo, K.; Edwards, L.; Noehren, B. Do novice runners have weak hips and bad running form? Gait Posture 2014, 40, 82–86. [Google Scholar] [CrossRef]
- Boyer, K.A.; Silvernail, J.F.; Hamill, J. The role of running mileage on coordination patterns in running. J. Appl. Biomech. 2014, 30, 649–654. [Google Scholar] [CrossRef]
- Quan, W.; Ren, F.; Sun, D.; Fekete, G.; He, Y. Do Novice Runners Show Greater Changes in Biomechanical Parameters? Appl. Bionics Biomech. 2021, 2021, 1–8. [Google Scholar] [CrossRef]
- Nakayama, Y.; Kudo, K.; Ohtsuki, T. Variability and fluctuation in running gait cycle of trained runners and non-runners. Gait Posture 2010, 31, 331–335. [Google Scholar] [CrossRef]
- Agresta, C.E.; Peacock, J.; Housner, J.; Zernicke, R.F.; Zendler, J.D. Experience does not influence injury-related joint kinematics and kinetics in distance runners. Gait Posture 2018, 61, 13–18. [Google Scholar] [CrossRef]
- Dierks, T.A.; Davis, I.S.; Hamill, J. The effects of running in an exerted state on lower extremity kinematics and joint timing. J. Biomech. 2010, 43, 2993–2998. [Google Scholar] [CrossRef]
- Milgrom, C.; Radeva-Petrova, D.R.; Finestone, A.; Nyska, M.; Mendelson, S.; Benjuya, N.; Simkin, A.; Burr, D. The effect of muscle fatigue on in vivo tibial strains. J. Biomech. 2007, 40, 845–850. [Google Scholar] [CrossRef]
- Ferber, R.; Hreljac, A.; Kendall, K.D. Suspected mechanisms in the cause of overuse running injuries: A clinical review. Sport. Health 2009, 1, 242–246. [Google Scholar] [CrossRef]
- Winter, S.; Gordon, S.; Watt, K. Effects of fatigue on kinematics and kinetics during overground running: A systematic review. J. Sport. Med. Phys. Fitness 2016, 57, 887–899. [Google Scholar] [CrossRef]
- Umar, Y.; Arosha, S.; Abdul Ghani, N. Characterising leg-dominance in healthy netballers using 3D kinematics-electromyography features’ integration and machine learning techniques. Int. J. Biomed. Eng. Technol. 2022, 39, 65–92. [Google Scholar] [CrossRef]
- Luo, Z.; Zhang, X.; Wang, J.; Yang, Y.; Xu, Y.; Fu, W. Changes in Ground Reaction Forces, Joint Mechanics, and Stiffness during Treadmill Running to Fatigue. Appl. Sci. 2019, 9, 5493. [Google Scholar] [CrossRef]
- Willson, J.D.; Loss, J.R.; Willy, R.W.; Meardon, S.A. Sex differences in running mechanics and patellofemoral joint kinetics following an exhaustive run. J. Biomech. 2015, 48, 4155–4159. [Google Scholar] [CrossRef] [PubMed]
- Strohrmann, C.; Harms, H.; Kappeler-Setz, C.; Troster, G. Monitoring kinematic changes with fatigue in running using body-worn sensors. IEEE. Trans. Inf. Technol. B 2012, 16, 983–990. [Google Scholar] [CrossRef] [PubMed]
- Maas, E.; De Bie, J.; Vanfleteren, R.; Hoogkamer, W.; Vanwanseele, B. Novice runners show greater changes in kinematics with fatigue compared with competitive runners. Sport Biomech. 2018, 17, 350–360. [Google Scholar] [CrossRef] [PubMed]
- Quan, W.; Zhou, H.; Xu, D.; Li, S.; Baker, J.S.; Gu, Y. Competitive and Recreational Running Kinematics Examined Using Principal Components Analysis. Healthcare 2021, 9, 1321. [Google Scholar] [CrossRef] [PubMed]
- Brandon, S.C.; Graham, R.B.; Almosnino, S.; Sadler, E.M.; Stevenson, J.M.; Deluzio, K.J. Interpreting principal components in biomechanics: Representative extremes and single component reconstruction. J. Electromyogr. Kines 2013, 23, 1304–1310. [Google Scholar] [CrossRef]
- Ringnér, M. What is principal component analysis? Nat. Biotechnol. 2008, 26, 303–304. [Google Scholar] [CrossRef]
- Sheppard, P.S.; Stevenson, J.; Graham, R. Sex-based differences in lifting technique under increasing load conditions: A principal component analysis. Appl. Ergon. 2016, 54, 186–195. [Google Scholar] [CrossRef]
- Lee, M.; Roan, M.; Smith, B. An application of principal component analysis for lower body kinematics between loaded and unloaded walking. J. Biomech. 2009, 42, 2226–2230. [Google Scholar] [CrossRef]
- Wrigley, A.T.; Albert, W.J.; Deluzio, K.J.; Stevenson, J.M. Principal component analysis of lifting waveforms. Clin. Biomech. 2006, 21, 567–578. [Google Scholar] [CrossRef]
- Mantovani, G.; Lamontagne, M.; Varin, D.; Cerulli, G.G.; Beaulé, P.E. Comparison of total hip arthroplasty surgical approaches by Principal Component Analysis. J. Biomech. 2012, 45, 2109–2115. [Google Scholar] [CrossRef]
- O’Connor, K.M.; Bottum, M.C. Differences in cutting knee mechanics based on principal components analysis. Med. Sci. Sport Exer. 2009, 41, 867–878. [Google Scholar] [CrossRef]
- Gao, Z. The Effect of Application of Asymmetry Evaluation in Competitive Sports: A Systematic Review. Phys. Act. Health 2022, 6, 257–272. [Google Scholar] [CrossRef]
- Braga, U.M.; Mendonça, L.D.; Mascarenhas, R.O.; Alves, C.O.; Renato Filho, G.; Resende, R.A. Effects of medially wedged insoles on the biomechanics of the lower limbs of runners with excessive foot pronation and foot varus alignment. Gait Posture 2019, 74, 242–249. [Google Scholar] [CrossRef]
- Zhou, H.; Xu, D.; Quan, W.; Liang, M.; Ugbolue, U.C.; Baker, J.S.; Gu, Y. A Pilot Study of Muscle Force between Normal Shoes and Bionic Shoes during Men Walking and Running Stance Phase Using Opensim. Actuators 2021, 10, 274. [Google Scholar] [CrossRef]
- Pollard, C.D.; Ter Har, J.A.; Hannigan, J.; Norcross, M.F. Influence of maximal running shoes on biomechanics before and after a 5K run. Orthop. J. Sport. Med. 2018, 6, 2325967118775720. [Google Scholar] [CrossRef]
- Xu, D.; Jiang, X.; Cen, X.; Baker, J.S.; Gu, Y. Single-Leg Landings Following a Volleyball Spike May Increase the Risk of Anterior Cruciate Ligament Injury More Than Landing on Both-Legs. Appl. Sci. 2021, 11, 130. [Google Scholar] [CrossRef]
- Foch, E.; Milner, C.E. The influence of iliotibial band syndrome history on running biomechanics examined via principal components analysis. J. Biomech. 2014, 47, 81–86. [Google Scholar] [CrossRef]
- Milner, C.E.; Ferber, R.; Pollard, C.D.; Hamill, J.; Davis, I.S. Biomechanical factors associated with tibial stress fracture in female runners. Med. Sci. Sport Exerc. 2006, 38, 323. [Google Scholar] [CrossRef]
- Yu, L.; Mei, Q.; Xiang, L.; Liu, W.; Mohamad, N.I.; István, B.; Fernandez, J.; Gu, Y. Principal Component Analysis of the Running Ground Reaction Forces with Different Speeds. Front. Bioeng. Biotechnol. 2021, 9, 629809. [Google Scholar] [CrossRef]
- Flores, N.; Rao, G.; Berton, E.; Delattre, N. The stiff plate location into the shoe influences the running biomechanics. Sport. Biomech. 2019, 20, 815–830. [Google Scholar] [CrossRef]
- Lakens, D. Calculating and reporting effect sizes to facilitate cumulative science: A practical primer for t-tests and ANOVAs. Front. Psychol. 2013, 4, 863. [Google Scholar] [CrossRef] [PubMed]
- Vtasalo, J.T.; Kvist, M. Some biomechanical aspects of the foot and ankle in athletes with and without shin splints. Am. J. Sport Med. 1983, 11, 125–130. [Google Scholar] [CrossRef] [PubMed]
- Hamill, J.; Derrick, T.R.; Holt, K.G. Shock attenuation and stride frequency during running. Hum. Mov. Sci. 1995, 14, 45–60. [Google Scholar] [CrossRef]
- Brown, A.M.; Zifchock, R.A.; Lenhoff, M.; Song, J.; Hillstrom, H.J. Hip muscle response to a fatiguing run in females with iliotibial band syndrome. Hum. Mov. Sci. 2019, 64, 181–190. [Google Scholar] [CrossRef] [PubMed]
- Willwacher, S.; Sanno, M.; Brüggemann, G.-P. Fatigue matters: An intense 10 km run alters frontal and transverse plane joint kinematics in competitive and recreational adult runners. Gait Posture 2020, 76, 277–283. [Google Scholar] [CrossRef] [PubMed]
- Kuhman, D.J.; Paquette, M.R.; Peel, S.A.; Melcher, D.A. Comparison of ankle kinematics and ground reaction forces between prospectively injured and uninjured collegiate cross country runners. Hum. Mov. Sci. 2016, 47, 9–15. [Google Scholar] [CrossRef]
- Ferber, R.; Noehren, B.; Hamill, J.; Davis, I. Competitive female runners with a history of iliotibial band syndrome demonstrate atypical hip and knee kinematics. J. Orthop. Sport Phys. Ther. 2010, 40, 52–58. [Google Scholar] [CrossRef]
- Noehren, B.; Hamill, J.; Davis, I. Prospective evidence for a hip etiology in patellofemoral pain. Med. Sci. Sport Exer. 2013, 45, 1120–1124. [Google Scholar] [CrossRef]
- Giandonato, J.A.; Tringali, V.M.; Thoms, R.C. Improving mental health through physical activity: A narrative literature review. Phys. Act. Health 2021, 5, 146–153. [Google Scholar] [CrossRef]
- Lieberman, D.E.; Warrener, A.G.; Wang, J.; Castillo, E.R. Effects of stride frequency and foot position at landing on braking force, hip torque, impact peak force and the metabolic cost of running in humans. J. Exp. Biol. 2015, 218, 3406–3414. [Google Scholar] [CrossRef]
- Davis, E.M.; Hubley-Kozey, C.L.; Landry, S.C.; Ikeda, D.M.; Stanish, W.D.; Wilson, J.L.A. Longitudinal evidence links joint level mechanics and muscle activation patterns to 3-year medial joint space narrowing. Clin. Biomech. 2019, 61, 233–239. [Google Scholar] [CrossRef] [PubMed]
- Mizrahi, J.; Verbitsky, O.; Isakov, E.; Daily, D. Effect of fatigue on leg kinematics and impact acceleration in long distance running. Hum. Mov. Sci. 2000, 19, 139–151. [Google Scholar] [CrossRef]
- Riazati, S.; Caplan, N.; Matabuena, M.; Hayes, P.R. Fatigue induced changes in muscle strength and gait following two different intensity, energy expenditure matched runs. Front. Bioeng. Biotechnol. 2020, 8, 360. [Google Scholar] [CrossRef]
- Abbasi, A.; Yazdanbakhsh, F.; Tazji, M.K.; Ataabadi, P.A.; Svoboda, Z.; Nazarpour, K.; Vieira, M.F. A comparison of coordination and its variability in lower extremity segments during treadmill and overground running at different speeds. Gait Posture 2020, 79, 139–144. [Google Scholar] [CrossRef]
- Orendurff, M.S.; Kobayashi, T.; Tulchin-Francis, K.; Tullock, A.M.H.; Villarosa, C.; Chan, C.; Kraus, E.; Strike, S. A little bit faster: Lower extremity joint kinematics and kinetics as recreational runners achieve faster speeds. J. Biomech. 2018, 71, 167–175. [Google Scholar] [CrossRef]
- Girard, O.; Morin, J.-B.; Ryu, J.; Read, P.; Townsend, N. Running velocity does not influence lower limb mechanical asymmetry. Front. Sport. Act. Living 2019, 1, 36. [Google Scholar] [CrossRef]
- Van Hooren, B.; Fuller, J.T.; Buckley, J.D.; Miller, J.R.; Sewell, K.; Rao, G.; Barton, C.; Bishop, C.; Willy, R.W. Is motorized treadmill running biomechanically comparable to overground running? A systematic review and meta-analysis of cross-over studies. Sport. Med. 2020, 50, 785–813. [Google Scholar] [CrossRef]
- Patra, R.; Das, H.C.; Jena, S. Evaluation of the mechanical behaviour of a bipolar hip prosthesis under transient loading. Int. J. Biomed. Eng. Technol. 2022, 39, 314–326. [Google Scholar] [CrossRef]


| Variable | Novice | Experienced | p-Value |
|---|---|---|---|
| Age (years) | 23.80 (1.97) | 23.65 (1.67) | 0.398 |
| Height (m) | 1.76 (0.49) | 1.75 (0.56) | 0.702 |
| Weight (kg) | 71.93 (7.70) | 72.73 (6.44) | 0.794 |
| BMI (kg/m2) | 23.13 (1.18) | 23.65 (1.67) | 0.456 |
| Running experience (years) | 1.53 (0.74) | 6.07 (1.62) | <0.001 |
| Running volume (km/week) | 7.13 (2.67) | 38.33 (7.72) | <0.001 |
| Joint | ROM (°) | Novice/Pre | Novice/Post | Experienced/Pre | Experienced/Post | Runner | 5 km | Interaction |
|---|---|---|---|---|---|---|---|---|
| Main Effect | Main Effect | Effect | ||||||
| Ankle | Dorsi/Plant | 44.80 (10.77) | 41.71 (6.41) | 44.55 (6.41) | 45.41 (7.96) | F = 0.878; p = 0.355 | F = 2.270; p = 0.139 | F = 3.515; p = 0.078 |
| Invert/Evert | 17.16 (4.82) | 17.21 (4.75) | 15.32 (2.91) | 16.04 (1.91) | F = 4.720; p = 0.035 | F = 1.442; p = 0.236 | F = 1.104; p = 0.299 | |
| Int Rot/Ext Rot | 14.94 (2.97) | 14.20 (1.50) | 13.77 (2.41) | 14.07 (2.84) | F = 1.978; p = 0.167 | F = 0.720; p = 0.401 | F = 4.024; p = 0.051 | |
| Knee | Ext/Flex | 26.18 (4.05) | 27.14 (3.26) | 32.23 (3.55) | 29.90 (2.94) | F = 57.932; p < 0.001 | F = 1.941; p = 0.171 | F = 5.917; p = 0.035 |
| Adduct/Abduct | 2.85 (0.63) | 3.90 (1.55) | 3.38 (0.79) | 3.43 (1.20) | F = 0.025; p = 0.876 | F = 12.818; p = 0.001 | F = 21.117; p < 0.001 | |
| Int Rot/Ext Rot | 6.62 (2.28) | 6.70 (1.98) | 7.73 (2.67) | 7.73 (2.40) | F = 0.033; p = 0.857 | F = 4.675; p = 0.057 | F = 2.572; p = 0.090 | |
| Hip | Flex/Ext | 43.17 (3.12) | 42.81 (3.05) | 41.98 (3.91) | 43.12 (5.41) | F = 0.503; p = 0.482 | F = 0.676; p = 0.415 | F = 5.406; p = 0.025 |
| Adduct/Abduct | 14.10 (3.66) | 14.76 (4.68) | 10.37 (1.90) | 12.00 (1.22) | F = 23.459; p < 0.001 | F = 13.369; p = 0.001 | F = 2.967; p = 0.092 | |
| Int Rot/Ext Rot | 10.96 (4.44) | 12.66 (6.26) | 10.48 (3.31) | 10.69 (2.61) | F = 1.378; p = 0.247 | F = 6.664; p = 0.013 | F = 5.682; p = 0.022 |
| Joint | Moment (Nm/kg) | Novice/Pre | Novice/Post | Experienced/Pre | Experienced/Post | Runner | 5 km | Interaction |
|---|---|---|---|---|---|---|---|---|
| Main Effect | Main Effect | Effect | ||||||
| Ankle | Plantarflexion | 2.46 (0.43) | 2.20 (0.39) | 2.50 (0.29) | 2.33 (0.16) | F = 1.864; p = 0.179; | F = 76.958; p < 0.001 | F = 4.376; p = 0.042 |
| Inversion | 0.95 (0.23) | 0.98 (0.27) | 0.56 (0.27) | 0.73 (0.16) | F = 78.585; p < 0.001 | F = 2.511; p = 0.051 | F = 3.050; p = 0.088 | |
| Internal rotation | 0.16 (0.09) | 0.16 (0.10) | 0.09 (0.07) | 0.12 (0.07) | F = 17.016; p < 0.001 | F = 3.297; p = 0.076 | F = 4.370; p = 0.042 | |
| Knee | Extension | 3.56 (0.33) | 3.74 (0.39) | 3.53 (0.47) | 3.53 (0.48) | F = 1.366; p = 0.249 | F = 2.589; p = 0.079 | F = 5.268; p = 0.027 |
| Abduction | 0.67 (0.24) | 0.74 (0.21) | 0.70 (0.11) | 0.58 (0.17) | F = 3.770; p = 0.059 | F = 1.825; p = 0.184 | F = 4.638; p = 0.041 | |
| Internal rotation | 0.54 (0.06) | 0.52 (0.15) | 0.56 (0.12) | 0.50 (0.08) | F = 0.001; p = 0.991 | F = 8.547; p = 0.005 | F = 2.263; p = 0.140 | |
| Hip | Extension | 1.08 (0.26) | 1.26 (0.32) | 1.37 (0.40) | 1.39 (0.33) | F = 9.957; p = 0.003 | F = 5.519; p = 0.023 | F = 5.721; p = 0.083 |
| Abduction | 1.98 (0.32) | 2.05 (0.43) | 1.77 (0.25) | 1.79 (0.25) | F = 16.390; p < 0.001 | F = 1.890; p = 0.176 | F = 0.933; p = 0.339 | |
| External rotation | 0.83 (0.23) | 0.82 (0.27) | 0.87 (0.15) | 0.80 (0.20) | F = 0.138; p = 0.712 | F = 3.352; p = 0.074 | F = 2.228; p = 0.143 |
Disclaimer/Publisher’s Note: The statements, opinions and data contained in all publications are solely those of the individual author(s) and contributor(s) and not of MDPI and/or the editor(s). MDPI and/or the editor(s) disclaim responsibility for any injury to people or property resulting from any ideas, methods, instructions or products referred to in the content. |
© 2023 by the authors. Licensee MDPI, Basel, Switzerland. This article is an open access article distributed under the terms and conditions of the Creative Commons Attribution (CC BY) license (https://creativecommons.org/licenses/by/4.0/).
Share and Cite
Jiang, X.; Xu, D.; Fang, Y.; Bíró, I.; Baker, J.S.; Gu, Y. PCA of Running Biomechanics after 5 km between Novice and Experienced Runners. Bioengineering 2023, 10, 876. https://doi.org/10.3390/bioengineering10070876
Jiang X, Xu D, Fang Y, Bíró I, Baker JS, Gu Y. PCA of Running Biomechanics after 5 km between Novice and Experienced Runners. Bioengineering. 2023; 10(7):876. https://doi.org/10.3390/bioengineering10070876
Chicago/Turabian StyleJiang, Xinyan, Datao Xu, Yufei Fang, István Bíró, Julien S. Baker, and Yaodong Gu. 2023. "PCA of Running Biomechanics after 5 km between Novice and Experienced Runners" Bioengineering 10, no. 7: 876. https://doi.org/10.3390/bioengineering10070876
APA StyleJiang, X., Xu, D., Fang, Y., Bíró, I., Baker, J. S., & Gu, Y. (2023). PCA of Running Biomechanics after 5 km between Novice and Experienced Runners. Bioengineering, 10(7), 876. https://doi.org/10.3390/bioengineering10070876