Author Contributions
Conceptualization, A.B., G.I., O.S., D.M. and M.M.; methodology, A.B., G.I., O.S., D.M. and M.M.; software, A.B. and M.M.; validation, A.B., G.I., O.S., D.M. and M.M.; formal analysis, A.B., G.I., O.S., D.M. and M.M.; investigation, A.B., G.I., O.S., D.M. and M.M.; resources, A.B., G.I., O.S., D.M. and M.M.; data curation, A.B. and M.M.; writing—original draft preparation, A.B., G.I., D.M. and M.M.; writing—review and editing, A.B., G.I., O.S., D.M. and M.M.; visualization, A.B., G.I. and M.M.; supervision, O.S., D.M. and M.M.; project administration, D.M. and M.M. All authors have read and agreed to the published version of the manuscript.
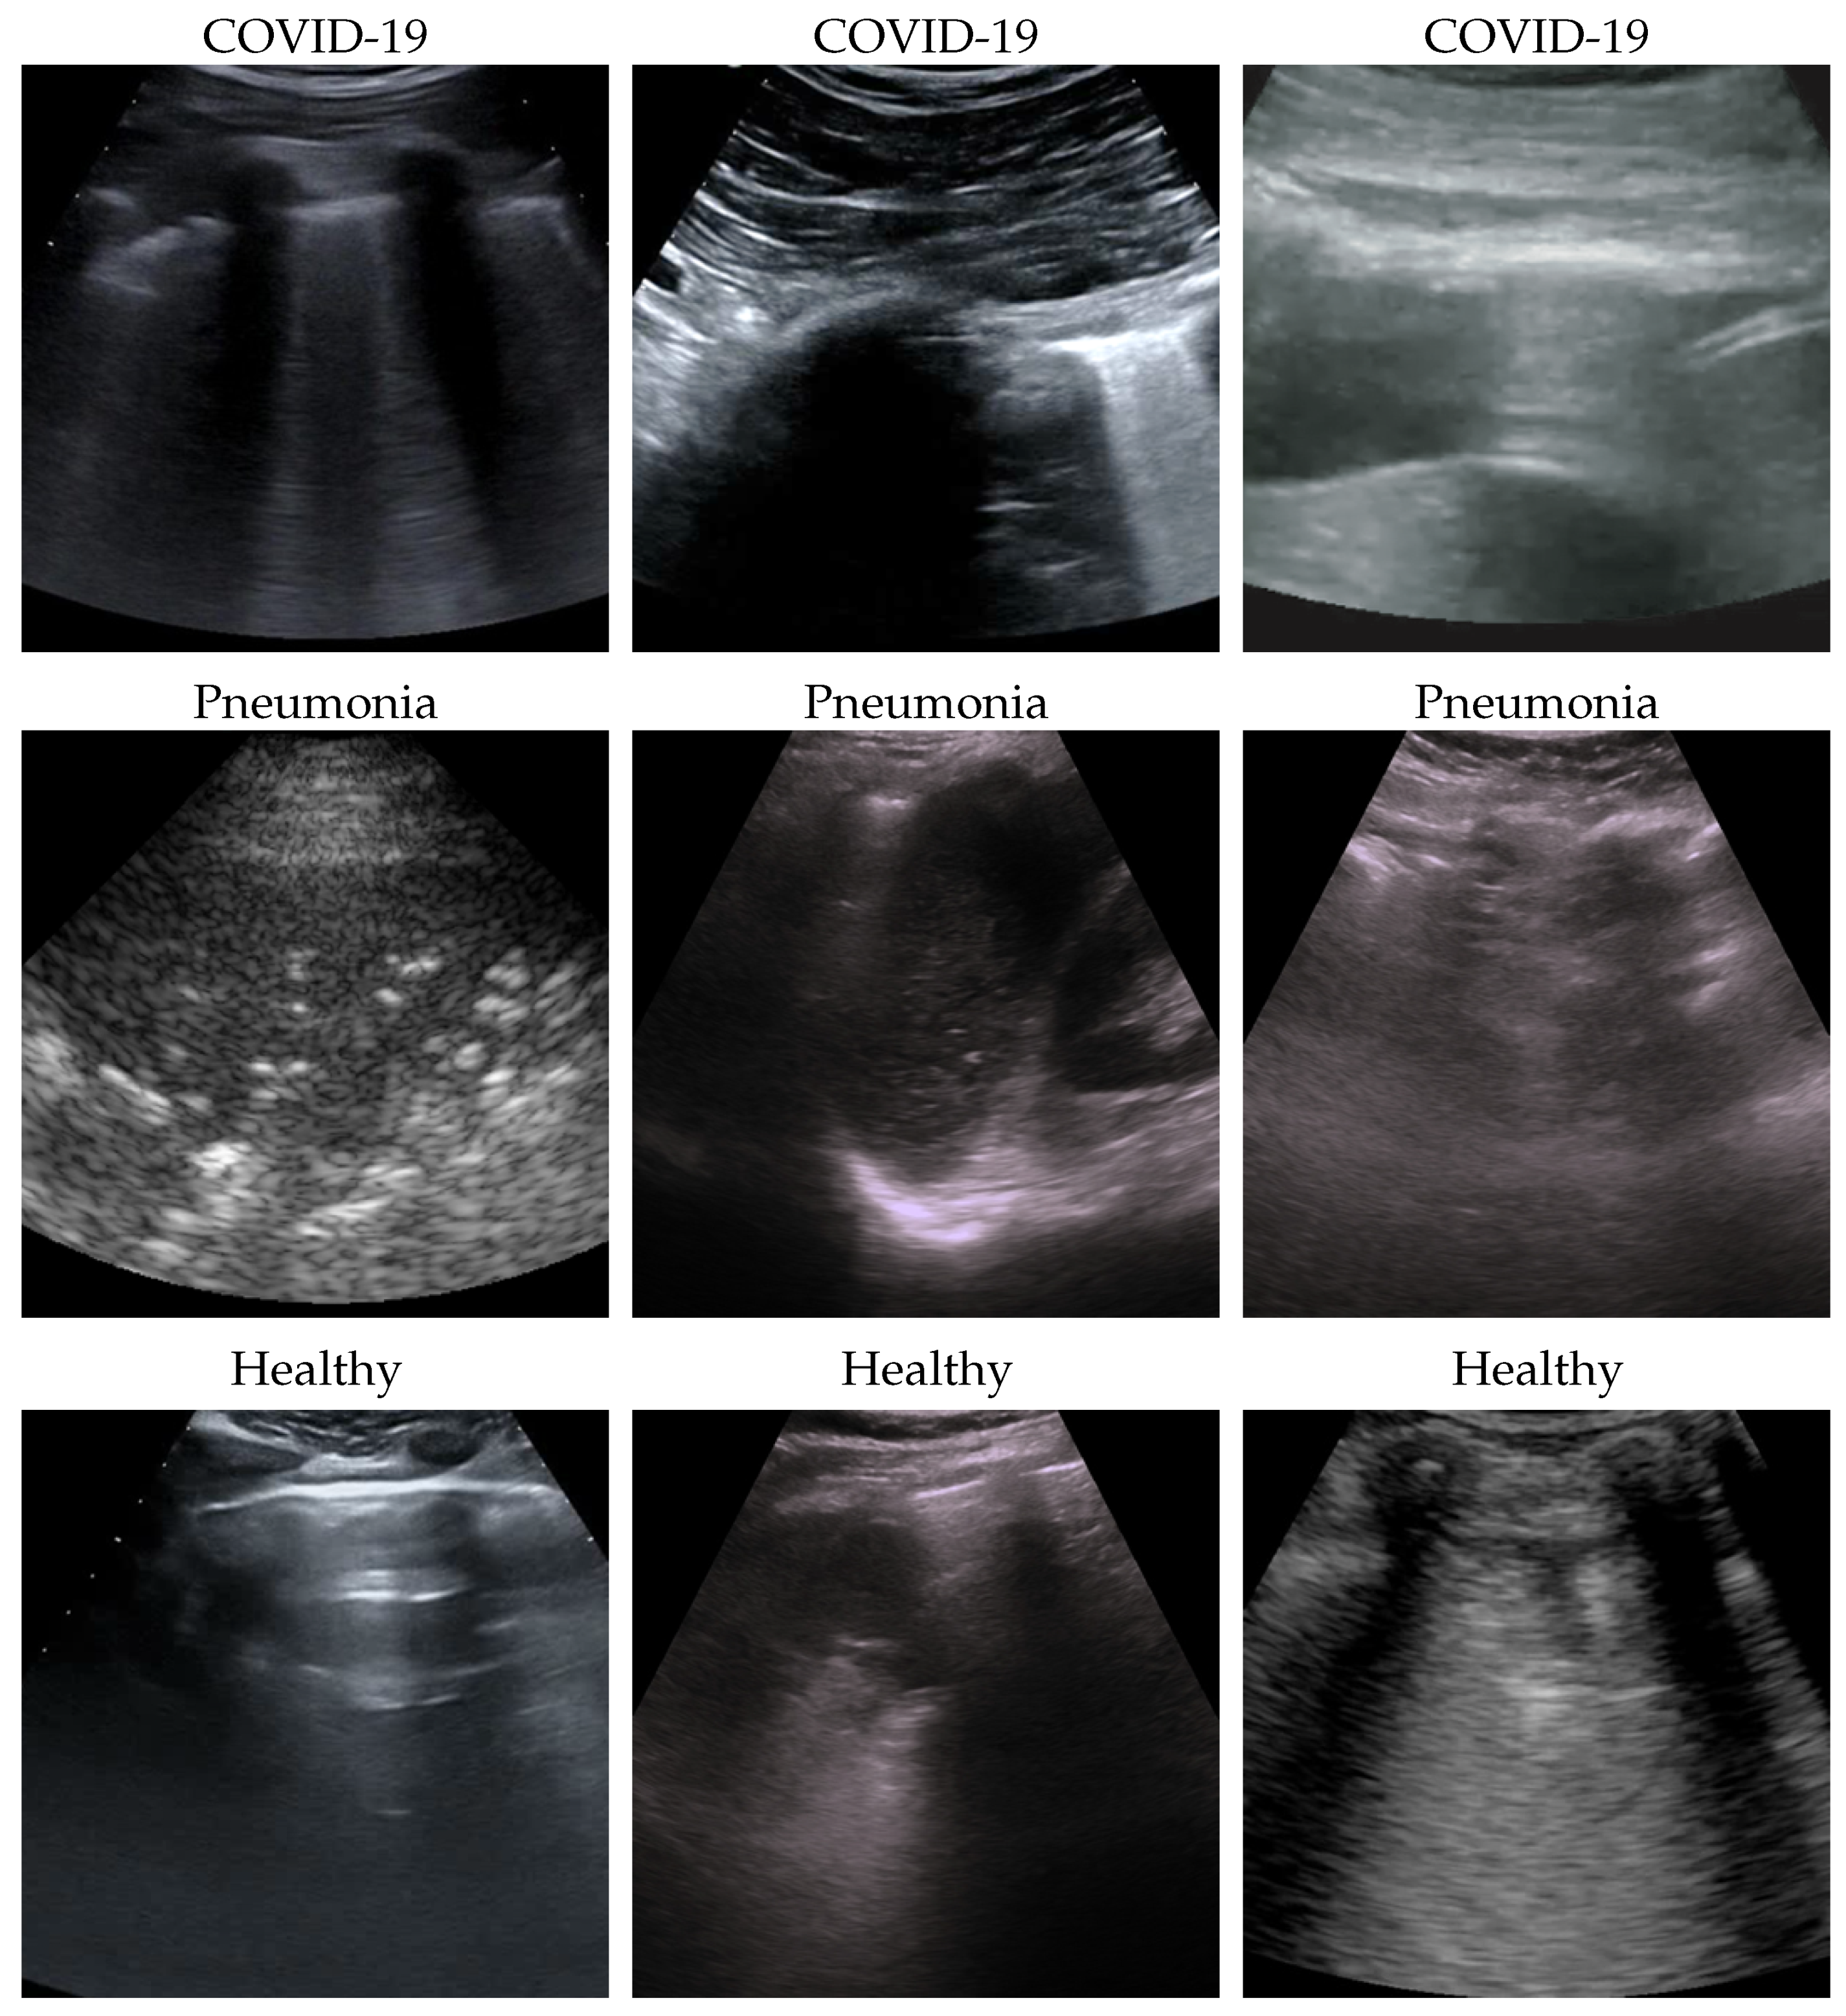
Figure 1.
Some COVID-19 (first row), pneumonia (second row), and healthy (third row) samples from the dataset. As can be appreciated from the images, even among the same class, the sample appears to be very heterogeneous, and there is no kind of bias (e.g., pattern, color).
Figure 1.
Some COVID-19 (first row), pneumonia (second row), and healthy (third row) samples from the dataset. As can be appreciated from the images, even among the same class, the sample appears to be very heterogeneous, and there is no kind of bias (e.g., pattern, color).
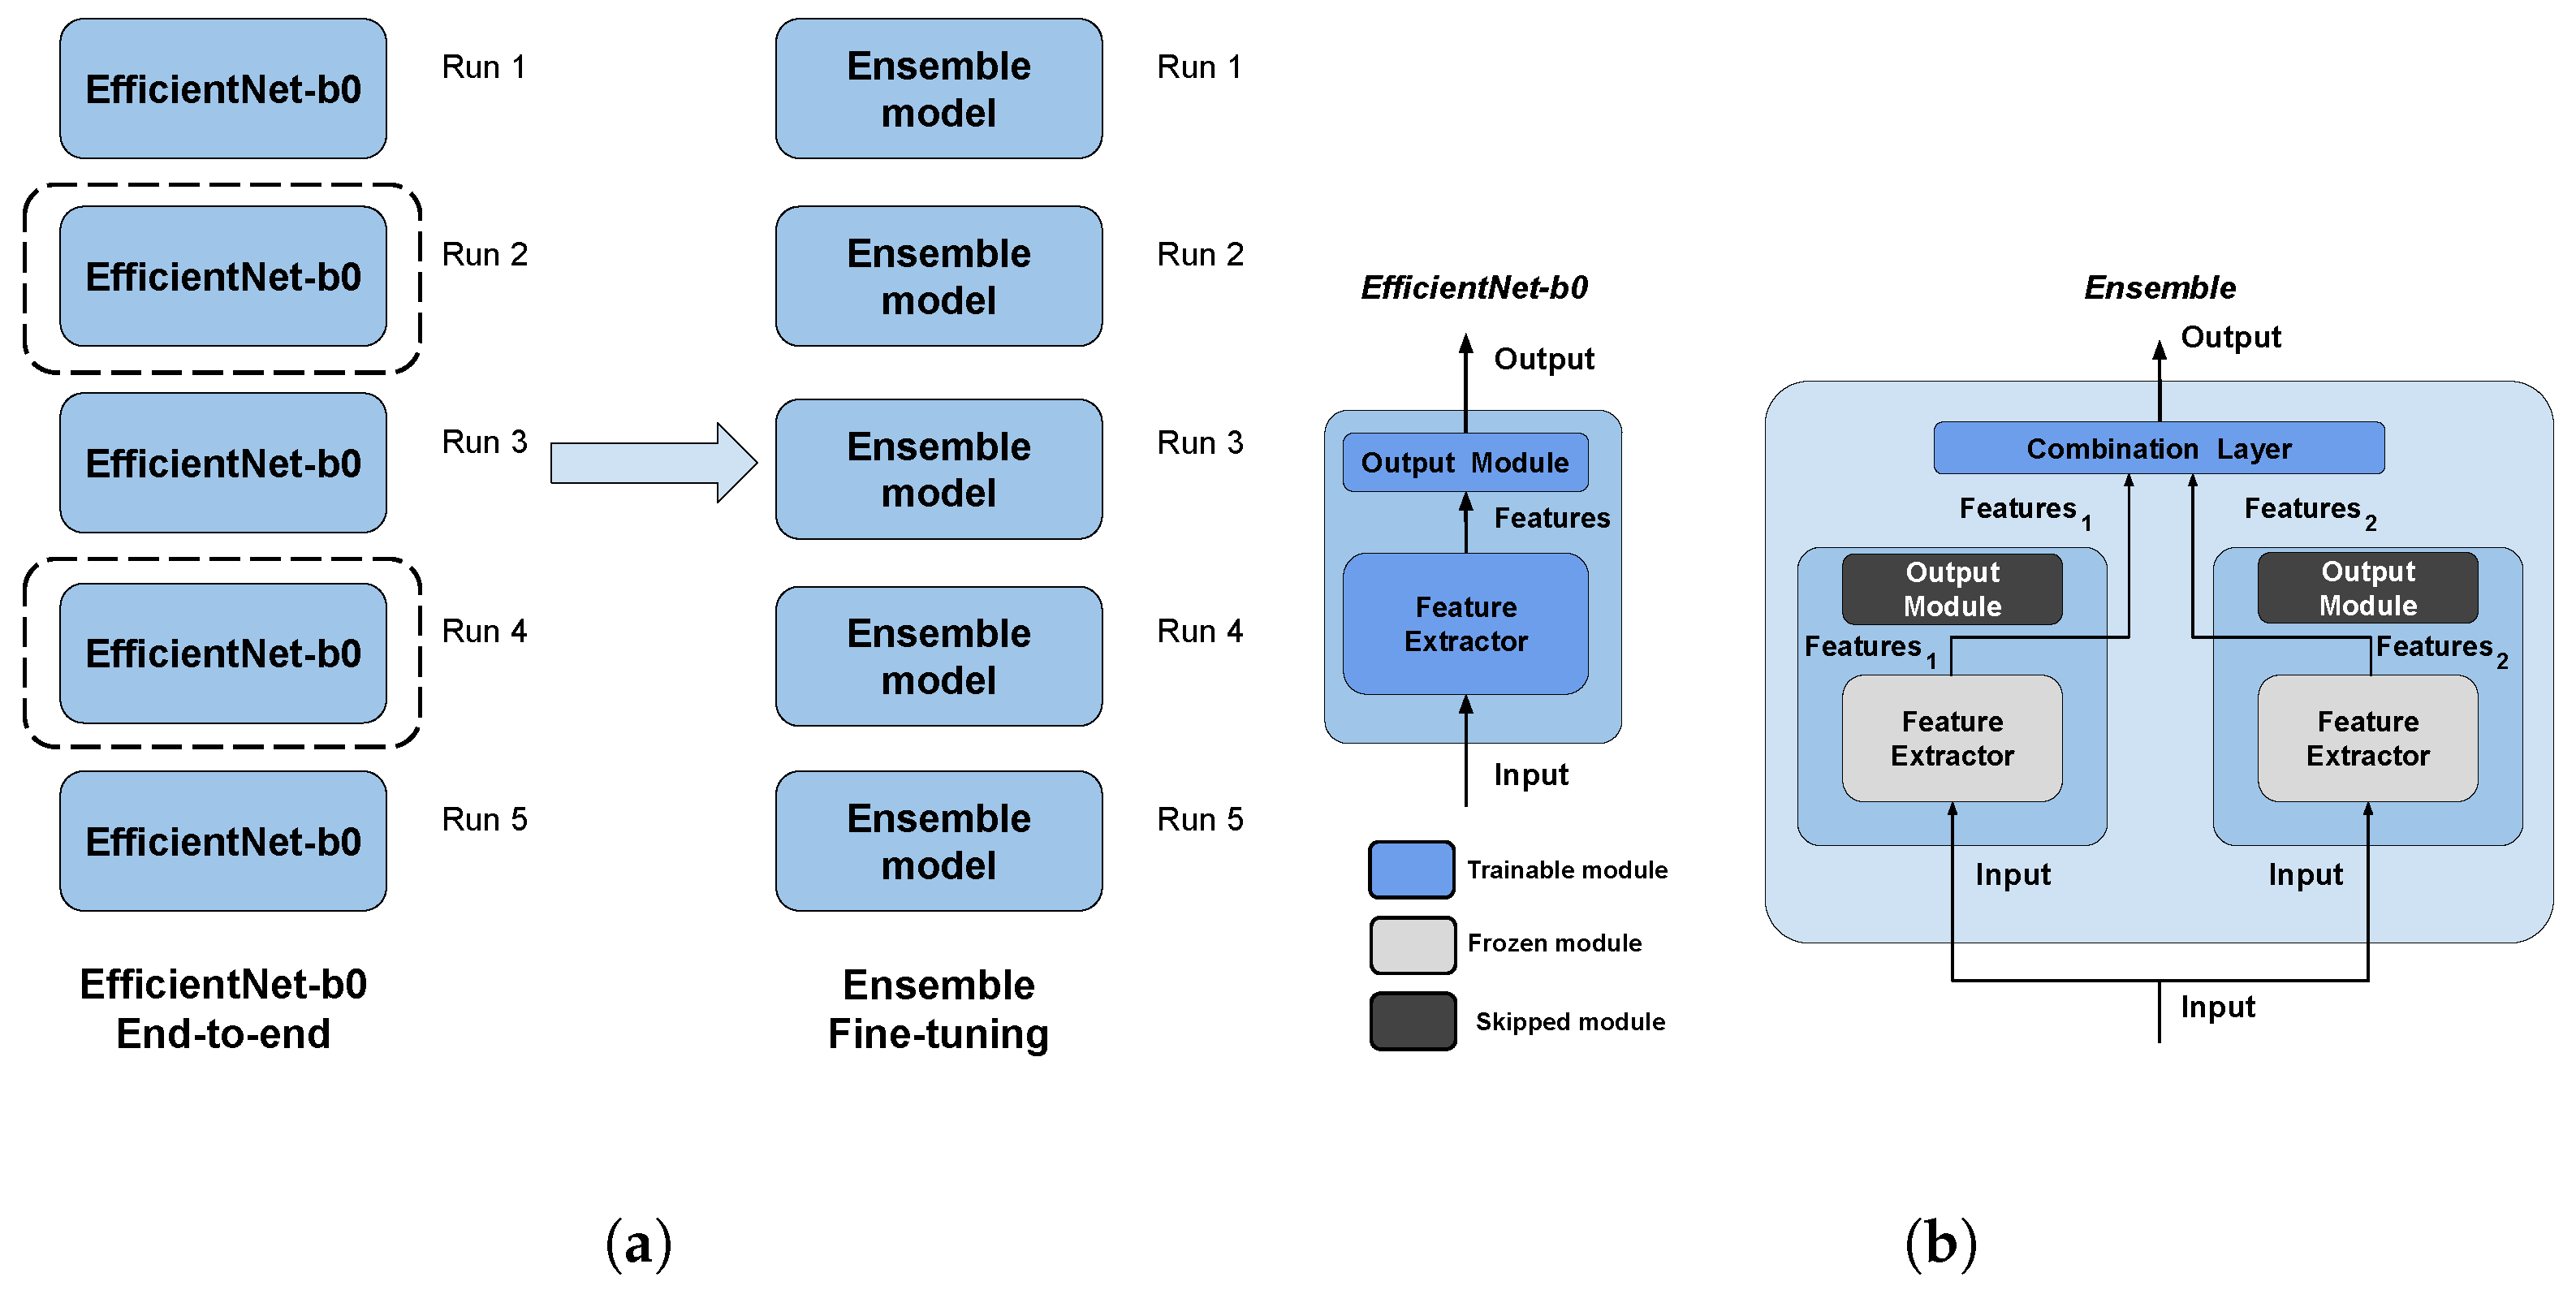
Figure 2.
The pipeline and the architectures used in this work. The pipeline (a) is made by two main steps: first, end-to-end EfficienNet-b0 training, then ensemble fine-tuning using the best two models (surrounded by a dashed line) of the previous step as weak models. The architectures (b) used are EfficientNet-b0 for end-to-end training, and the ensemble is performed by using a trainable combination layer on the features of the weak models (dark-filled output modules are skipped); moreover, training computational complexity is reduced by freezing the parameters of weak models (light gray filled modules). Both validation steps perform runs with five different seeds (i.e., modules initialization). (a) Validation pipeline. (b) Architectures.
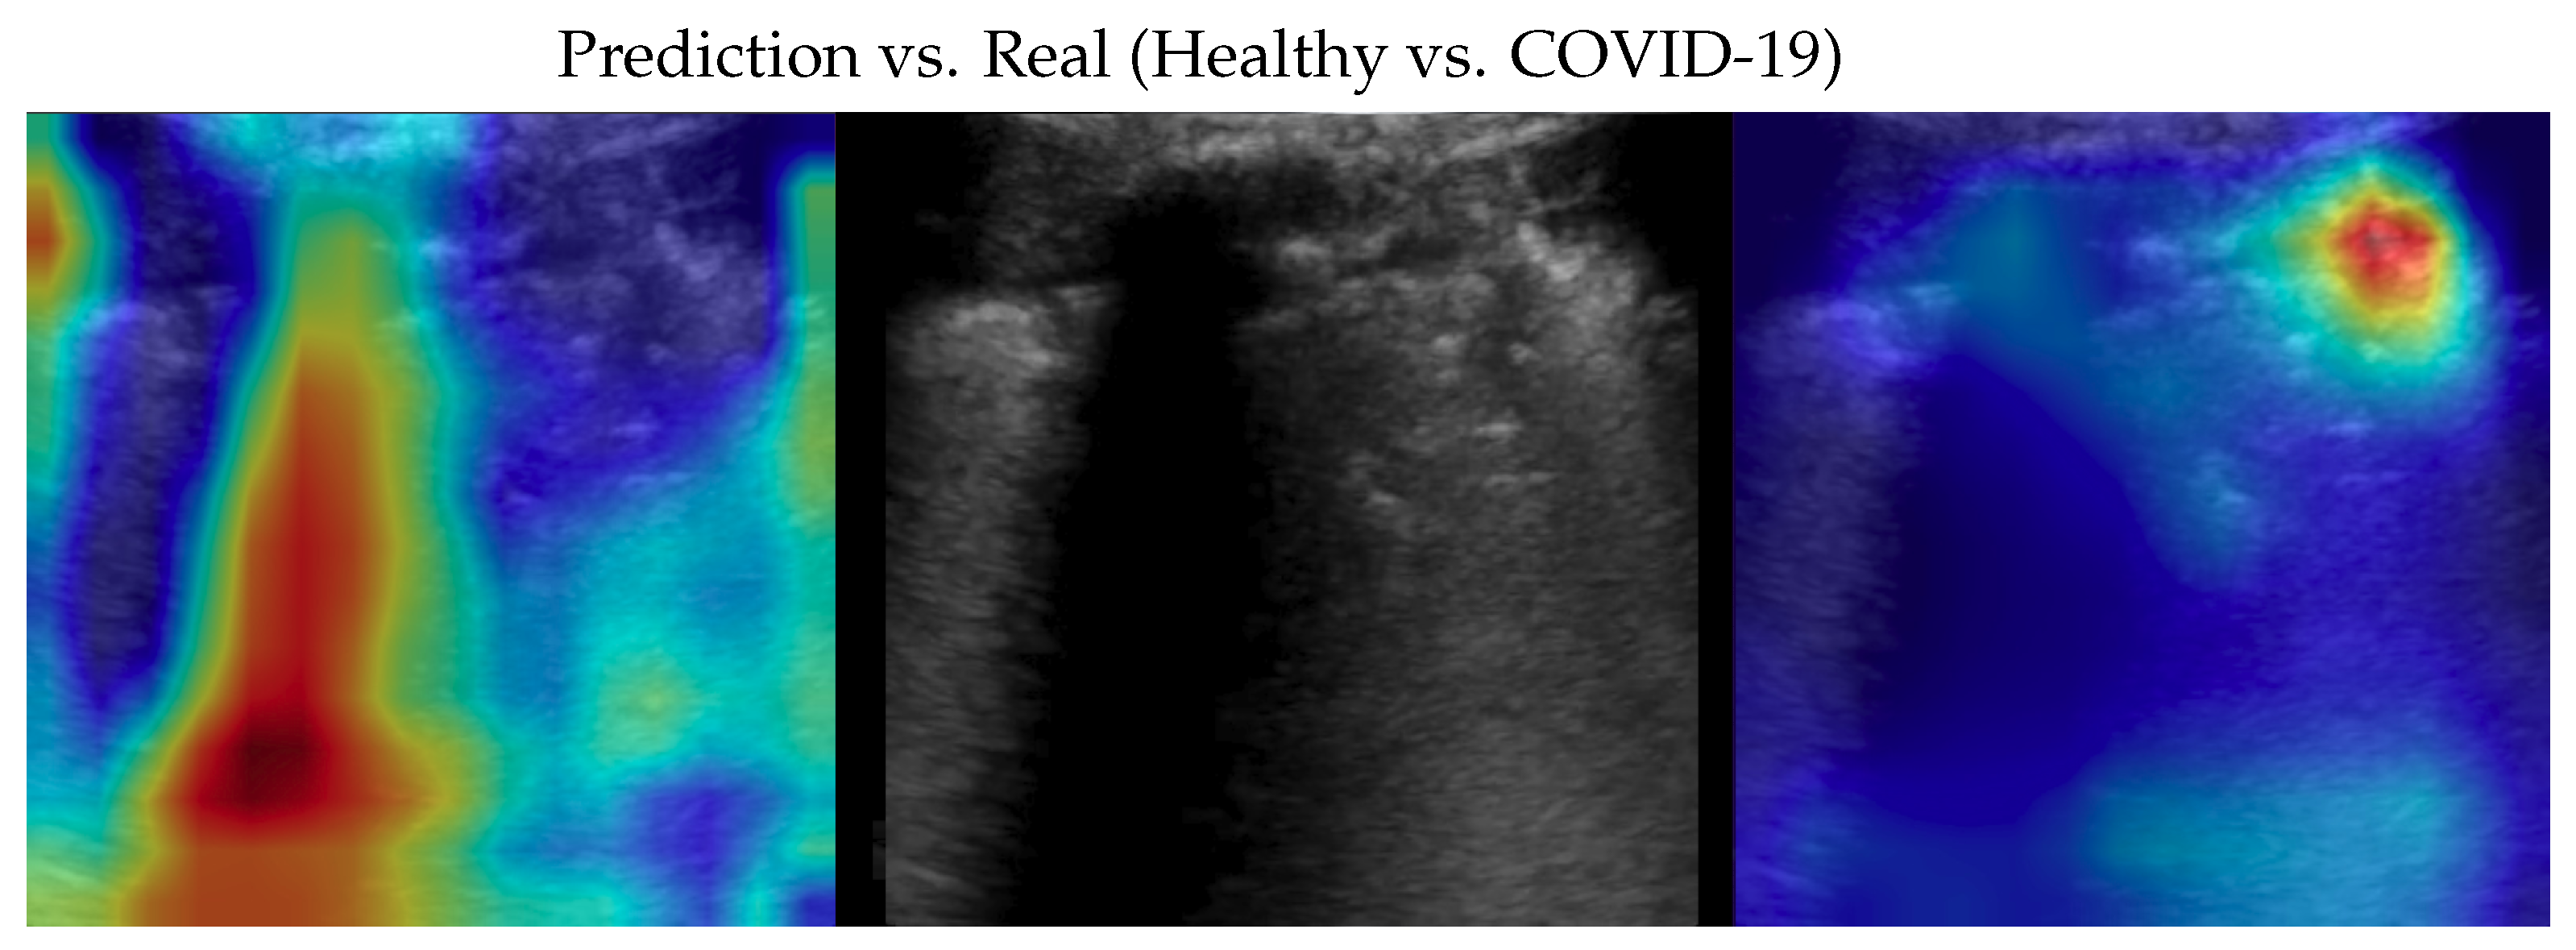
Figure 4.
Classifications of a COVID-19 image: in the middle, the input image; on the left, the focus of a wrong classification as healthy; on the right, the focus of the correct classification obtained by the classifier achieving 100% accuracy. Red (higher) to blue (lower) scale.
Figure 4.
Classifications of a COVID-19 image: in the middle, the input image; on the left, the focus of a wrong classification as healthy; on the right, the focus of the correct classification obtained by the classifier achieving 100% accuracy. Red (higher) to blue (lower) scale.
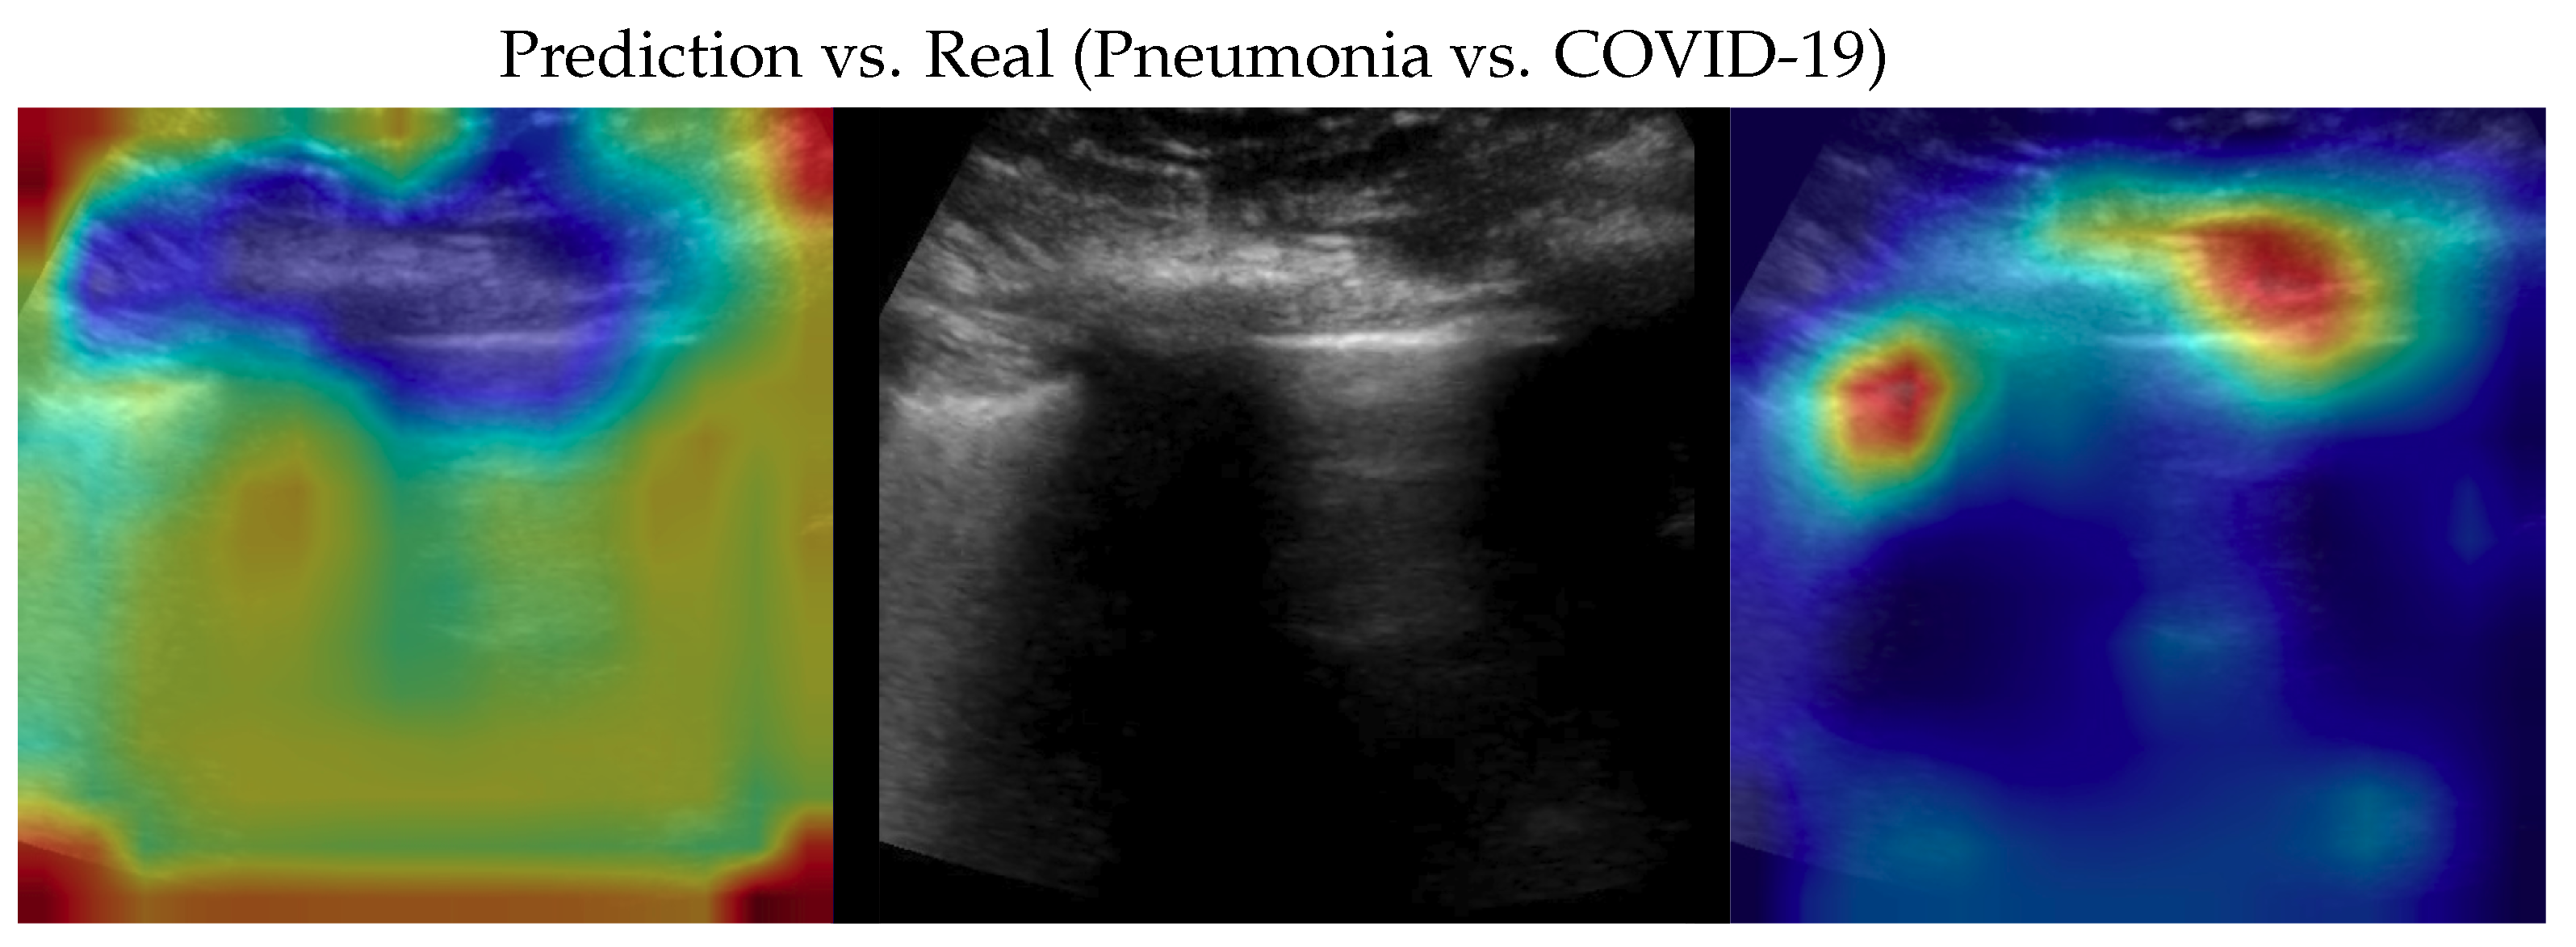
Figure 5.
Classification of a COVID-19 image: in the middle, the input image; on the left, the focus of a wrong classification as pneumonia; on the right, the focus of the correct classification obtained by the classifier achieving 100% accuracy. Red (higher) to blue (lower) scale.
Figure 5.
Classification of a COVID-19 image: in the middle, the input image; on the left, the focus of a wrong classification as pneumonia; on the right, the focus of the correct classification obtained by the classifier achieving 100% accuracy. Red (higher) to blue (lower) scale.
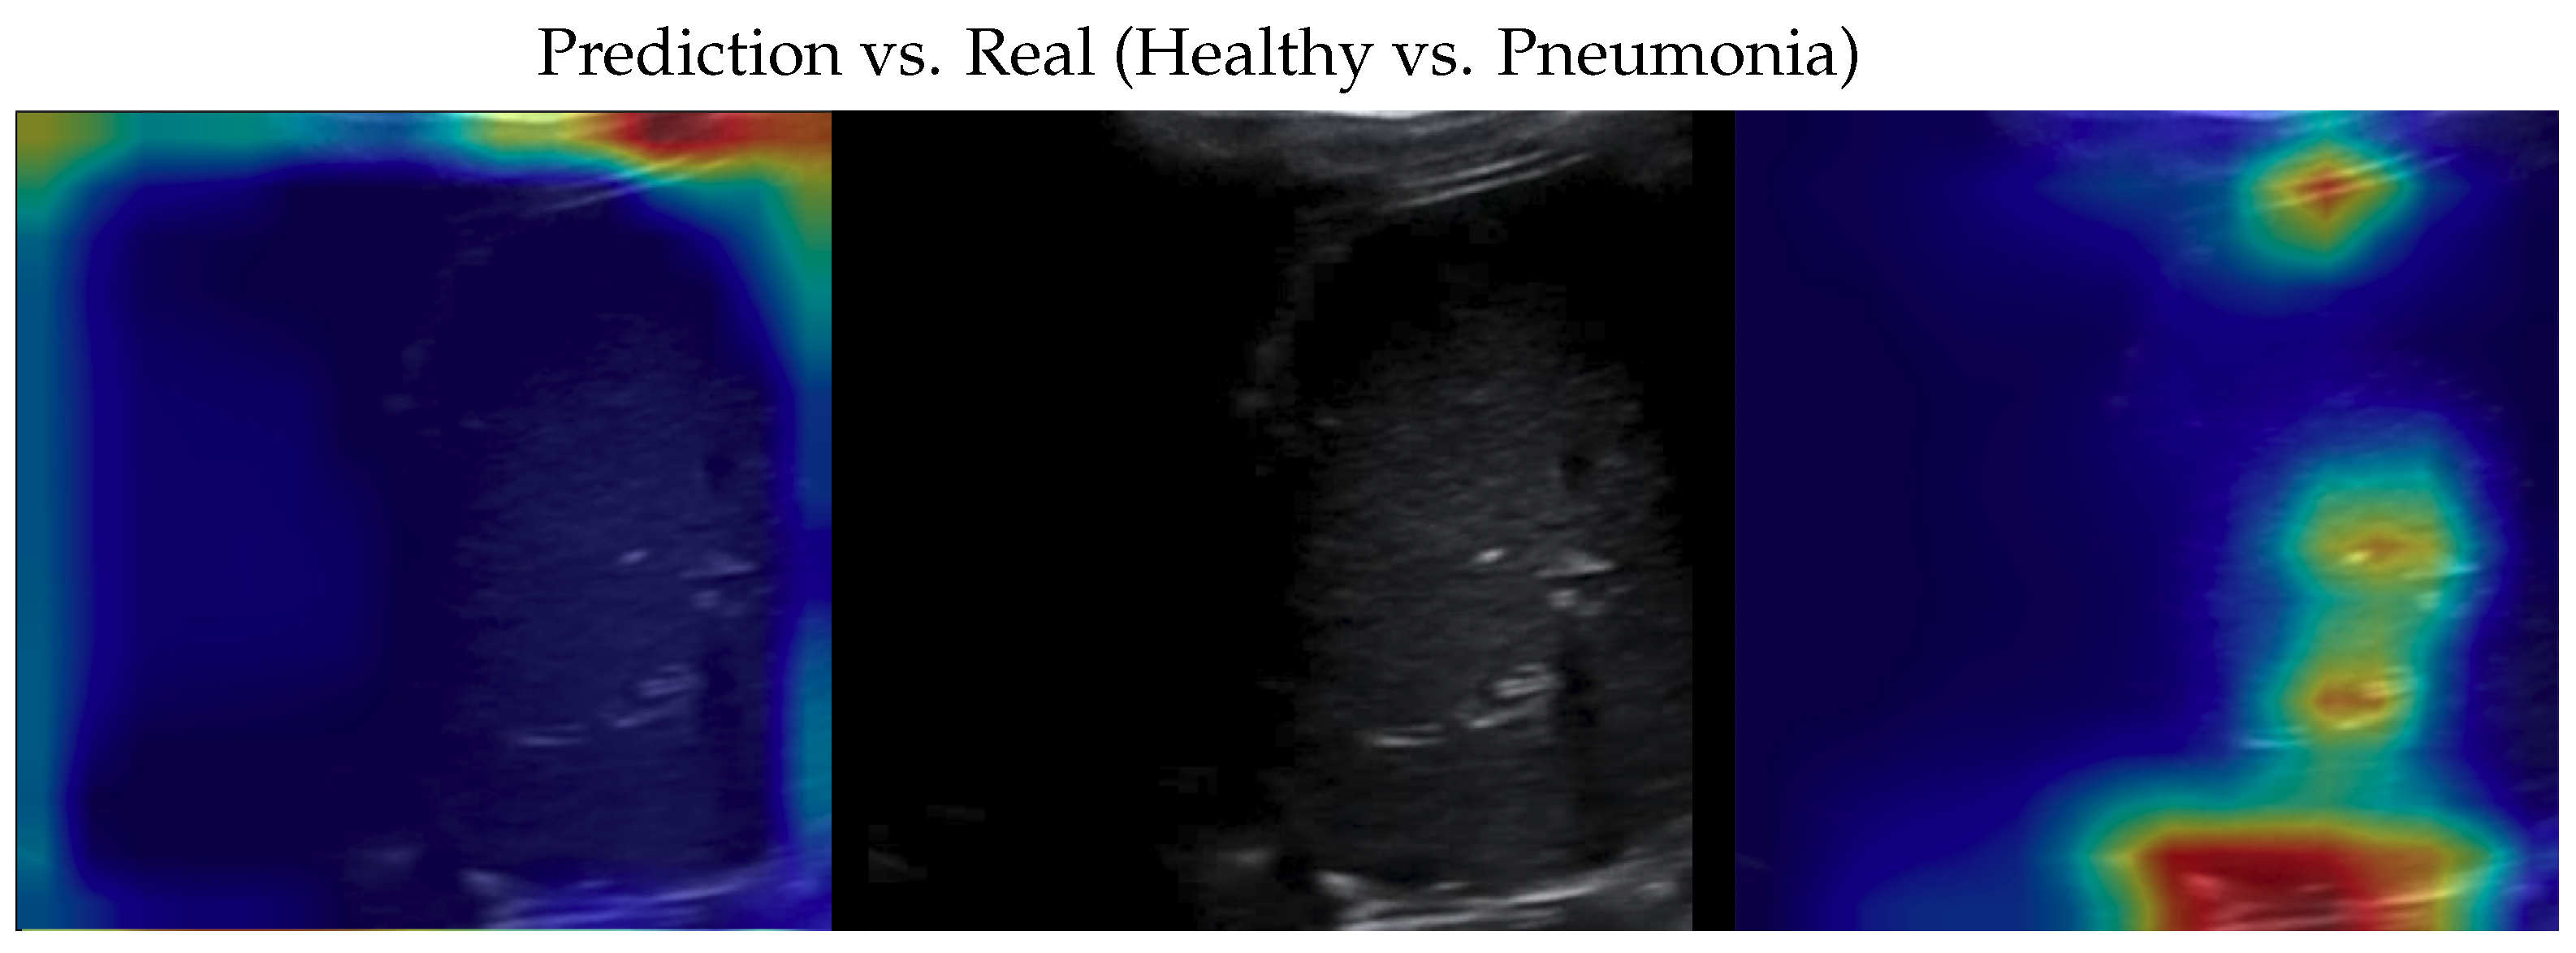
Figure 6.
Classification of a pneumonia image: in the middle, the input image; on the left, the focus of a wrong classification as healthy; on the right, the focus of the correct classification obtained by the classifier achieving 100% accuracy. Red (higher) to blue (lower) scale.
Figure 6.
Classification of a pneumonia image: in the middle, the input image; on the left, the focus of a wrong classification as healthy; on the right, the focus of the correct classification obtained by the classifier achieving 100% accuracy. Red (higher) to blue (lower) scale.
Figure 7.
Classification of a pneumonia image: in the middle, the input image; on the left, the focus of a wrong classification as COVID-19; on the right, the focus of the correct classification obtained by the classifier achieving 100% accuracy. Red (higher) to blue (lower) scale.
Figure 7.
Classification of a pneumonia image: in the middle, the input image; on the left, the focus of a wrong classification as COVID-19; on the right, the focus of the correct classification obtained by the classifier achieving 100% accuracy. Red (higher) to blue (lower) scale.
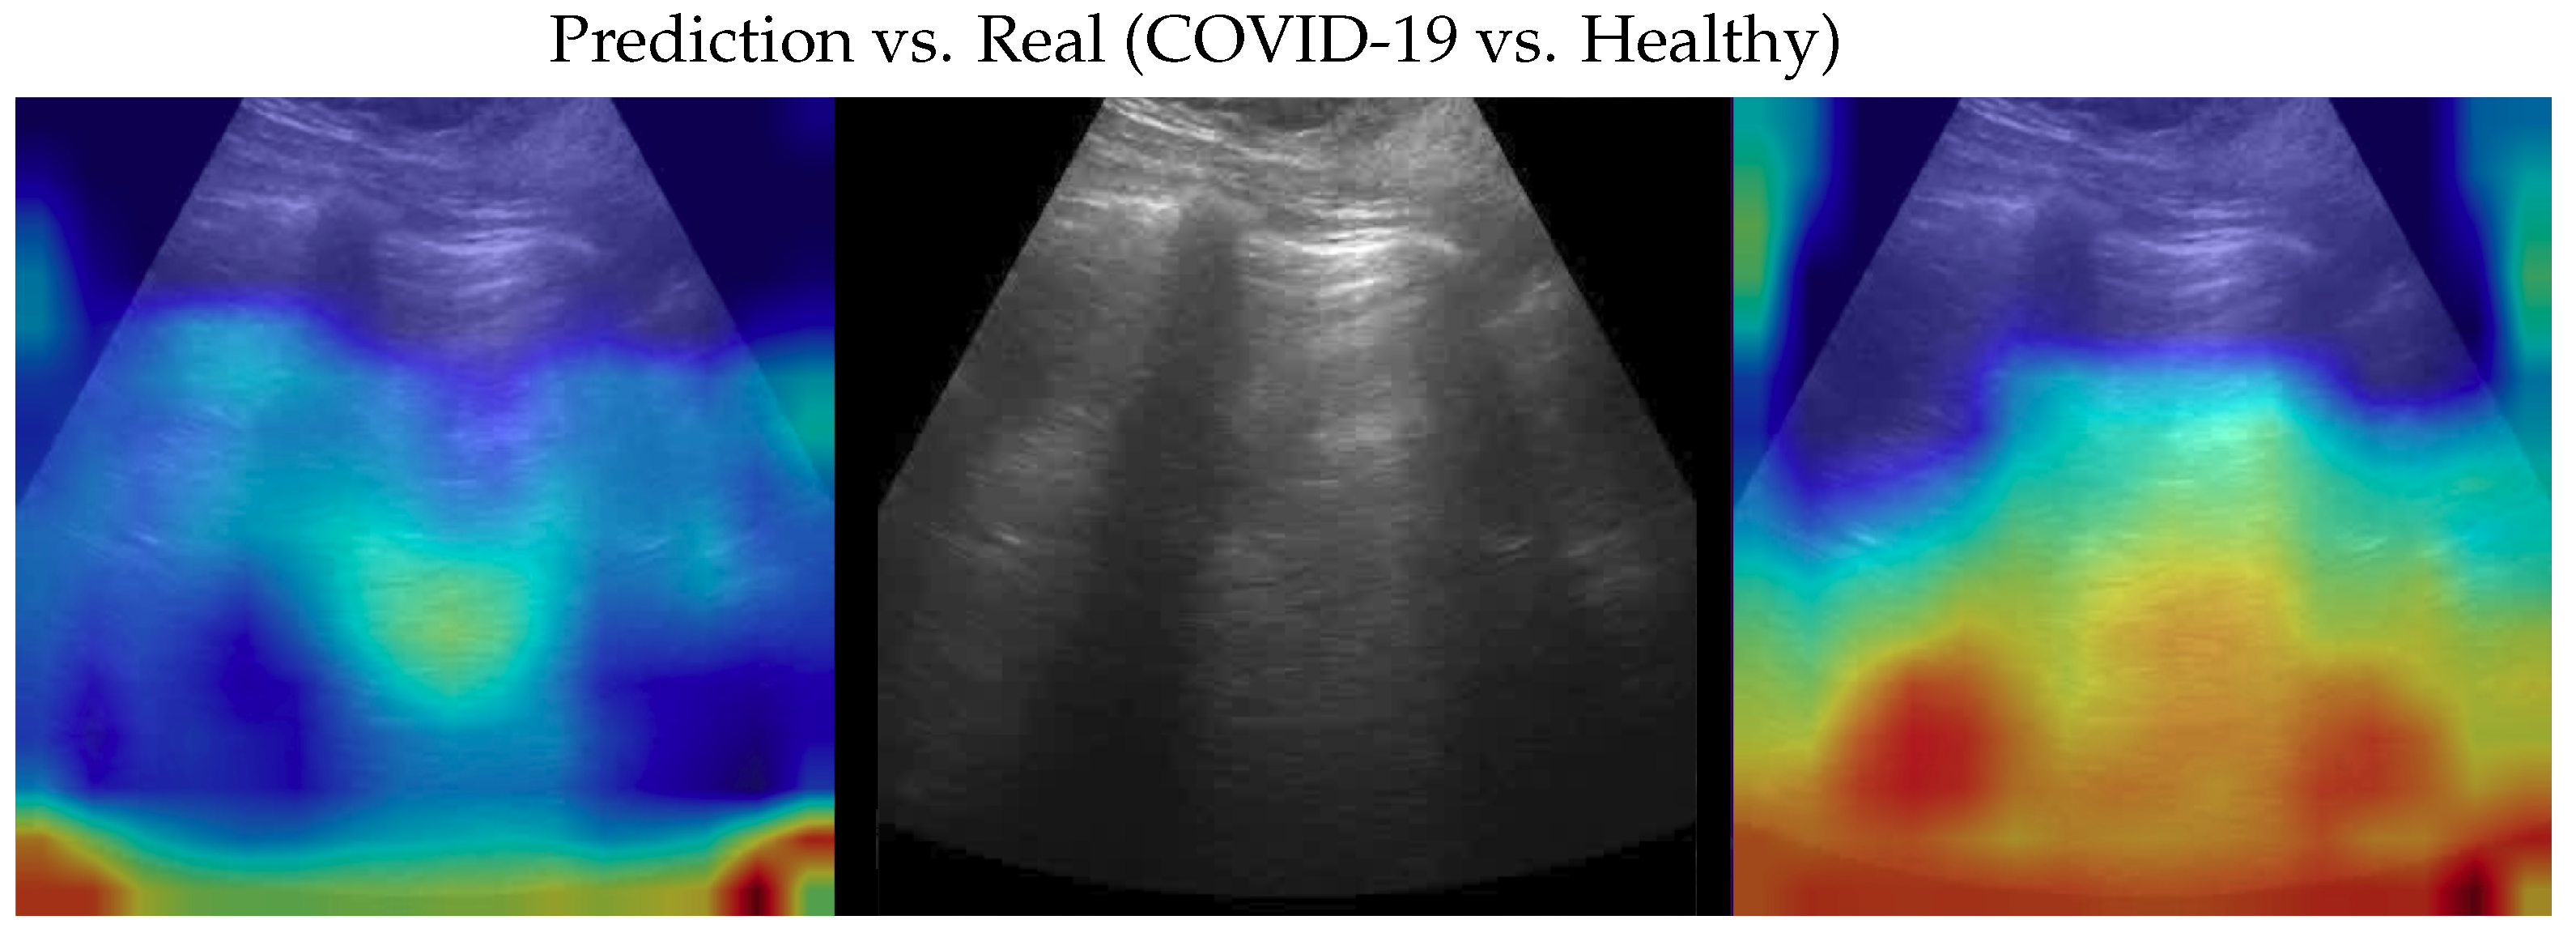
Figure 8.
Classification of a healthy image: in the middle, the input image; on the left, the focus of a wrong classification as COVID-19; on the right, the focus of the correct classification obtained by the classifier achieving 100% accuracy. Red (higher) to blue (lower) scale.
Figure 8.
Classification of a healthy image: in the middle, the input image; on the left, the focus of a wrong classification as COVID-19; on the right, the focus of the correct classification obtained by the classifier achieving 100% accuracy. Red (higher) to blue (lower) scale.
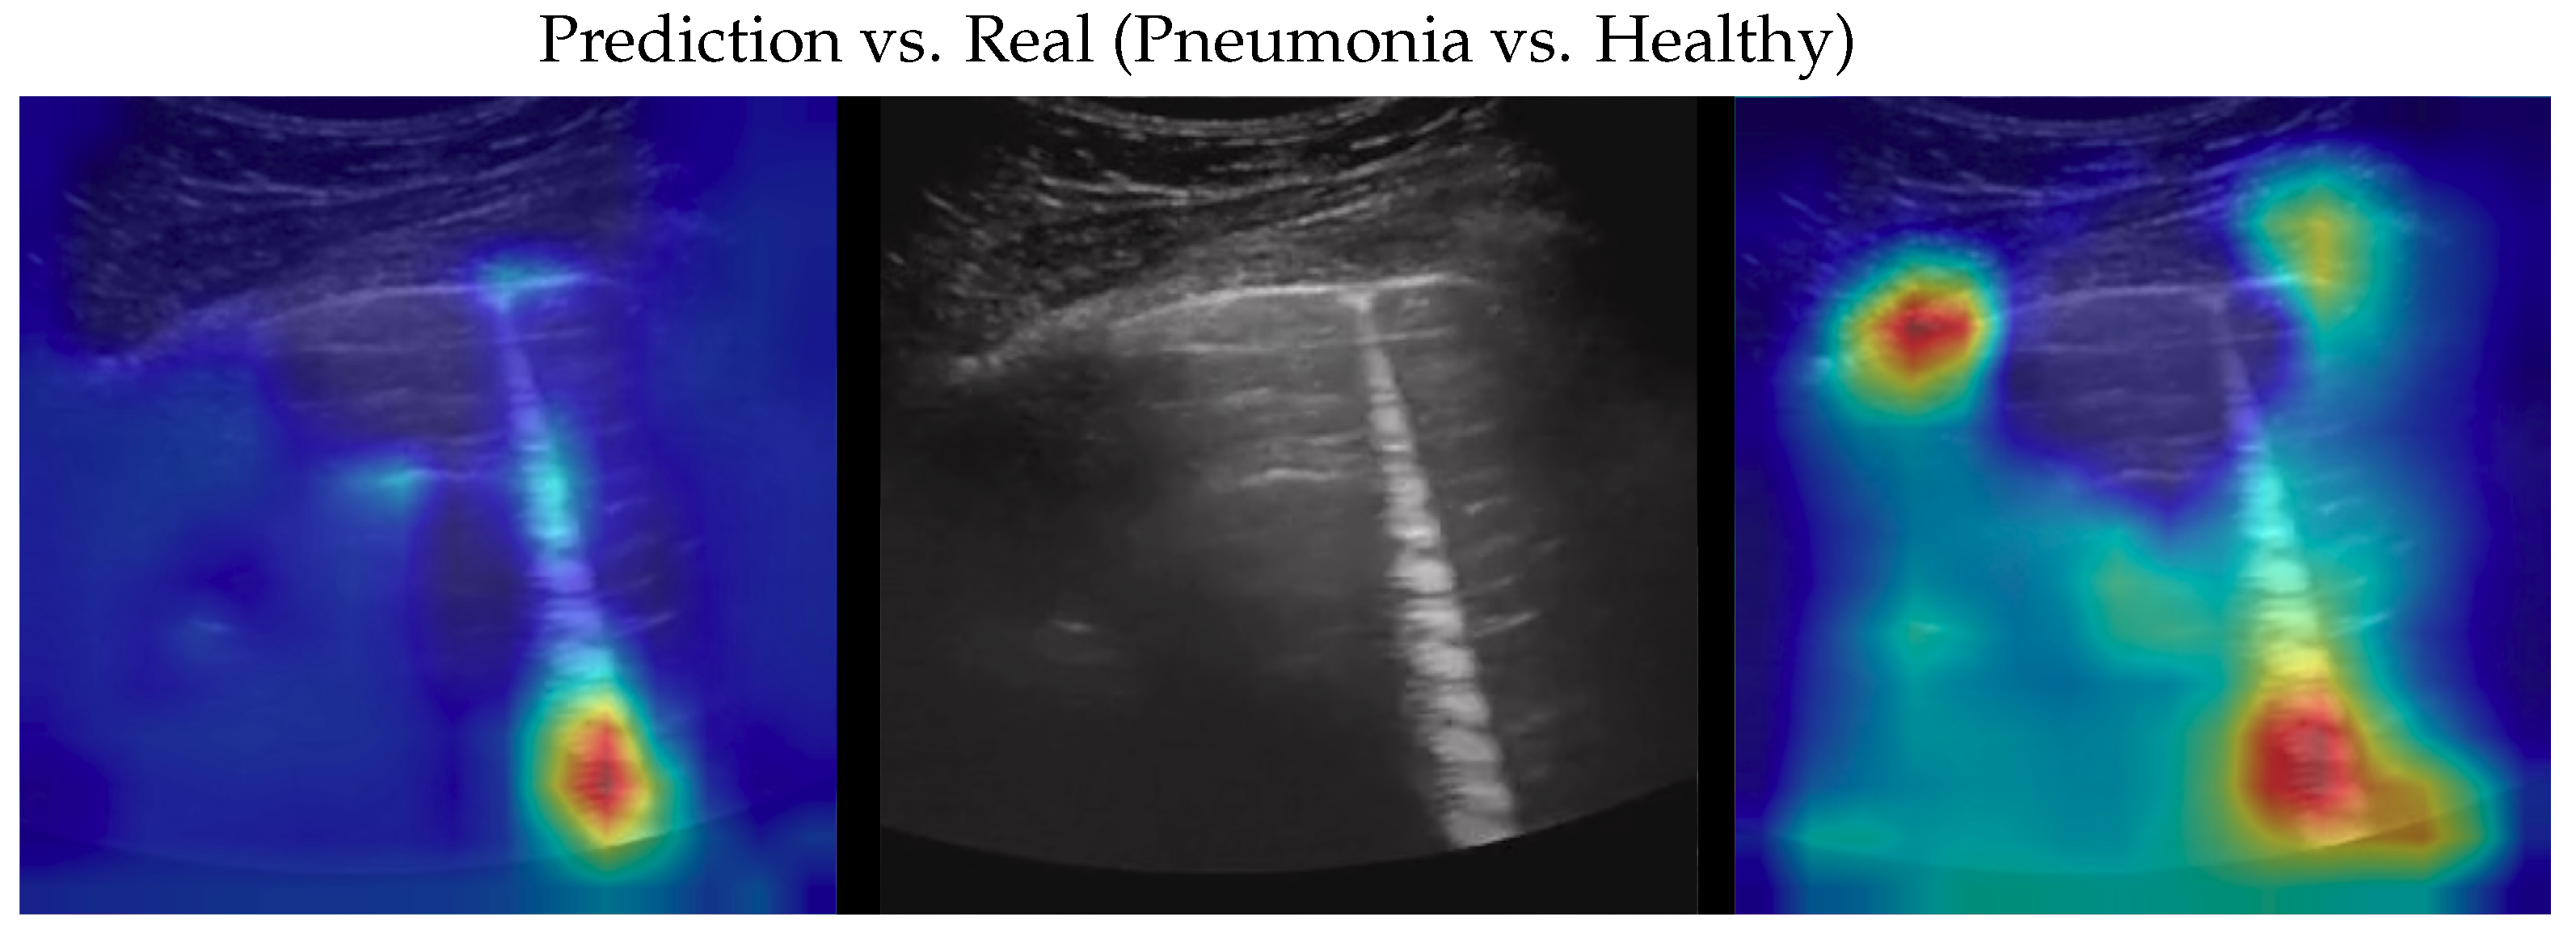
Figure 9.
Classification of a healthy image: in the middle, the input image; on the left, the focus of a wrong classification as pneumonia; on the right, the focus of the correct classification obtained by the classifier achieving 100% accuracy. Red (higher) to blue (lower) scale.
Figure 9.
Classification of a healthy image: in the middle, the input image; on the left, the focus of a wrong classification as pneumonia; on the right, the focus of the correct classification obtained by the classifier achieving 100% accuracy. Red (higher) to blue (lower) scale.
Table 1.
Dataset description with the number of videos and the corresponding number of frames for each class.
Table 1.
Dataset description with the number of videos and the corresponding number of frames for each class.
| Class | Videos | Frames | Total Frames |
|---|
| COVID-19 | 70 | 22 | 1024 |
| Pneumonia | 51 | 22 | 704 |
| Healthy | 75 | 15 | 1326 |
Table 2.
Evolution of the state-of-the-art on the ImageNet classification task. As can be seen, after EfficientNet, the complexity grows exponentially; with respect to the accuracy improvement, the same trend can be noticed on other state-of-the-art datasets (e.g., CIFAR, MNIST). N.B. Only some architectures providing relevant improvements are shown in this table.
| Model | Year | Accuracy | #Parameters | #FLOPs |
|---|
| AlexNet | 2012 | 63.3% | 60 M | 0.7 G |
| InceptionV3 | 2015 | 78.8% | 24 M | 6 G |
| ResNeXt-101 64 × 4 | 2016 | 80.9% | 84 M | 31 G |
| EfficientNet-b7 | 2019 | 84.3% | 67 M | 37 G |
| Swin-L | 2021 | 87.3% | 197 M | 104 G |
| NFNet-F4+ | 2021 | 89.2% | 527 M | 367 G |
| ViT-G/14 | 2021 | 90.4% | 1843 M | 2859 G |
| ViT-e | 2022 | 90.9% | 3900 M | 1980 G |
| CoAtNet-7 (BASIC-L) | 2023 | 91.1% | 2440 M | 2586 G |
Table 3.
Performances of EfficientNet family on ImageNet classification task.
Table 3.
Performances of EfficientNet family on ImageNet classification task.
| Model | Accuracy | #Parameters | #FLOPs |
|---|
| EfficientNet-b0 | 77.1% | 5.3 M | 0.39 G |
| EfficientNet-b1 | 79.1% | 7.8 M | 0.70 G |
| EfficientNet-b2 | 80.1% | 9.2 M | 1.00 G |
| EfficientNet-b3 | 81.6% | 12 M | 1.80 G |
| EfficientNet-b4 | 82.9% | 19 M | 4.20 G |
| EfficientNet-b5 | 83.6% | 30 M | 9.90 G |
| EfficientNet-b6 | 84.0% | 43 M | 19.0 G |
| EfficientNet-b7 | 84.3% | 67 M | 37.0 G |
Table 4.
Fold 1 results—this fold seems to be the hardest one, having end-to-end run with the lowest mean accuracies. With the ensemble fine-tuning, similar to the rest of the folds, 100% accuracy is reached.
Table 4.
Fold 1 results—this fold seems to be the hardest one, having end-to-end run with the lowest mean accuracies. With the ensemble fine-tuning, similar to the rest of the folds, 100% accuracy is reached.
| Weak | Ensemble |
|---|
| Test | Valid | Train | Test | Valid | Train |
|---|
| 0.982456 | 1.000000 | 0.995536 | 1.000000 | 1.000000 | 1.000000 |
| 0.964912 | 0.927273 | 0.959821 | 1.000000 | 1.000000 | 1.000000 |
| 0.964912 | 0.927273 | 0.941964 | 1.000000 | 1.000000 | 1.000000 |
| 0.964912 | 0.927273 | 0.939732 | 1.000000 | 1.000000 | 1.000000 |
| 0.964912 | 0.909091 | 0.939732 | 1.000000 | 1.000000 | 1.000000 |
Table 5.
Fold 2 results—this fold seems to be the easiest one, having 100% on all end-to-end runs; results are also confirmed by the ensemble (runs on ensemble were performed just for completeness).
Table 5.
Fold 2 results—this fold seems to be the easiest one, having 100% on all end-to-end runs; results are also confirmed by the ensemble (runs on ensemble were performed just for completeness).
| Weak | Ensemble |
|---|
| Test | Valid | Train | Test | Valid | Train |
|---|
| 1.000000 | 1.000000 | 1.000000 | 1.000000 | 1.000000 | 1.000000 |
| 1.000000 | 1.000000 | 1.000000 | 1.000000 | 1.000000 | 1.000000 |
| 1.000000 | 1.000000 | 1.000000 | 1.000000 | 1.000000 | 1.000000 |
| 1.000000 | 1.000000 | 1.000000 | 1.000000 | 1.000000 | 1.000000 |
| 1.000000 | 1.000000 | 1.000000 | 1.000000 | 1.000000 | 1.000000 |
Table 6.
Fold 3 results—results on this fold are unusual since the best end-to-end run obtains 100% on test and valid, but not on train, subsets. Ensemble fine-tuning confirmed reaching 100%.
Table 6.
Fold 3 results—results on this fold are unusual since the best end-to-end run obtains 100% on test and valid, but not on train, subsets. Ensemble fine-tuning confirmed reaching 100%.
| Weak | Ensemble |
|---|
| Test | Valid | Train | Test | Valid | Train |
|---|
| 1.000000 | 1.000000 | 0.995402 | 1.000000 | 1.000000 | 1.000000 |
| 1.000000 | 0.981481 | 0.997701 | 1.000000 | 1.000000 | 1.000000 |
| 1.000000 | 0.981481 | 0.995402 | 1.000000 | 1.000000 | 1.000000 |
| 1.000000 | 0.981481 | 0.986207 | 1.000000 | 1.000000 | 1.000000 |
| 1.000000 | 0.962963 | 0.997701 | 1.000000 | 1.000000 | 1.000000 |
Table 7.
Fold 4 results—results on this fold are “average” since some end-to-end runs obtain 100% accuracy on all subsets while the ensemble confirms 100% on all runs.
Table 7.
Fold 4 results—results on this fold are “average” since some end-to-end runs obtain 100% accuracy on all subsets while the ensemble confirms 100% on all runs.
| Weak | Ensemble |
|---|
| Test | Valid | Train | Test | Valid | Train |
|---|
| 1.000000 | 1.000000 | 1.000000 | 1.000000 | 1.000000 | 1.000000 |
| 1.000000 | 1.000000 | 1.000000 | 1.000000 | 1.000000 | 1.000000 |
| 1.000000 | 0.984127 | 0.996047 | 1.000000 | 1.000000 | 1.000000 |
| 0.984375 | 1.000000 | 0.998024 | 1.000000 | 1.000000 | 1.000000 |
| 0.984375 | 1.000000 | 0.996047 | 1.000000 | 1.000000 | 1.000000 |
Table 8.
Fold 5 results—results on this fold are “average” since some end-to-end runs obtain 100% accuracy on all subsets while the ensemble confirms 100% on all runs.
Table 8.
Fold 5 results—results on this fold are “average” since some end-to-end runs obtain 100% accuracy on all subsets while the ensemble confirms 100% on all runs.
| Weak | Ensemble |
|---|
| Test | Valid | Train | Test | Valid | Train |
|---|
| 1.000000 | 1.000000 | 1.000000 | 1.000000 | 1.000000 | 1.000000 |
| 1.000000 | 1.000000 | 1.000000 | 1.000000 | 1.000000 | 1.000000 |
| 1.000000 | 1.000000 | 0.995789 | 1.000000 | 1.000000 | 1.000000 |
| 1.000000 | 1.000000 | 0.989474 | 1.000000 | 1.000000 | 1.000000 |
| 1.000000 | 1.000000 | 0.987368 | 1.000000 | 1.000000 | 1.000000 |
Table 9.
End-to-end weak models training mean accuracies on every subset for each fold.
Table 9.
End-to-end weak models training mean accuracies on every subset for each fold.
| | Test | Valid | Train |
|---|
| Fold 1 | 0.968 ± 0.007 | 0.938 ± 0.032 | 0.955 ± 0.021 |
| Fold 2 | 1.000 ± 0.000 | 1.000 ± 0.000 | 1.000 ± 0.000 |
| Fold 3 | 1.000 ± 0.000 | 0.981 ± 0.012 | 0.994 ± 0.004 |
| Fold 4 | 0.993 ± 0.008 | 0.996 ± 0.006 | 0.998 ± 0.002 |
| Fold 5 | 1.000 ± 0.000 | 1.000 ± 0.000 | 0.994 ± 0.005 |
| Average | 0.992 ± 0.012 | 0.983 ± 0.024 | 0.988 ± 0.017 |
Table 10.
Comparisons, with metrics for each class, of the proposed model with the SOTA. Accuracy in brackets, if any, refers to balanced accuracy. Values are reported with the same significant digits as reported in the original papers.
Table 10.
Comparisons, with metrics for each class, of the proposed model with the SOTA. Accuracy in brackets, if any, refers to balanced accuracy. Values are reported with the same significant digits as reported in the original papers.
| | Class | Recall | Precision | F1-Score |
|---|
| POCOVID-Net [27] | | | | |
| Acc.: 82.1% | COVID-19 | 0.881 ± 0.108 | 0.846 ± 0.068 | 0.863 ± 0.083 |
| #Param.: 14.7 M | Pneumonia | 0.915 ± 0.031 | 0.939 ± 0.042 | 0.927 ± 0.028 |
| FLOPs: 30.7 G | Healthy | 0.519 ± 0.029 | 0.562 ± 0.082 | 0.540 ± 0.043 |
| MINICOVID-Net [31] | | | | |
| Acc.: 82.7% | COVID-19 | 0.918 ± 0.096 | 0.819 ± 0.039 | 0.866 ± 0.056 |
| #Param.: 3.4 M | Pneumonia | 0.903 ± 0.053 | 0.824 ± 0.045 | 0.862 ± 0.049 |
| FLOPs: 1.15 G | Healthy | 0.447 ± 0.011 | 0.623 ± 0.095 | 0.521 ± 0.010 |
| VGG-16 [1] | | | | |
| Acc.: 87.8% (87.1%) | COVID-19 | 0.88 ± 0.07 | 0.90 ± 0.07 | 0.89 ± 0.06 |
| #Param.: 14.7 M | Pneumonia | 0.90 ± 0.11 | 0.81 ± 0.08 | 0.85 ± 0.08 |
| FLOPs: 15.3 G | Healthy | 0.83 ± 0.11 | 0.90 ± 0.06 | 0.86 ± 0.08 |
| InceptionV3 [25] | | | | |
| Acc.: 89.1% (89.3%) | COVID-19 | 0.864 ± 0.036 | 0.901 ± 0.031 | 0.880 ± 0.030 |
| #Param.: 23.9 M | Pneumonia | 0.908 ± 0.025 | 0.842 ± 0.037 | 0.871 ± 0.025 |
| FLOPs: 6 G | Healthy | 0.907 ± 0.026 | 0.918 ± 0.021 | 0.911 ± 0.021 |
| DenseNet-201 [26] | | | | |
| Acc.: 90.4% | COVID-19 | 0.892 | 0.918 | 0.905 |
| #Param.: 20 M | Pneumonia | 0.903 | 0.610 | 0.728 |
| FLOPs: 4.29 G | Healthy | 0.850 | 0.842 | 0.846 |
| Light Transformer [33] | | | | |
| Acc.: 93.4% | COVID-19 | 0.958 ± 0.025 | 0.958 ± 0.012 | 0.951 ± 0.017 |
| #Param.: 0.3 M | Pneumonia | 0.948 ± 0.013 | 0.951 ± 0.038 | 0.949 ± 0.020 |
| FLOPs: 1 G a | Healthy | 0.877 ± 0.034 | 0.912 ± 0.037 | 0.894 ± 0.036 |
| Weak model (our) | | | | |
| Acc.: 98.7% (98.3%) | COVID-19 | 0.984 ± 0.004 | 0.993 ± 0.004 | 0.990 ± 0.004 |
| #Param.: 5 M | Pneumonia | 0.997 ± 0.005 | 0.991 ± 0.006 | 0.991 ± 0.007 |
| FLOPs: 0.39 G | Healthy | 0.999 ± 0.003 | 0.993 ± 0.003 | 0.995 ± 0.004 |
| Ensemble (our) | | | | |
| Acc.: 100% (100%) | COVID-19 | 1.000 ± 0.000 | 1.000 ± 0.000 | 1.000 ± 0.000 |
| #Param.: 10 M b | Pneumonia | 1.000 ± 0.000 | 1.000 ± 0.000 | 1.000 ± 0.000 |
| FLOPs: 0.78 G c | Healthy | 1.000 ± 0.000 | 1.000 ± 0.000 | 1.000 ± 0.000 |


 ,
, 


